Embed Size (px)
Citation preview
Pure appl. geophys. 156 (1999) 157–1710033–4553/99/010157–15 $ 1.50+0.20/0
3-D Prestack Kirchhoff Migration of the ISO89-3D Data Set
STEFAN BUSKE1,2
Abstract—This paper presents an overview of the results obtained from a 3-D prestack depthmigration of the ISO89-3D data set. The algorithm is implemented as a Kirchhoff-type migration, inwhich the migrated image is generated by weighted summation along diffraction surfaces through theshot record section. The diffraction surfaces are computed by a 3-D finite difference solution of theeikonal equation. A 3-D macro-velocity model derived mainly from wide-angle tomographic inversionserved as input for the travel-time calculations. The results of the migration are presented as slicesthrough a volume covering an area of 21 km×21 km in the horizontal and 15 km in the verticaldirection, centered around the KTB drill hole. In these slices the continuation of the FranconianLineament or SE1 reflector, respectively, can be identified over most of the survey area as a northeastdipping reflector plane. Its signature appears partly curved and discontinuous and with different strengthof reflection down to a maximum depth of 9 km. About 5 km to the south-southeast of the KTB drillhole the uppermost top reflection of the Erbendorf body (EB) can be recognized at approximately thesame depth. The slices clearly show its complicated internal structure consisting of several apparentlyseparated reflective parts. Moreover, the geometry and the shape of a few other subsurface structures aredescribed.
Key words: Crustal structure, deep seismic reflection, explosion seismology, 3-D Kirchhoff migra-tion.
Introduction
3-D prestack Kirchhoff migration is a leading edge technology in seismic dataprocessing. Its computational requirements regarding memory and CPU time areconsiderable. Nevertheless, it has proven to yield significant improvements inimaging complex structures, both in the exploration industry and in the case ofdeep seismic reflection surveys (SIMON et al., 1996).The main task in the realization of a 3-D prestack Kirchhoff migration
algorithm is the computation of the diffraction surfaces along which the weightedsummation through the shot record sections is performed. This step requires thecalculation of the travel times from the source and every receiver location to every
1 Institute of Meteorology and Geophysics, Feldbergstr. 47, 60323 Frankfurt, Germany. E-mail:[email protected]
2 Now at Ensign Geophysics Limited, Brighton Road, Addlestone, Surrey KT15 1PU, UnitedKingdom. E-mail: [email protected]
Stefan Buske158 Pure appl. geophys.,
subsurface point within the volume to be migrated. With the help of modern finitedifference eikonal solvers this is feasible. Here the method of PODVIN andLECOMTE (1991) is used, which yields first-arrival travel times on a cubic grid fora given source location and a predefined velocity model. Details regarding theincorporation of the travel-time computation procedure into the migration al-gorithm as well as the parallel implementation and the required computing timescan be found in BUSKE (1999).This paper focuses on the results of the application of this prestack migration
technique to the ISO89-3D data set. As this data set has been the subject of manystudies, the following introductory remarks are kept short. Further information canbe found in the undermentioned references.
The ISO89-3D Data Set
O�er�iew
This data set was recorded in 1989 in the vicinity of the German ContinentalDeep Drill hole (KTB) as part of the program Integrated Seismics Oberpfalz (ISO)(DU� RBAUM et al., 1990, 1992). The field parameters and the shot-receiver setup ofthis 3-D survey have been described comprehensively in STILLER (1991). For clarityand for the definition of the coordinate axes, Figure 1 shows the shot and receiverlocations within the survey area of 21 km×21 km.About 3327 Vibroseis shots were carried out and a maximum of 7 seconds
recording time was used for the migration. All 3327 shot records were preprocessedseparately and for each shot record the whole volume (21 km×21 km×15 km)was migrated. Subsequently, a single final migrated image was generated bystacking of the absolute values of these individual migrated volumes.Examples of preprocessed shot records as well as comparisons with modeled
shot records computed for an analogous model can also be found in BUSKE (1999).
The Macro-�elocity Model and the Geological Setting
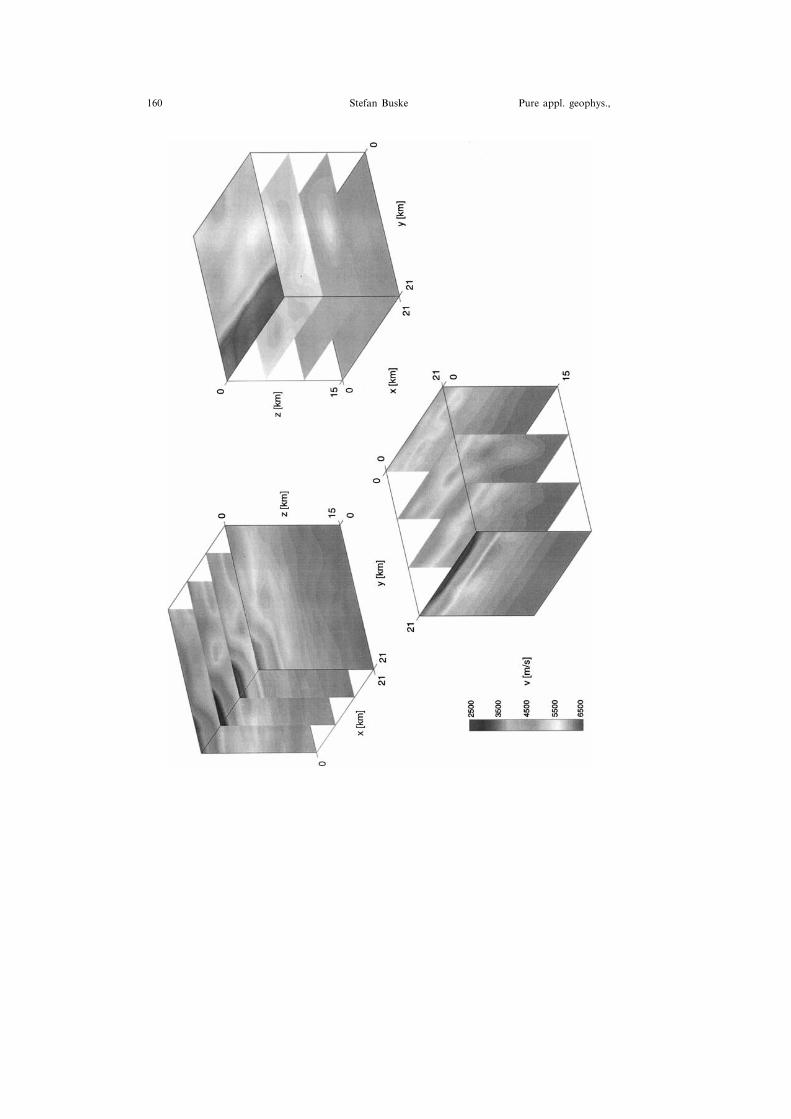
The 3-D interval velocity model used here was mainly obtained from tomo-graphic inversion of wide-angle reflection data (SCHWARZENBO� CK, 1993). Figure 2shows slices through this velocity model.The northeastern part, which belongs to the crystalline basement of the Bo-
hemian massif, consists mainly of gneissic-granitic rocks with P velocities of 5–6km/s up to shallow depths, whereas the southwestern part is composed of permo-mesozoic foreland sediments of the South German Platform with moderate veloc-ities of 3–4 km/s. Both parts are separated by a major crustal fault zone called the
3-D Prestack Kirchhoff Migration 159Vol. 156, 1999
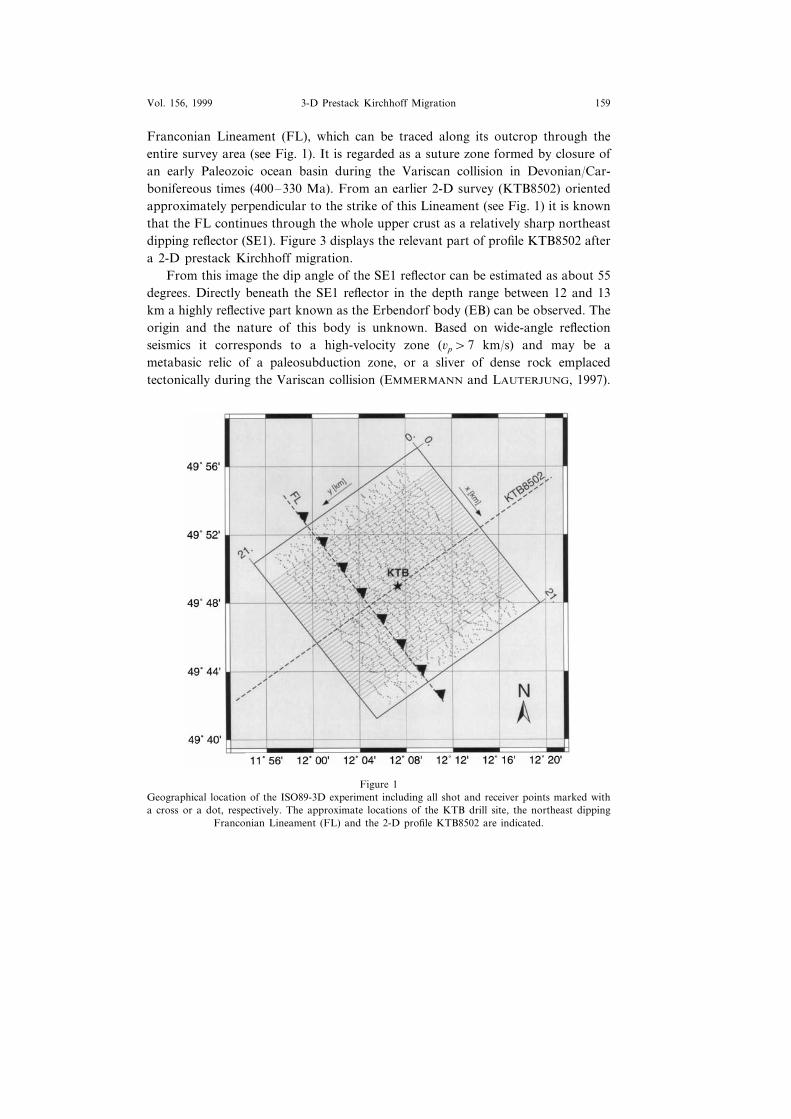
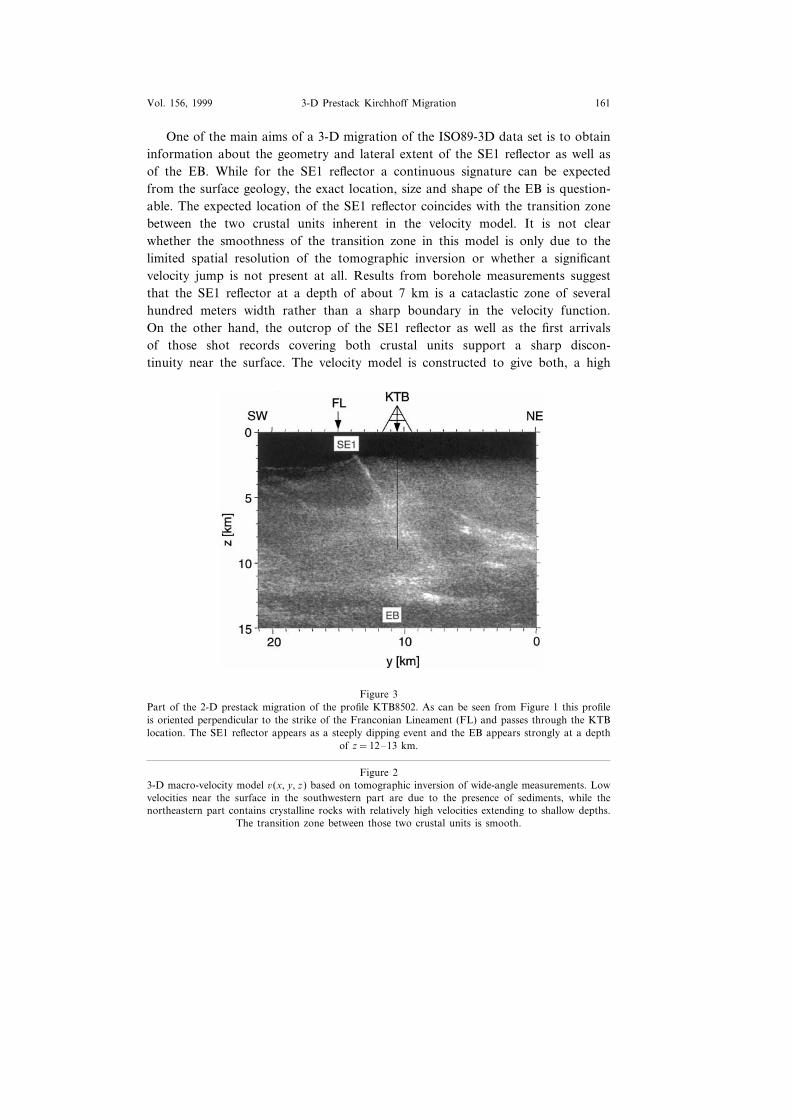
Franconian Lineament (FL), which can be traced along its outcrop through theentire survey area (see Fig. 1). It is regarded as a suture zone formed by closure ofan early Paleozoic ocean basin during the Variscan collision in Devonian/Car-bonifereous times (400–330 Ma). From an earlier 2-D survey (KTB8502) orientedapproximately perpendicular to the strike of this Lineament (see Fig. 1) it is knownthat the FL continues through the whole upper crust as a relatively sharp northeastdipping reflector (SE1). Figure 3 displays the relevant part of profile KTB8502 aftera 2-D prestack Kirchhoff migration.From this image the dip angle of the SE1 reflector can be estimated as about 55
degrees. Directly beneath the SE1 reflector in the depth range between 12 and 13km a highly reflective part known as the Erbendorf body (EB) can be observed. Theorigin and the nature of this body is unknown. Based on wide-angle reflectionseismics it corresponds to a high-velocity zone (�p�7 km/s) and may be ametabasic relic of a paleosubduction zone, or a sliver of dense rock emplacedtectonically during the Variscan collision (EMMERMANN and LAUTERJUNG, 1997).
Figure 1Geographical location of the ISO89-3D experiment including all shot and receiver points marked witha cross or a dot, respectively. The approximate locations of the KTB drill site, the northeast dipping
Franconian Lineament (FL) and the 2-D profile KTB8502 are indicated.
Stefan Buske160 Pure appl. geophys.,
3-D Prestack Kirchhoff Migration 161Vol. 156, 1999
One of the main aims of a 3-D migration of the ISO89-3D data set is to obtaininformation about the geometry and lateral extent of the SE1 reflector as well asof the EB. While for the SE1 reflector a continuous signature can be expectedfrom the surface geology, the exact location, size and shape of the EB is question-able. The expected location of the SE1 reflector coincides with the transition zonebetween the two crustal units inherent in the velocity model. It is not clearwhether the smoothness of the transition zone in this model is only due to thelimited spatial resolution of the tomographic inversion or whether a significantvelocity jump is not present at all. Results from borehole measurements suggestthat the SE1 reflector at a depth of about 7 km is a cataclastic zone of severalhundred meters width rather than a sharp boundary in the velocity function.On the other hand, the outcrop of the SE1 reflector as well as the first arrivalsof those shot records covering both crustal units support a sharp discon-tinuity near the surface. The velocity model is constructed to give both, a high
Figure 3Part of the 2-D prestack migration of the profile KTB8502. As can be seen from Figure 1 this profileis oriented perpendicular to the strike of the Franconian Lineament (FL) and passes through the KTBlocation. The SE1 reflector appears as a steeply dipping event and the EB appears strongly at a depth
of z=12–13 km.
Figure 23-D macro-velocity model �(x, y, z) based on tomographic inversion of wide-angle measurements. Lowvelocities near the surface in the southwestern part are due to the presence of sediments, while thenortheastern part contains crystalline rocks with relatively high velocities extending to shallow depths.
The transition zone between those two crustal units is smooth.
Stefan Buske162 Pure appl. geophys.,
velocity contrast near the surface as well as a smooth transition zone withoutsignificant velocity changes at greater depths. All in all, the velocity model seems tobe appropriate for a prestack migration.
Migration Results
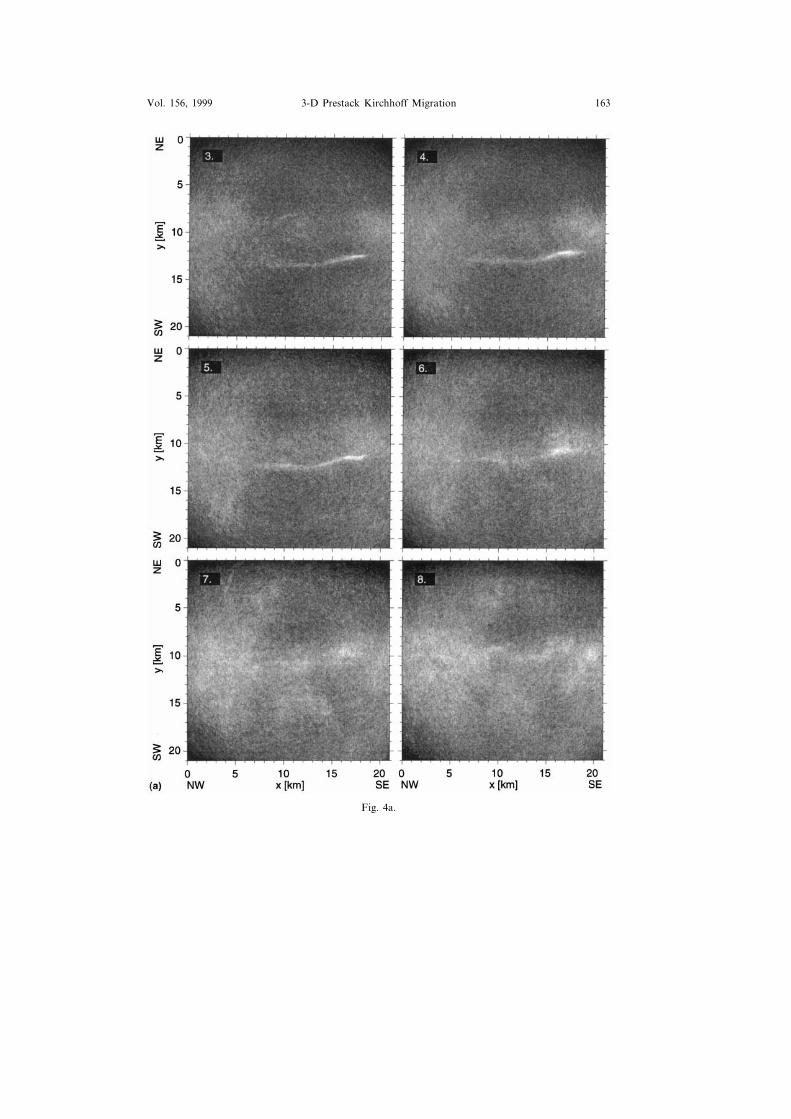
In this section slices are shown through the final migrated and stacked vol-ume of all 3327 shot records (Fig. 4).The uppermost slices parallel to the x-y plane clearly show the continuation
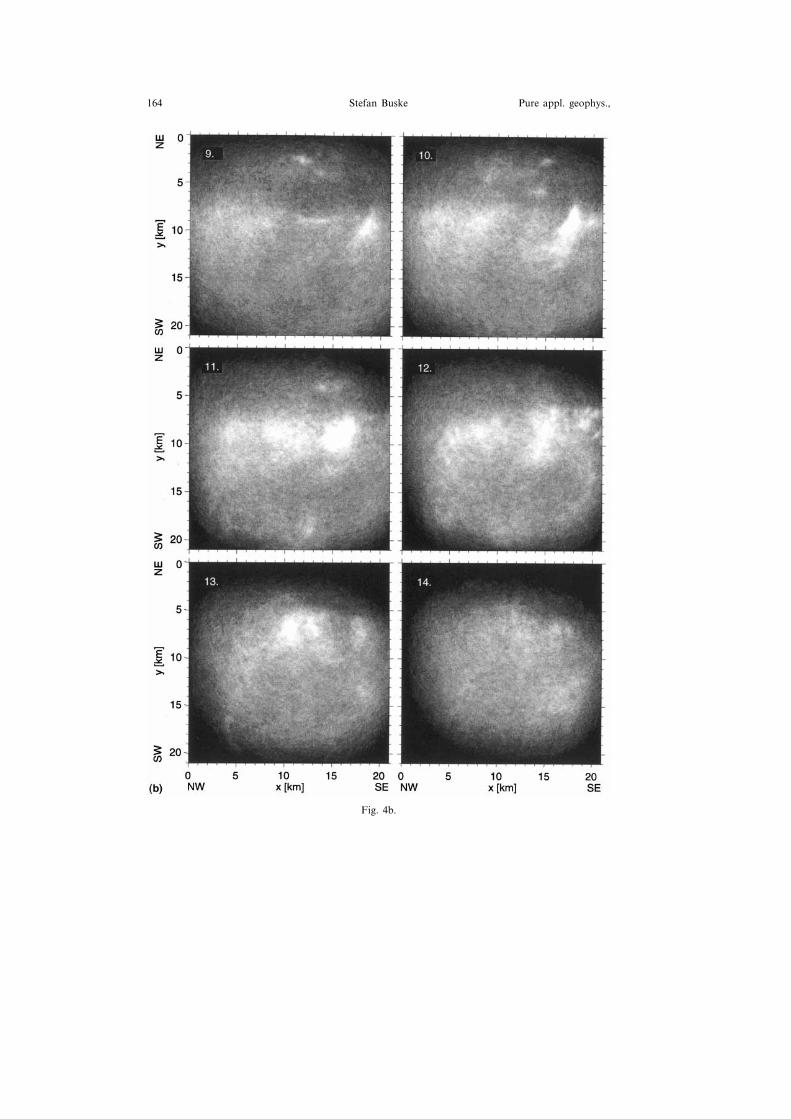
of the FL to depth, the SE1 reflector (Figs. 4a,b). Its intersections with thehorizontal planes of constant depth exhibit a relatively sharp continuous signa-ture parallel to the x axis between x=6 km and x=19 km. In the x rangebetween 13 and 16 km it appears as a curved plane and reflectivity seems toincrease with increasing x coordinate. Here the expression reflectivity is used tocharacterize the strength of the imaged reflector in a qualitative manner. Noconclusions can be drawn concerning a quantitative reflection coefficient, becauseno amplitude preserving processing was done. At x=19 km the signature van-ishes, which is probably due to the low coverage at the marginal parts. Accord-ing to its dip to the northeast, the SE1 reflector is cut at decreasing ycoordinates with increasing z (y=12.5–13.5 km at z=3 km, y=12–13 km atz=4 km, y=11.5–12.5 km at z=5 km). In deeper parts (z=6, 7, 8 km) thesignature becomes more diffusive. This observation is in correspondence withborehole results, which characterize the SE1 reflector at its borehole intersectionpoint as a cataclastic zone of several hundred meters width without any signifi-cant impedance contrasts. Compared to the upper parts, the curvature of theintersection line seems to have reversed at z=8 km, but due to the diffusivecharacter of the reflector at these depths this is not well confirmed. At z=9 kmparts of the SE1 reflector are still visible between x=11 km and x=15 km. Atthis depth a highly reflective body appears around x=18 km, y=10 km, whichis about 5 km south-southeast of the KTB drill site. This strongly reflective partcan be interpreted as the top of the EB. Following the slices down to greaterdepths it appears as a complicated structure covering the entire central part andvanishing at z=14 km. The following vertical depth slices will show its shapemore clearly than can be seen here. Several point-diffractor-like signatures canalso be identified (z=9 km: x=11.5 km, y=2.5 km; z=10 km: a patternconsisting of three small separated areas between x=8–10 km and y=2.5–6km; z=11 km: x=14 km, y=4 km and x=12.5 km, y=19 km). These signa-tures result from the horizontal intersection of also predominantly horizontaloriented structures, whose position and dimension will become more clearly fromthe following vertical depth slices.
3-D Prestack Kirchhoff Migration 163Vol. 156, 1999
Fig. 4a.
Stefan Buske164 Pure appl. geophys.,
Fig. 4b.
3-D Prestack Kirchhoff Migration 165Vol. 156, 1999
Fig. 4c.
Stefan Buske166 Pure appl. geophys.,
Fig. 4d.
3-D Prestack Kirchhoff Migration 167Vol. 156, 1999
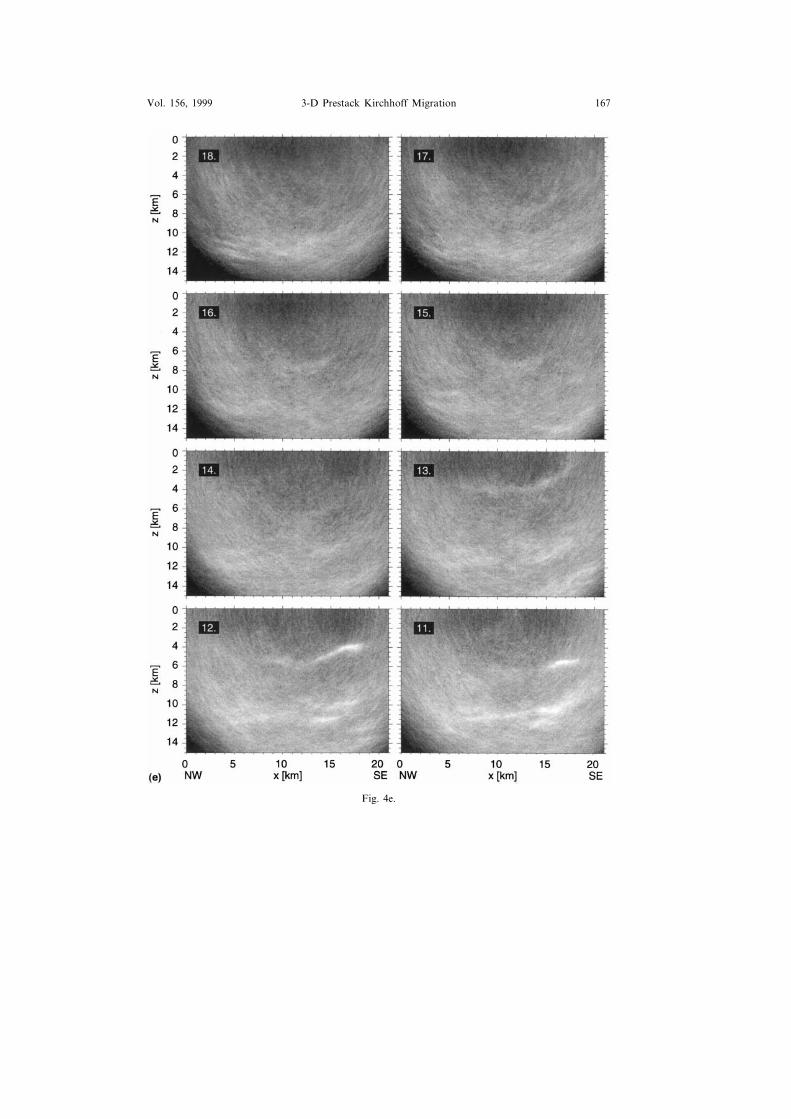
Fig. 4e.
Stefan Buske168 Pure appl. geophys.,
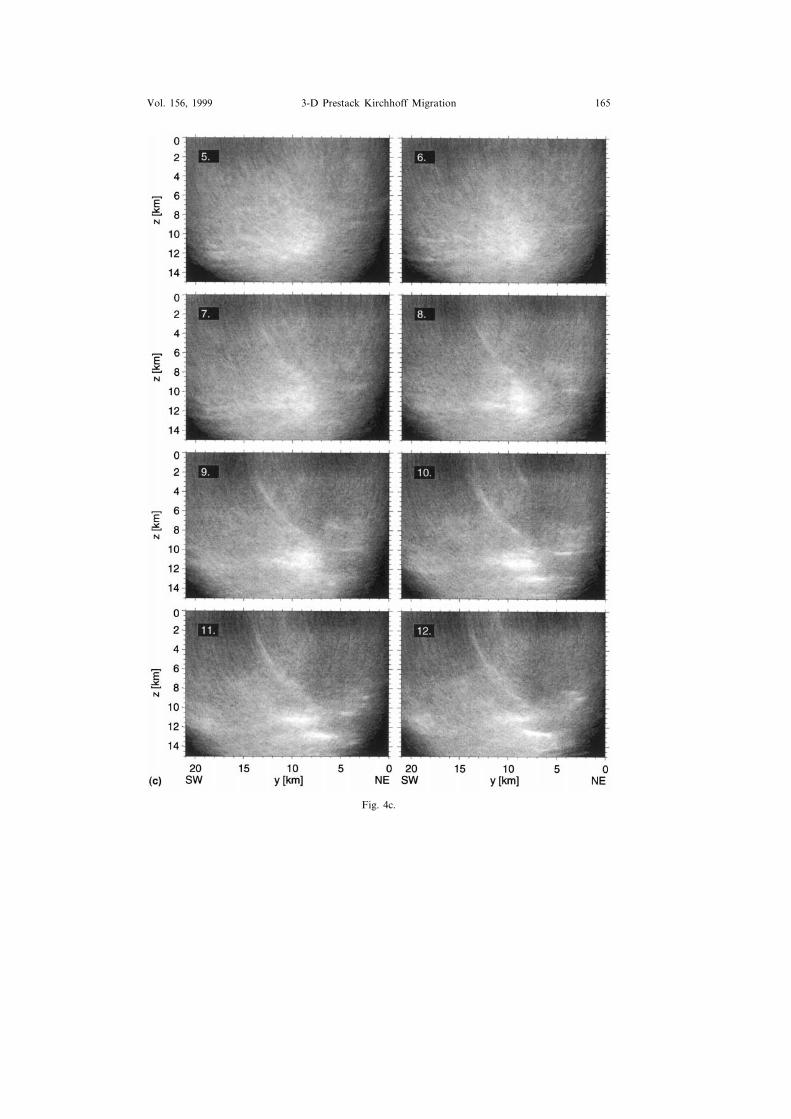
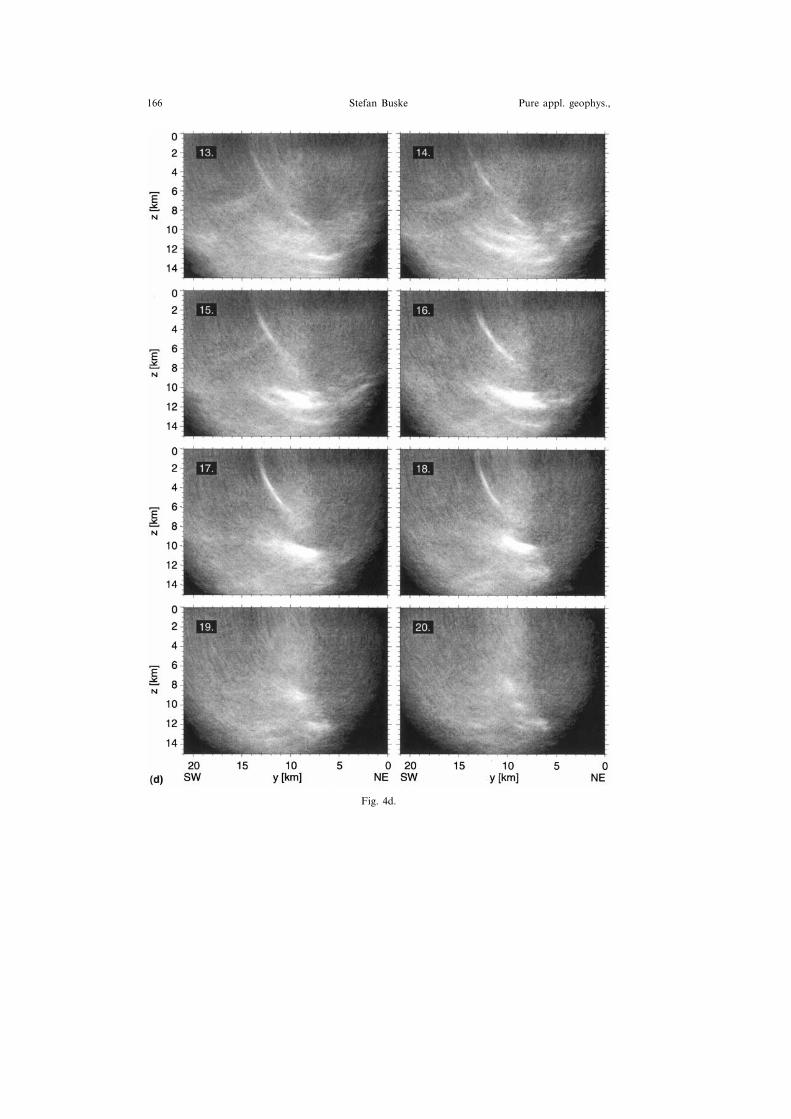
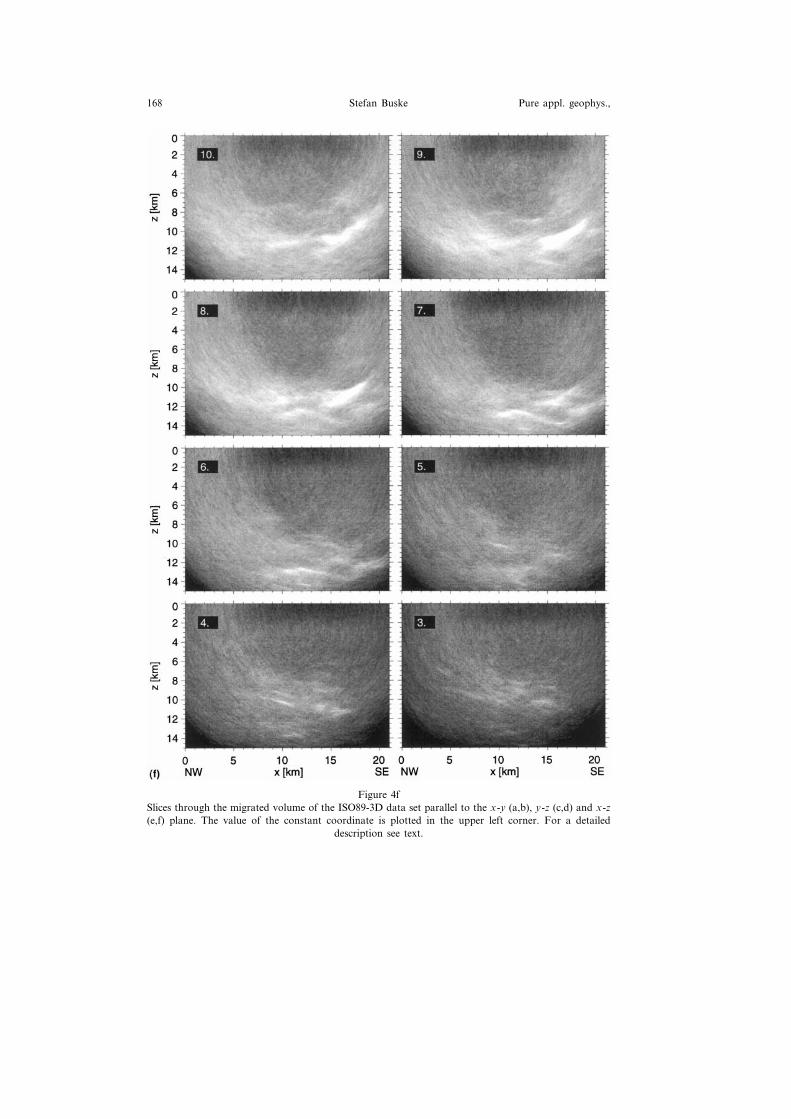
Figure 4fSlices through the migrated volume of the ISO89-3D data set parallel to the x-y (a,b), y-z (c,d) and x-z(e,f) plane. The value of the constant coordinate is plotted in the upper left corner. For a detailed
description see text.
3-D Prestack Kirchhoff Migration 169Vol. 156, 1999
Figures 4c and 4d show vertical depth slices, which are oriented parallel to the y-zplane. In most of these slices (x=7–19 km) the SE1 reflector can be identified asa northeast dipping plane between z=2 km and z=9 km depth. In the central part(z=3–6 km) its dip angle varies slightly around 55 degrees. In some slices this centralpart appears as a diffusive weakly reflective region. As recognized in the previousx-y slices, the reflection strength reaches its maximum value around x=16 km.Below a depth of about z=10 km the SE1 reflection plane cannot be identified; eitherit is not visible due to the limited aperture or it is completely absent. The latter ismore likely the case because it also cannot be seen in the 2-D profile KTB8502 (seeFig. 2) which has a considerably larger aperture. Some slices, for instance at x=10km, show a detachment-like horizontal signature at z=10 km. Below this depth theEB is the dominant feature in most of these slices. While it has a two-fold signatureat x=10–12 km, it seems to converge into a single strongly reflective body atx=15–18 km. The true character and the origin of this apparent convergence willbe resolved in the next slices parallel to the x-z plane. In the southwestern part atdepths between z=10 km and z=13 km some subhorizontal reflectors can beidentified at x=5 km and x=6 km as well as in those slices located further northwest(x�5 km) although not shown here. The slices at x=13–15 km reveal anotherinteresting feature in the southwestern part. At depths of z=5–8 km a weaklyreflective zone seems to run into the SE1 at right angles. The origin and the possibletectonic history of this reflection band is the subject of further investigations.Finally, the slices parallel to the x-z plane (Figs. 4e,f) show the lateral extension
in x direction of the reflecting elements. These slices are oriented approximatelyparallel to the strike of the FL. At y=18 km the above-mentioned subhorizontalreflectors can be observed between x=3 km and x=7 km at depths of z=10–13km. Also the weakly reflective zone related to the SE1 appears between x=9–15 kmat a depth of 7–8 km (y=15 km and y=16 km). From y=13 km to y=9 kmthe SE1 reflector is cut at increasing depths following its dip. In correspondence withthe x-y slices the curvature of the SE1 reflection plane can be seen as intersectionsat different depths. The signature itself is continuous and manifests its largestreflection strength again in the southeastern part between x=15 km and x=19 km.At y=11 km the central part becomes more diffusive and at y=10–9 km thecurvature has reversed. Now the intersection of the SE1 reflector with the x-z planeappears as two discontinuous subhorizontal reflectors at z=7–9 km depth betweenx=7 km and x=15 km. Additionally, starting at y=12 km the complex structureof the EB can be traced over a wide x range. Its reflectivity increases strongly withdecreasing y coordinate and reaches its maximum approximately at y=9 km. Fromthe slices at y=8 km and y=6 km it becomes clear that the EB consists of severalparts. The lowest one at a depth range z=12–14 km between x=9 km and x=16km shows an upcoming at about x=12 km. This part is separated from thesuperimposed parts by a nonreflective band of about one kilometer width. From the
Stefan Buske170 Pure appl. geophys.,
combination of these y-z slices and the corresponding x-z slices it should bepossible to construct a vague image of the complicated structure of the EB.Finally the x-z slices at y=5 km and y=4 km show the above-mentionedpossible detachment zone as an accumulation of southeast dipping reflectors atz=10 km between x=7 km and x=11 km.From the location of the KTB at the center of the survey area (x=y=10.5
km, see Fig. 1) and the corresponding depth slices it can be concluded that theborehole has intersected a rather diffusive and weakly reflective part of the SE1reflector. This is in good agreement with the borehole results mentioned earlier.When looking at the depth slices it is important to keep in mind that the
volume resulted from the post migration stack of many single migrated volumes.Due to errors in the velocity model used or artificial noise perturbations, destruc-tive stacking of weak or less coherent signals is unavoidable. Although the usageof the absolute values is a very robust way of obtaining a stacked image, it cancompensate these errors only to a certain degree. Careful selection and stacking ofa few single migrated volumes may produce a clearer image for certain subsurfacestructures of interest. This has been verified for this data set, too. Nevertheless, itis the main aim of this section to provide an overview of the dominant subsurfacestructures rather than to present single reflection elements at its best possibleresolution.
Conclusions
3-D prestack migration has proven to be applicable to deep seismic reflectiondata. The ISO89-3D data set used here has only a low coverage (maximum15-fold), compared with similar 2-D profiles (KTB8502: 80-fold). In spite of thecorresponding low S/N ratio the slices through the migrated volume show thegeometry and the shape of the dominant structures (SE1, EB) clearly. This isprobably due to the used Kirchhoff-type migration, which handles each subsur-face point as a possible diffractor. In combination with a postmigration stack ofthe absolute values this is known (SIMON et al., 1996) and has proven as anappropriate and robust technique yielding good results, especially in a crystallineenvironment.This paper has demonstrated the prestack migration of the 3-D survey. In
general, the results are in good agreement with those obtained by others, e.g., thepoststack migration by KO� RBE et al. (1997).Attractive and intriguing questions still remain open, for instance the estima-
tion of a reflection coefficient for the SE1 reflector. Further investigations mustincorporate the results of other experiments from the same area, e.g., the IN-STRUCT experiment for which a first lithological interpretation of the SE1reflector has been given by HARJES et al. (1997). The final goal is to yield asmuch information as possible for a detailed qualitative and quantitative under-standing of the geological and tectonic evolution within this area.
3-D Prestack Kirchhoff Migration 171Vol. 156, 1999
Acknowledgements
I am grateful to Manfred Stiller (GeoForschungsZentrum Potsdam) for hisvalued cooperation in preparing the ISO89-3D data set, to Michael Simon (Univer-sitat Munchen) for making available the 3-D velocity model, and to GerhardMuller for helpful discussions on the manuscript and the subject of this paper.Further slices through the migrated volume corresponding to Figure 4 can be
found at http://www.geophysik.uni-frankfurt.de/�stefan/work/ISO89-3D.This work was supported by the Bundesminister fur Bildung und Forschung
(Grant 03GT94026, DEKORP Project).
REFERENCES
BUSKE, S. (1999), Three-dimensional Prestack Kirchhoff Migration of Deep Seismic Reflection Data,Geophys. J. Int. 137, 243–260.
DU� RBAUM, H.J., REICHERT, C., and BRAM, K. (1990), Integrated Seismics Oberpfalz 1989, KTB Report90–6b.
DU� RBAUM, H.J., REICHERT, C., SADOWIAK, P., and BRAM, K. (1992), Integrated Seismics Oberpfalz1989, KTB Report 92–5.
EMMERMANN, R., and LAUTERJUNG, J. (1997), The German Continental Deep Drilling Program KTB:O�er�iew and Major Results, J. Geophys. Res. 102 (B8), 18,179–18,201.
HARJES, H.P., BRAM, K., DURBAUM, H.-J., GEBRANDE, H., HIRSCHMANN, G., JANIK, M., KLOCK-NER, M., LUSCHEN, E., RABBEL, W., SIMON, M., THOMAS, R., TORMANN, M., and WENZEL, F.(1997), Origin and Nature of Crustal Reflections: Results from Integrated Seismic Measurements at theKTB Superdeep Drilling Site, J. Geophys. Res. 102 (B8), 18,267–18,288.
KORBE, M., STILLER, M., HORSTMEYER, H., and RUHL, T. (1997), Migration of the 3-D Deep SeismicReflection Sur�ey at the KTB Location, Oberpfalz, Germany, Tectonophysics 271, 135–156.
PODVIN, P., and LECOMTE, I. (1991), Finite Difference Computation of Tra�el Times in Very ContrastedVelocity Models: A Massi�ely Parallel Approach and its Associated Tools, Geophys. J. Int. 105,271–284.
SCHWARZENBO� CK, A. (1993), Tomographische Laufzeitin�ersion, eine Methode der 3-D Geschwindigkeits-analyse und deren Anwendung auf ISO89-Daten, Master’s Thesis, Institut fur Allgemeine undAngewandte Geophysik, Universitat Munchen.
SIMON, M., GEBRANDE, H., and BOPP, M. (1996), Prestack Migration and True-amplitude Processing ofDEKORP Near-normal Incidence and Wide-angle Reflection Measurements, Tectonophysics 264,381–392.
STILLER, M., 3-D �ertical incidence seismic reflection sur�ey at the KTB location, Oberpfalz, Volume 22of Continental Litosphere: Deep Seismic Reflections, Geodynamic Series (AGU, Washington, D.C.1991) pp. 101–113.
(Received December 23, 1997, revised August 24, 1998, accepted September 22, 1998)
.