Embed Size (px)
Citation preview

3CHAPTER
COST-VOLUME-PROFIT ANALYSISAND PRICING DECISIONS
photo: © Tischenko Irina/S
hutterstock

3
MARKETING WANTS ANOTHER $50,000
► What will they do with it?► How will it affect sales volume?► What is the impact on our bottom line?

© Tom
wang112 / iS
tockphoto
BREAKEVEN ANALYSIS
Unit 3.1
31.Unit 3.2 Unit 3.3 Unit 3.4

3
WHAT DOES IT MEAN TO “BREAK EVEN”
► Total revenues = total expenses► Profit = $0► There is one sales volume at which this
relationship is true► This is called the “breakeven point”

3
TO CALCULATE THE BREAKEVEN POINT
► Use the equation approach
• Solve for units sold, which equals the breakeven point• Why is profit set to $0?
Sales Revenue – Variable expenses – Fixed expenses = Operating income
(SP×units sold) – (VC×units sold) – FC = $0
[(SP – VC)×(units sold)] – FC = $0
(CM/unit×units sold) – FC = $0
$20x - $16x - $168,000 = $0
x = 42,000 jerseys
BREAKEVEN POINT FOR UNIVERSAL SPORTS EXCHANGE
$4x - $168,000 = $0
BREAKEVEN POINT FOR UNIVERSAL SPORTS EXCHANGE

3
FCCM/Unit
= Breakeven in units
SHORTCUTS…
$168,000
$4= 42,000 jerseys

3
SHORTCUTS…
FCCMR
= Breakeven in sales $
$168,000
0.2= $840,000

LET’S LOOK AT BREAK EVEN GRAPHICALLY
$168,000
LET’S LOOK AT BREAKEVEN GRAPHICALLY

3
Current sales – Breakeven sales
MARGIN OF SAFETY
What does this mean?
$1,050,000 – $840,000 = $210,000
52,500 – 42,000 = 10,500 jerseys

© Tom
wang112 / iS
tockphoto
C-V-P ANALYSIS
Unit 3.1
32.Unit 3.2 Unit 3.3 Unit 3.4

3
LET’S REVIEW THE PROFIT EQUATION
– VC×(units sold)SP×(units sold) – FC = OI

3
HOW MUCH DO I HAVE TO SELL TO MAKE $X?
► This is called the “target income” question► Use the profit equation
► Use the breakeven formula and treat your target pretax income as additional fixed costs
FC + Target Income
CM / unit = required sales volume
To find the sales dollars required to attain the target income, use the CMR rather than the CM / unit.
(SP×units sold) – (VC×units sold) – FC = $X

3
WHAT ABOUT TARGET NET INCOME?
► You must adjust net income to pretax income► Divide target net income by (1 - tax rate)► Solve as before
Total FC +
= required sales volumeCM / unit
Target net income
1 – tax rate

3
CVP ANALYSIS
► Stands for cost-volume-profit► A tool to determine the impact of changes in sales
volume, costs, or sales mix on net income► Useful for evaluating decision alternatives

3
THREE APPROACHES TO CVP
► Prepare a contribution format income statement before and after implementing the changes
► Prepare a partial contribution format income statement that includes only those items that change (called the “incremental approach”)
► Compare the current total contribution margin with the proposed total contribution margin, then adjust for changes in fixed expenses

3
CVP AND THE SUPPLY CHAIN
► How do the CVP decisions of supply chain partners affect each other?
► For example, consider the jerseys that Universal Sports Exchange purchases from C&C Sports.• What happens if C&C Sports increases the selling
price?• What happens if Universal Sports Exchange decides
to use a cheaper supplier?

3
OPERATING LEVERAGE
► Firms sometimes have the option to trade fixed costs for variable costs
► Higher levels of fixed costs introduce higher levels of risk
► Measures the magnitude of change in operating income for a given percentage change in sales revenue
Degree of operating leverage =Contribution margin
Net operating income

WHY DO WE CARE ABOUT OPERATING LEVERAGE?WHY DO WE CARE ABOUT OPERATING LEVERAGE

© Tom
wang112 / iS
tockphoto
MULTIPRODUCT C-V-P ANALYSIS
Unit 3.1
33.Unit 3.2 Unit 3.3 Unit 3.4

3
MULTIPRODUCT CVP
► Rarely does a company produce a single product► Since not every product will have the same
contribution margin, we have a problem when more than one product is produced

3
WHAT IS “SALES MIX”?
► The “bag” or “package” of goods sold► For example:
• For every dining room table sold, the company also sells 4 chairs
• For every computer sold, the company also sells a monitor and a printer
• For every pair of athletic shoes sold, Landon Sports sells 4 baseball jerseys
3
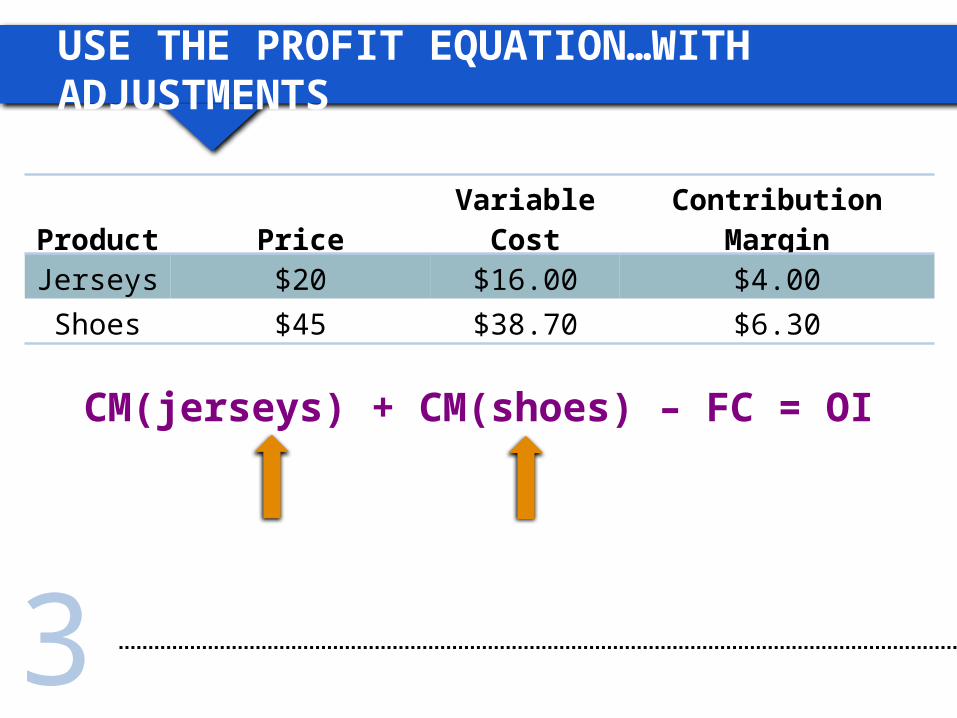
USE THE PROFIT EQUATION…WITH ADJUSTMENTS
CM(jerseys) + CM(shoes) – FC = OI
Product PriceVariable
CostContribution
Margin
Jerseys $20 $16.00 $4.00
Shoes $45 $38.70 $6.30
3
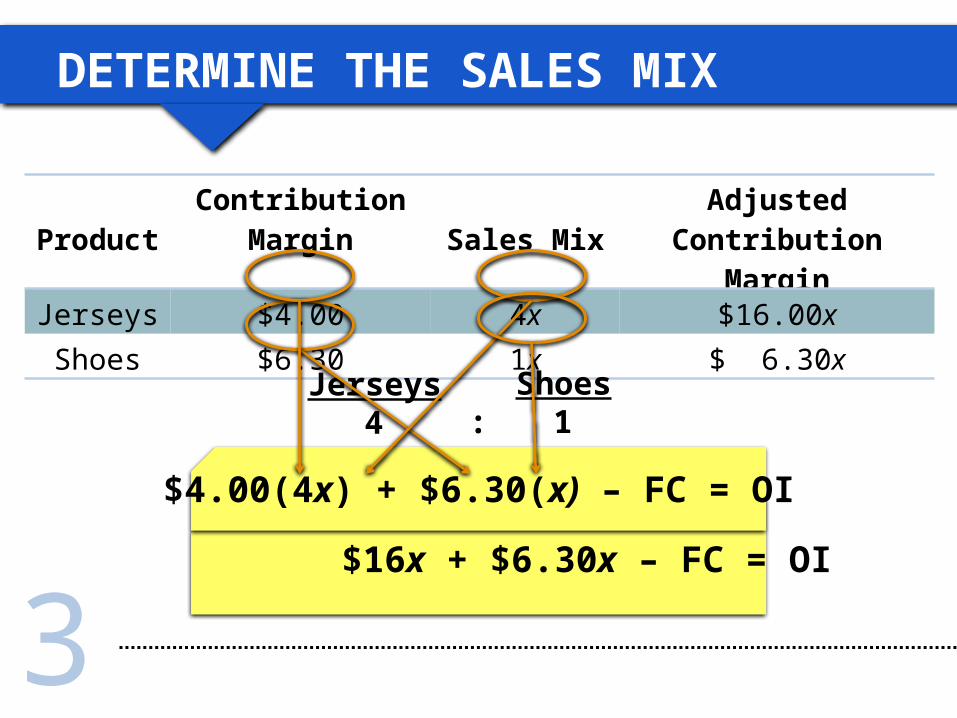
DETERMINE THE SALES MIX
$4.00(4x) + $6.30(x) – FC = OI
ProductContribution
Margin Sales MixAdjusted
Contribution Margin
Jerseys $4.00 4x $16.00x
Shoes $6.30 1x $ 6.30x
$16x + $6.30x – FC = OI
Jerseys Shoes4 1:

3 $22.30x = $178,400
$16x + $6.30x – $178,400 = $0
CALCULATING THE BREAKEVEN POINT
ProductContribution
Margin Sales MixAdjusted
Contribution Margin
Jerseys $4.00 4x $16.00x
Shoes $6.30 1x $ 6.30x
x = 8,000 shoes 4x = 4(8,000) = 32,000 jerseys

3
LIMITING ASSUMPTIONS OF CVP ANALYSIS
► All costs can be divided into fixed and variable components
► All cost and profit functions are linear throughout the relevant range
► Sales mix will remain constant

3
CHANGES EXAMINED USING CVP
► Change in sales price► Change in sales volume► Change in variable costs per unit► Change in fixed costs► Change in sales mix► Any combination of the above
Remember to always use “constant” forms – SP/unit, VC/unit, Total FC – when doing CVP analysis
© Tom
wang112 / iS
tockphoto
PRICING DECISIONS
Unit 3.1
34.Unit 3.2 Unit 3.3 Unit 3.4

3
ECONOMICS OF PRICE
Market equilibrium

3
COST-PLUS PRICING
► Start with the cost to produce the product► Add a markup to the cost to arrive at price► Be clear about what cost you use in the markup
calculation
Product Cost+ Markup= Sales Price

3
CALCULATING MARKUP PERCENTAGE
Sales price – Cost
Cost= Markup %
$20.00 - $14.80
$14.80= 35%

3
$36.00 + $12.60 = $48.60
CALCULATING PRICE USING MARKUP %
Cost
$36.00 + ($36.00 × 35%) = Price
Markup amount
+ (Cost × Markup %) = Price

3
ISSUES WITH COST-PLUS PRICING
► What if customers are willing to pay more than the calculated price?
► Cost-plus pricing does not recognize the value provided to the customer; it recognizes a return to the seller
► The costs of the seller’s inefficiencies are borne by the customers

3
TARGET COSTING
► Start with an estimate of the price customers will pay• Subtract the desired markup• The result is the target, or maximum, product cost
► This is calculated before the product is designed and manufactured
► If you can produce the product for the target cost, go forward