Embed Size (px)
Citation preview
3 Case Study 62
3 Case Study
In this chapter the performance of a solar-assisted air-conditioning in relation to
solar yield and building cooling is verified. This occurs on the bases of a case
study. The object of the case study is the intended auditorium at the UNESP
University in Guaratinguetá, which is likely to be equipped with a solar cooling
system. The previous chapter is used as a technical basis for selecting the
appropriate technology and their components.
At first, some background information about the project is given. Then the
auditorium is designed for specific climate conditions, - and building data
simulated. As well, it is shown how the cooling load (demand) through building
insulation and adaptation of the indoor air temperature can be decreased.
Thereafter, different collector types and as well on the Brazilian market available
collectors are simulated on their suitability and the cost-benefit ratio. The chapter
concludes with an assessment of the economically feasibility in comparison to
conventional compressor split air-conditioning system. Because of the demand of
a back-up system to cover the cooling load during cloudy days the economically
feasibility calculation of two back-up system is included, too. These are a
separated electric driven split air-conditioning system and a thermal gas back-up
which heats up the chiller driving water. Finally, the environmental benefit of the
solar-assisted air-conditioning system is demonstrated.
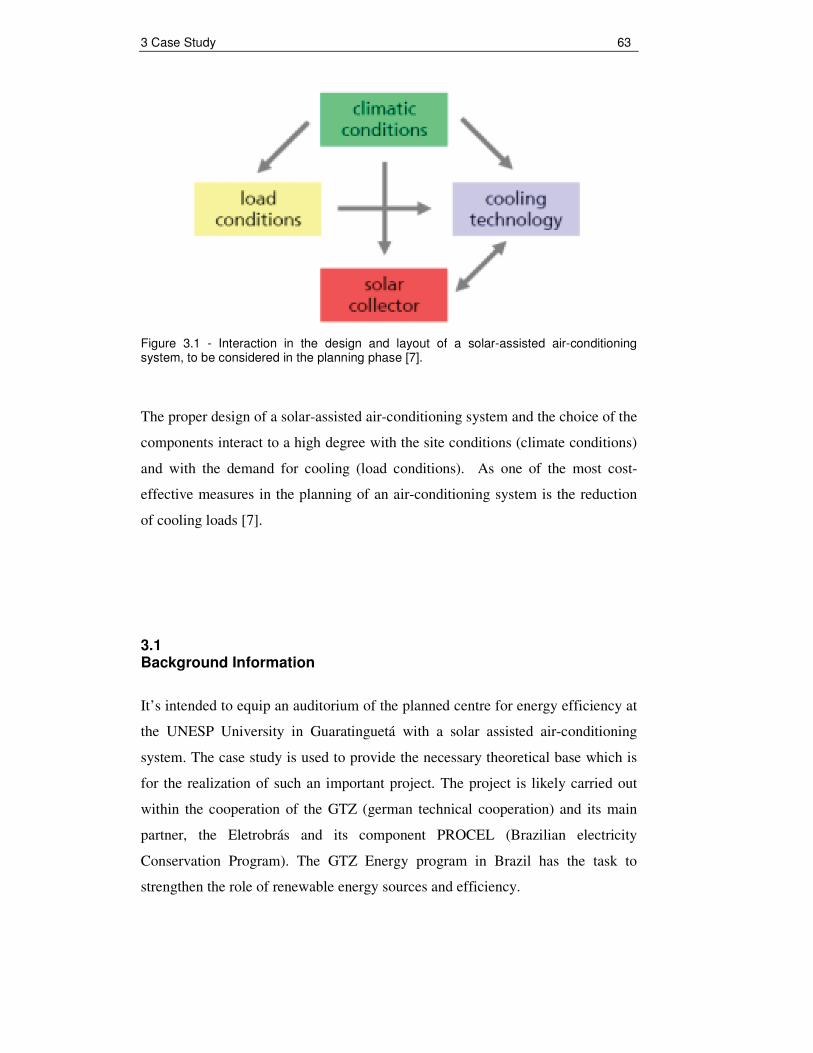
Figure 3.1 represents the interactions which must be considered during the
planning phase of a solar cooling system.
3 Case Study 63
Figure 3.1 - Interaction in the design and layout of a solar-assisted air-conditioning system, to be considered in the planning phase [7].
The proper design of a solar-assisted air-conditioning system and the choice of the
components interact to a high degree with the site conditions (climate conditions)
and with the demand for cooling (load conditions). As one of the most cost-
effective measures in the planning of an air-conditioning system is the reduction
of cooling loads [7].
3.1 Background Information
It’s intended to equip an auditorium of the planned centre for energy efficiency at
the UNESP University in Guaratinguetá with a solar assisted air-conditioning
system. The case study is used to provide the necessary theoretical base which is
for the realization of such an important project. The project is likely carried out
within the cooperation of the GTZ (german technical cooperation) and its main
partner, the Eletrobrás and its component PROCEL (Brazilian electricity
Conservation Program). The GTZ Energy program in Brazil has the task to
strengthen the role of renewable energy sources and efficiency.
3 Case Study 64
The Eletrobrás/PROCEL will establish a Centre of Energy Efficiency at the São
Paulo State University (UNESP). In this centre, the latest architectural and
technological energy saving measures will be applied. The research, training and
exhibition centre has a totally area of 1.500 square meters and receive estimated
up to 20.000 visitors per year. Visitors and students will be demonstrated how
energy can be efficiently used in buildings. Besides the function as a "show room"
it will contribute through education and research to the dissemination and
development of energy saving measures in Brazil.
As part of this project the Eletrobrás/PROCEL intends, as mentioned above, the
implementation of solar cooling. The pilot project will provide a clear
demonstration character and will be accessible to visitors. The application at the
UNESP University allows a high dissemination character and could attract the
attention of decision makers, planners, building services as well as end-users.
A monitoring plan will be created to collect the key performance parameters of
the pilot plant, thus a continuous monitoring can be carried out by the UNESP
University. The results and experiences of the pilot project will be conveyed to the
Brazilian society through publications in professional journals and lectures, events
and specialist institutions.
Should the project be successfully implemented, it will show that the "new"
technology reliably functions. Consequently, the pilot project can serve as a
multiplier for the whole country. Partnerships between e.g. a system provider of
solar-assisted air-conditioning systems, a refrigeration firm and thermal collector
manufacturers could arise. Last but not least it could bring some opportunities for
the development of these segments.
The time schedule of the centre for energy efficiency is as follows:
In September 2009 the project was tendered. The award of the tendering will be
decided until January 2010. Around one month later the construction starts. The
goal is complete the construction until the end of 2011.
3 Case Study 65
For the tender, it is required a specification for the integration of a solar-assisted
air-conditioning system in the auditorium (see appendix A1).
3.1.1 Location and climate conditions
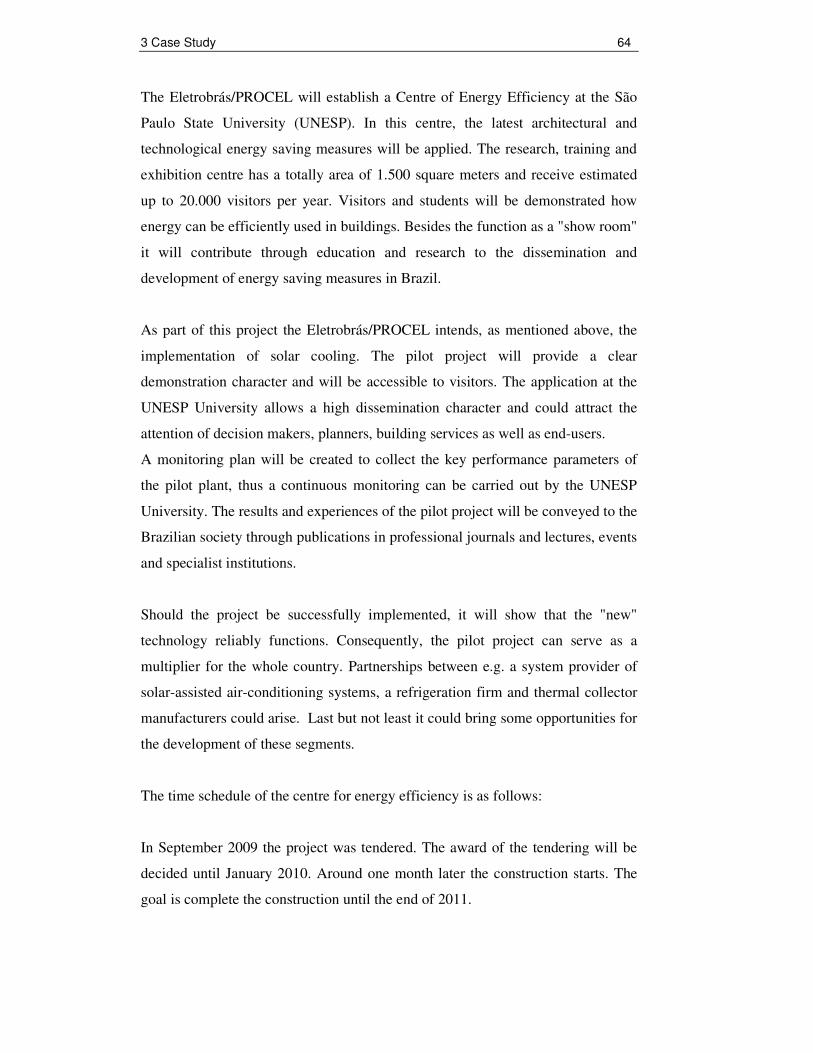
Guaratinguetá is located in south-eastern Brazil. The municipality of
Guaratinguetá is located in the “Vale do Rio Paraíba do Sul”, in the eastern state
of Sao Paulo. The region is near the Tropic of Capricorn. The municipal seat has
the following geographic coordinates: 22°48'43" south latitude and 45°11'40" W,
distant 237km from Rio de Janeiro and 163km from São Paulo. Elevation: 530
meters.
Figure 3.2 - Location of Guaratinguetá in Brazil within the State of São Paulo
The relative humidity varies around 70%. The climate is tropical of altitude
(meaning hot and humid in the summer, hot and dry in winter).
The city is considered the hottest of the Paraíba Valley, has an average
temperature of 22,6 C°.
3 Case Study 66
Month Temperature °C
Umidity %
Pressure mb
Precipitation mm
January
25,7 69 950,5 197,7
February 26,3 63 951,4 152,1
March
25,0 69 951,9 214,2
April 22,8 68 953,8 81,7
May 20,6 70 955,1 60,6
June 18,6 68 957,0 35,2
July 18,6 66 957,9 24,4
August 20,0 63 965,5 22,8
September 21,3 64 955,2 65,8
October 23,2 65 952,6 91,4
November 24,6 68 951,5 144,9
December 24,8 71 950,3 212,9
Average 22,6 67 953,6 108,6
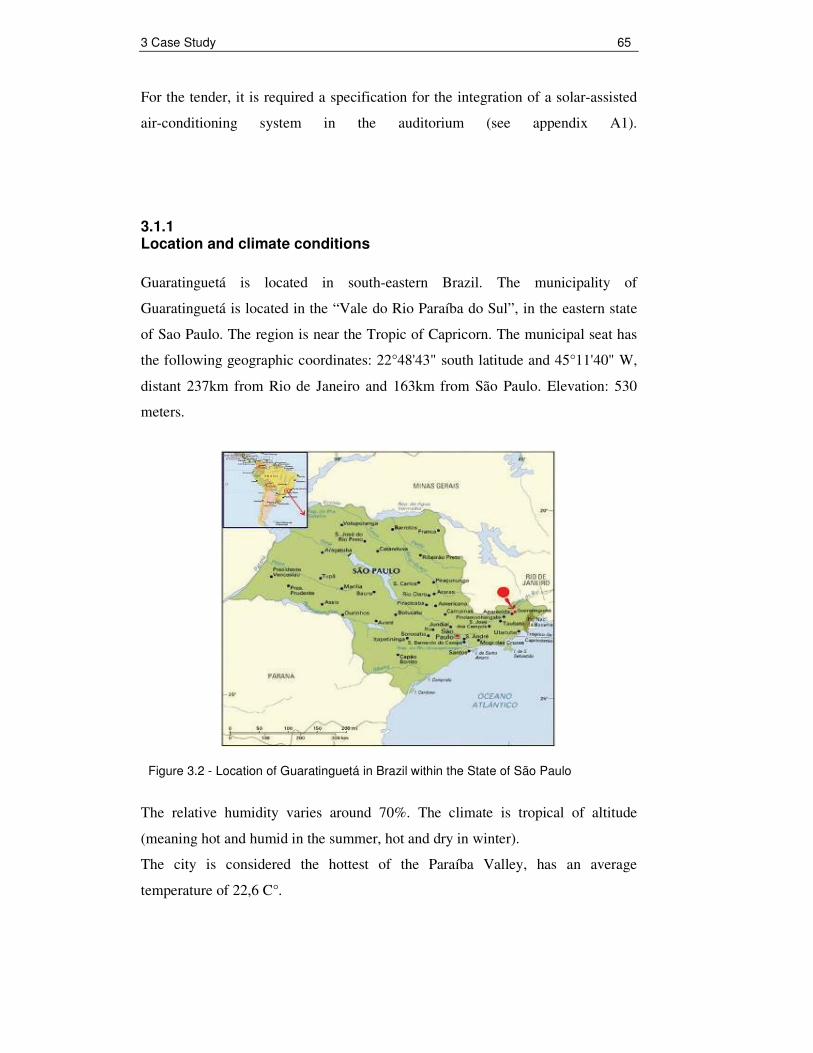
Table 3.1 - Monthly average climate data of Guaratinguetá 1962-1991 (modified) [19].
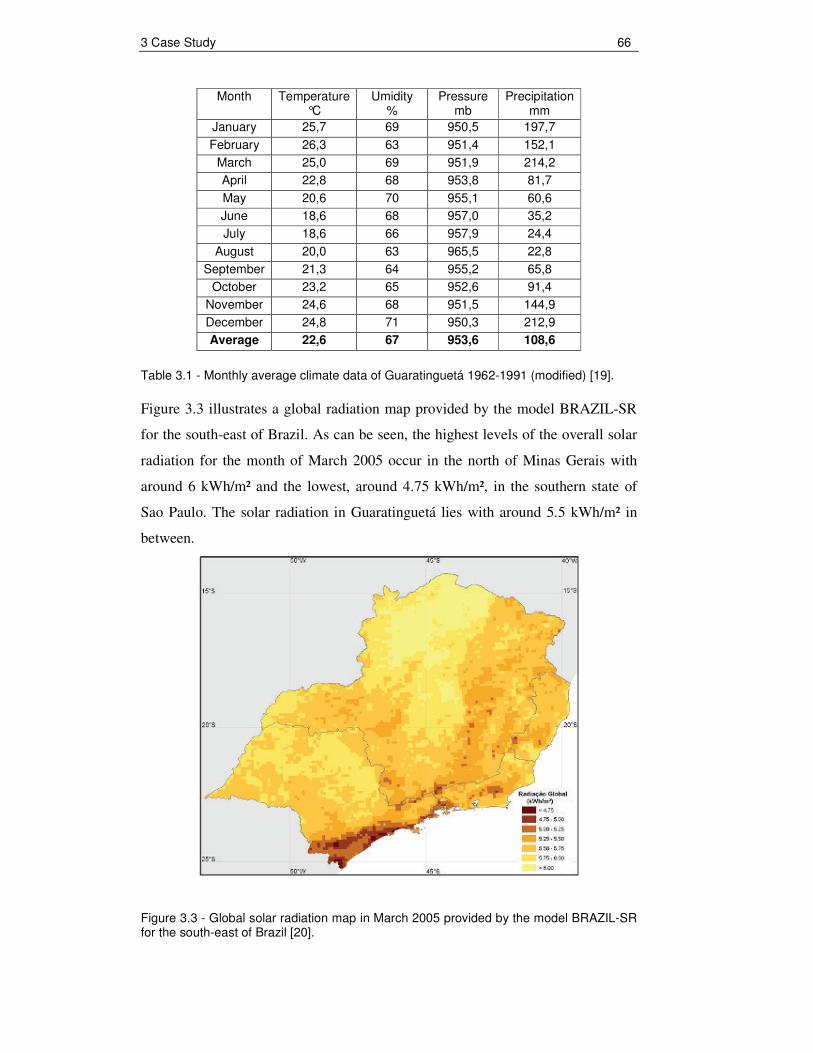
Figure 3.3 illustrates a global radiation map provided by the model BRAZIL-SR
for the south-east of Brazil. As can be seen, the highest levels of the overall solar
radiation for the month of March 2005 occur in the north of Minas Gerais with
around 6 kWh/m² and the lowest, around 4.75 kWh/m², in the southern state of
Sao Paulo. The solar radiation in Guaratinguetá lies with around 5.5 kWh/m² in
between.
Figure 3.3 - Global solar radiation map in March 2005 provided by the model BRAZIL-SR for the south-east of Brazil [20].
3 Case Study 67
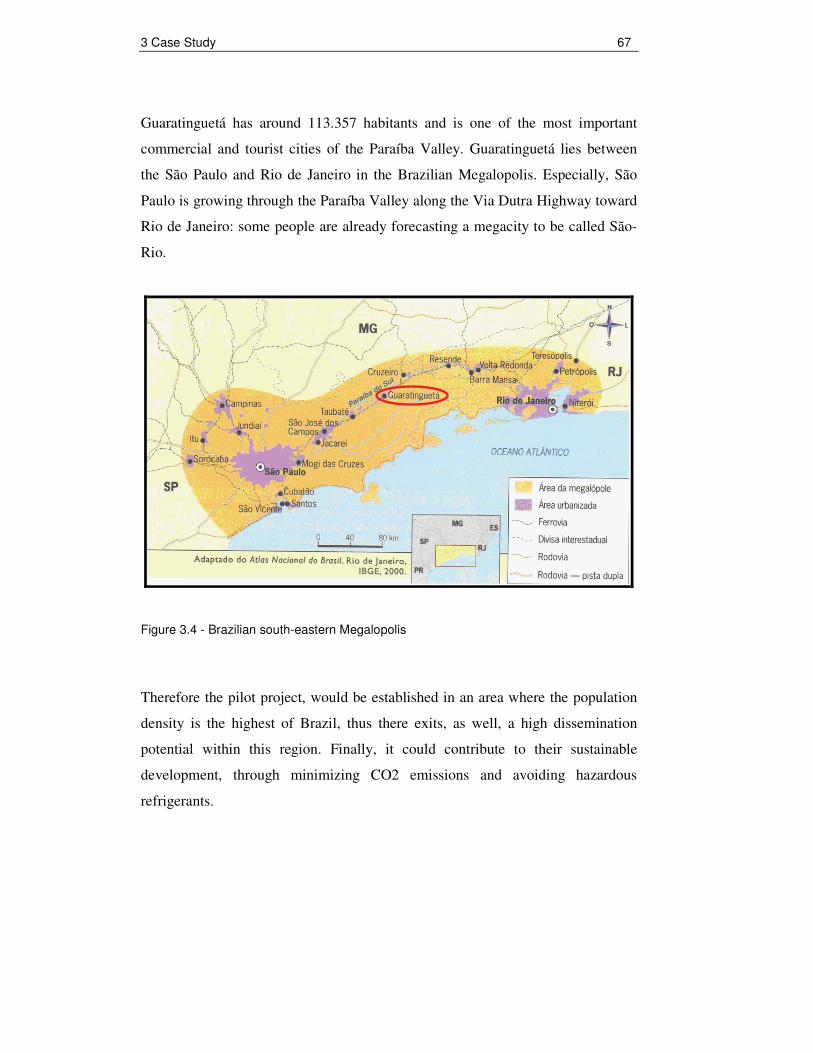
Guaratinguetá has around 113.357 habitants and is one of the most important
commercial and tourist cities of the Paraíba Valley. Guaratinguetá lies between
the São Paulo and Rio de Janeiro in the Brazilian Megalopolis. Especially, São
Paulo is growing through the Paraíba Valley along the Via Dutra Highway toward
Rio de Janeiro: some people are already forecasting a megacity to be called São-
Rio.
Figure 3.4 - Brazilian south-eastern Megalopolis
Therefore the pilot project, would be established in an area where the population
density is the highest of Brazil, thus there exits, as well, a high dissemination
potential within this region. Finally, it could contribute to their sustainable
development, through minimizing CO2 emissions and avoiding hazardous
refrigerants.
3 Case Study 68
3.2 Simulation and design
3.2.1 The thermal load of the building
This chapter deals with the thermal behaviour of the building. It gives a statement
about the maximum cooling load and how it changes due to climate change during
one day or within one year. The cooling load is the amount of heat that must be
dissipated from the room or building to allow a temperature which corresponds to
the thermal comfort. Due to this information the solar congruence can be
investigated, this means the relation between building cooling demand and
cooling yield by solar irradiance. This simulation serves as basis for the
technology choice and economic assessment.
The Program HELIOS-PC from Econzept Energieplannung GmbH was used for
the dynamic building simulation. The thermal building simulation program
HELIOS-PC was developed in the year 1992 principally by the technical
University of Karlsruhe (Germany). It bases due to the user interface HELEX 2.1
for Windows on Excel macros.
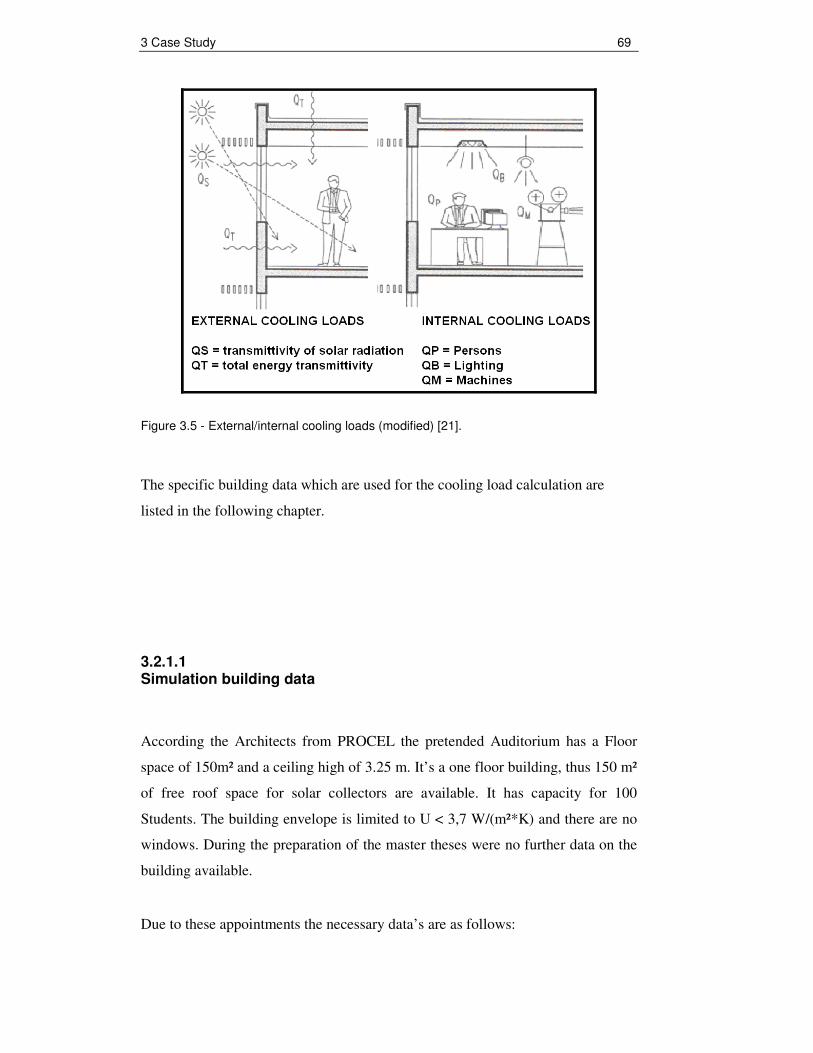
Different factors have an influence of the building cooling load. A distinction is
made between external and internal cooling load cooling load. The internal
cooling load is the heat gain, inside the building through persons, machines and
lighting. Heat gains through the windows and walls (building envelope) are
called external cooling load.
3 Case Study 69
Figure 3.5 - External/internal cooling loads (modified) [21].
The specific building data which are used for the cooling load calculation are
listed in the following chapter.
3.2.1.1 Simulation building data
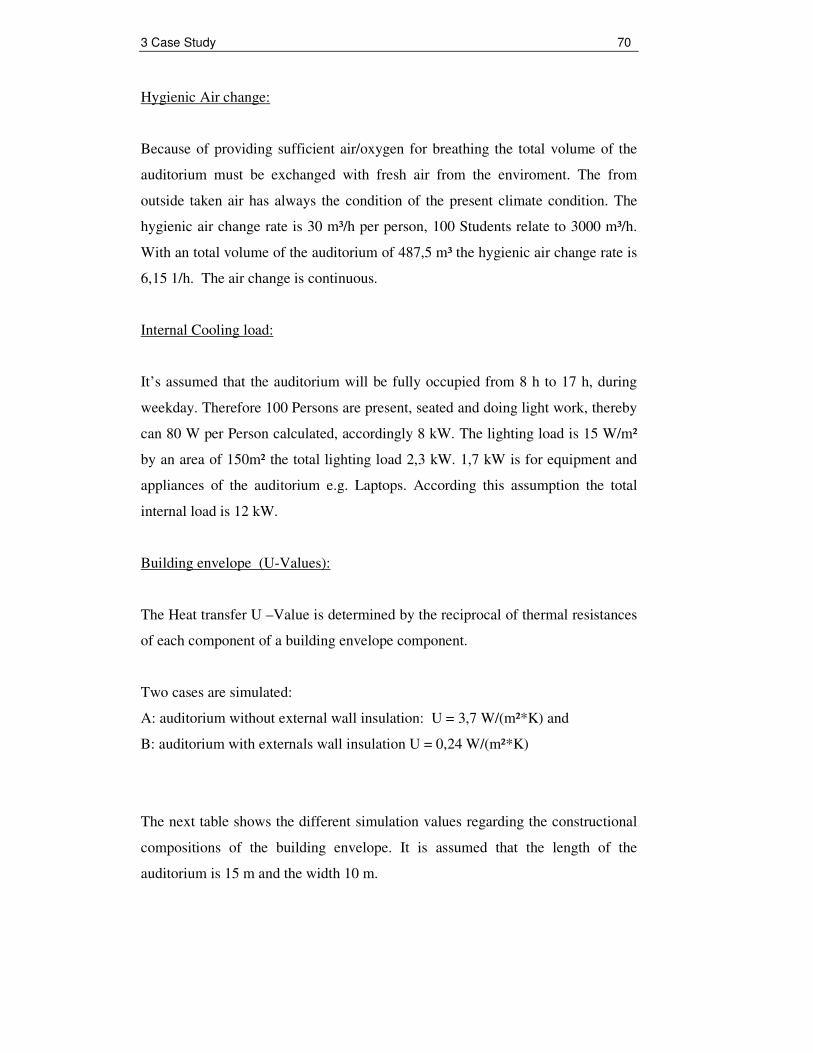
According the Architects from PROCEL the pretended Auditorium has a Floor
space of 150m² and a ceiling high of 3.25 m. It’s a one floor building, thus 150 m²
of free roof space for solar collectors are available. It has capacity for 100
Students. The building envelope is limited to U < 3,7 W/(m²*K) and there are no
windows. During the preparation of the master theses were no further data on the
building available.
Due to these appointments the necessary data’s are as follows:
3 Case Study 70
Hygienic Air change:
Because of providing sufficient air/oxygen for breathing the total volume of the
auditorium must be exchanged with fresh air from the enviroment. The from
outside taken air has always the condition of the present climate condition. The
hygienic air change rate is 30 m³/h per person, 100 Students relate to 3000 m³/h.
With an total volume of the auditorium of 487,5 m³ the hygienic air change rate is
6,15 1/h. The air change is continuous.
Internal Cooling load:
It’s assumed that the auditorium will be fully occupied from 8 h to 17 h, during
weekday. Therefore 100 Persons are present, seated and doing light work, thereby
can 80 W per Person calculated, accordingly 8 kW. The lighting load is 15 W/m²
by an area of 150m² the total lighting load 2,3 kW. 1,7 kW is for equipment and
appliances of the auditorium e.g. Laptops. According this assumption the total
internal load is 12 kW.
Building envelope (U-Values):
The Heat transfer U –Value is determined by the reciprocal of thermal resistances
of each component of a building envelope component.
Two cases are simulated:
A: auditorium without external wall insulation: U = 3,7 W/(m²*K) and
B: auditorium with externals wall insulation U = 0,24 W/(m²*K)
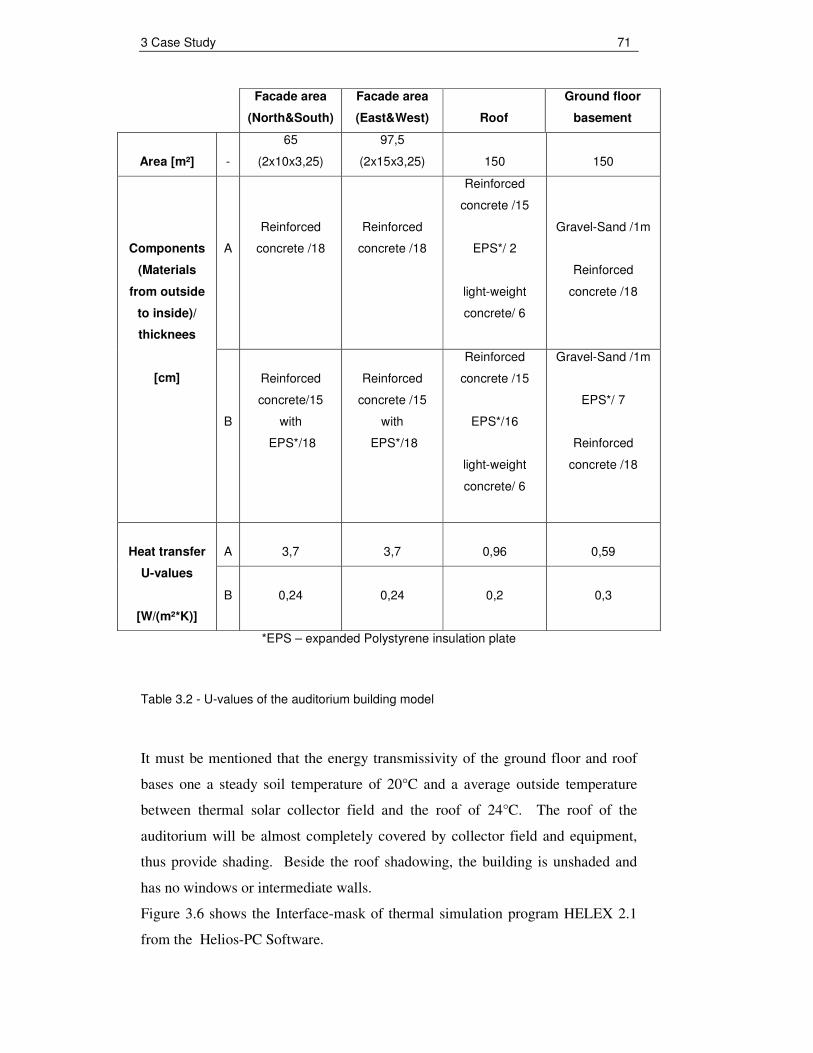
The next table shows the different simulation values regarding the constructional
compositions of the building envelope. It is assumed that the length of the
auditorium is 15 m and the width 10 m.
3 Case Study 71
Facade area
(North&South)
Facade area
(East&West)
Roof
Ground floor
basement
Area [m²]
-
65
(2x10x3,25)
97,5
(2x15x3,25)
150
150
A
Reinforced
concrete /18
Reinforced
concrete /18
Reinforced
concrete /15
EPS*/ 2
light-weight
concrete/ 6
Gravel-Sand /1m
Reinforced
concrete /18
Components
(Materials
from outside
to inside)/
thicknees
[cm]
B
Reinforced
concrete/15
with
EPS*/18
Reinforced
concrete /15
with
EPS*/18
Reinforced
concrete /15
EPS*/16
light-weight
concrete/ 6
Gravel-Sand /1m
EPS*/ 7
Reinforced
concrete /18
A
3,7
3,7
0,96
0,59
Heat transfer
U-values
[W/(m²*K)]
B
0,24
0,24
0,2
0,3
*EPS – expanded Polystyrene insulation plate
Table 3.2 - U-values of the auditorium building model
It must be mentioned that the energy transmissivity of the ground floor and roof
bases one a steady soil temperature of 20°C and a average outside temperature
between thermal solar collector field and the roof of 24°C. The roof of the
auditorium will be almost completely covered by collector field and equipment,
thus provide shading. Beside the roof shadowing, the building is unshaded and
has no windows or intermediate walls.
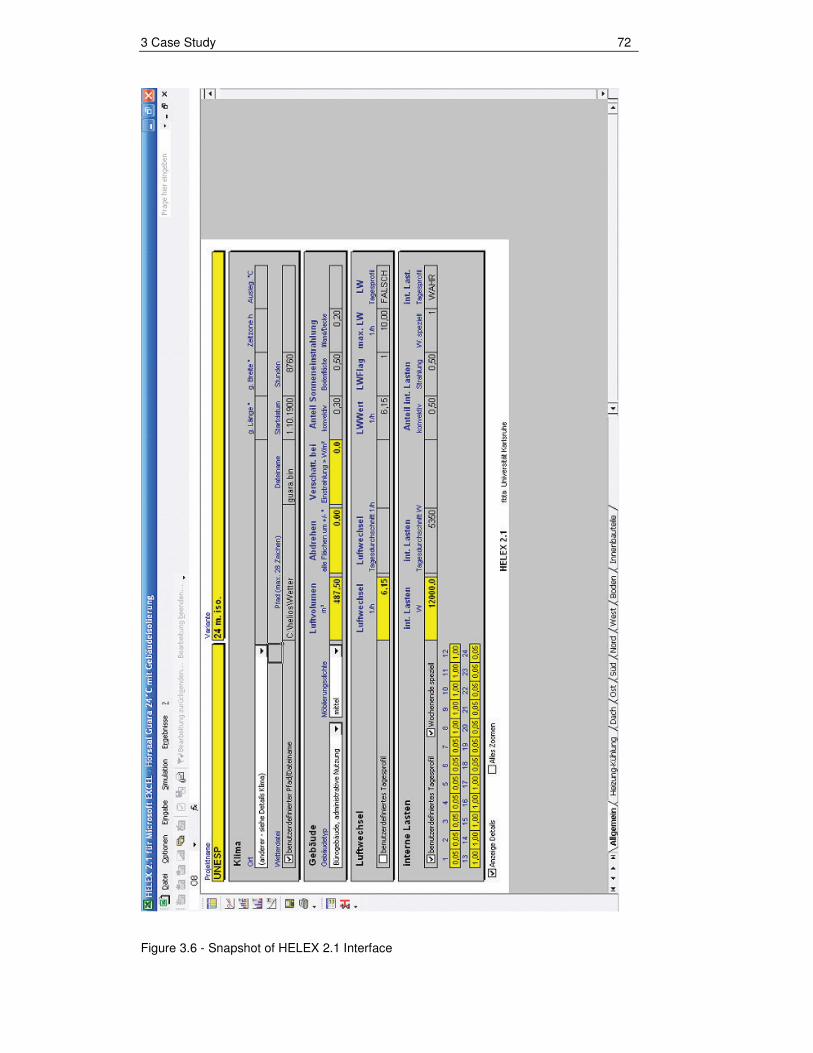
Figure 3.6 shows the Interface-mask of thermal simulation program HELEX 2.1
from the Helios-PC Software.
3 Case Study 72
Figure 3.6 - Snapshot of HELEX 2.1 Interface
3 Case Study 73
The thermal behaviour of the building will be assessed in an hourly annual, in an
hourly monthly and in hourly daily simulation figures. The simulation is realized
with three different indoor set point Temperatures of the auditorium. These are
20°C, 24°C and 26°C. In Brazil the air-conditioning systems are often oversized,
thus the indoor temperature is all over the year 18°C - 20°C. Therefore 20°C was
chosen to show how high is the cooling load and hence energy consumption in
comparison to an appropriate indoor temperatures of 24°C - 26°C. This
temperature range is in accordance with the Brazilian standards (PNB-10).
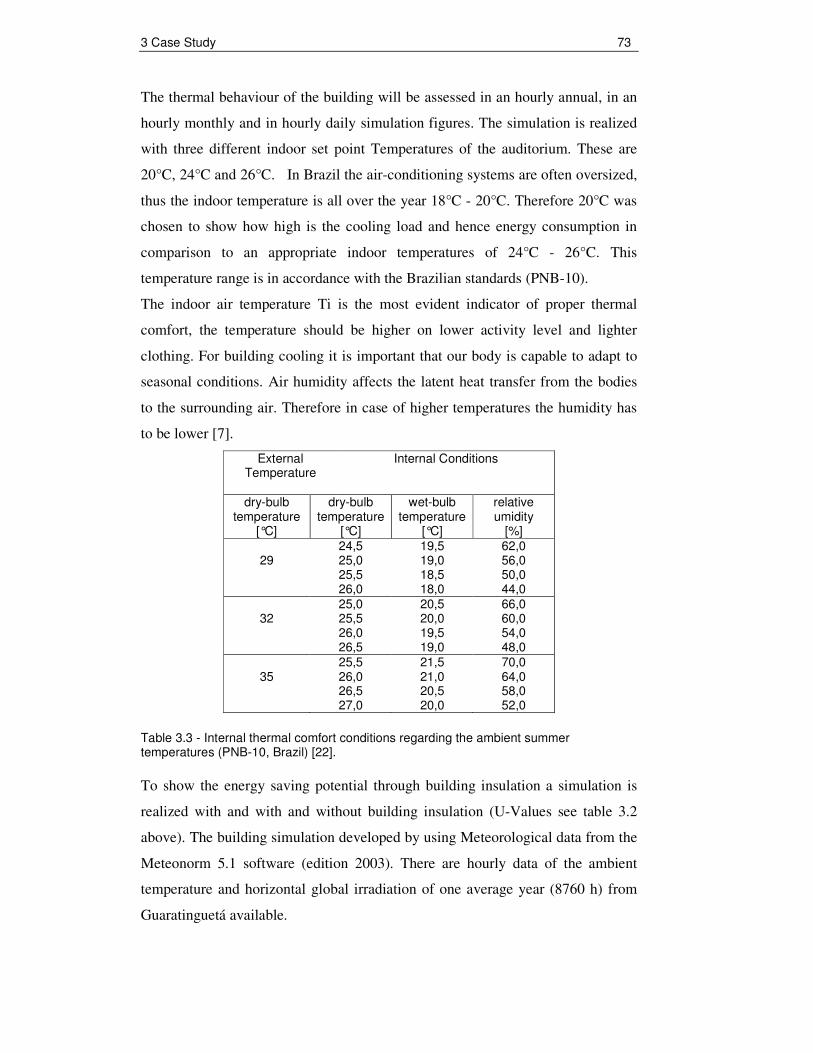
The indoor air temperature Ti is the most evident indicator of proper thermal
comfort, the temperature should be higher on lower activity level and lighter
clothing. For building cooling it is important that our body is capable to adapt to
seasonal conditions. Air humidity affects the latent heat transfer from the bodies
to the surrounding air. Therefore in case of higher temperatures the humidity has
to be lower [7].
External Temperature
Internal Conditions
dry-bulb temperature
[°C]
dry-bulb temperature
[°C]
wet-bulb temperature
[°C]
relative umidity
[%]
29
24,5 25,0 25,5 26,0
19,5 19,0 18,5 18,0
62,0 56,0 50,0 44,0
32
25,0 25,5 26,0 26,5
20,5 20,0 19,5 19,0
66,0 60,0 54,0 48,0
35
25,5 26,0 26,5 27,0
21,5 21,0 20,5 20,0
70,0 64,0 58,0 52,0
Table 3.3 - Internal thermal comfort conditions regarding the ambient summer temperatures (PNB-10, Brazil) [22].
To show the energy saving potential through building insulation a simulation is
realized with and with and without building insulation (U-Values see table 3.2
above). The building simulation developed by using Meteorological data from the
Meteonorm 5.1 software (edition 2003). There are hourly data of the ambient
temperature and horizontal global irradiation of one average year (8760 h) from
Guaratinguetá available.
3 Case Study 74
Meteonorm uses a database with long term monthly average measurement data
from different stations. In the recent software versions there are more than 7000
meteorological stations worldwide available. If no meteorological station is
available in the database for a desired site, meteorological data will be
interpolated based on the data of the nearest stations. In the Meteonorm 5.1
software are the Meteorological data from the year 1971 till 2003 collected.
The next chapter show the results of the simulation.
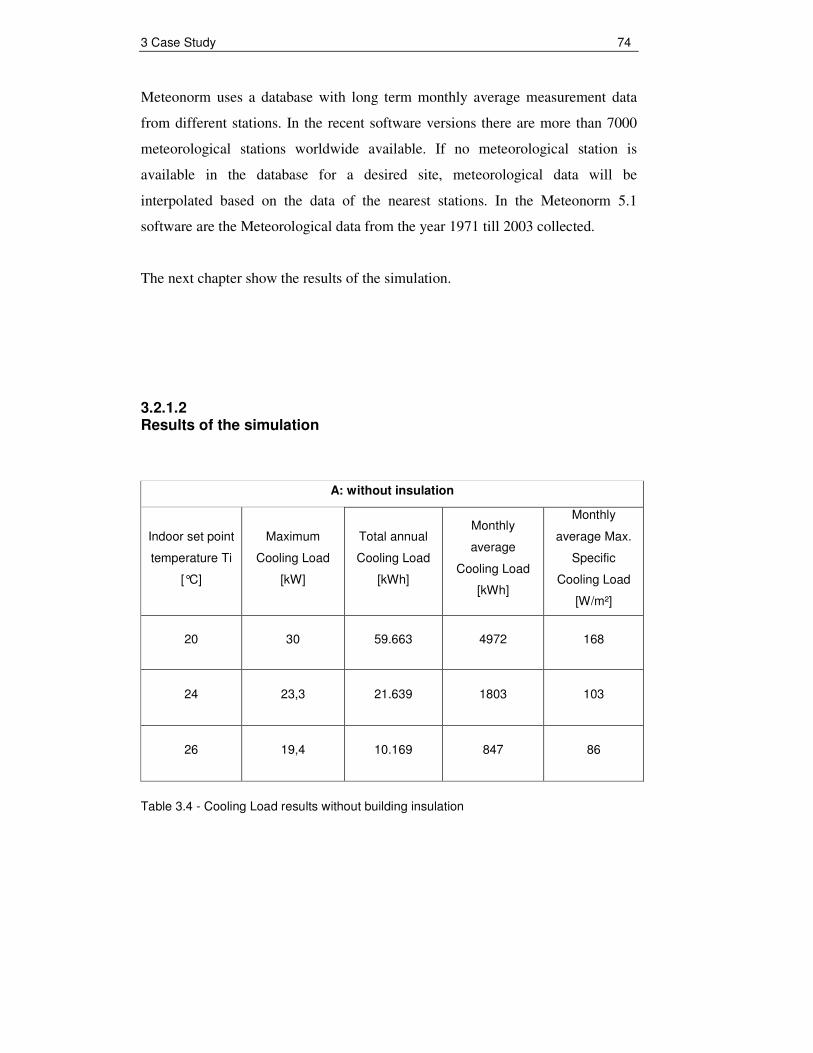
3.2.1.2 Results of the simulation
A: without insulation
Indoor set point
temperature Ti
[°C]
Maximum
Cooling Load
[kW]
Total annual
Cooling Load
[kWh]
Monthly
average
Cooling Load
[kWh]
Monthly
average Max.
Specific
Cooling Load
[W/m²]
20 30 59.663 4972 168
24 23,3 21.639 1803 103
26 19,4 10.169 847 86
Table 3.4 - Cooling Load results without building insulation
3 Case Study 75
B: with insulation
Indoor set point
temperature Ti
[°C]
Maximum
Cooling Load
[kW]
Total annual
Cooling Load
[kWh]
Monthly
average
Cooling Load
[kWh]
Monthly
average Max.
Specific
Cooling Load
[W/m²]
20
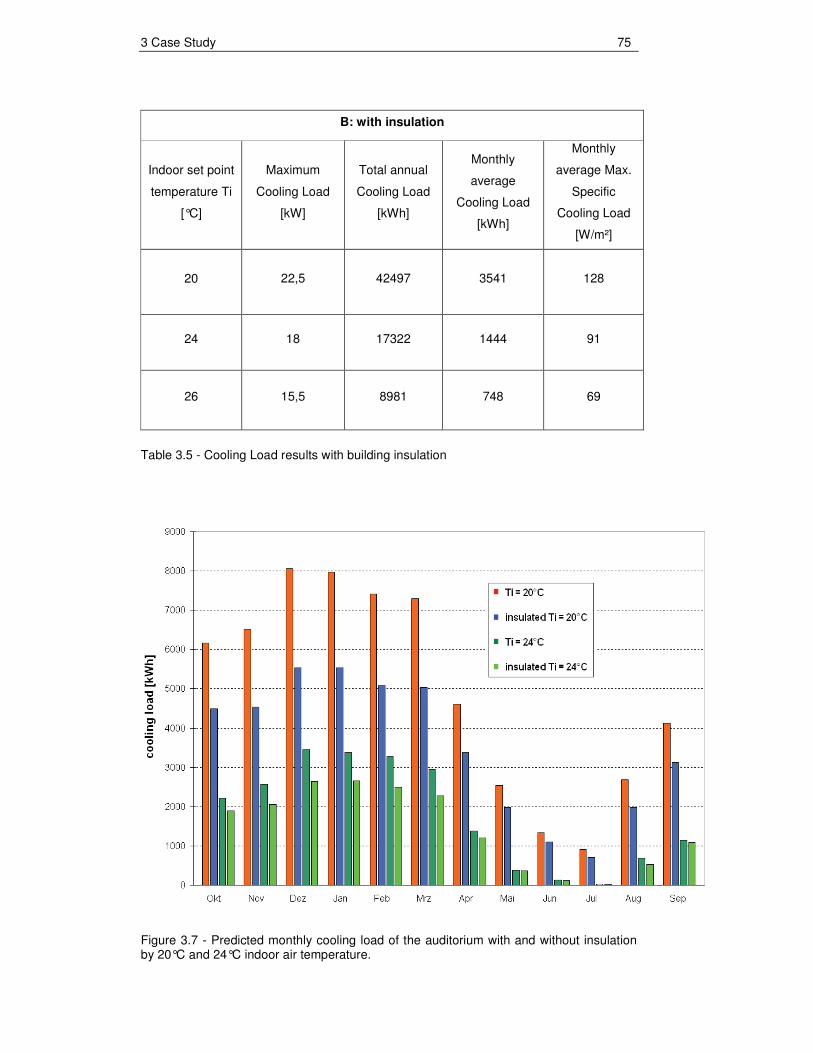
22,5 42497 3541 128
24 18 17322 1444 91
26 15,5 8981 748 69
Table 3.5 - Cooling Load results with building insulation
Figure 3.7 - Predicted monthly cooling load of the auditorium with and without insulation by 20°C and 24°C indoor air temperature.
3 Case Study 76
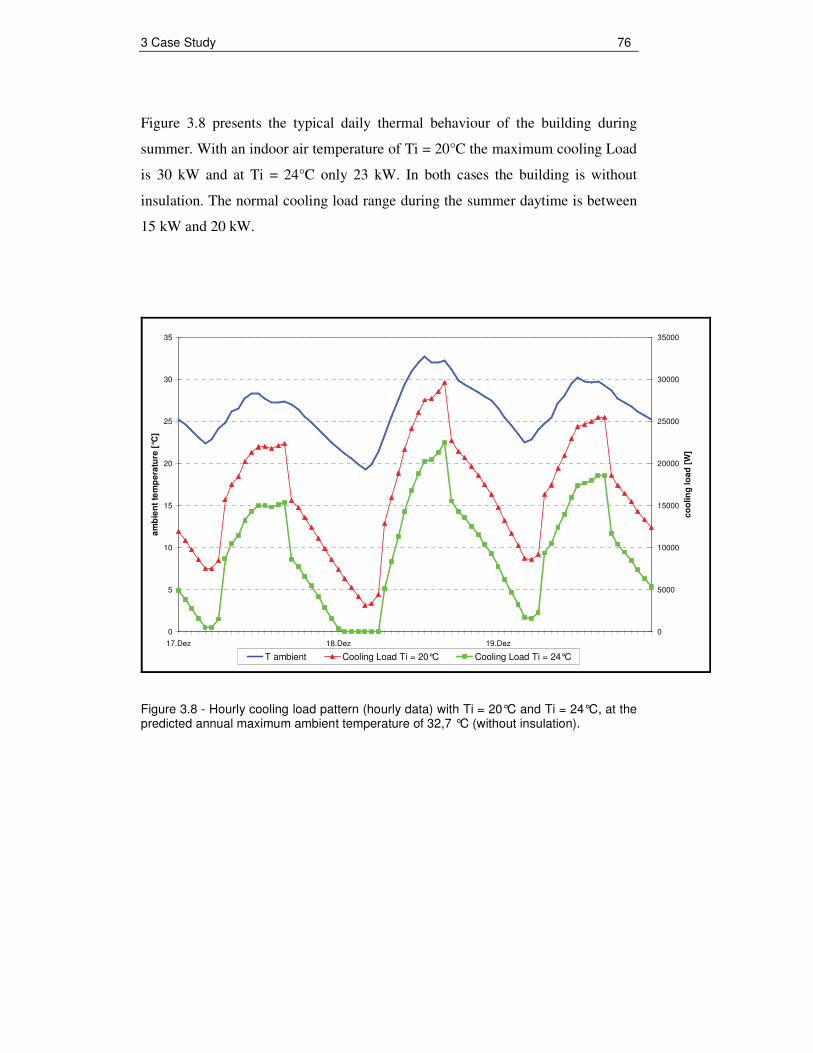
Figure 3.8 presents the typical daily thermal behaviour of the building during
summer. With an indoor air temperature of Ti = 20°C the maximum cooling Load
is 30 kW and at Ti = 24°C only 23 kW. In both cases the building is without
insulation. The normal cooling load range during the summer daytime is between
15 kW and 20 kW.
0
5
10
15
20
25
30
35
17.Dez 18.Dez 19.Dez
am
bie
nt
tem
pe
ratu
re [
°C]
0
5000
10000
15000
20000
25000
30000
35000
co
olin
g lo
ad
[W
]
T ambient Cooling Load Ti = 20°C Cooling Load Ti = 24°C
Figure 3.8 - Hourly cooling load pattern (hourly data) with Ti = 20°C and Ti = 24°C, at the predicted annual maximum ambient temperature of 32,7 °C (without insulation).
3 Case Study 77
3.2.1.2.1 Conclusion
It was established that the adjustment of the indoor air temperature within the
tolerance range of thermal comfort limits allows an enormous energy saving
potential for air-conditioned buildings.
At an indoor air temperature of Ti = 20°C the effect of building insulation
explicitly is noticeable and at 24°C and 26°C less. At this point it must be
highlighted that the auditorium has, due to the shadowing effect by the collector
field already a good "roof insulation", therefore, principally, the external walls
have an impact. However, in Brazil a building insulation would be profitable for
a long period, in the work of Carlos Gabriel Caruy (2009) payback times of two
month were calculated [23].
The economic feasibility of insulation for the auditorium was not calculated, since
it differ from the actual goal of this thesis. The focus of this work lies in the
economic analysis of a solar-assisted air-conditioning system.
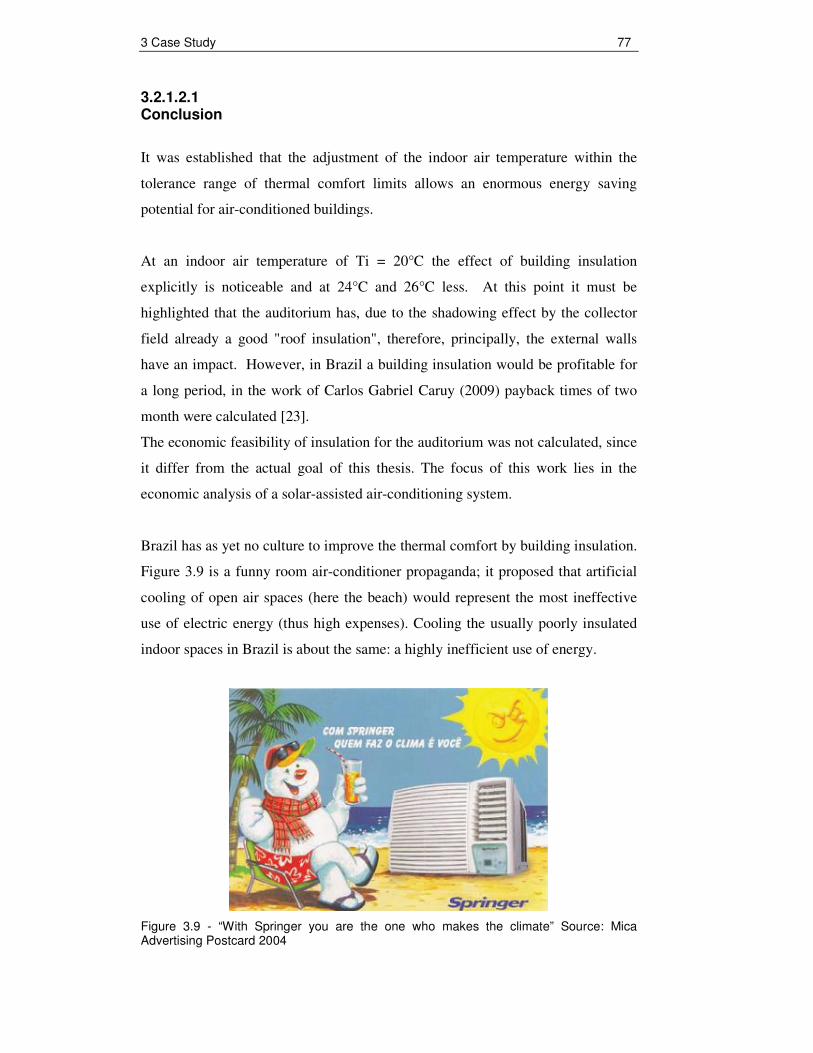
Brazil has as yet no culture to improve the thermal comfort by building insulation.
Figure 3.9 is a funny room air-conditioner propaganda; it proposed that artificial
cooling of open air spaces (here the beach) would represent the most ineffective
use of electric energy (thus high expenses). Cooling the usually poorly insulated
indoor spaces in Brazil is about the same: a highly inefficient use of energy.
Figure 3.9 - “With Springer you are the one who makes the climate” Source: Mica Advertising Postcard 2004
3 Case Study 78
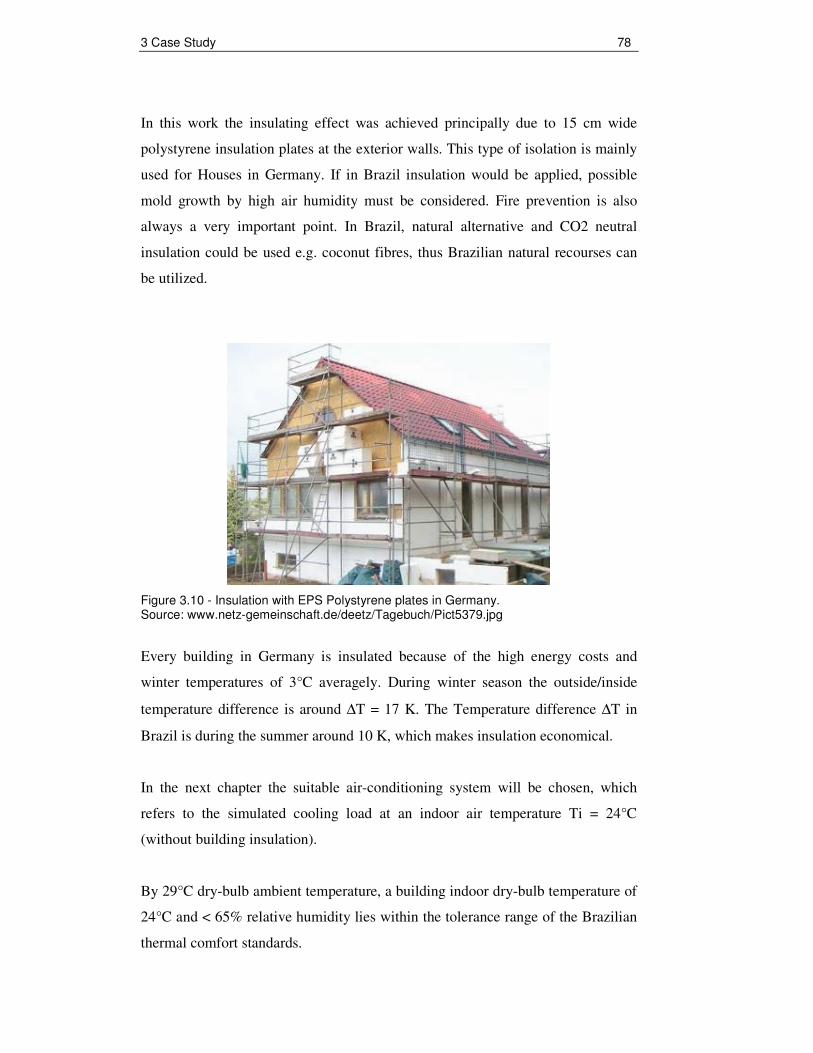
In this work the insulating effect was achieved principally due to 15 cm wide
polystyrene insulation plates at the exterior walls. This type of isolation is mainly
used for Houses in Germany. If in Brazil insulation would be applied, possible
mold growth by high air humidity must be considered. Fire prevention is also
always a very important point. In Brazil, natural alternative and CO2 neutral
insulation could be used e.g. coconut fibres, thus Brazilian natural recourses can
be utilized.
Figure 3.10 - Insulation with EPS Polystyrene plates in Germany. Source: www.netz-gemeinschaft.de/deetz/Tagebuch/Pict5379.jpg
Every building in Germany is insulated because of the high energy costs and
winter temperatures of 3°C averagely. During winter season the outside/inside
temperature difference is around ∆T = 17 K. The Temperature difference ∆T in
Brazil is during the summer around 10 K, which makes insulation economical.
In the next chapter the suitable air-conditioning system will be chosen, which
refers to the simulated cooling load at an indoor air temperature Ti = 24°C
(without building insulation).
By 29°C dry-bulb ambient temperature, a building indoor dry-bulb temperature of
24°C and < 65% relative humidity lies within the tolerance range of the Brazilian
thermal comfort standards.
3 Case Study 79
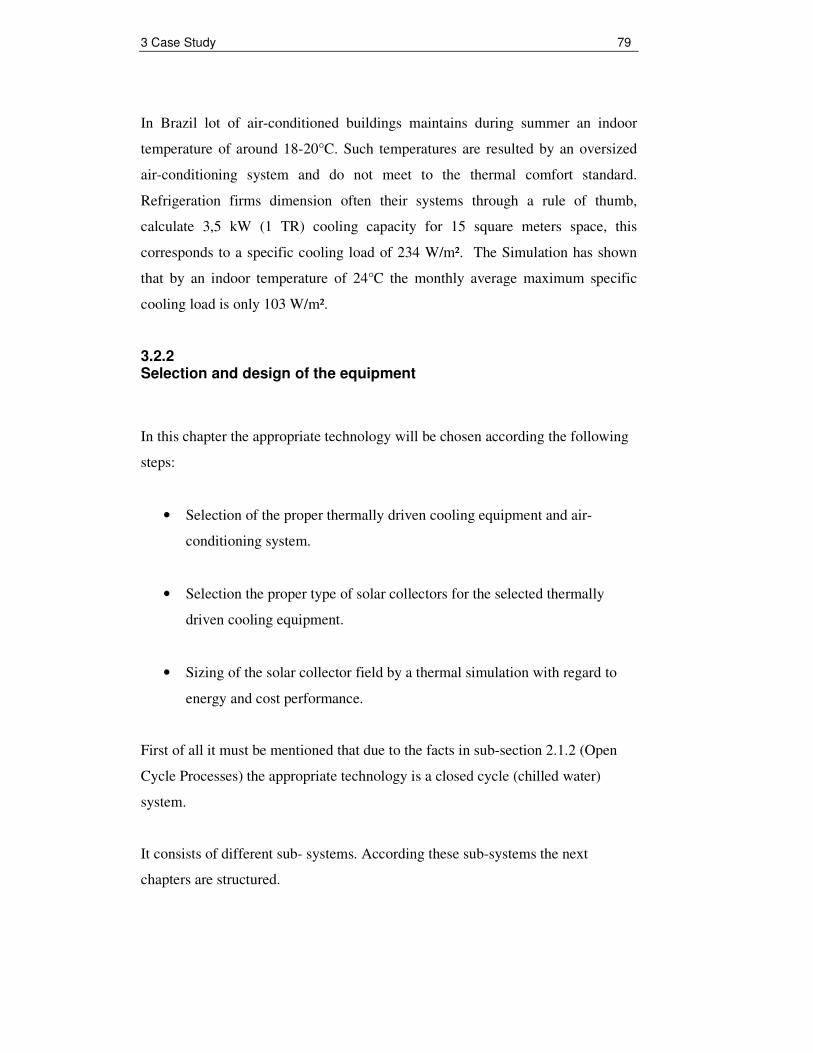
In Brazil lot of air-conditioned buildings maintains during summer an indoor
temperature of around 18-20°C. Such temperatures are resulted by an oversized
air-conditioning system and do not meet to the thermal comfort standard.
Refrigeration firms dimension often their systems through a rule of thumb,
calculate 3,5 kW (1 TR) cooling capacity for 15 square meters space, this
corresponds to a specific cooling load of 234 W/m². The Simulation has shown
that by an indoor temperature of 24°C the monthly average maximum specific
cooling load is only 103 W/m².
3.2.2 Selection and design of the equipment
In this chapter the appropriate technology will be chosen according the following
steps:
• Selection of the proper thermally driven cooling equipment and air-
conditioning system.
• Selection the proper type of solar collectors for the selected thermally
driven cooling equipment.
• Sizing of the solar collector field by a thermal simulation with regard to
energy and cost performance.
First of all it must be mentioned that due to the facts in sub-section 2.1.2 (Open
Cycle Processes) the appropriate technology is a closed cycle (chilled water)
system.
It consists of different sub- systems. According these sub-systems the next
chapters are structured.
3 Case Study 80
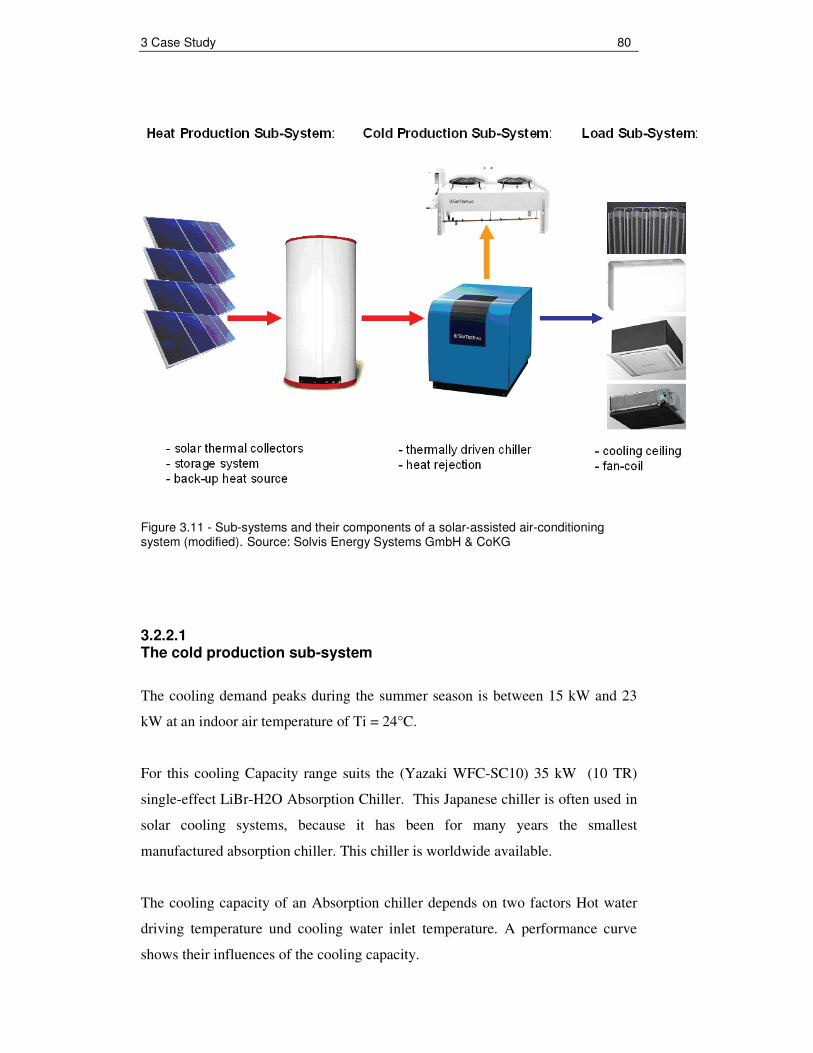
Figure 3.11 - Sub-systems and their components of a solar-assisted air-conditioning system (modified). Source: Solvis Energy Systems GmbH & CoKG
3.2.2.1 The cold production sub-system
The cooling demand peaks during the summer season is between 15 kW and 23
kW at an indoor air temperature of Ti = 24°C.
For this cooling Capacity range suits the (Yazaki WFC-SC10) 35 kW (10 TR)
single-effect LiBr-H2O Absorption Chiller. This Japanese chiller is often used in
solar cooling systems, because it has been for many years the smallest
manufactured absorption chiller. This chiller is worldwide available.
The cooling capacity of an Absorption chiller depends on two factors Hot water
driving temperature und cooling water inlet temperature. A performance curve
shows their influences of the cooling capacity.
3 Case Study 81
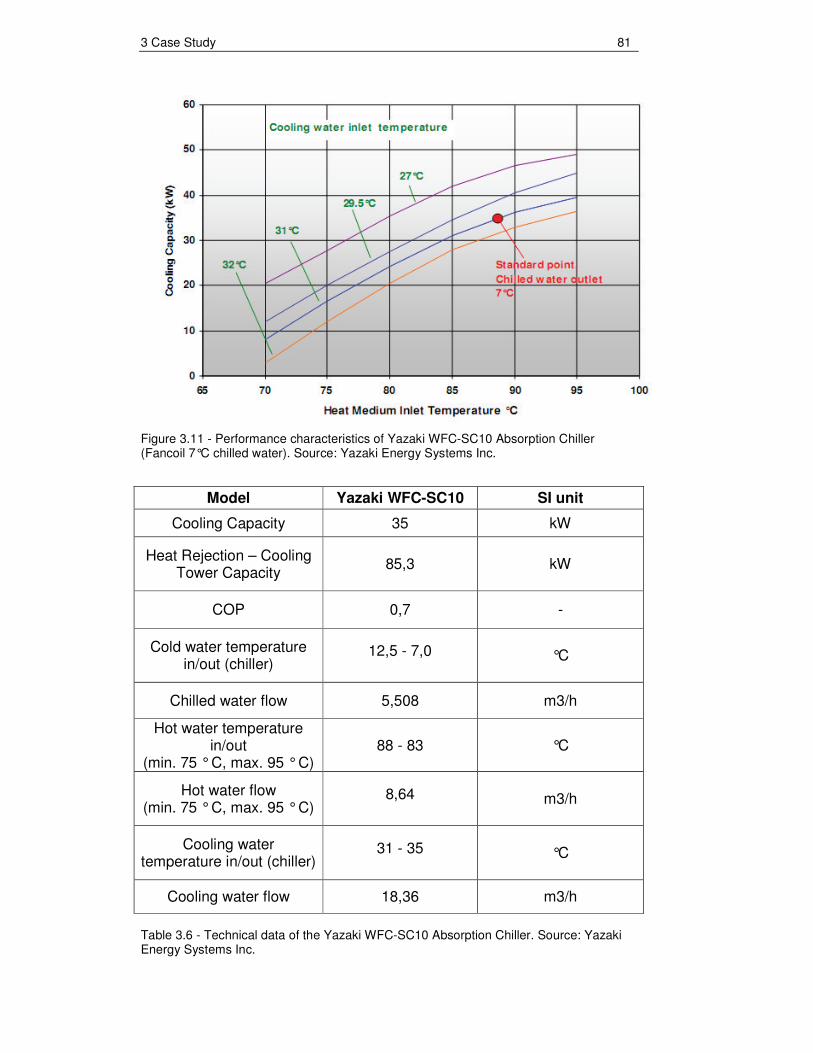
Figure 3.11 - Performance characteristics of Yazaki WFC-SC10 Absorption Chiller (Fancoil 7°C chilled water). Source: Yazaki Energy Systems Inc.
Model Yazaki WFC-SC10 SI unit
Cooling Capacity 35 kW
Heat Rejection – Cooling Tower Capacity
85,3
kW
COP 0,7 -
Cold water temperature in/out (chiller)
12,5 - 7,0 °C
Chilled water flow 5,508 m3/h
Hot water temperature in/out
(min. 75 ° C, max. 95 ° C) 88 - 83 °C
Hot water flow (min. 75 ° C, max. 95 ° C)
8,64 m3/h
Cooling water temperature in/out (chiller)
31 - 35 °C
Cooling water flow 18,36 m3/h
Table 3.6 - Technical data of the Yazaki WFC-SC10 Absorption Chiller. Source: Yazaki Energy Systems Inc.
3 Case Study 82
Further Technical data and information see appendix A2.
A COP of 0,7 and a capacity of 35 kW is reached by the chiller operation point at
88°C hot water inlet temperature and 31°C cooling water in inlet temperature. The
performance of the collector field regarding the hot water driving temperatures is
shown in the sub-section III.2.2.3 Heat production sub-system.
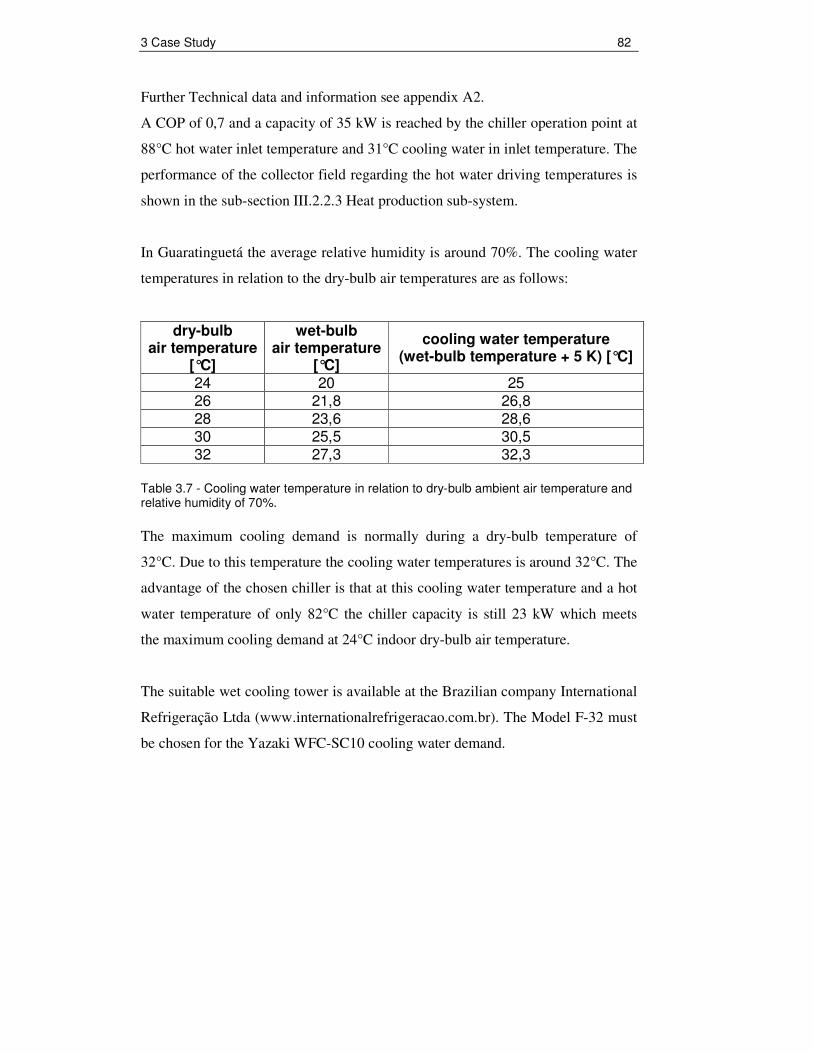
In Guaratinguetá the average relative humidity is around 70%. The cooling water
temperatures in relation to the dry-bulb air temperatures are as follows:
dry-bulb air temperature
[°C]
wet-bulb air temperature
[°C]
cooling water temperature (wet-bulb temperature + 5 K) [°C]
24 20 25 26 21,8 26,8 28 23,6 28,6 30 25,5 30,5 32 27,3 32,3
Table 3.7 - Cooling water temperature in relation to dry-bulb ambient air temperature and relative humidity of 70%.
The maximum cooling demand is normally during a dry-bulb temperature of
32°C. Due to this temperature the cooling water temperatures is around 32°C. The
advantage of the chosen chiller is that at this cooling water temperature and a hot
water temperature of only 82°C the chiller capacity is still 23 kW which meets
the maximum cooling demand at 24°C indoor dry-bulb air temperature.
The suitable wet cooling tower is available at the Brazilian company International
Refrigeração Ltda (www.internationalrefrigeracao.com.br). The Model F-32 must
be chosen for the Yazaki WFC-SC10 cooling water demand.
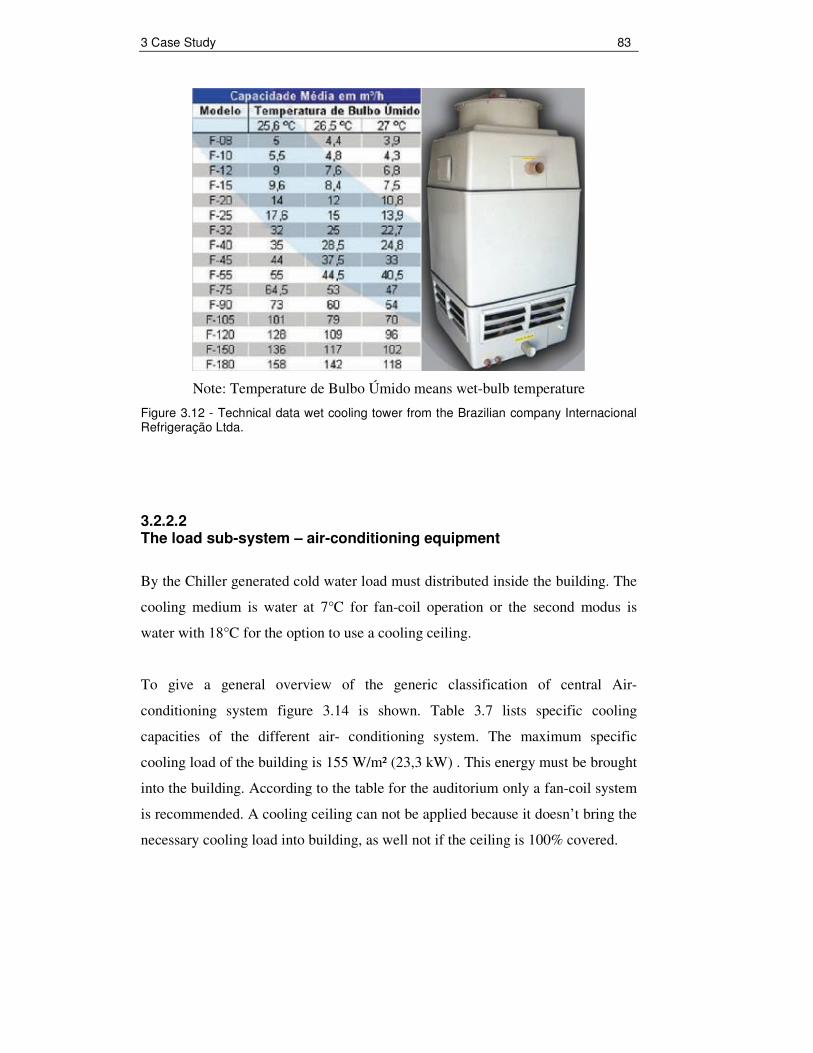
3 Case Study 83
Note: Temperature de Bulbo Úmido means wet-bulb temperature
Figure 3.12 - Technical data wet cooling tower from the Brazilian company Internacional Refrigeração Ltda.
3.2.2.2 The load sub-system – air-conditioning equipment
By the Chiller generated cold water load must distributed inside the building. The
cooling medium is water at 7°C for fan-coil operation or the second modus is
water with 18°C for the option to use a cooling ceiling.
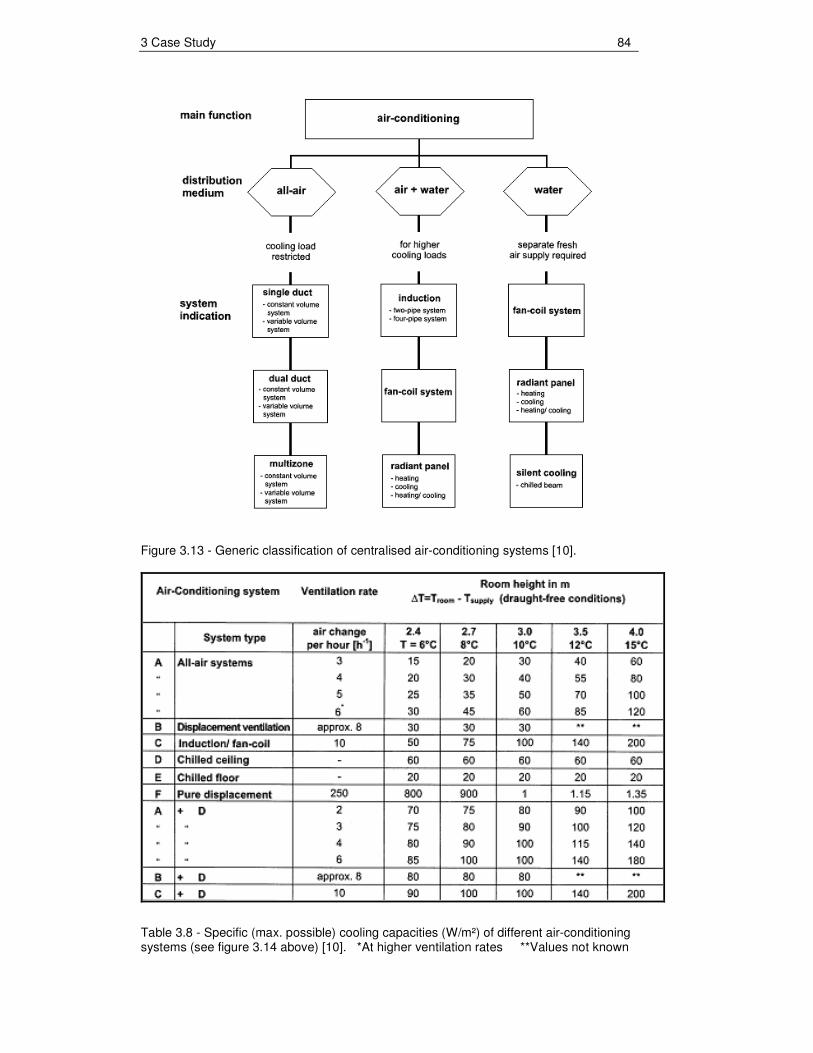
To give a general overview of the generic classification of central Air-
conditioning system figure 3.14 is shown. Table 3.7 lists specific cooling
capacities of the different air- conditioning system. The maximum specific
cooling load of the building is 155 W/m² (23,3 kW) . This energy must be brought
into the building. According to the table for the auditorium only a fan-coil system
is recommended. A cooling ceiling can not be applied because it doesn’t bring the
necessary cooling load into building, as well not if the ceiling is 100% covered.
3 Case Study 84
Figure 3.13 - Generic classification of centralised air-conditioning systems [10].
Table 3.8 - Specific (max. possible) cooling capacities (W/m²) of different air-conditioning systems (see figure 3.14 above) [10]. *At higher ventilation rates **Values not known
3 Case Study 85
For cooling loads higher than 45 W/m² it must be chosen: air cooling based on
minimum required fresh air quantity (e.g. 30 to 50 m³/h per person) and secondary
cooling (water-based); e.g. system C (fan-coil) or A + D. The aim is to save costs
for ducting and energy for transportation of air and to avoid possible draughts
when introducing too much air into the room. Possible draught can be avoided by
using, for example, high-induction air outlets in the wall or swirl outlets in a
ceiling [10].
In tropical climate conditions the specific cooling capacity of a cooling ceiling is
as well limited, due to the high relative humidity. At a relative humidity of 70 -
80% only cold water of about 20°C can be used as medium, since temperatures
�18°C falls below the dew point and create condensation at cooling panel. For
safety the water temperature in the cooling panels must be is always 2 K above
the dew point temperature. Therefore, ∆T is limited to 4 K at an indoor
temperature of 24°C. The maximum flow rate of cooling panel, here type Carat H-
84, is around 0.5 l/s. Due to a following calculation the possible cooling capacity
can be determined.
( ) wQ m t C T= ⋅ ⋅∆ (Eq. 3.1)
0,5 / 4186,8 / 4 8,3Q l s Ws kgK K kW= ⋅ ⋅ =
Cw – heat capacity of water
The maximum cooling load could of the auditorium could be only 8,3 kW, this
means the specific cooling at 150m² would be 55 W/m². As well, this calculation
demonstrates the limitation of active night-cooling applications within the tropics.
Active night-cooling exploit the colder night air temperatures to cool water due to
e.g. a wet cooling tower. During the day the stored chilled water circulates
through a cooling ceiling.
It must be added that the water temperature is limited by relative humidity and
temperature of the ambient air. The water temperature depends on wet-bulb
temperature +3-5 K. In tropical cities the relative humidity goes up to 80 - 90% at
night and only at the day it decreases to 60 -70%, however at an high air
temperature, hence to potential to cool the water till 15-20°C does not often exist.
3 Case Study 86
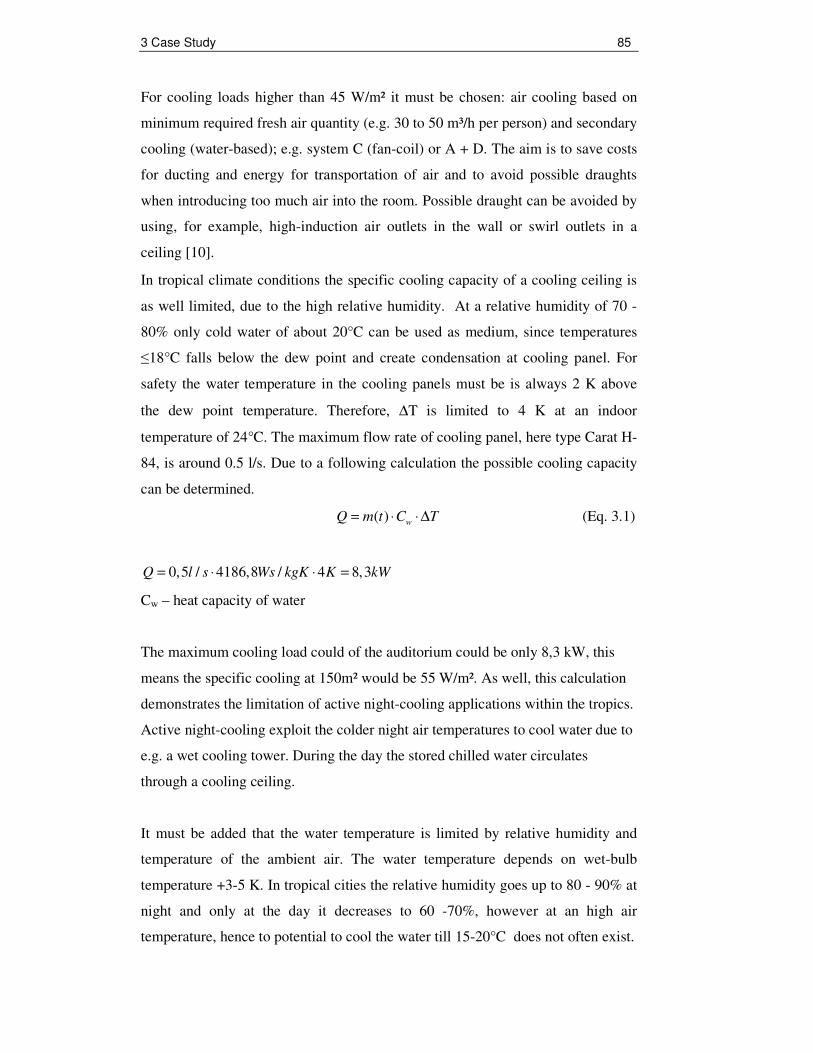
Figure 3.14 - Example of a Cooling panel Type Carat from Lindab Climate GmbH Source: Technical Data sheets
In Germany cooling ceilings are often applied due to lower noise emissions and
no energy consumption, despite higher investment costs. Only during 3% of
annual operation hours condensation occurs. Through an alarm system which
stops the water circulation condensation drops are avoided.
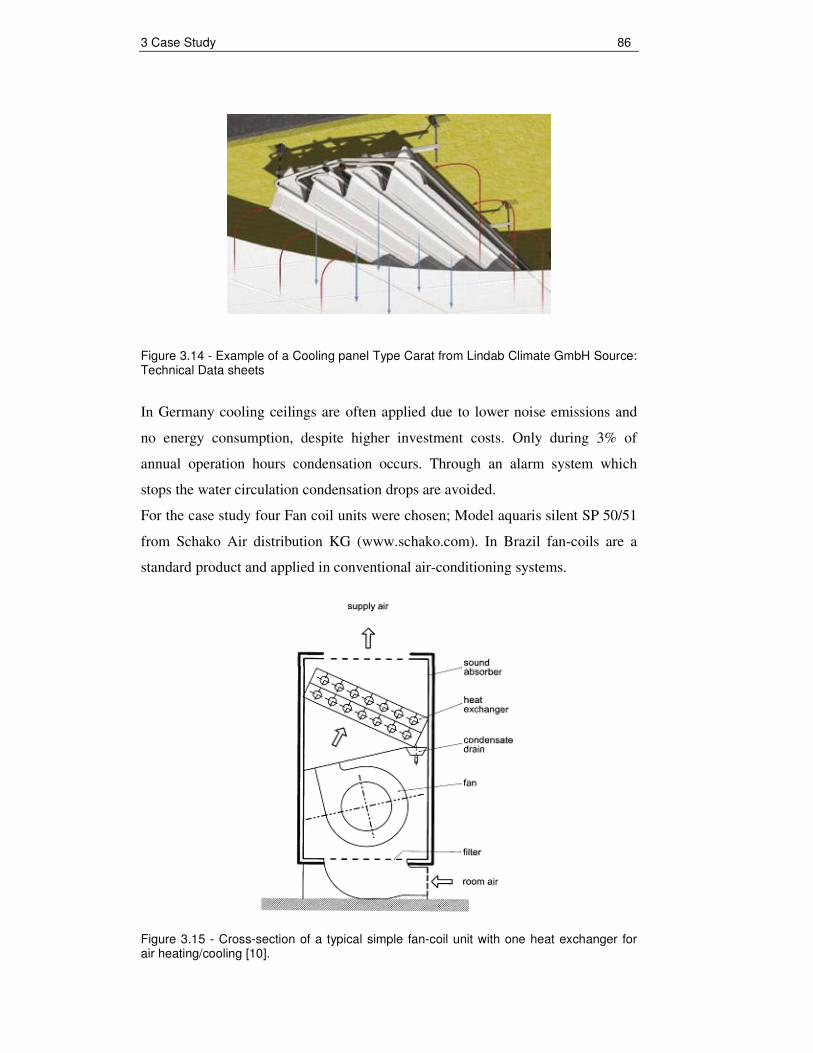
For the case study four Fan coil units were chosen; Model aquaris silent SP 50/51
from Schako Air distribution KG (www.schako.com). In Brazil fan-coils are a
standard product and applied in conventional air-conditioning systems.
Figure 3.15 - Cross-section of a typical simple fan-coil unit with one heat exchanger for air heating/cooling [10].
3 Case Study 87
3.2.2.3 Heat production sub-system
This chapter deals with the heat production sub-system. The hot water driving
temperature is provided principally by the thermal solar collector field. During
cloudy days a thermal driven Back-up system can be used, which heats up the hot
water storage due to a gas burner. Another way to secure the thermal comfort is to
apply a conventional electric driven Back-up system. In this chapter both types
are compared.
3.2.2.3.1 Thermal solar collector comparison
To find out the performance-cost relation of different collectors, it is important to
simulate these under the specific climate conditions.
The collector’s manufacturers usually specify only the maximum point of the
collector performance. This point is rather of theoretical importance. A
simulation with the specific hourly data at side tells us more about reality
behaviour and suitability.
To simulate the behaviour of the collector the solar efficiency equation is applied
(see sub-section 2.1.3 Solar thermal Collector Equation 2.1). The Simulation
depends on the hourly global irradiation, the hourly ambient air temperature and
the average collector hot water temperature. The hourly values are from the
Meteonorm database.
As average collector hot water temperature tm (average between input and output
temperature) were 85°C chosen. Because the operation point of the Chiller is at
88°C inlet temperature (collector output Temperature) and at around 83°C at the
outlet (collector input temperature). Thus results a ∆T, between average ambient
air temperature of ta = 25°C und average collector hot water temperature of tm =
85°C, of 60 K.
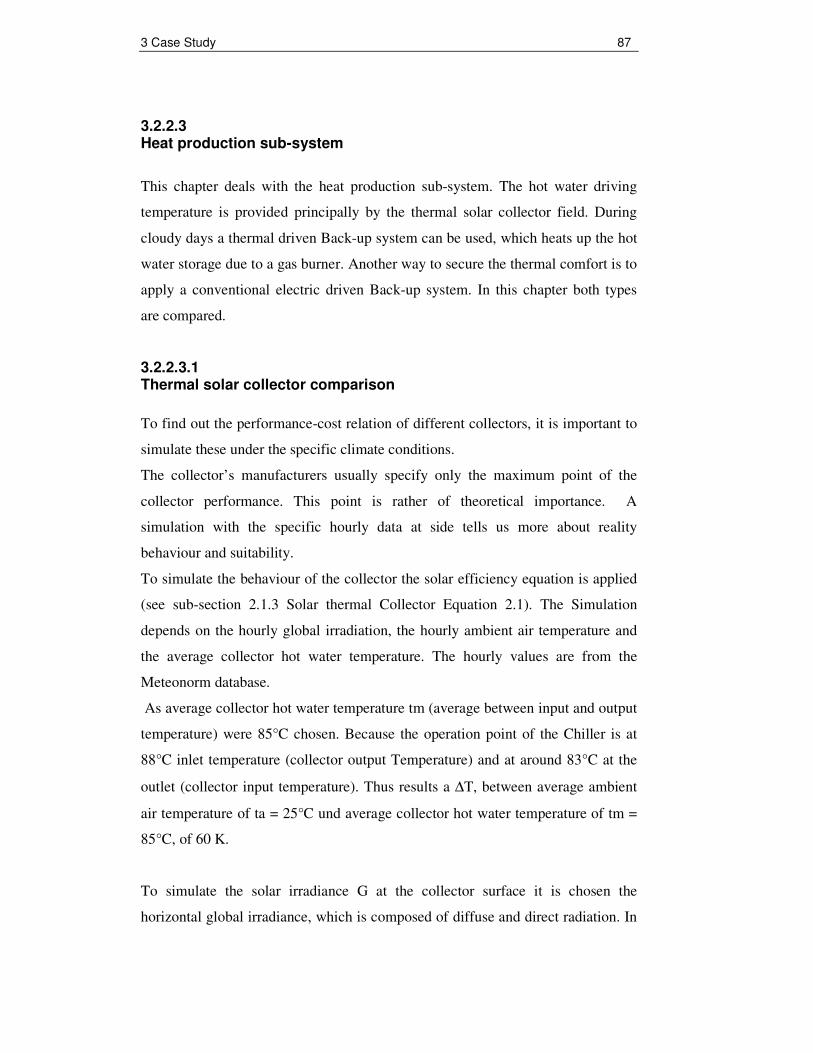
To simulate the solar irradiance G at the collector surface it is chosen the
horizontal global irradiance, which is composed of diffuse and direct radiation. In
3 Case Study 88
summer, the highest solar yield is reached due to a horizontal position of the
collector. As well during the summer season the highest cooling demand occurs.
Figure 3.16 - Schematic illustration showing the inclination of the sun to the Earth surface in Guaratinguetá [28].
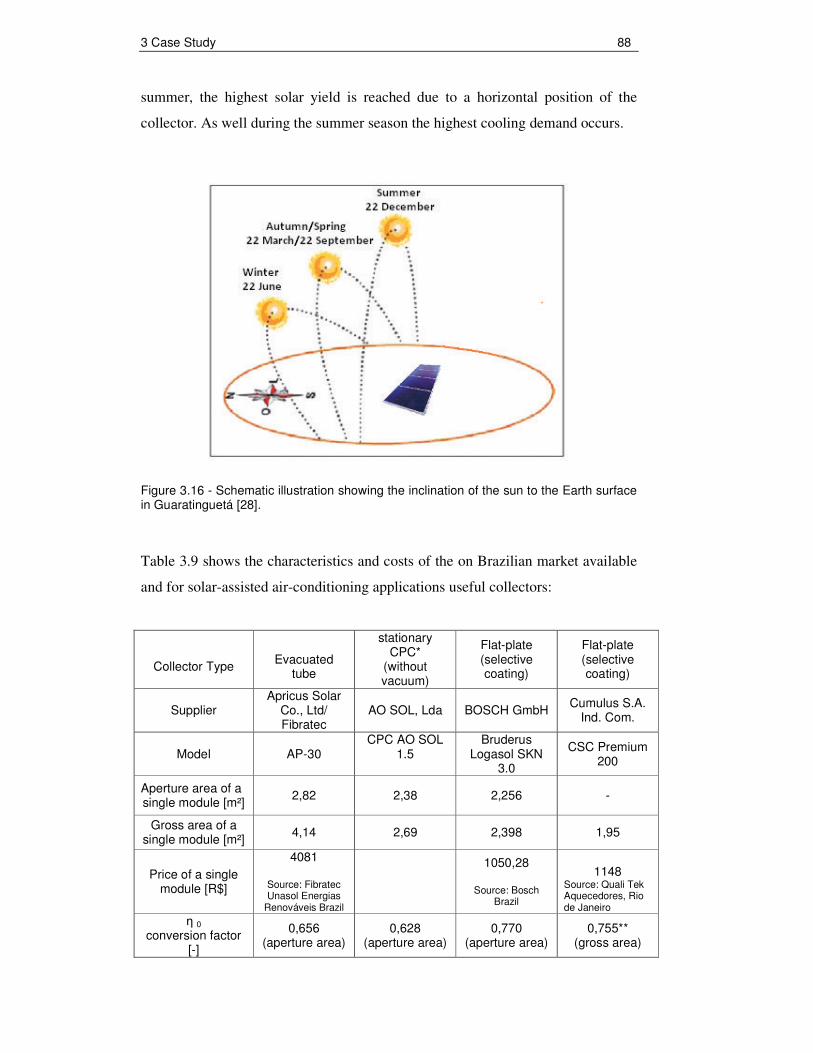
Table 3.9 shows the characteristics and costs of the on Brazilian market available
and for solar-assisted air-conditioning applications useful collectors:
Collector Type
Evacuated
tube
stationary CPC*
(without vacuum)
Flat-plate (selective coating)
Flat-plate (selective coating)
Supplier Apricus Solar
Co., Ltd/ Fibratec
AO SOL, Lda BOSCH GmbH Cumulus S.A.
Ind. Com.
Model AP-30 CPC AO SOL
1.5
Bruderus Logasol SKN
3.0
CSC Premium 200
Aperture area of a single module [m²]
2,82 2,38 2,256 -
Gross area of a single module [m²]
4,14 2,69 2,398 1,95
Price of a single module [R$]
4081
Source: Fibratec Unasol Energias
Renováveis Brazil
1050,28
Source: Bosch Brazil
1148
Source: Quali Tek Aquecedores, Rio de Janeiro
� 0
conversion factor [-]
0,656 (aperture area)
0,628 (aperture area)
0,770 (aperture area)
0,755** (gross area)
3 Case Study 89
a1 heat transfer
coefficient [W/(m²K)]
2,063 (aperture area)
1,47 (aperture area)
3,681 (aperture area)
4,717** (gross area)
a2 Temperature
depending heat transfer coefficient
[W/(m²K²)]
0,006 (aperture area)
0,0220 (aperture area)
0,0173 (aperture area)
not available**
� (∆T=60K and G=500W/m²)
0,37 0,29 0,32
0,19
Equation 2.6
�
(∆T=60K and G=1000 W/m²)
0,51 0,46 0,55 0,47
Equation 2.6
Specific costs
�/m² (R$/m²) area referred to
the collector gross area.
985,75 R$/m²
223 �/m² (conversion
factor 2.7 R$/�)
602,1 R$/m²
437,98 R$/m²
574 R$/m²
*source of the data [10].
** according GREEN Solar PUC-Minas (Prof. Elizabeth Duarte Pereira) the a2-value of
the Cumulus CSC Premium 200 Collector is negative and thus only the Equation 2.6 (see
sub-section 3.1.3) can be applied. The INMETRO/PROCEL test procedure the efficiency
values are referring to the gross area of the collectors.
Table 3.9 - Characteristic values and cost of solar collector typologies.
Except the CPC collector all collectors are available in Brazil. Through inside
information the CPC collector will be at the Brazilian market in near future. The
efficiency values are taken from the each collector test report according EN
12975-2:2006. The test reports are in the appendix A3. The Cumulus CSC
Premium 200 Collector was tested according the Brazilian procedure, hence there
is no a2-Value and the referring collector area is the cross area, instead according
EN standard the aperture area. Therefore this collector can not be exactly
compared with the others. Nevertheless, the existing efficiency values and specific
cost demonstrates that this collector can not compete with the, as well economic,
Bosch Bruderus Logasol SKN 3.0 Collector. Because of that the Cumulus
collector is not in Simulation.
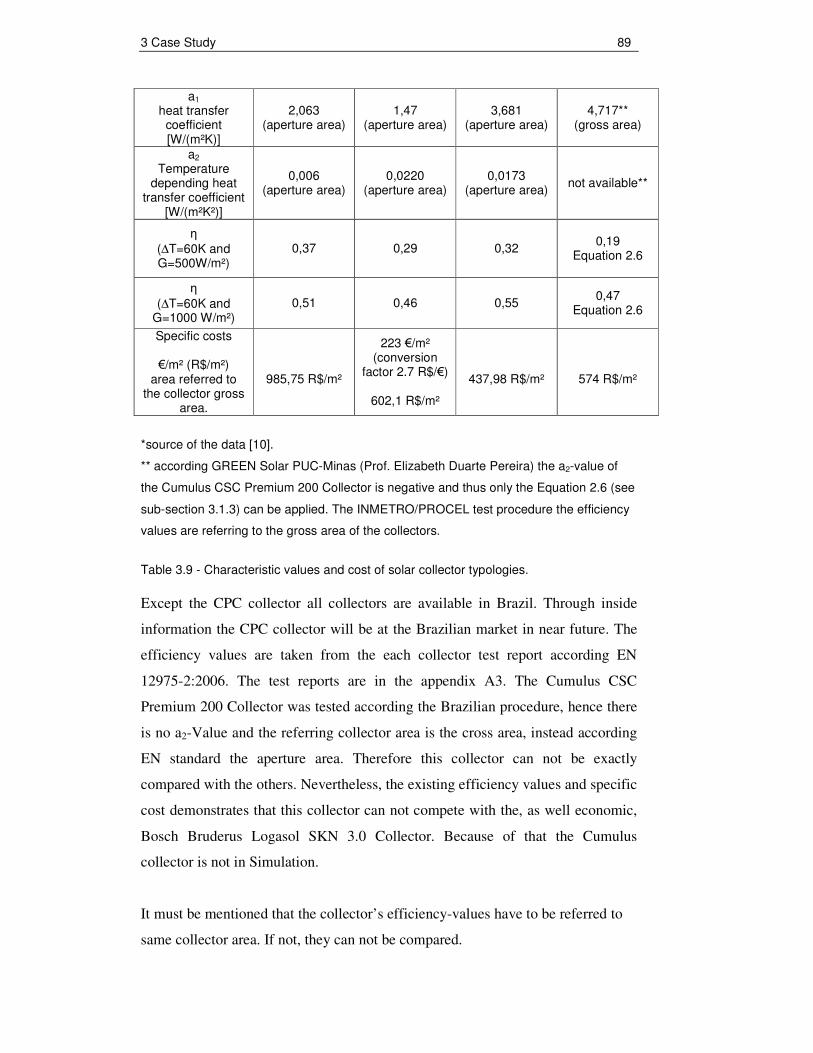
It must be mentioned that the collector’s efficiency-values have to be referred to
same collector area. If not, they can not be compared.
3 Case Study 90
Figure 3.17 - Definition of collector’s areas (to be multiplied by the length) [7]
0
200
400
600
800
1000
1200
19.Jan 20.Jan 21.Jan 22.Jan 23.Jan 24.Jan 25.Jan
so
lar
yie
ld [
W/m
²]
0
5
10
15
20
25
30
35
am
bie
nt
tem
pe
ratu
re [
°C]
horizontal solar irradiance Bosch Bruderus SKS 3.0 Flat-Plate Apricus AP-30 Evacuated Tube AO SOL CPC 1.5 T ambient
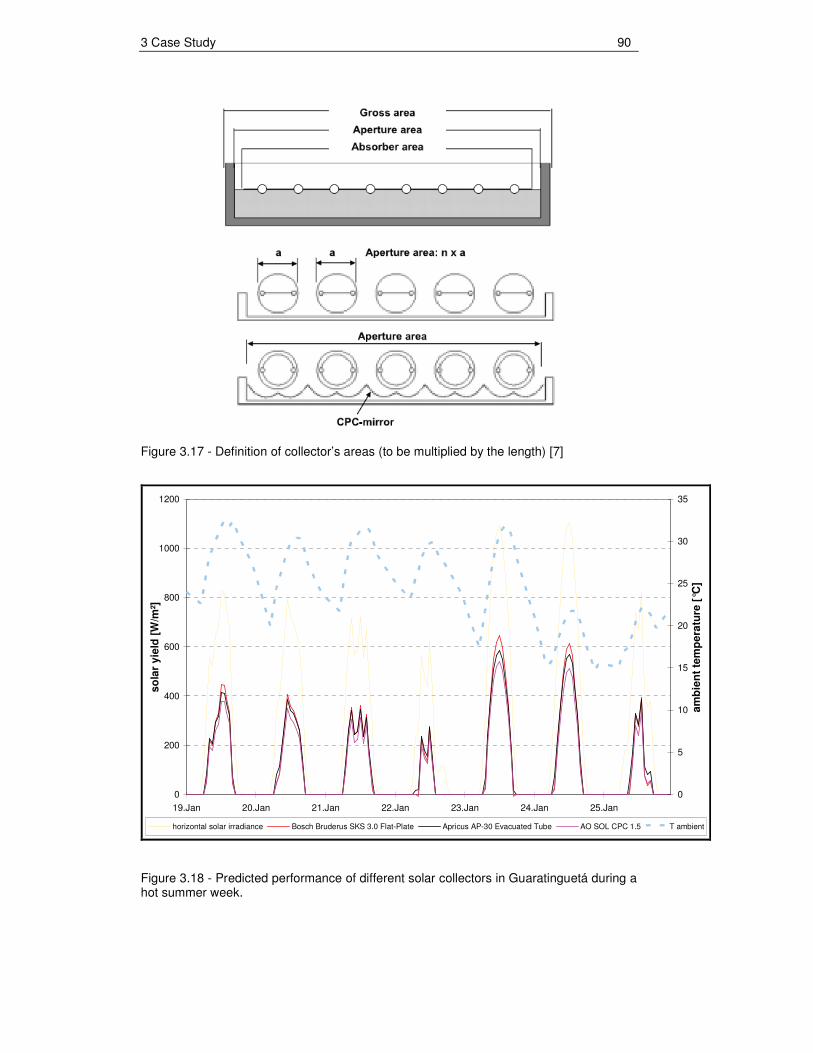
Figure 3.18 - Predicted performance of different solar collectors in Guaratinguetá during a hot summer week.
3 Case Study 91
The simulation demonstrates that the Bosch Bruderus SKN 3.0 Flat-Plate
collector at high solar irradiance and ambient temperature reaches the best result.
At lower ambient temperatures and solar irradiance the collector is equal to the
Apricus AP-30 Evacuated Tube collector, which costs the double.
Therefore the Bosch Bruderus SKN 3.0 Collector has the best performance-cost
relation of all simulated collectors and thus highly recommendable for the solar-
assisted air-conditioning project in Guaratinguetá.
3.2.2.3.2 Back-up and hot water storage
The main purpose of the storage in a solar-assisted air-conditioning system is to
overcome mismatches between solar gains and cooling loads. The most common
application is the integration of a hot water buffer tank in the heating cycle of the
thermally driven cooling equipment [10].
Another form is to store the excess cooling power in a cold storage unit.
There is one company, SolarNext AG, who offers for the pilot-project the
appropriate cold production sub-system including storage system. The offered
solar cooling ‘kit’ from the company SolarNext AG (see Appendix A4) contains
2000 litre cold water storage and a 2000 litre hot water storage. The hot water
flow (min. 75 °C, max. 95°C) driving the chiller at 8,64 m³/h and the cold water
flow 5,5 m³/h. Due to an rough estimation, a capacity of 15-20 kW can be
maintained within 2 hours. Provided that, the hot water tank has a total water
temperature of 95°C and the cold water tank of 7°C.
A solar cooling system can not cover cooling loads during very cloudy days or at
night, thus a back-up system is necessary.
3 Case Study 92
3.2.2.3.2.1 Electrically driven compression chiller back-up
For the auditorium in Guaratinguetá the back-up system consists of four split air
conditioning system with a total capacity of 35 kW (10 TR). There is no central
air conditioning system with one compression chiller foreseen.
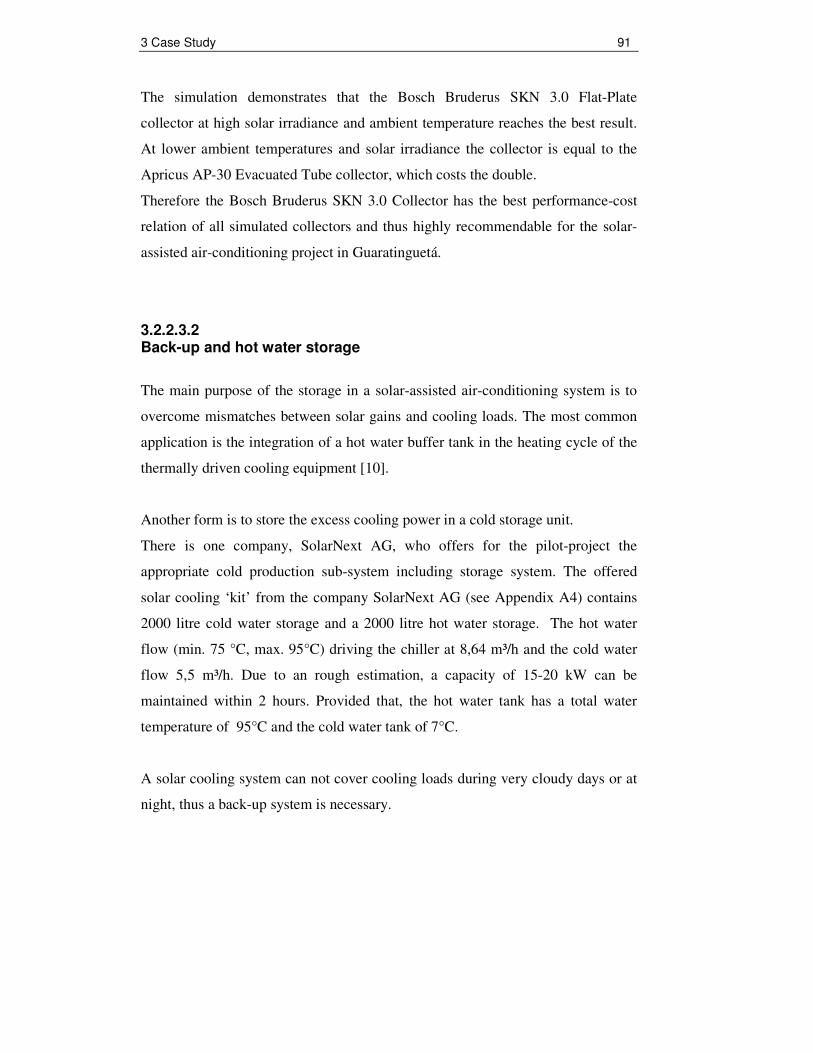
In any case, the back-up system should be NOT a fossil fueled heat source, as this
option causes disadvantages in primary energy consumption and in greenhouse
gas emissions, compared to a conventional compression chiller based solution.
Thus, a non-regenerative based back-up system, where necessary, should consist
of an electrically driven compression chiller, as shown in the example sketch of
Figure below [8].
Figure 3.19 - Simplified scheme of a solar cooling system, assisted by a conventional electrically driven compression chiller. If cooling demand occurs during night, the compression chiller is operated (modified) [8].
3 Case Study 93
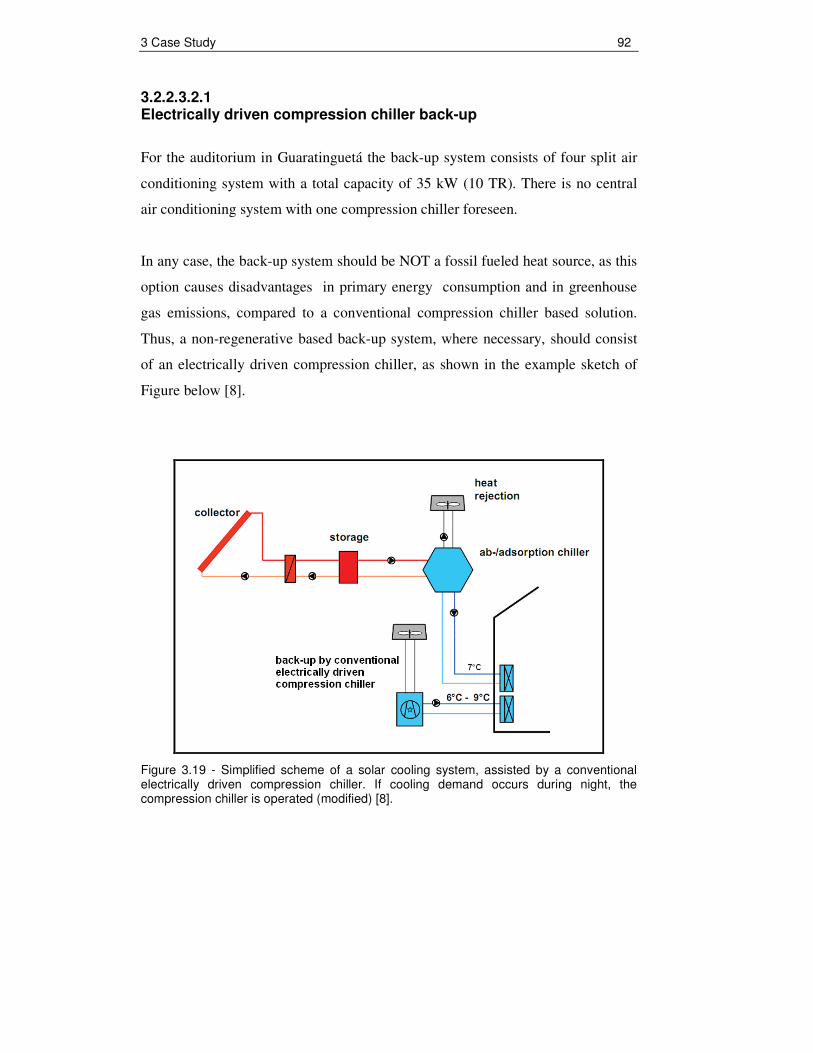
Figure 3.20a - Simple comparison of CO2 emissions of a compression chiller system and of a solar thermally driven chiller system. The conversion factor of 0.28 kg CO2 emission per kWh electricity consumed from the grid is used in this estimation [8].
Figure 3.20b - In comparison to Figure 3.20a, 15% of the driving heat for the thermally driven chiller is based on fossil fuels, here natural gas [8].
The conversion factor of 0.28 kg CO2 per kWh electricity consumed from the grid
is used in this estimation. Furthermore: gas boiler efficiency 0.9, 0.2 kg CO2
emission per kWh heat from the boiler. With this small share of fossil fuels on the
heat input, the CO2 emission have already increased to the emission level of the
conventional system (figure 3.20a) [8].
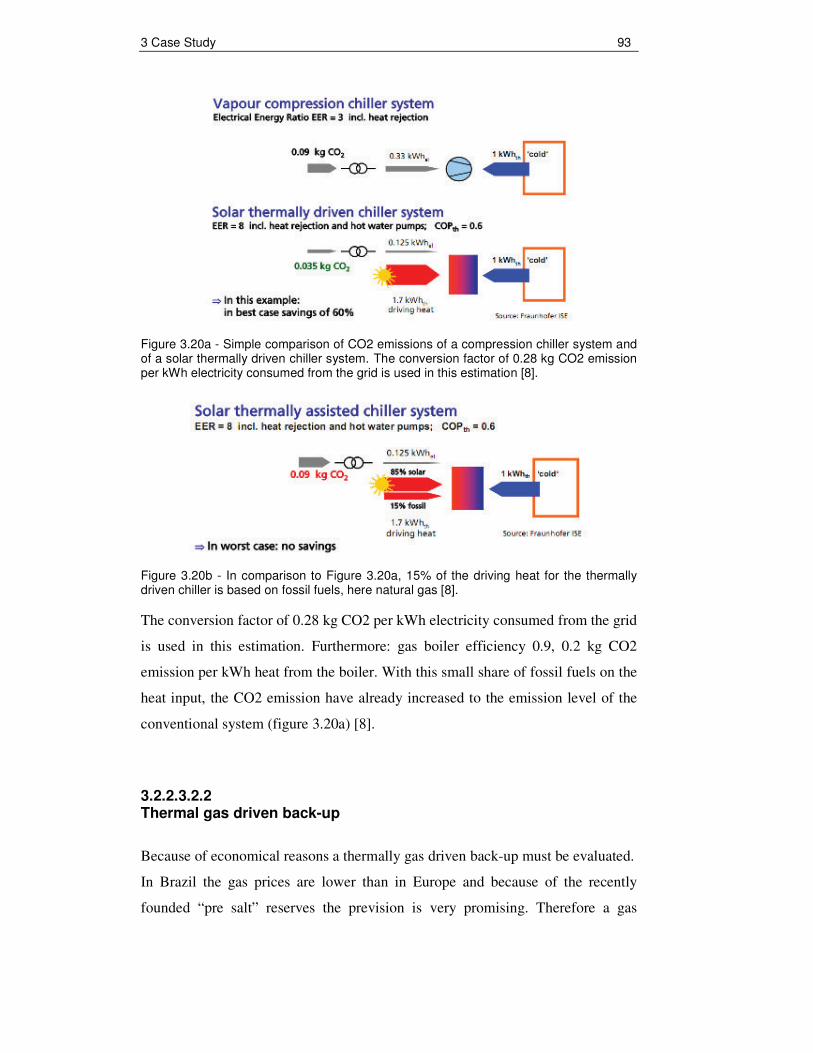
3.2.2.3.2.2 Thermal gas driven back-up
Because of economical reasons a thermally gas driven back-up must be evaluated.
In Brazil the gas prices are lower than in Europe and because of the recently
founded “pre salt” reserves the prevision is very promising. Therefore a gas
3 Case Study 94
driven back-up could be an alternative to Conventional electrically driven
compression chiller back-up.
Figure 3.21 - Simplified scheme of a solar cooling system, assisted by a thermal gas back-up (modified) [8].
Before the economical feasibility calculation can be done, the gas demand must
be calculated:
The Yazaki WFC-SC10 absorption chiller needs a hot water flow of 8,64 m³/h for
35 kW cooling capacity . The necessary Temperature elevation is ∆T 5 K (88°C
chiller inlet and 83°C Chiller outlet). This results a energy demand of 50 kW (50
kW*COP 0,7 = 35kW or Q = m(t) * Cw ∆T = 2,4 l/s * 4186,8 Ws/kgK * 5K = 50
kW). A efficient gas-fired burner has an efficiency of 98%, to facilitate the
calculation 100% are assumed. The Energy demand for one day (9 h from 8 till
17 o’clock) is 450 kWh (9h*50kW).
The assumed calorific value for domestic gas is 11 kWh/m³, thus the consumption
is 41 m³/day (450 kWh/11 kWh/m³). Hence 1257 m³ in one month (30 days).
The domestic gas supplier in Guaratinguetá is the Comgas company from São
Paulo. 1 m³ domestic natural gas cost according a price table from 29.05.2009
(www.comgas.com.br/tarifas.asp) 6,14 R$/m³ incl. taxes. As yet there is no
3 Case Study 95
domestic gas supply in Guaratinguetá, thus gas cylinders must be applied. The
specific cost is assumed with 7 R$/m³. Therefore the totally cost for driving a 35
KW absorption one month is 8800 R$ (7 R$/m³*1257 m³).
In comparison a 35 kW (35kW / 2.57 COP = 13,6 kW) Split air conditioning
system consumes at the same time 3672 kWh with an electricity tariff in
Guaratinguetá of 0,38 R$/kWh incl. taxes. Source, information February 2008
ANEEL (national electric energy agency - www.aneel.gov.br/area.cfm?idArea=532).
This price was recently confirmed by the Edp Bandeirante Energia company. It
must be mentioned that the Brazilian ICMS tax for residential (mono-phase) tariff
about 200 kWh/month energy consumption is 25 % and not 12%.
Finally, the cost for driving one month a electric driven 35 kW split air-
conditioning system is 1395 R$ (3672 kWh*0,38 R$/kWh). Because of this result
a thermal back up system is until now not economically advantageous. The cost
for maintaining the cooling capacity of 35 kW due to heating up the driving water
for an single-stage absorption chiller is around 6 times higher than to generate the
same cooling capacity with an electric driven split air- conditioning system. It
must be added that the investment cost of a 35 kW split air-conditioning system is
estimated only the half than a 50 kW gas-fired system including water tank.
Normally, the gas burner is directly mounted at the water storage tank.
3.2.2.4 Design and performance of the complete system
According to the technical analyses the appropriate system consists of the Bosch
Bruderus Logasol SKN 3.0 collector and the Yazaki WFC-SC10 (35 kW) single-
stage absorption chiller. These are principal components and the main cost driver
of the acquisition.
First system providers are on the market, offering system sets with appropriate
selected system components. The SolarNext (Germany) company had offered a
complete solar cooling “kit” including the Yazaki WFC-SC10 chiller (quotation
see appendix A4). The advantage of a complete set is that the most important
components are already selected, such as heat rejection system, pumps, valves,
storages and special developed control unit etc. Therefore the planning costs

3 Case Study 96
decrease, due to higher standardisation. Another benefit is that the components are
fitting ideal together e.g. electricity consumption of the heat rejection system is
minimized due to a special controller. SolarNext offers a complete package for the
application in Guaratinguetá including commissioning in Brazil, but except the
collector system and cold distribution (load sub-system).
In the next step the collector area (A) must be calculated. For a first rough
estimation the following equation is applied.
Coll.( T, G)
ColdQA
G COP∆
=η ⋅ ⋅
(Eq. 3.2)
with
QCold = 35.000 W (max. cooling capacity)
�Coll.(∆T, G) = 0,55 (with ∆T = 60 K and G = 1100 W/m²)
G = 1100 W/m² (max. solar irradiance at collector surface)
COP = 0,7
the collector area is 83m² ~ 80m²
With these 80 m² collector field the correlation between building cooling load
(demand) and the cooling capacity (yield) will be simulated and the economic
viability calculation is done in chapter 3.2.3.
In the Excel sheet the cold capacity is calculated by the following equation:
ColdQ G A COPη= ⋅ ⋅ ⋅ (Eq. 3.3)
with
2
0 1 2
( )m a m at t t ta a
G Gη η
− −= − − (Eq. 2.6)
It is assumed that the COP is constant at 0,7, which accords to the chiller
operation point at 88°C water inlet temperature and 31°C cooling water
temperature. Therefore the in collector efficiency equation assumed Collector
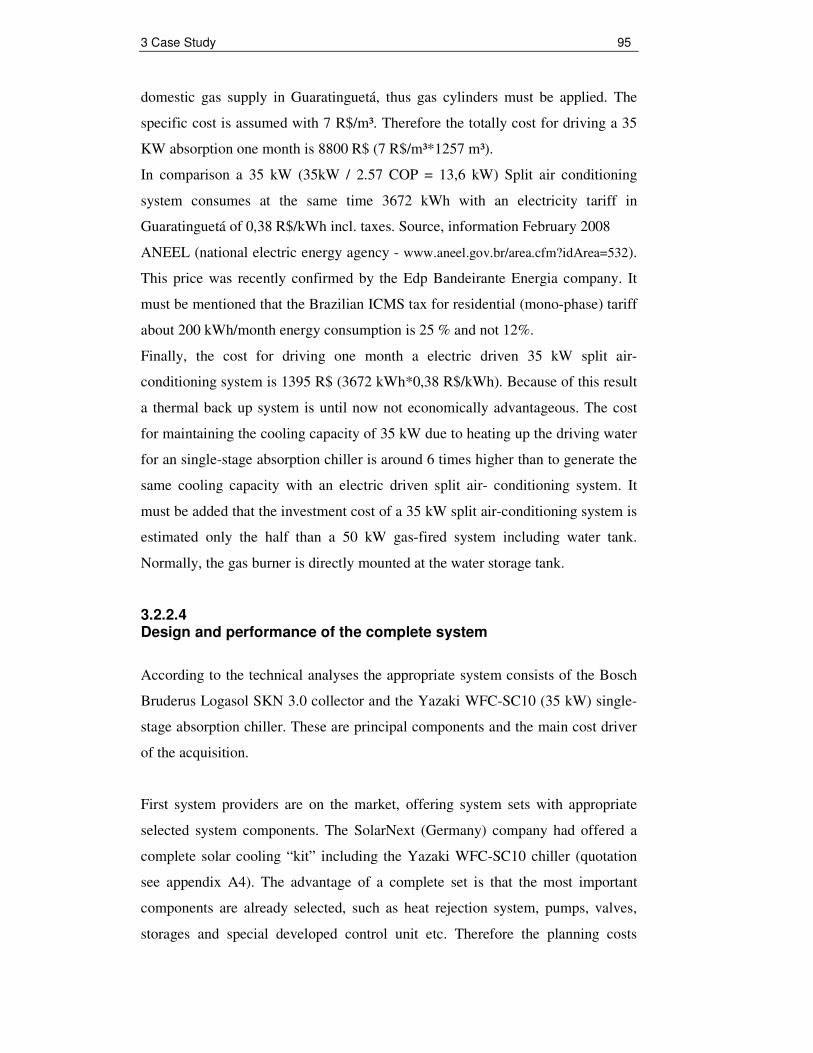
3 Case Study 97
average water temperature (tm) is 85°C (88°C in / ca. 83°C out). The ambient
temperature (ta) and solar irradiance (G) is applied hourly.
Figure 3.22 - Snapshot of generic spreadsheet
0
5
10
15
20
25
30
35
40
19.Jan 20.Jan 21.Jan 22.Jan 23.Jan 24.Jan 25.Jan
[kW
]
0
5
10
15
20
25
30
35
[°C
]
Coolind Load Cooling Capacity T ambient
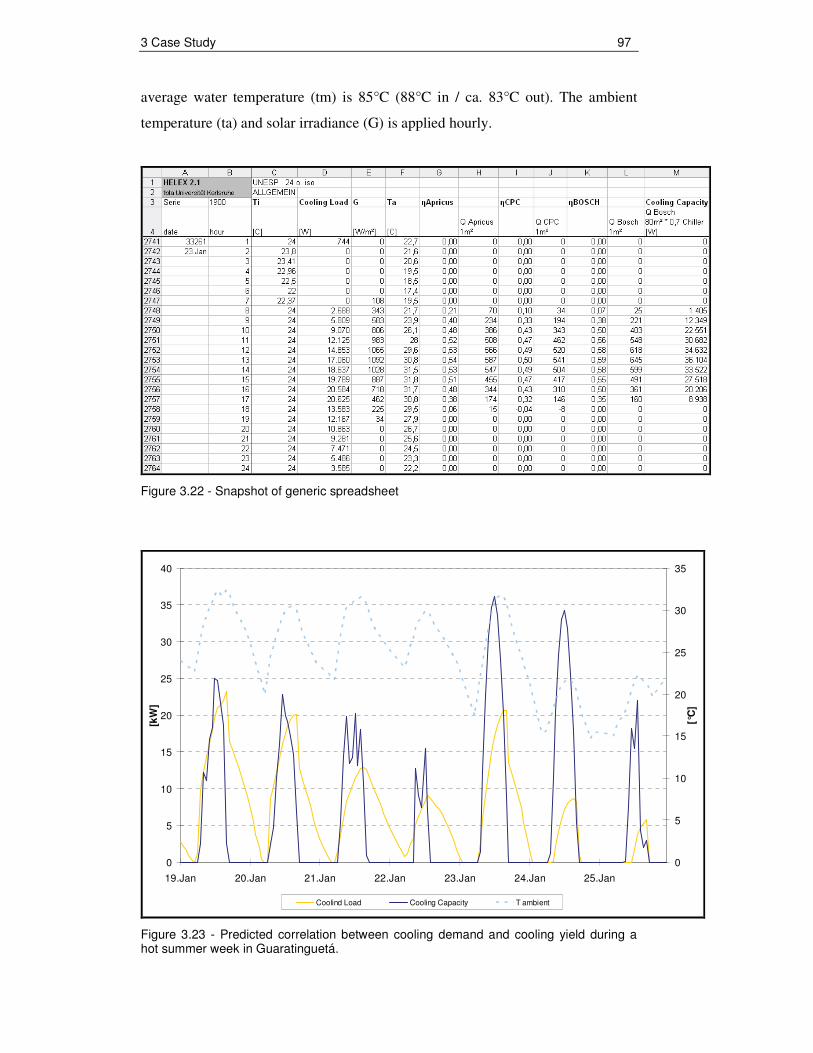
Figure 3.23 - Predicted correlation between cooling demand and cooling yield during a hot summer week in Guaratinguetá.
3 Case Study 98
0
5
10
15
20
25
1 2 3 4 5 6 7 8 9 10 11 12 13 14 15 16 17 18 19 20 21 22 23 24
[kW
]
0
5
10
15
20
25
30
35
[°C
]
Coolind Load Cooling Capacity T ambient
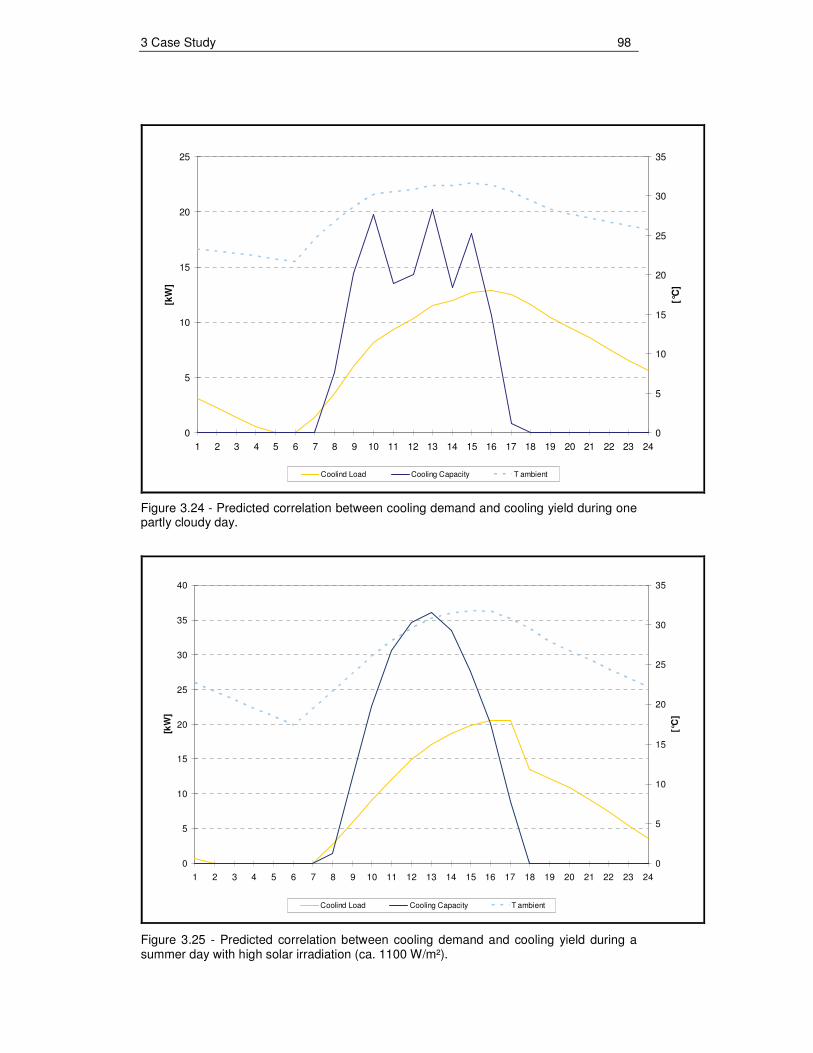
Figure 3.24 - Predicted correlation between cooling demand and cooling yield during one partly cloudy day.
0
5
10
15
20
25
30
35
40
1 2 3 4 5 6 7 8 9 10 11 12 13 14 15 16 17 18 19 20 21 22 23 24
[kW
]
0
5
10
15
20
25
30
35
[°C
]
Coolind Load Cooling Capacity T ambient
Figure 3.25 - Predicted correlation between cooling demand and cooling yield during a summer day with high solar irradiation (ca. 1100 W/m²).
3 Case Study 99
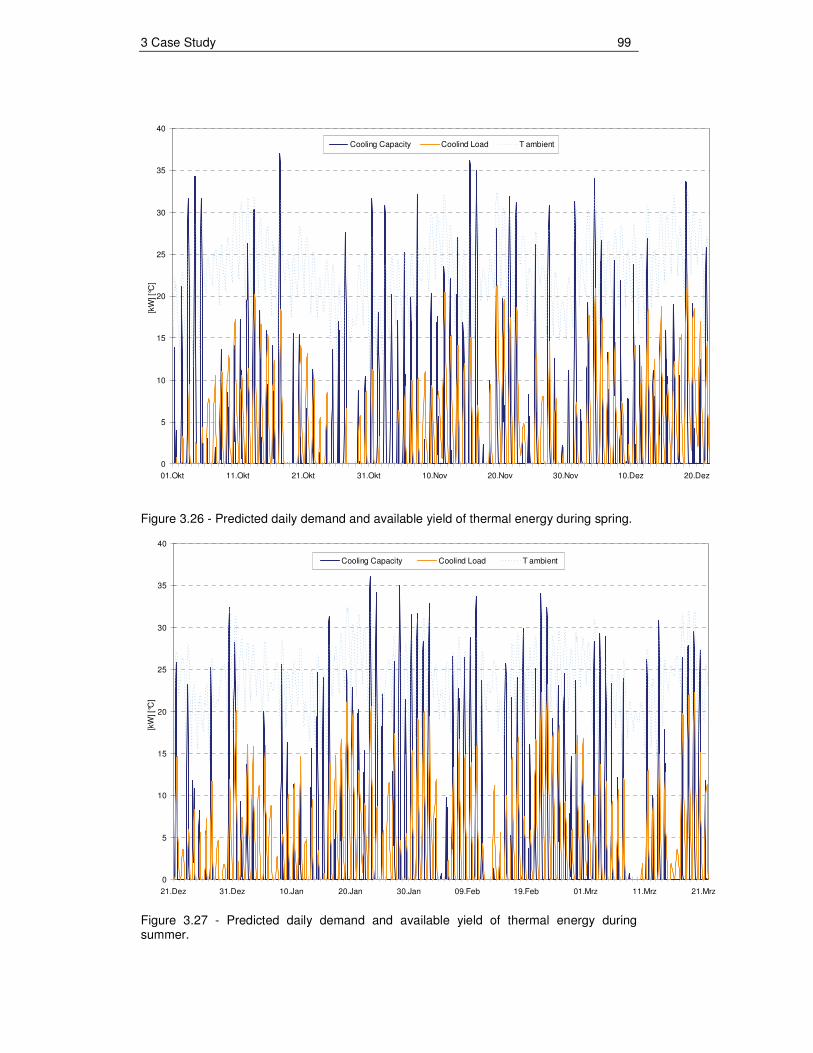
Figure 3.26 - Predicted daily demand and available yield of thermal energy during spring.
Figure 3.27 - Predicted daily demand and available yield of thermal energy during summer.
0
5
10
15
20
25
30
35
40
21.Dez 31.Dez 10.Jan 20.Jan 30.Jan 09.Feb 19.Feb 01.Mrz 11.Mrz 21.Mrz
[kW
] [°
C]
Cooling Capacity Coolind Load T ambient
0
5
10
15
20
25
30
35
40
01.Okt 11.Okt 21.Okt 31.Okt 10.Nov 20.Nov 30.Nov 10.Dez 20.Dez
[kW
] [°
C]
Cooling Capacity Coolind Load T ambient
3 Case Study 100
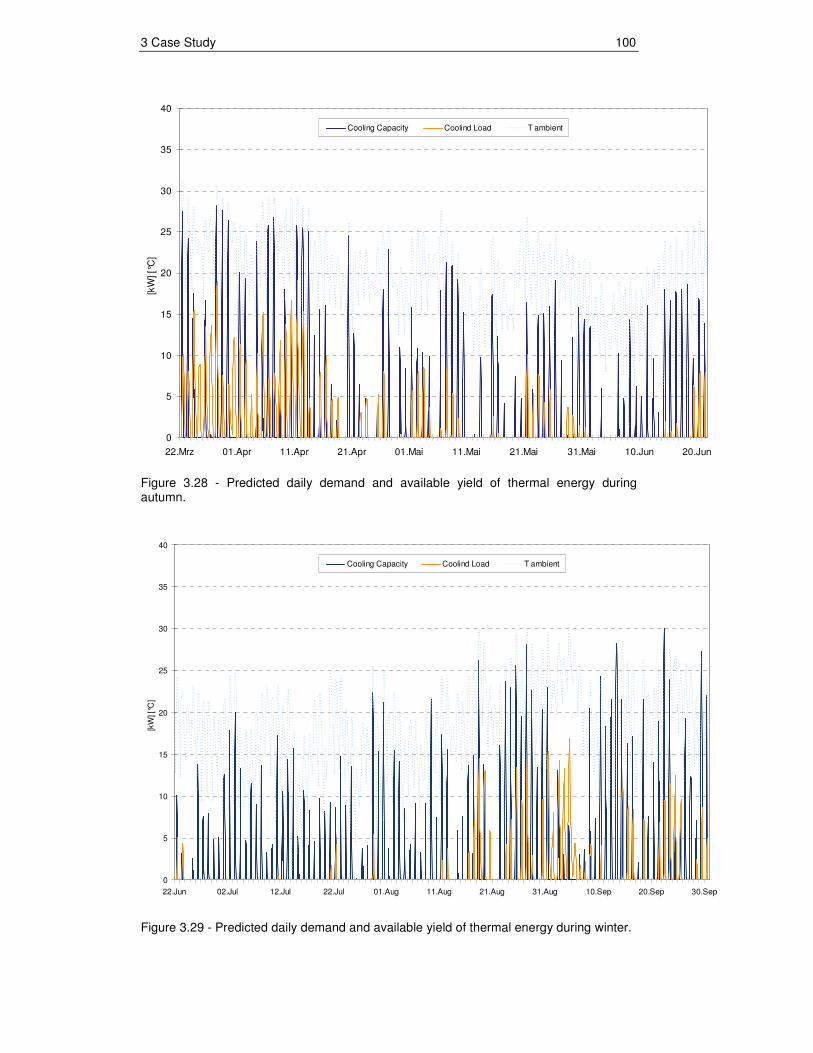
Figure 3.28 - Predicted daily demand and available yield of thermal energy during autumn.
Figure 3.29 - Predicted daily demand and available yield of thermal energy during winter.
0
5
10
15
20
25
30
35
40
22.Jun 02.Jul 12.Jul 22.Jul 01.Aug 11.Aug 21.Aug 31.Aug 10.Sep 20.Sep 30.Sep
[kW
] [°
C]
Cooling Capacity Coolind Load T ambient
0
5
10
15
20
25
30
35
40
22.Mrz 01.Apr 11.Apr 21.Apr 01.Mai 11.Mai 21.Mai 31.Mai 10.Jun 20.Jun
[kW
] [°
C]
Cooling Capacity Coolind Load T ambient
3 Case Study 101
0
500
1000
1500
2000
2500
3000
3500
4000
Jan Feb Mar Apr May Jun Jul Aug Sept Oct Nov Dec
co
olin
g d
em
an
d /
yie
ld [
kW
h]
cooling demand (kWh)
potential cooling yield (kWh)
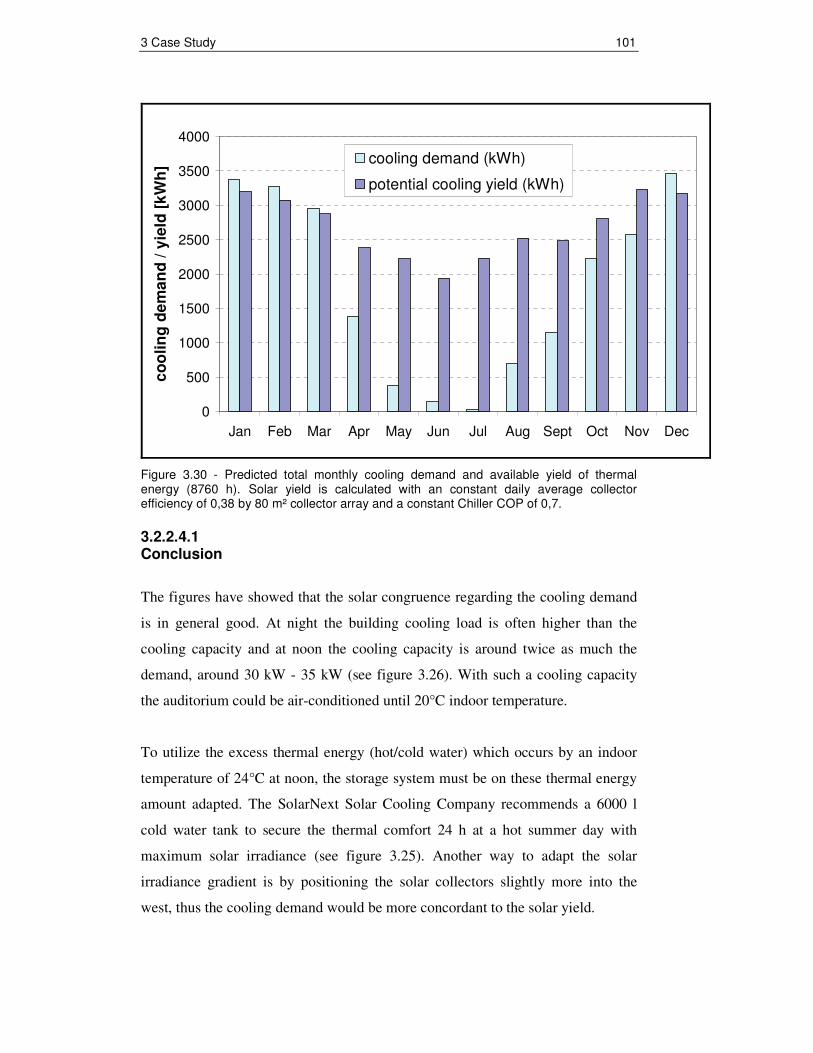
Figure 3.30 - Predicted total monthly cooling demand and available yield of thermal energy (8760 h). Solar yield is calculated with an constant daily average collector efficiency of 0,38 by 80 m² collector array and a constant Chiller COP of 0,7.
3.2.2.4.1 Conclusion
The figures have showed that the solar congruence regarding the cooling demand
is in general good. At night the building cooling load is often higher than the
cooling capacity and at noon the cooling capacity is around twice as much the
demand, around 30 kW - 35 kW (see figure 3.26). With such a cooling capacity
the auditorium could be air-conditioned until 20°C indoor temperature.
To utilize the excess thermal energy (hot/cold water) which occurs by an indoor
temperature of 24°C at noon, the storage system must be on these thermal energy
amount adapted. The SolarNext Solar Cooling Company recommends a 6000 l
cold water tank to secure the thermal comfort 24 h at a hot summer day with
maximum solar irradiance (see figure 3.25). Another way to adapt the solar
irradiance gradient is by positioning the solar collectors slightly more into the
west, thus the cooling demand would be more concordant to the solar yield.
3 Case Study 102
Due to a rough evaluation of solar yield/demand correlation it was investigated
that in around 30 days/year the sun not covers the cooling demand. Hence at these
days the back-up system must run to secure the thermal comfort.
During spring and summer the solar yield and the building cooling demand is very
congruence; only during their winter and autumn is more cooling power generated
than needed. At June and July is an artificial cooling due to a cooling machine
not necessary; at this time the free ventilation of 3000 m³/h is sufficient to
compensate the internal cooling load of 12 kW. During this time the ambient air
temperature at daytime is often below 24°C.
At the winter season it makes sense to utilise the thermal solar energy for water
heating. The hot water can be used for taking shower, cooking or washing
machines. At the UNESP University it could supply the refectory dishwashers.
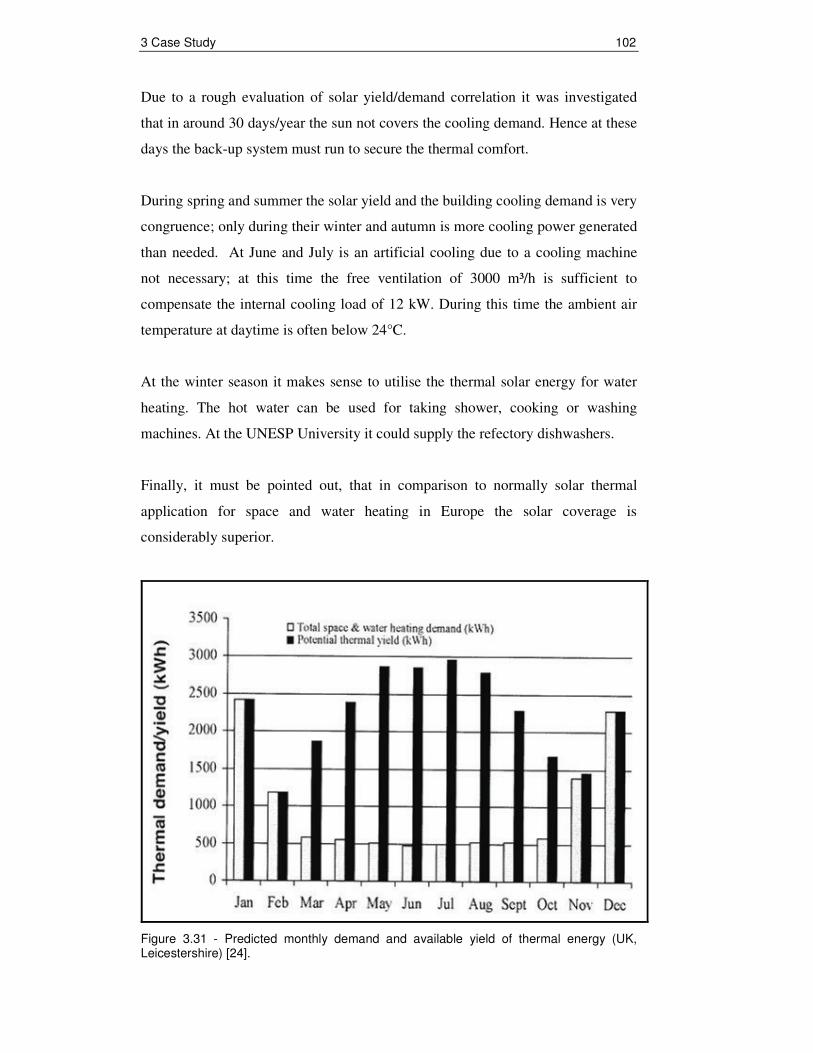
Finally, it must be pointed out, that in comparison to normally solar thermal
application for space and water heating in Europe the solar coverage is
considerably superior.
Figure 3.31 - Predicted monthly demand and available yield of thermal energy (UK, Leicestershire) [24].
3 Case Study 103
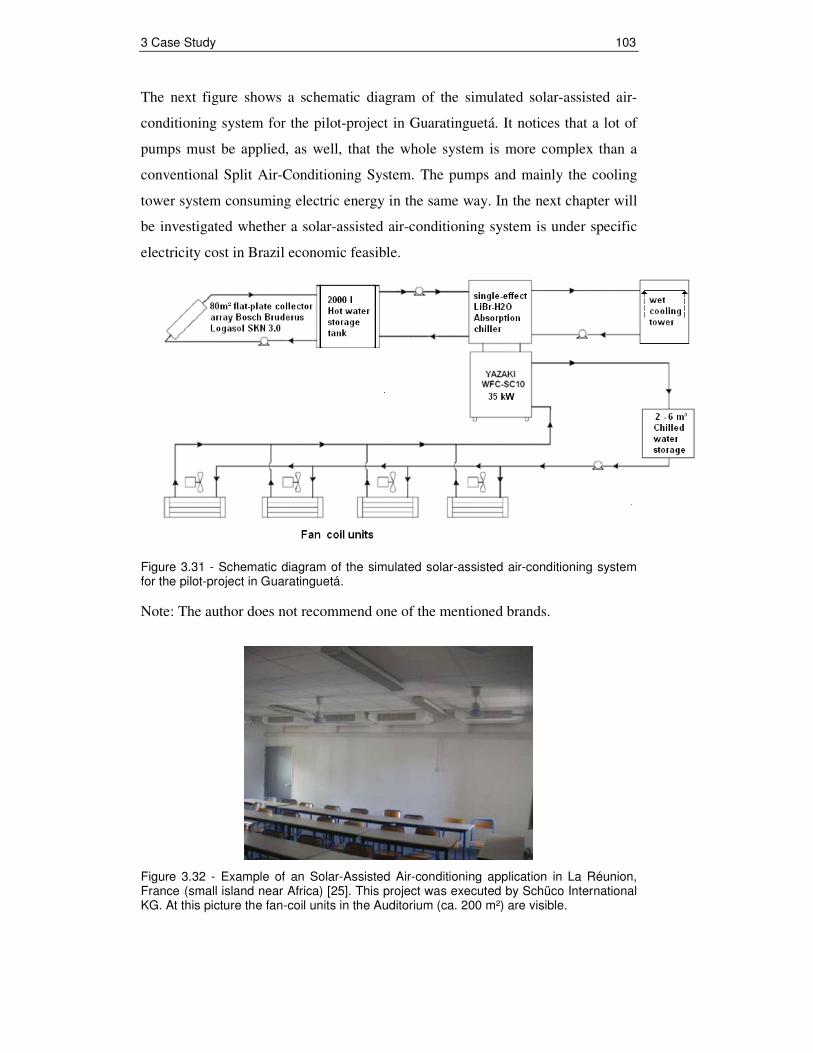
The next figure shows a schematic diagram of the simulated solar-assisted air-
conditioning system for the pilot-project in Guaratinguetá. It notices that a lot of
pumps must be applied, as well, that the whole system is more complex than a
conventional Split Air-Conditioning System. The pumps and mainly the cooling
tower system consuming electric energy in the same way. In the next chapter will
be investigated whether a solar-assisted air-conditioning system is under specific
electricity cost in Brazil economic feasible.
Figure 3.31 - Schematic diagram of the simulated solar-assisted air-conditioning system for the pilot-project in Guaratinguetá.
Note: The author does not recommend one of the mentioned brands.
Figure 3.32 - Example of an Solar-Assisted Air-conditioning application in La Réunion, France (small island near Africa) [25]. This project was executed by Schüco International KG. At this picture the fan-coil units in the Auditorium (ca. 200 m²) are visible.
3 Case Study 104
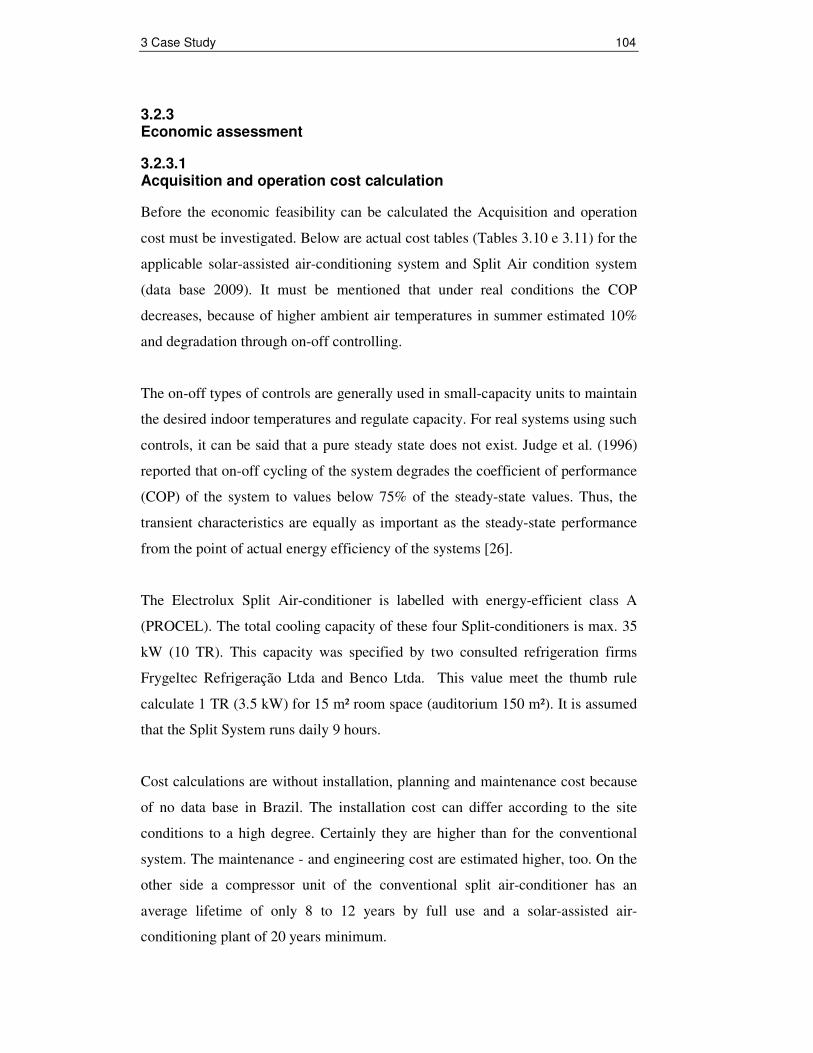
3.2.3 Economic assessment
3.2.3.1 Acquisition and operation cost calculation
Before the economic feasibility can be calculated the Acquisition and operation
cost must be investigated. Below are actual cost tables (Tables 3.10 e 3.11) for the
applicable solar-assisted air-conditioning system and Split Air condition system
(data base 2009). It must be mentioned that under real conditions the COP
decreases, because of higher ambient air temperatures in summer estimated 10%
and degradation through on-off controlling.
The on-off types of controls are generally used in small-capacity units to maintain
the desired indoor temperatures and regulate capacity. For real systems using such
controls, it can be said that a pure steady state does not exist. Judge et al. (1996)
reported that on-off cycling of the system degrades the coefficient of performance
(COP) of the system to values below 75% of the steady-state values. Thus, the
transient characteristics are equally as important as the steady-state performance
from the point of actual energy efficiency of the systems [26].
The Electrolux Split Air-conditioner is labelled with energy-efficient class A
(PROCEL). The total cooling capacity of these four Split-conditioners is max. 35
kW (10 TR). This capacity was specified by two consulted refrigeration firms
Frygeltec Refrigeração Ltda and Benco Ltda. This value meet the thumb rule
calculate 1 TR (3.5 kW) for 15 m² room space (auditorium 150 m²). It is assumed
that the Split System runs daily 9 hours.
Cost calculations are without installation, planning and maintenance cost because
of no data base in Brazil. The installation cost can differ according to the site
conditions to a high degree. Certainly they are higher than for the conventional
system. The maintenance - and engineering cost are estimated higher, too. On the
other side a compressor unit of the conventional split air-conditioner has an
average lifetime of only 8 to 12 years by full use and a solar-assisted air-
conditioning plant of 20 years minimum.

3 Case Study 105
ACQUISITION COST [R$]
SPECIFIC COST [R$ per kW cooling
capacity]
Component
A: complete
solar cooling "kit"
B: individual
comp.
A: B:
Flate Plate collectors, 80 m² Bosch Bruderus Logasol SKN 3.0
37.234 (13.790 �)
37.234 (13.790 �)
1.064 1.064
SolarNext chillii ® Cooling Kit WFC35, incl.: 1 x Yazaki WFC-SC10 Absorption chiller 1 x wet cooling tower with auto accessories filling and emptying, and fan speed control 1 x hot water pump 1 x cooling water pump 1 x chillii ® System Controller HC incl. Temperature Sensors 1 x cold storage 2000 l without Insulation 1 set of sensors f. Chilled water storage 1 x pump f. cold distribution with accessories 1 x hot water storage 2000 l with insulation 1 set of sensors f. hot water storage 2 x changeover valve with actuator
126.700
(46.926 �)
18.225
(6.750 �)
estimated price for all these comp. except: chiller, cooling
tower and controller
3.620
1 x pump f. solar collector cuircit 945
(350 �) 945
(350 �)
4 x fan coil unit 10.268
(3840 �) 10.268
(3840 �) 293 293
Yazaki WFC-SC10 35 kW Absorption Chiller
43.501
(16.700 �) 1.242
wet cooling-tower F-32 Refrigeracao International
7.370
(2.729 �) 211
SolarNext chillii ® System Controller H 5.624
(2.083 �)
4 x Split Air-conditioner back-up* Electrolux SPLIT SE 30 F (30.000 BTU / 8,8 kW)
16.000 (5.926 �)
16.000 (5.926 �)
457 (169 �/KW)
457 (169 �/KW)
TOTAL 191.147
(70.772 �) 139.167
(52.178 �)
5.461 (2.022 �/KW)
3.976 (1473 �/KW)
Table 3.10 - Acquisition and specific costs per kW cooling capacity for two different system combinations.
Notes: a) Conversion factor 2,7 R$/�; b) * In accordance with PROCEL, as Back-up was
chosen a split-conditioning system, because of the possibility to compare both systems
by checking actual measuring data; c) A includes a complete cooling “kit” available by
SolarNext AG company in Germany; d) B includes the acquisition prices for individual
ordered components as the wet cooling tower, directly from a Brazilian company and the
chiller directly from Yazaki, Japan. At last the controller device from SolarNext, too.
3 Case Study 106
ELECTRICITY CONSUMPTION & OPERATION COST
Component
solar-assisted
air-conditioning system
conventional split air-
conditioning system
4 x water pumps 360 W
wet cooling-tower fan 280 W
Yazaki WFC-SC10 35 kW Absorption Chiller
210 W
4 x fan coil units 480 W
4 x Split Air-conditioner Electrolux SPLIT SE 30 F (30.000 BTU / 8,8 kW)**
13.600 W
TOTAL 1.330 W 13.600 W
1 Month (30 days x 9 h)
359 kWh 3.672 kWh
9 Months 3232 kWh 33.048 kWh
TOTAL 10 Months operating (1 year) *
with 1 Month split-air conditioning
back-up 6.904 kWh
36.720 kWh
Operation Cost (1 year) by 0,38 R$/kWh
(Guaratingueta Edp Bandeirante Energia)
2.624 R$ 13.954 R$
Operation Cost (1 year) by 0,598 R$/kWh
(Minas Gerais -Cemig) 4.106 R$ 21.959 R$
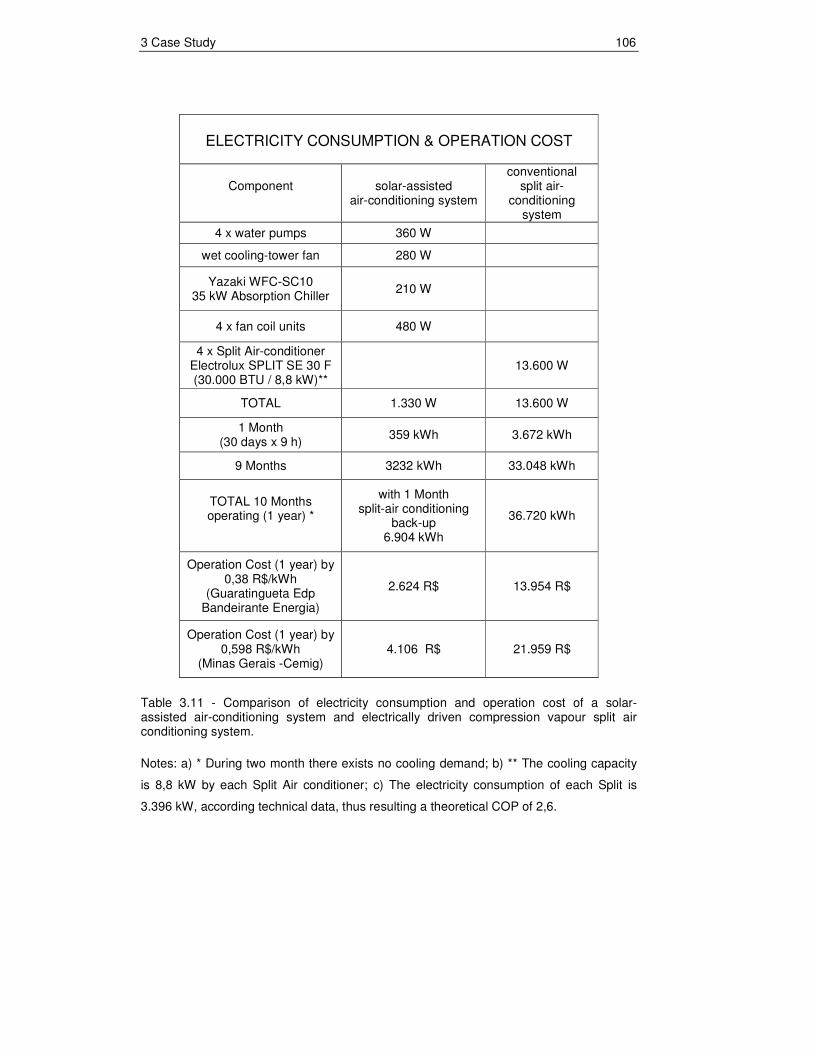
Table 3.11 - Comparison of electricity consumption and operation cost of a solar- assisted air-conditioning system and electrically driven compression vapour split air conditioning system.
Notes: a) * During two month there exists no cooling demand; b) ** The cooling capacity
is 8,8 kW by each Split Air conditioner; c) The electricity consumption of each Split is
3.396 kW, according technical data, thus resulting a theoretical COP of 2,6.
3 Case Study 107
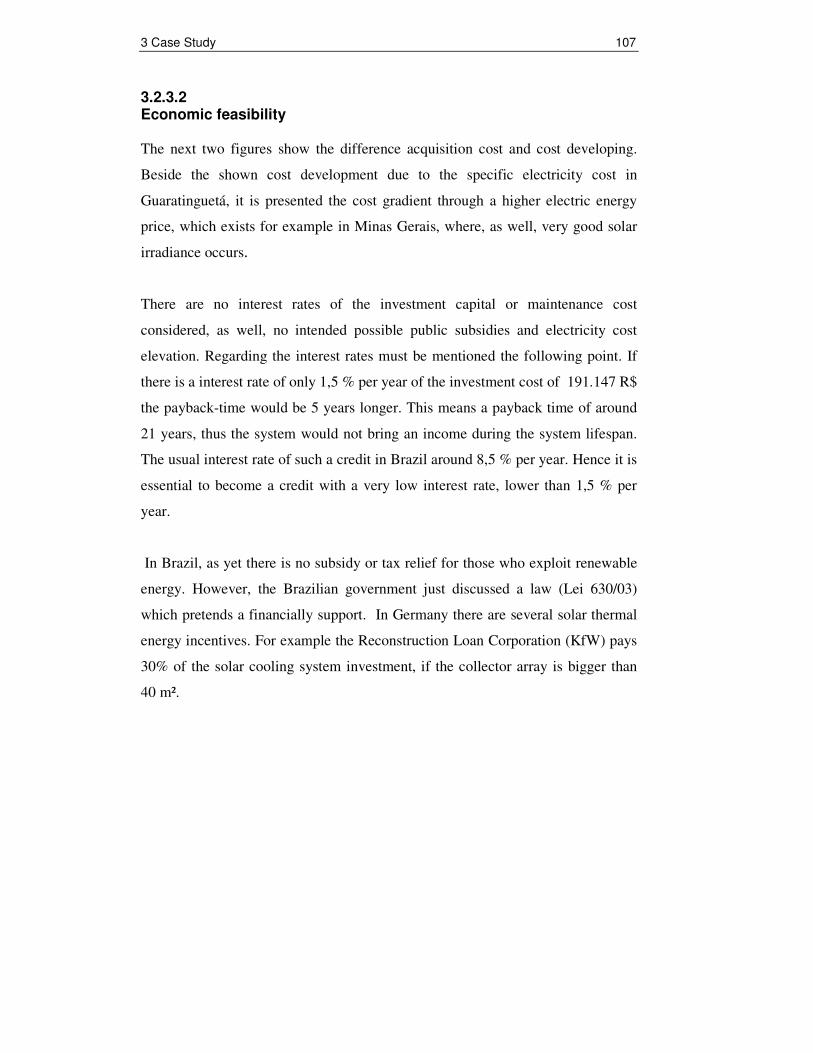
3.2.3.2 Economic feasibility The next two figures show the difference acquisition cost and cost developing.
Beside the shown cost development due to the specific electricity cost in
Guaratinguetá, it is presented the cost gradient through a higher electric energy
price, which exists for example in Minas Gerais, where, as well, very good solar
irradiance occurs.
There are no interest rates of the investment capital or maintenance cost
considered, as well, no intended possible public subsidies and electricity cost
elevation. Regarding the interest rates must be mentioned the following point. If
there is a interest rate of only 1,5 % per year of the investment cost of 191.147 R$
the payback-time would be 5 years longer. This means a payback time of around
21 years, thus the system would not bring an income during the system lifespan.
The usual interest rate of such a credit in Brazil around 8,5 % per year. Hence it is
essential to become a credit with a very low interest rate, lower than 1,5 % per
year.
In Brazil, as yet there is no subsidy or tax relief for those who exploit renewable
energy. However, the Brazilian government just discussed a law (Lei 630/03)
which pretends a financially support. In Germany there are several solar thermal
energy incentives. For example the Reconstruction Loan Corporation (KfW) pays
30% of the solar cooling system investment, if the collector array is bigger than
40 m².
3 Case Study 108
Figure 3.33 - Acquisition and operation cost of solar-assisted air-conditioning system and conventional split air-conditioning system in Guaratinguetá.
Note: Operation cost are calculated with an electric price of 0,38 R$/kWh which
is the price in Guaratinguetá by supplier EDP-Bandeirante Energia SA.
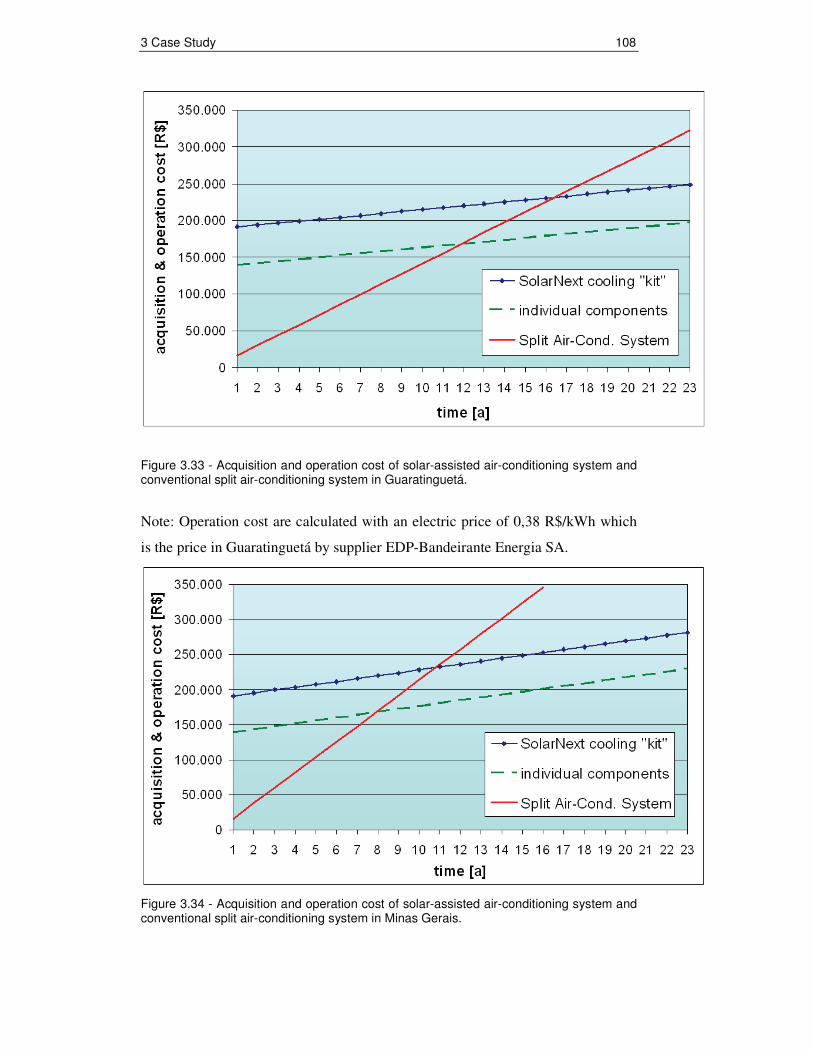
Figure 3.34 - Acquisition and operation cost of solar-assisted air-conditioning system and conventional split air-conditioning system in Minas Gerais.
3 Case Study 109
Note: Operation cost are calculated with an electric price of 0,60 R$/kWh which
is the price in the Brazilian State of Minas Gerais by CEMIG (companhia
energética de Minas Gerais).
An important definition to evaluate the economic feasibility is the meaning of
“critical operation time”. Below “critical operation time” is understood the time as
from the solar-assisted air-conditioning system in relation to acquisition and
operation cost is cheaper than the conventional system. If the solar cooling system
within the lifetime (here 20 years) will be longer in operation than the critical
operation time, the firstly high cost of acquisition pays off.
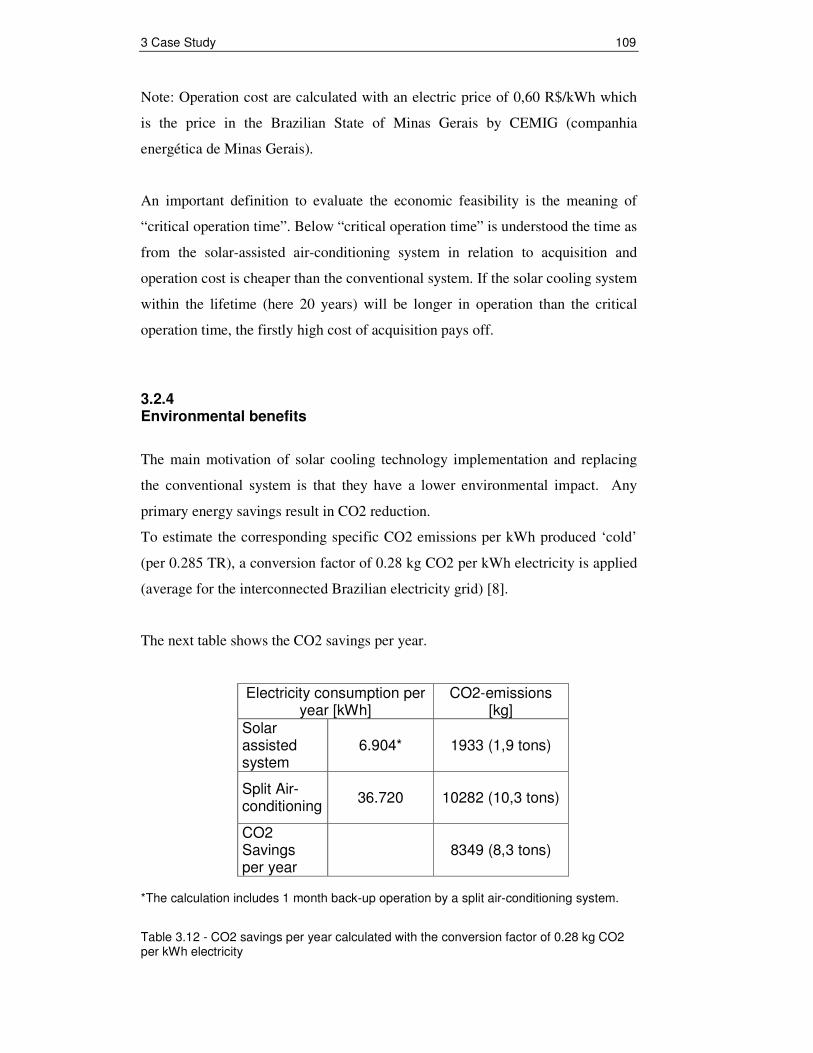
3.2.4 Environmental benefits
The main motivation of solar cooling technology implementation and replacing
the conventional system is that they have a lower environmental impact. Any
primary energy savings result in CO2 reduction.
To estimate the corresponding specific CO2 emissions per kWh produced ‘cold’
(per 0.285 TR), a conversion factor of 0.28 kg CO2 per kWh electricity is applied
(average for the interconnected Brazilian electricity grid) [8].
The next table shows the CO2 savings per year.
Electricity consumption per year [kWh]
CO2-emissions [kg]
Solar assisted system
6.904* 1933 (1,9 tons)
Split Air- conditioning
36.720
10282 (10,3 tons)
CO2 Savings per year
8349 (8,3 tons)
*The calculation includes 1 month back-up operation by a split air-conditioning system.
Table 3.12 - CO2 savings per year calculated with the conversion factor of 0.28 kg CO2 per kWh electricity
3 Case Study 110
In addition to the CO2 savings, the usage of environmentally refrigerants must be
pointed out. They have no ozone-depleting or global warming potential. In the
conventional systems are often used the R-134a as refrigerant.
A negative point is the water consumption of the wet cooling-tower. However, the
water amount is very small in this case only 50 litres per day. This water could be
collected by rain and therefore it causes no negative environmental impact. In
order to complete the environmental impact evaluation of solar-assisted air-
conditioning system a complete life cycle analyses should be carried out, but this
would go beyond the scope.
3.2.5 Conclusion
This chapter has demonstrated that the acquisition cost of solar-assisted air-
conditioning is very high in comparison to the conventional system. By contrast
the running costs are significant lower, only 0,038 kWh electricity is sufficient to
generate1 kWh cooling power. To secure this cost it is important to apply always
high-efficient pumps and fans, the pumps and cooling tower fan should be speed
regulated.
Generally, in all calculated cases the solar cooling low operation cost compensate
the higher investment cost in a long term, especially in Minas Gerais at a higher
electricity price. The case study shows that solar cooling systems can be a
alternative option against electric split chillers, especially in areas with significant
cooling demand (high internal cooling load), solar irradiance, and electric prices.
As electric rates increase, solar cooling will become an even more economically
attractive option for building owners.
But, it must be mentioned if in Guaratinguetá on the high investment cost an
interest rate more than 1,5 % would be added, there would be no cost savings
during operation yield. Thus it is important that a financial support exists, for
example through low-interest credits or direct investment grant. As well, must be
3 Case Study 111
highlighted that that the economic feasibility is only given for buildings where the
cooling demand mostly occurs during the day.
The Payback times are 11 years with the higher SolarNext solar cooling “kit”
investment cost and the electricity cost in Minas Gerais and 16 years Payback due
to the lower electricity cost in Guaratinguetá.
In the onsite energy market for privately-owned buildings, paybacks of two to
three years are desirable; five to seven years are sometimes acceptable, and
anything over ten years is not economic. Payback periods for publicly owned
buildings (e.g. institutions such as schools, municipal buildings, federal
government buildings, jails, etc.) might be extended longer than for privately-
owned buildings [27].