Embed Size (px)
Citation preview
8/20/2019 3 Auckland Housing Accord Monitoring Report 7
http://slidepdf.com/reader/full/3-auckland-housing-accord-monitoring-report-7 1/38
1
1
Auckland Housing AccordThird Report for Accord Year 2
October 2014 to June 2015
Based on:
building consent data to month ended 30 June 2015
new sections data to month ended 30 June 2015
Housing Project Office consenting activity to 30 June 2015
8/20/2019 3 Auckland Housing Accord Monitoring Report 7
http://slidepdf.com/reader/full/3-auckland-housing-accord-monitoring-report-7 2/38
2
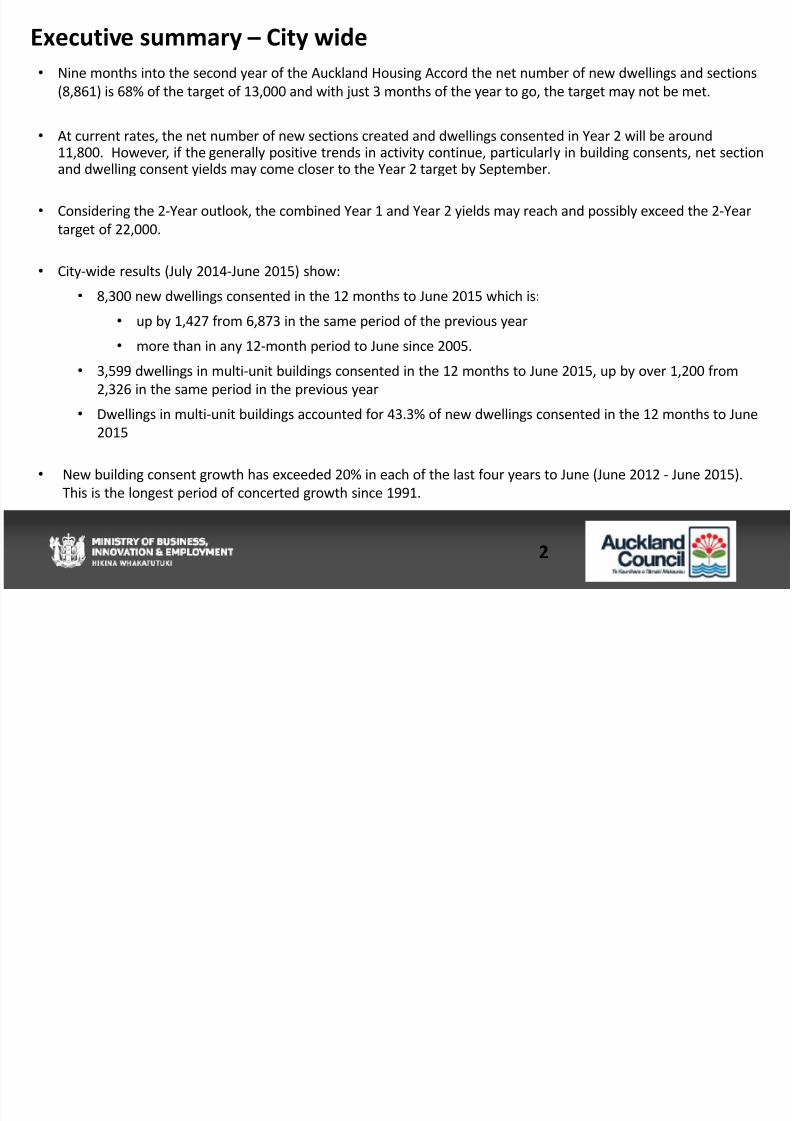
Executive summary – City wide
• Nine months into the second year of the Auckland Housing Accord the net number of new dwellings and sections
(8,861) is 68% of the target of 13,000 and with just 3 months of the year to go, the target may not be met.
•At current rates, the net number of new sections created and dwellings consented in Year 2 will be around11,800. However, if the generally positive trends in activity continue, particularly in building consents, net sectionand dwelling consent yields may come closer to the Year 2 target by September.
• Considering the 2-Year outlook, the combined Year 1 and Year 2 yields may reach and possibly exceed the 2-Year
target of 22,000.
•
City-wide results (July 2014-June 2015) show:• 8,300 new dwellings consented in the 12 months to June 2015 which is:
• up by 1,427 from 6,873 in the same period of the previous year
• more than in any 12-month period to June since 2005.
• 3,599 dwellings in multi-unit buildings consented in the 12 months to June 2015, up by over 1,200 from
2,326 in the same period in the previous year
• Dwellings in multi-unit buildings accounted for 43.3% of new dwellings consented in the 12 months to June2015
• New building consent growth has exceeded 20% in each of the last four years to June (June 2012 - June 2015).
This is the longest period of concerted growth since 1991.
8/20/2019 3 Auckland Housing Accord Monitoring Report 7
http://slidepdf.com/reader/full/3-auckland-housing-accord-monitoring-report-7 3/38
3
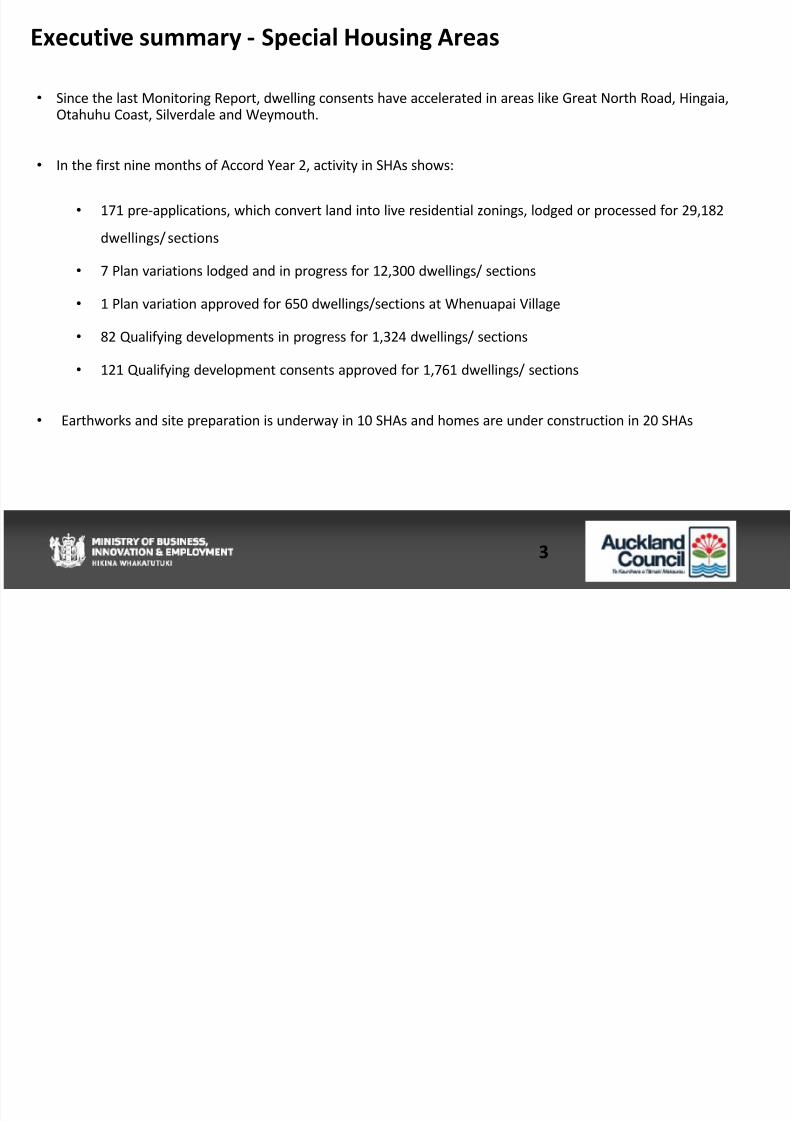
Executive summary - Special Housing Areas
• Since the last Monitoring Report, dwelling consents have accelerated in areas like Great North Road, Hingaia,Otahuhu Coast, Silverdale and Weymouth.
• In the first nine months of Accord Year 2, activity in SHAs shows:
• 171 pre-applications, which convert land into live residential zonings, lodged or processed for 29,182
dwellings/ sections
•
7 Plan variations lodged and in progress for 12,300 dwellings/ sections
• 1 Plan variation approved for 650 dwellings/sections at Whenuapai Village
• 82 Qualifying developments in progress for 1,324 dwellings/ sections
• 121 Qualifying development consents approved for 1,761 dwellings/ sections
• Earthworks and site preparation is underway in 10 SHAs and homes are under construction in 20 SHAs

8/20/2019 3 Auckland Housing Accord Monitoring Report 7
http://slidepdf.com/reader/full/3-auckland-housing-accord-monitoring-report-7 4/38
4
Meeting Accord targets
8/20/2019 3 Auckland Housing Accord Monitoring Report 7
http://slidepdf.com/reader/full/3-auckland-housing-accord-monitoring-report-7 5/38
5
Targets
The Auckland Housing Accord targets are based on the net number of new dwellingsconsented and sections created in Auckland each year.
“The agreed goals, set out below, include all new dwellings and new sites consented under existingregulations or through the application of the new tools enabled through this Accord and are based
on new building and subdivision consents in greenfield and brownfield areas.”
• Dwellings
• The number of new dwellings that receive building consent, as recorded in themonthly building consent data available from Statistics New Zealand.
• Sections
• The number of new residential sections of up to 5,000m2 that are legally createdin the land register, as recorded weekly by Land Information New Zealand.
Auckland Housing Accord
Paragraph 26
8/20/2019 3 Auckland Housing Accord Monitoring Report 7
http://slidepdf.com/reader/full/3-auckland-housing-accord-monitoring-report-7 6/38
6
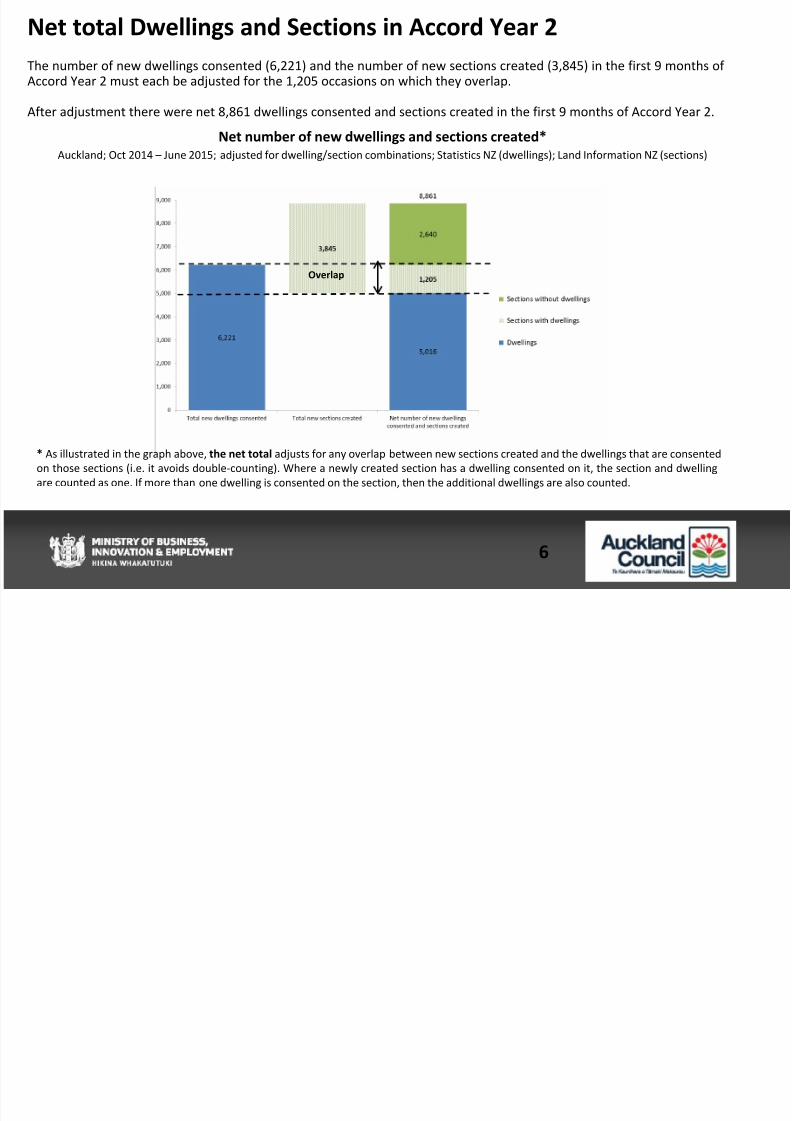
Net total Dwellings and Sections in Accord Year 2
The number of new dwellings consented (6,221) and the number of new sections created (3,845) in the first 9 months ofAccord Year 2 must each be adjusted for the 1,205 occasions on which they overlap.
After adjustment there were net 8,861 dwellings consented and sections created in the first 9 months of Accord Year 2.
Net number of new dwellings and sections created*Auckland; Oct 2014 – June 2015; adjusted for dwelling/section combinations; Statistics NZ (dwellings); Land Information NZ (sections)
* As illustrated in the graph above, the net total adjusts for any overlap between new sections created and the dwellings that are consented
on those sections (i.e. it avoids double-counting). Where a newly created section has a dwelling consented on it, the section and dwelling
are counted as one. If more than one dwelling is consented on the section, then the additional dwellings are also counted.
Overlap
8/20/2019 3 Auckland Housing Accord Monitoring Report 7
http://slidepdf.com/reader/full/3-auckland-housing-accord-monitoring-report-7 7/38
7
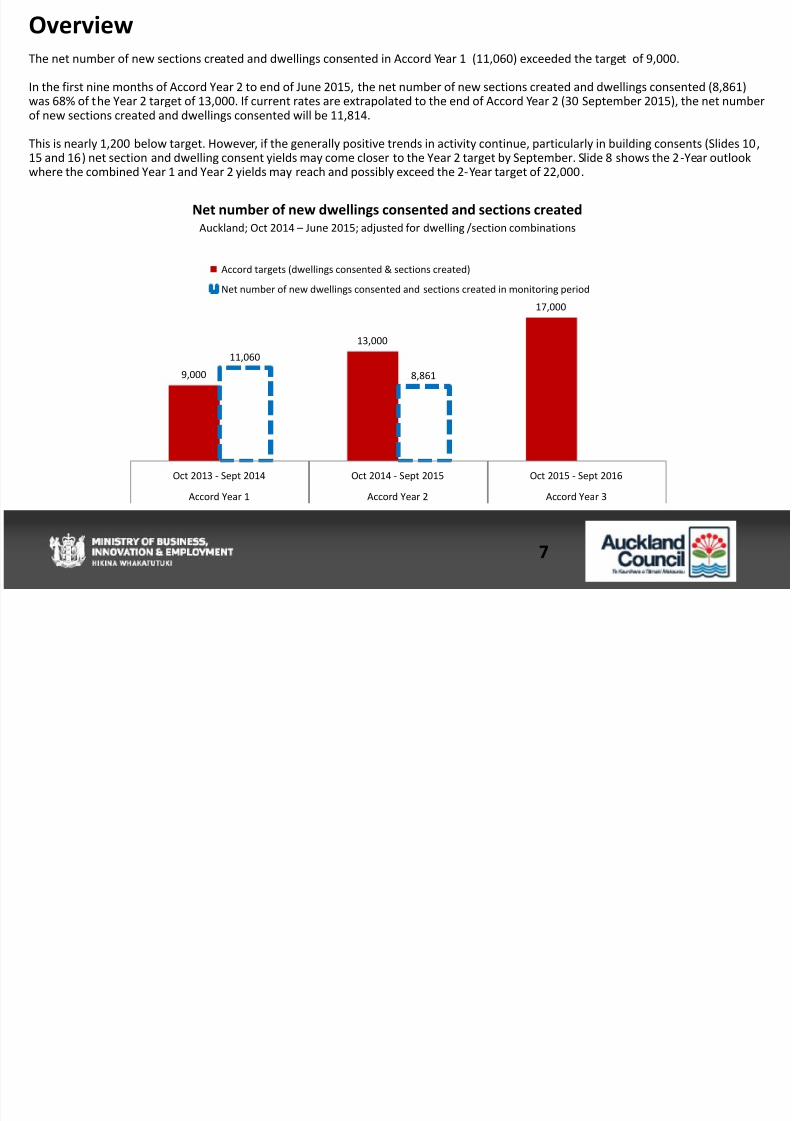
Overview
The net number of new sections created and dwellings consented in Accord Year 1 (11,060) exceeded the target of 9,000.
In the first nine months of Accord Year 2 to end of June 2015, the net number of new sections created and dwellings consented (8,861)was 68% of the Year 2 target of 13,000. If current rates are extrapolated to the end of Accord Year 2 (30 September 2015), the net numberof new sections created and dwellings consented will be 11,814.
This is nearly 1,200 below target. However, if the generally positive trends in activity continue, particularly in building consents (Slides 10,15 and 16) net section and dwelling consent yields may come closer to the Year 2 target by September. Slide 8 shows the 2-Year outlookwhere the combined Year 1 and Year 2 yields may reach and possibly exceed the 2-Year target of 22,000.
Net number of new dwellings consented and sections created
Auckland; Oct 2014 – June 2015; adjusted for dwelling /section combinations
9,000
13,000
17,000
11,060
8,861
Oct 2013 - Sept 2014 Oct 2014 - Sept 2015 Oct 2015 - Sept 2016
Accord Year 1 Accord Year 2 Accord Year 3
Accord targets (dwellings consented & sections created)
Net number of new dwellings consented and sections created in monitoring period
8/20/2019 3 Auckland Housing Accord Monitoring Report 7
http://slidepdf.com/reader/full/3-auckland-housing-accord-monitoring-report-7 8/38
8
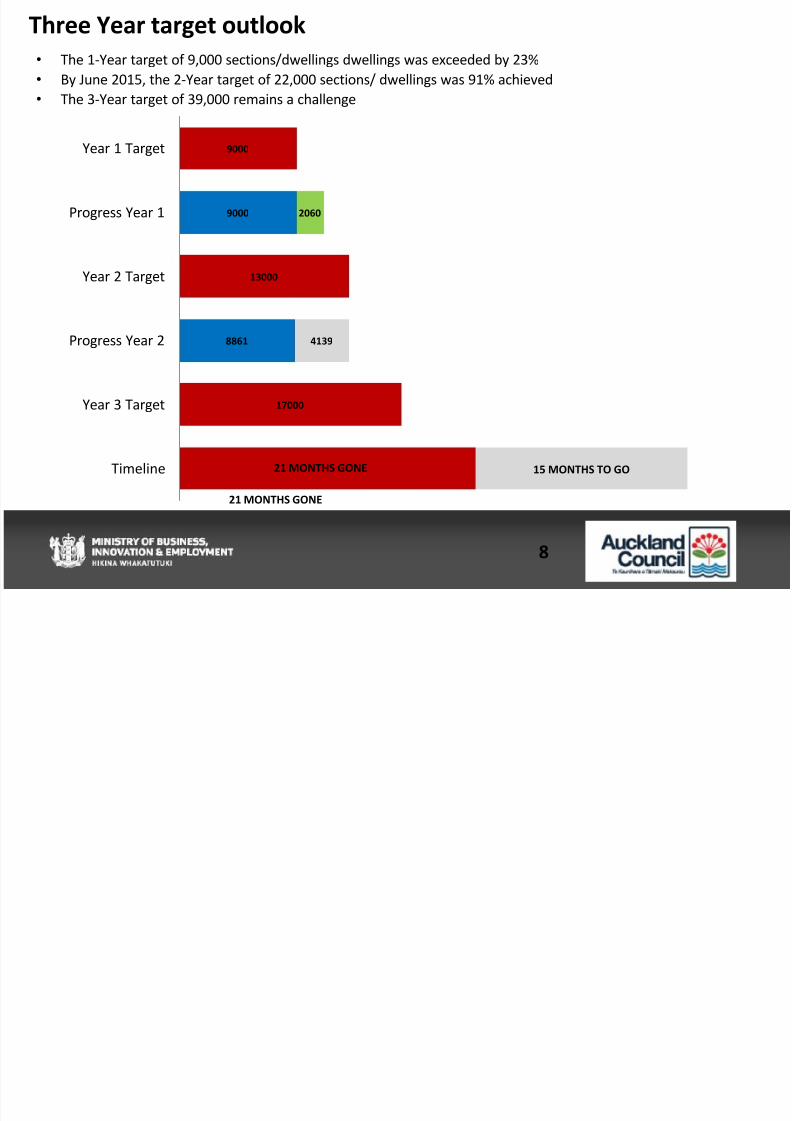
9000
9000
13000
8861
17000
2060
4139
Year 1 Target
Progress Year 1
Year 2 Target
Progress Year 2
Year 3 Target
Timeline
21 MONTHS GONE
15 MONTHS TO GO21 MONTHS GONE
Three Year target outlook
• The 1-Year target of 9,000 sections/dwellings dwellings was exceeded by 23%
• By June 2015, the 2-Year target of 22,000 sections/ dwellings was 91% achieved
• The 3-Year target of 39,000 remains a challenge

8/20/2019 3 Auckland Housing Accord Monitoring Report 7
http://slidepdf.com/reader/full/3-auckland-housing-accord-monitoring-report-7 9/38
9
Dwellings
8/20/2019 3 Auckland Housing Accord Monitoring Report 7
http://slidepdf.com/reader/full/3-auckland-housing-accord-monitoring-report-7 10/38
10
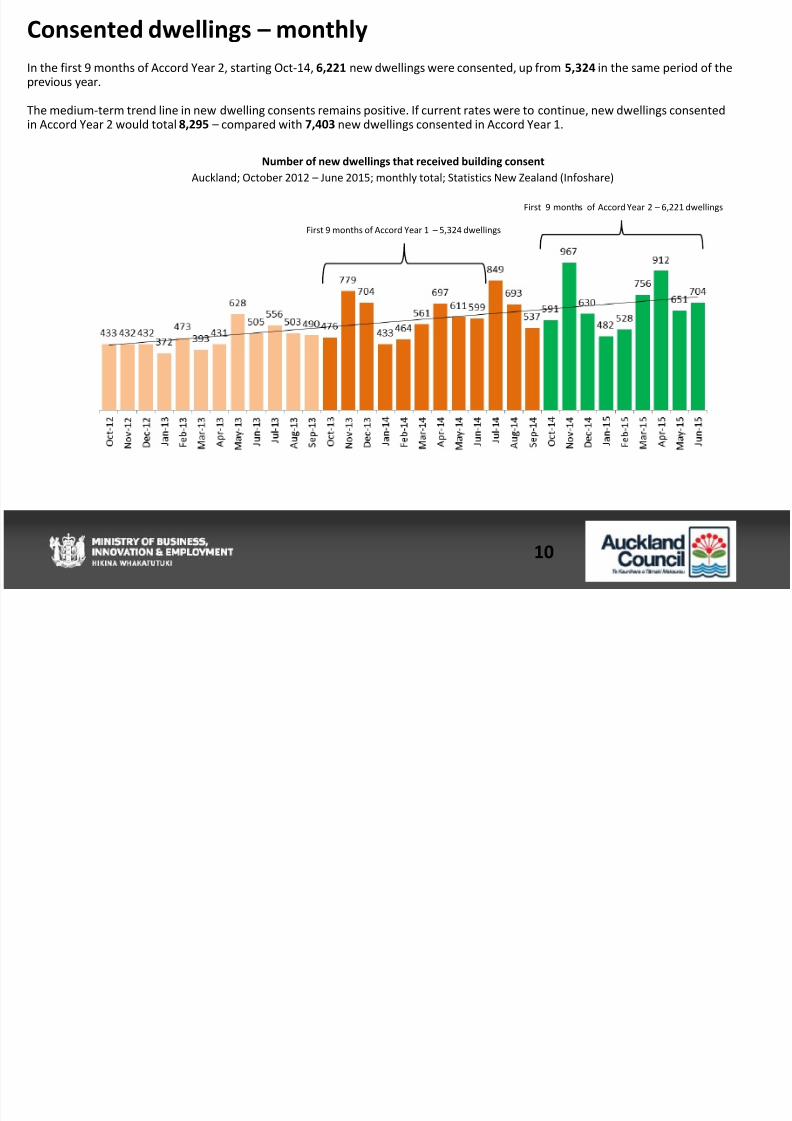
Consented dwellings – monthly
In the first 9 months of Accord Year 2, starting Oct-14, 6,221 new dwellings were consented, up from 5,324 in the same period of theprevious year.
The medium-term trend line in new dwelling consents remains positive. If current rates were to continue, new dwellings consentedin Accord Year 2 would total 8,295 – compared with 7,403 new dwellings consented in Accord Year 1.
Number of new dwellings that received building consent
Auckland; October 2012 – June 2015; monthly total; Statistics New Zealand (Infoshare)
First 9 months of Accord Year 1 – 5,324 dwellings
First 9 months of Accord Year 2 – 6,221 dwellings
8/20/2019 3 Auckland Housing Accord Monitoring Report 7
http://slidepdf.com/reader/full/3-auckland-housing-accord-monitoring-report-7 11/38
11
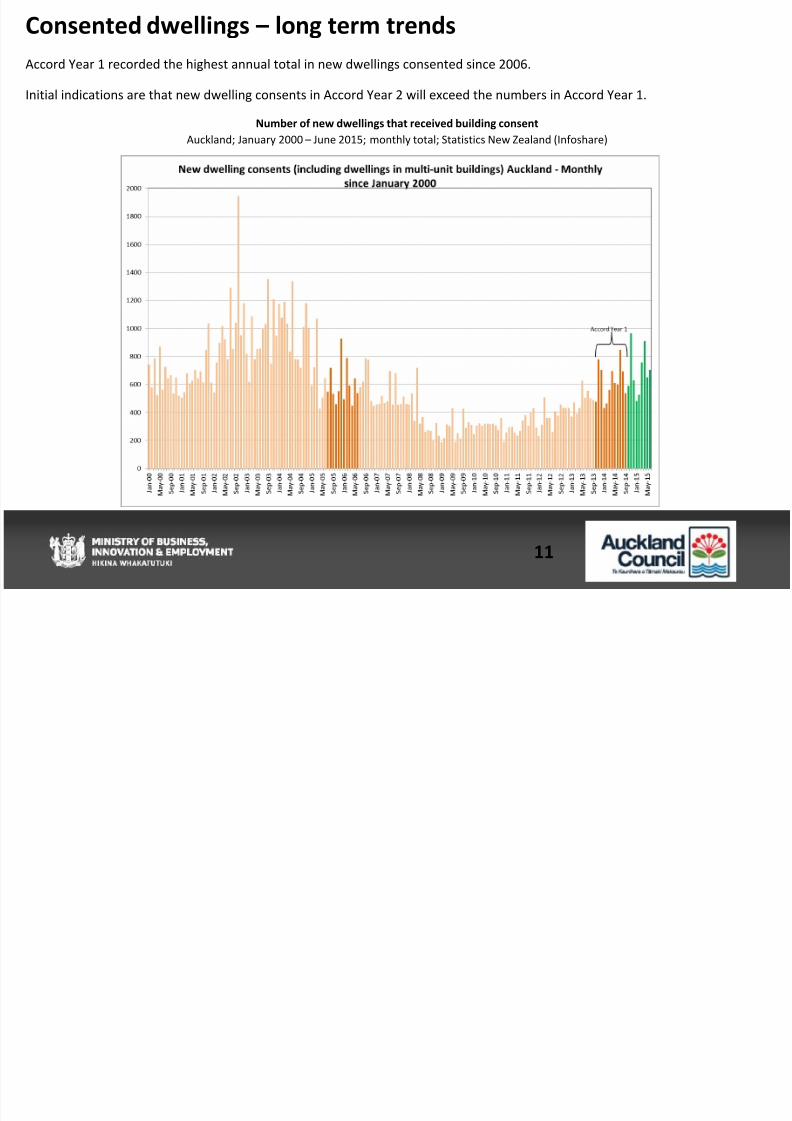
Consented dwellings – long term trends
Accord Year 1 recorded the highest annual total in new dwellings consented since 2006.
Initial indications are that new dwelling consents in Accord Year 2 will exceed the numbers in Accord Year 1.
Number of new dwellings that received building consent
Auckland; January 2000 – June 2015; monthly total; Statistics New Zealand (Infoshare)
8/20/2019 3 Auckland Housing Accord Monitoring Report 7
http://slidepdf.com/reader/full/3-auckland-housing-accord-monitoring-report-7 12/38
12
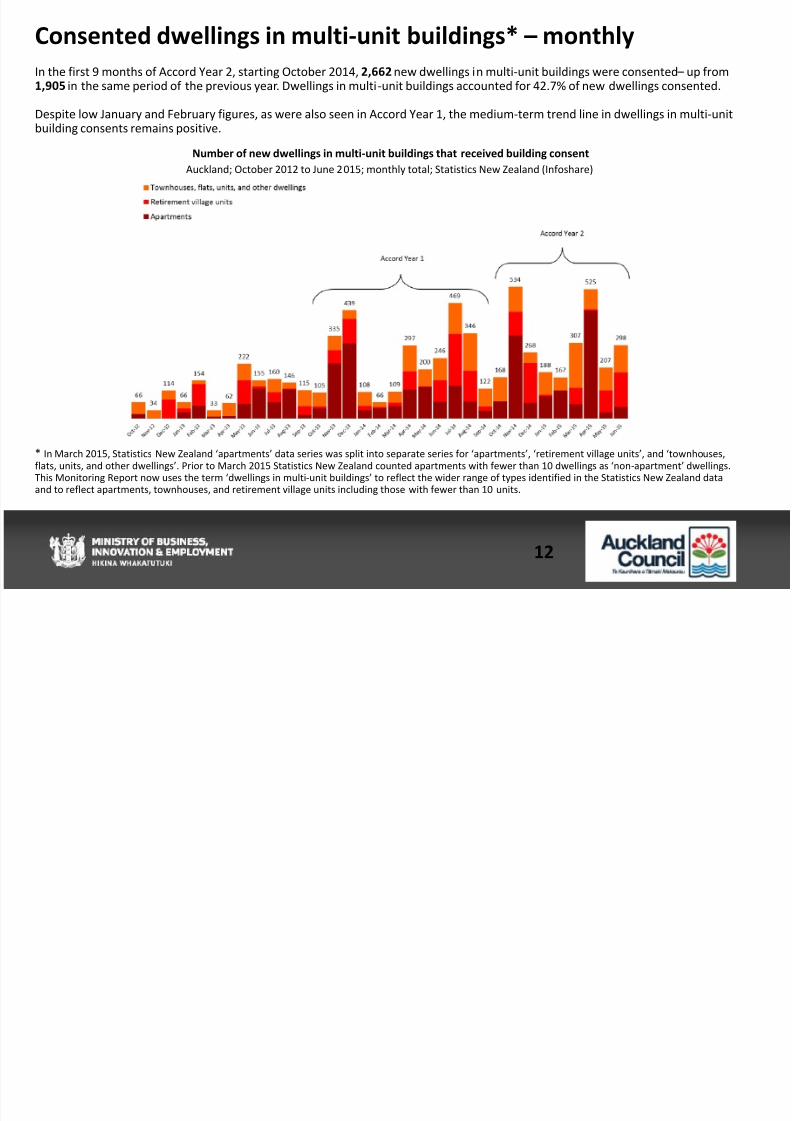
Consented dwellings in multi-unit buildings* – monthly
In the first 9 months of Accord Year 2, starting October 2014, 2,662 new dwellings in multi-unit buildings were consented – up from1,905 in the same period of the previous year. Dwellings in multi-unit buildings accounted for 42.7% of new dwellings consented.
Despite low January and February figures, as were also seen in Accord Year 1, the medium-term trend line in dwellings in multi-unitbuilding consents remains positive.
* In March 2015, Statistics New Zealand ‘apartments’ data series was split into separate series for ‘apartments’, ‘retirement village units’, and ‘townhouses,flats, units, and other dwellings’. Prior to March 2015 Statistics New Zealand counted apartments with fewer than 10 dwellings as ‘non-apartment’ dwellings.
This Monitoring Report now uses the term ‘dwellings in multi-unit buildings’ to reflect the wider range of types identified in the Statistics New Zealand dataand to reflect apartments, townhouses, and retirement village units including those with fewer than 10 units.
Number of new dwellings in multi-unit buildings that received building consent
Auckland; October 2012 to June 2015; monthly total; Statistics New Zealand (Infoshare)
8/20/2019 3 Auckland Housing Accord Monitoring Report 7
http://slidepdf.com/reader/full/3-auckland-housing-accord-monitoring-report-7 13/38
13
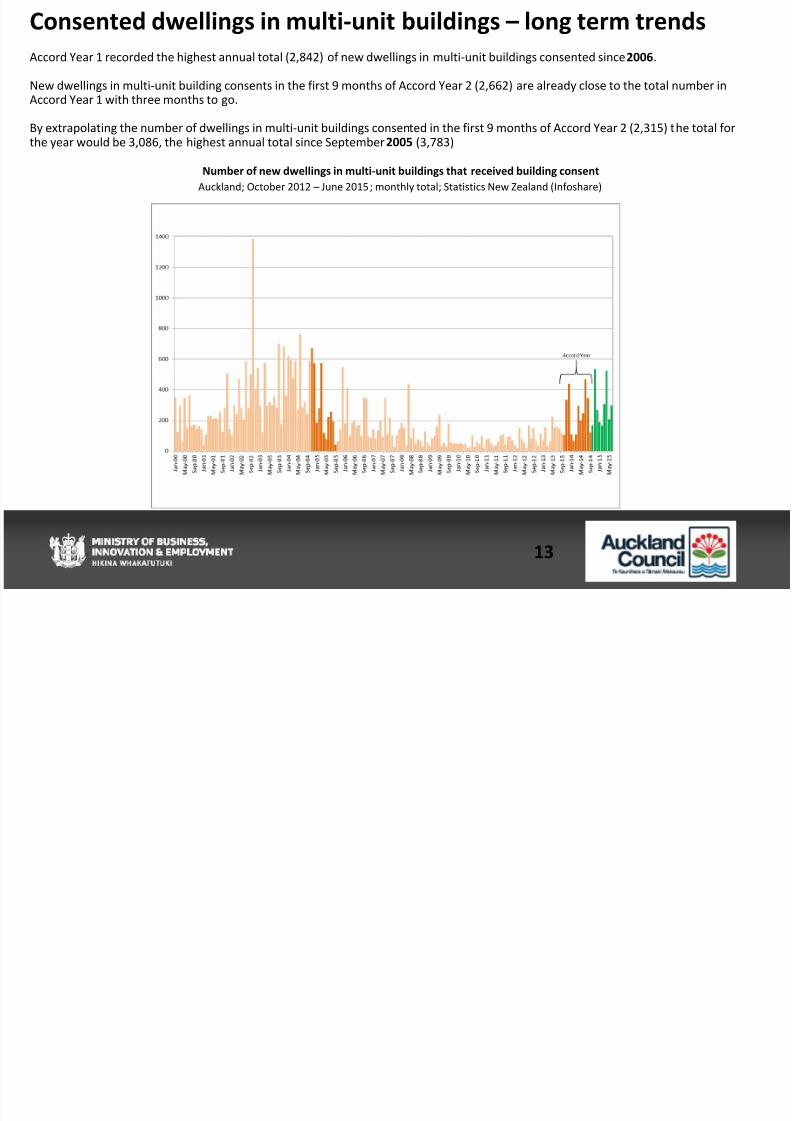
Consented dwellings in multi-unit buildings – long term trends
Accord Year 1 recorded the highest annual total (2,842) of new dwellings in multi-unit buildings consented since 2006.
New dwellings in multi-unit building consents in the first 9 months of Accord Year 2 (2,662) are already close to the total number inAccord Year 1 with three months to go.
By extrapolating the number of dwellings in multi-unit buildings consented in the first 9 months of Accord Year 2 (2,315) the total for
the year would be 3,086, the highest annual total since September 2005 (3,783)
Number of new dwellings in multi-unit buildings that received building consent
Auckland; October 2012 – June 2015; monthly total; Statistics New Zealand (Infoshare)
8/20/2019 3 Auckland Housing Accord Monitoring Report 7
http://slidepdf.com/reader/full/3-auckland-housing-accord-monitoring-report-7 14/38
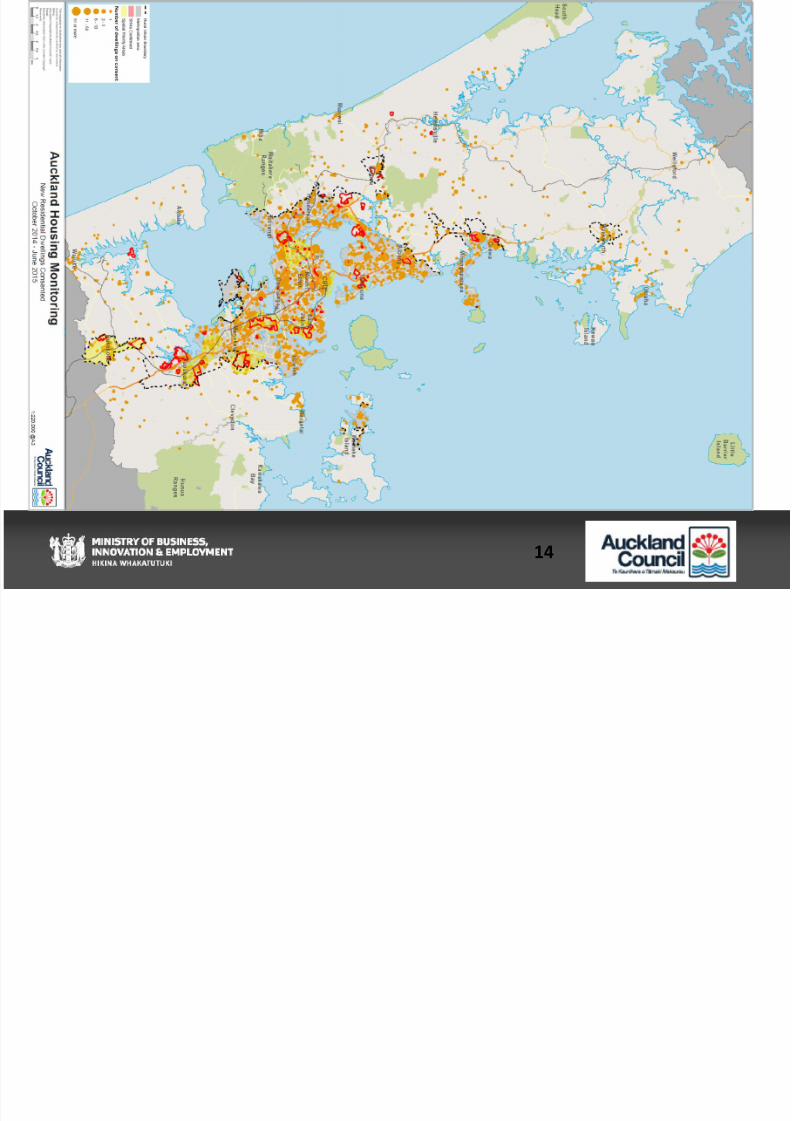
14
Location of new residential dwellingsconsented: October 2014 – June 2015
8/20/2019 3 Auckland Housing Accord Monitoring Report 7
http://slidepdf.com/reader/full/3-auckland-housing-accord-monitoring-report-7 15/38
15
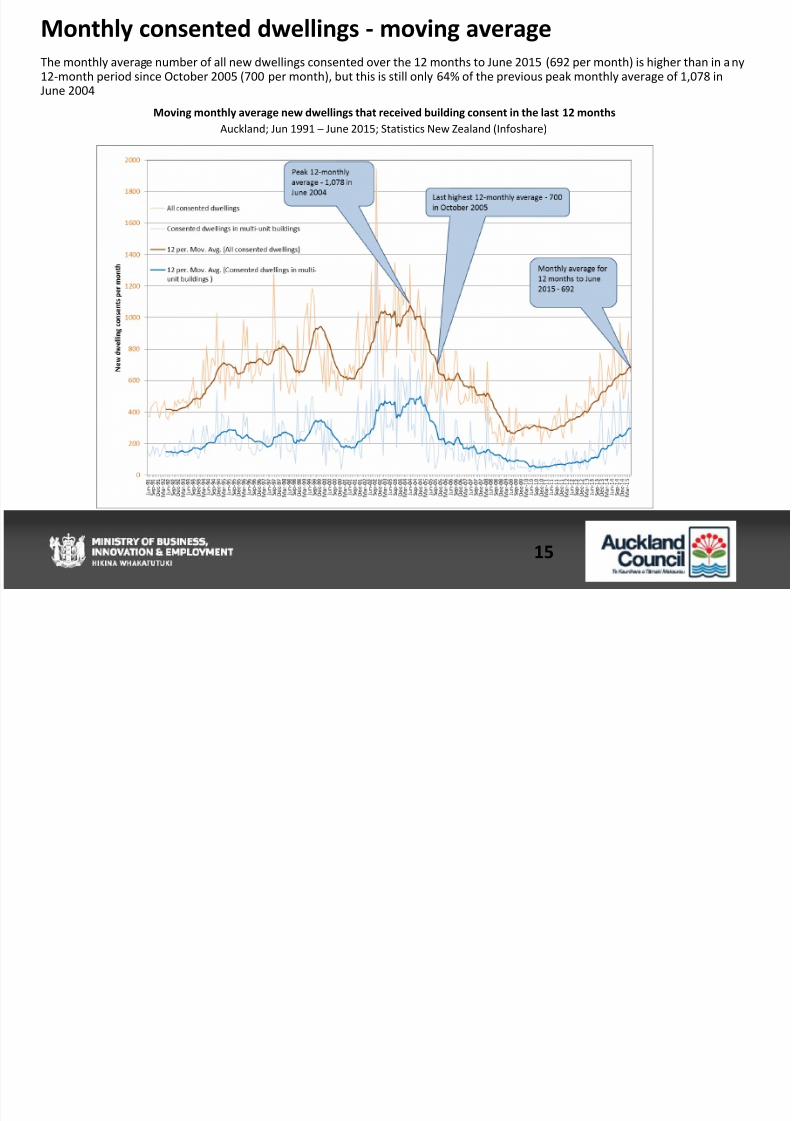
Monthly consented dwellings - moving average
The monthly average number of all new dwellings consented over the 12 months to June 2015 (692 per month) is higher than in a ny12-month period since October 2005 (700 per month), but this is still only 64% of the previous peak monthly average of 1,078 inJune 2004
Moving monthly average new dwellings that received building consent in the last 12 months
Auckland; Jun 1991 – June 2015; Statistics New Zealand (Infoshare)
8/20/2019 3 Auckland Housing Accord Monitoring Report 7
http://slidepdf.com/reader/full/3-auckland-housing-accord-monitoring-report-7 16/38
16
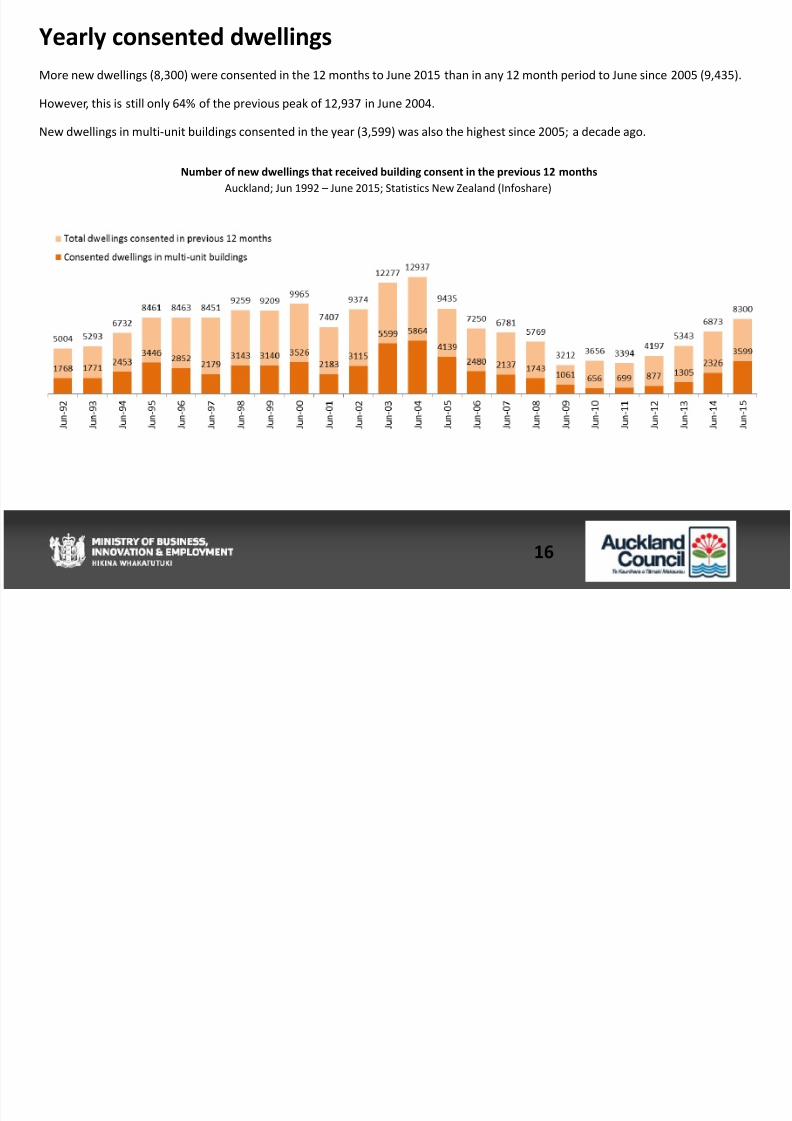
Yearly consented dwellings
More new dwellings (8,300) were consented in the 12 months to June 2015 than in any 12 month period to June since 2005 (9,435).
However, this is still only 64% of the previous peak of 12,937 in June 2004.
New dwellings in multi-unit buildings consented in the year (3,599) was also the highest since 2005; a decade ago.
Number of new dwellings that received building consent in the previous 12 months
Auckland; Jun 1992 – June 2015; Statistics New Zealand (Infoshare)
8/20/2019 3 Auckland Housing Accord Monitoring Report 7
http://slidepdf.com/reader/full/3-auckland-housing-accord-monitoring-report-7 17/38
17
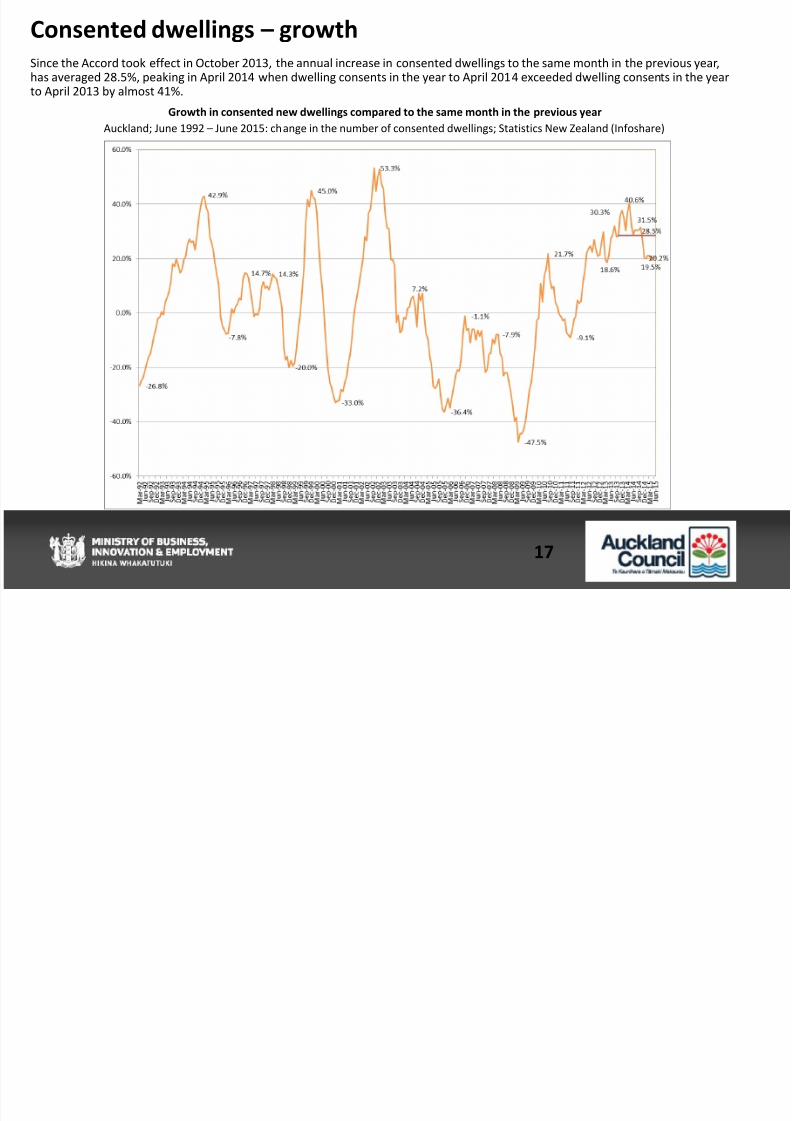
Consented dwellings – growth
Since the Accord took effect in October 2013, the annual increase in consented dwellings to the same month in the previous year,has averaged 28.5%, peaking in April 2014 when dwelling consents in the year to April 2014 exceeded dwelling consents in the yearto April 2013 by almost 41%.
Growth in consented new dwellings compared to the same month in the previous year
Auckland; June 1992 – June 2015: change in the number of consented dwellings; Statistics New Zealand (Infoshare)
8/20/2019 3 Auckland Housing Accord Monitoring Report 7
http://slidepdf.com/reader/full/3-auckland-housing-accord-monitoring-report-7 18/38
18
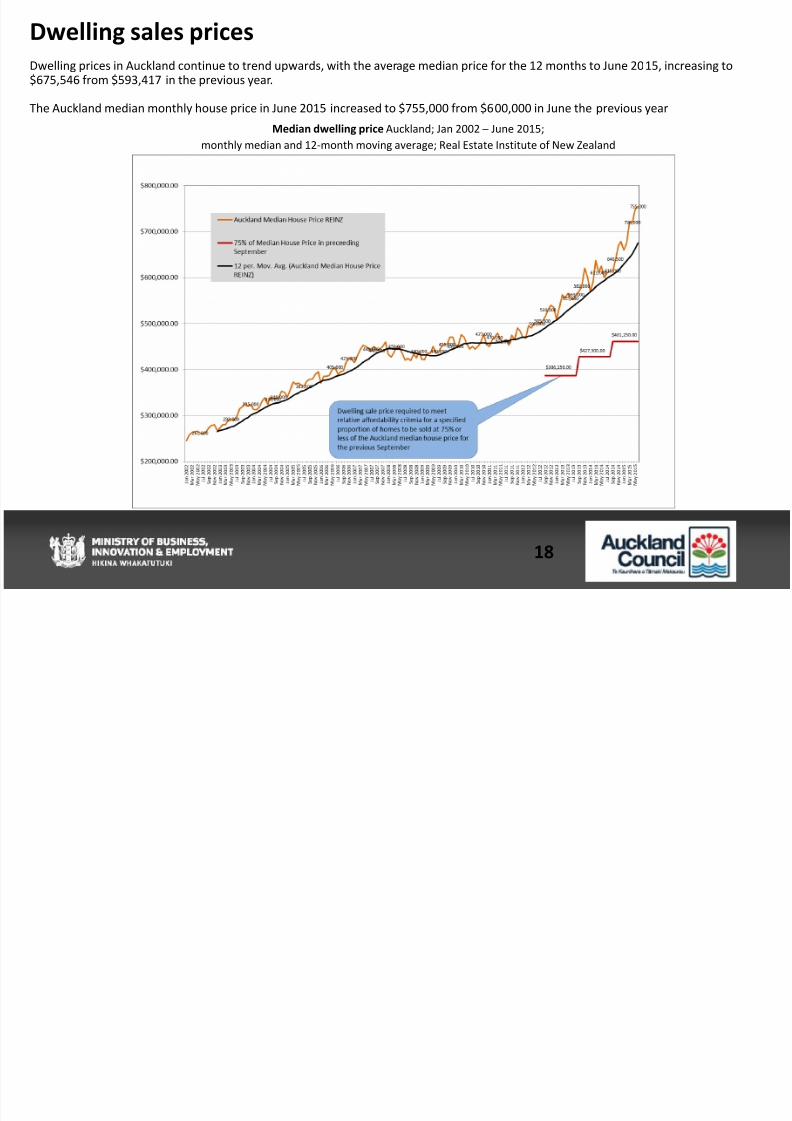
Dwelling sales prices
Dwelling prices in Auckland continue to trend upwards, with the average median price for the 12 months to June 2015, increasing to$675,546 from $593,417 in the previous year.
The Auckland median monthly house price in June 2015 increased to $755,000 from $600,000 in June the previous year
Median dwelling price Auckland; Jan 2002 – June 2015;
monthly median and 12-month moving average; Real Estate Institute of New Zealand
8/20/2019 3 Auckland Housing Accord Monitoring Report 7
http://slidepdf.com/reader/full/3-auckland-housing-accord-monitoring-report-7 19/38
19
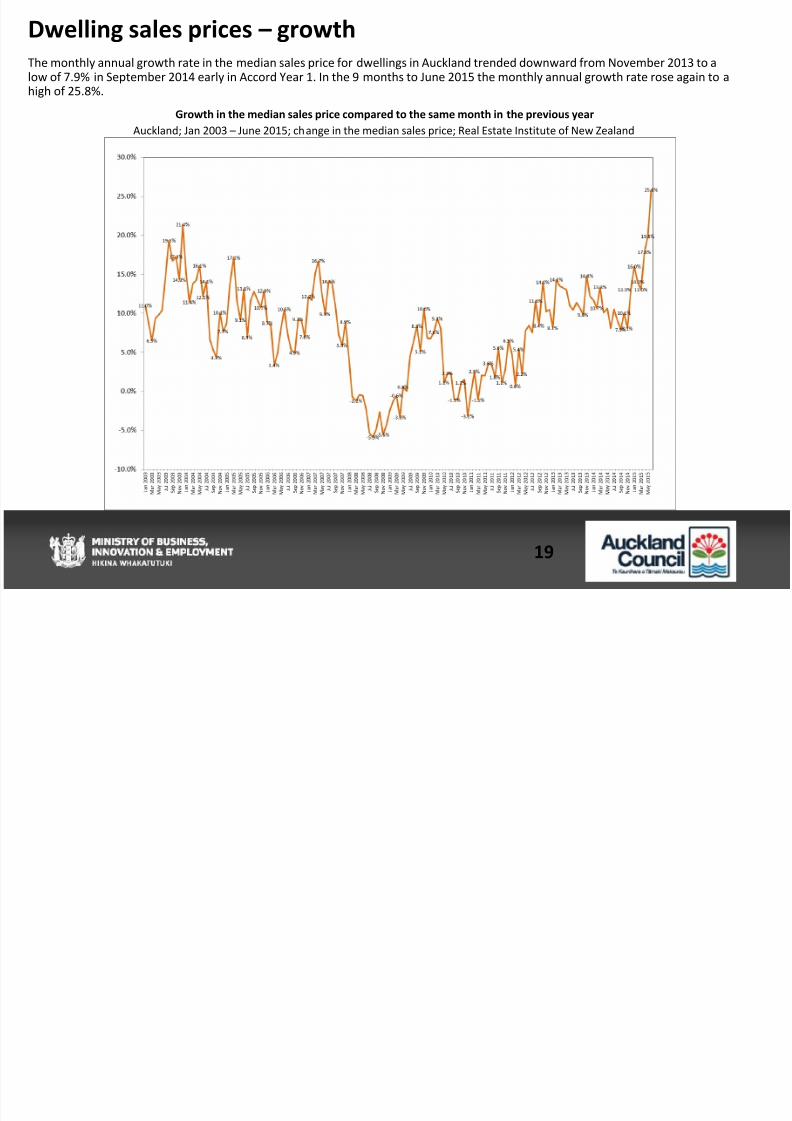
Dwelling sales prices – growth
The monthly annual growth rate in the median sales price for dwellings in Auckland trended downward from November 2013 to alow of 7.9% in September 2014 early in Accord Year 1. In the 9 months to June 2015 the monthly annual growth rate rose again to ahigh of 25.8%.
Growth in the median sales price compared to the same month in the previous year
Auckland; Jan 2003 – June 2015; change in the median sales price; Real Estate Institute of New Zealand
8/20/2019 3 Auckland Housing Accord Monitoring Report 7
http://slidepdf.com/reader/full/3-auckland-housing-accord-monitoring-report-7 20/38
20
Sections
8/20/2019 3 Auckland Housing Accord Monitoring Report 7
http://slidepdf.com/reader/full/3-auckland-housing-accord-monitoring-report-7 21/38
21
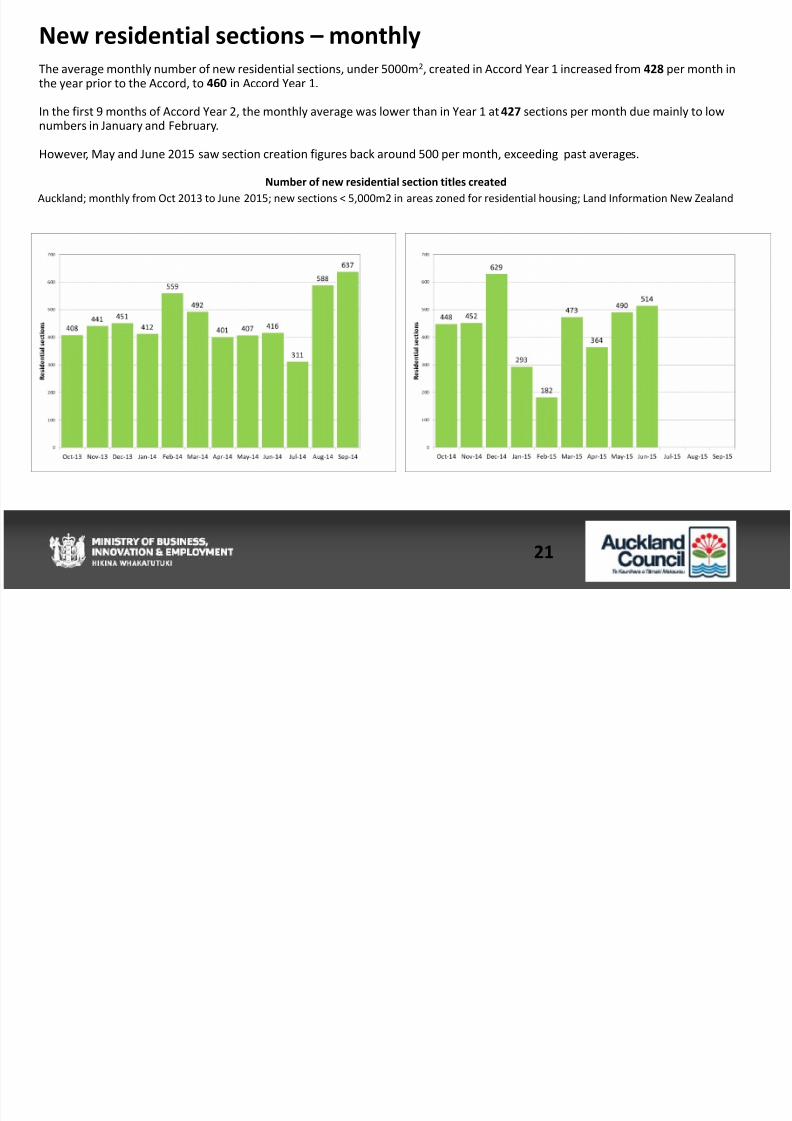
New residential sections – monthly
The average monthly number of new residential sections, under 5000m2, created in Accord Year 1 increased from 428 per month inthe year prior to the Accord, to 460 in Accord Year 1.
In the first 9 months of Accord Year 2, the monthly average was lower than in Year 1 at 427 sections per month due mainly to lownumbers in January and February.
However, May and June 2015 saw section creation figures back around 500 per month, exceeding past averages.
Number of new residential section titles created
Auckland; monthly from Oct 2013 to June 2015; new sections < 5,000m2 in areas zoned for residential housing; Land Information New Zealand
8/20/2019 3 Auckland Housing Accord Monitoring Report 7
http://slidepdf.com/reader/full/3-auckland-housing-accord-monitoring-report-7 22/38
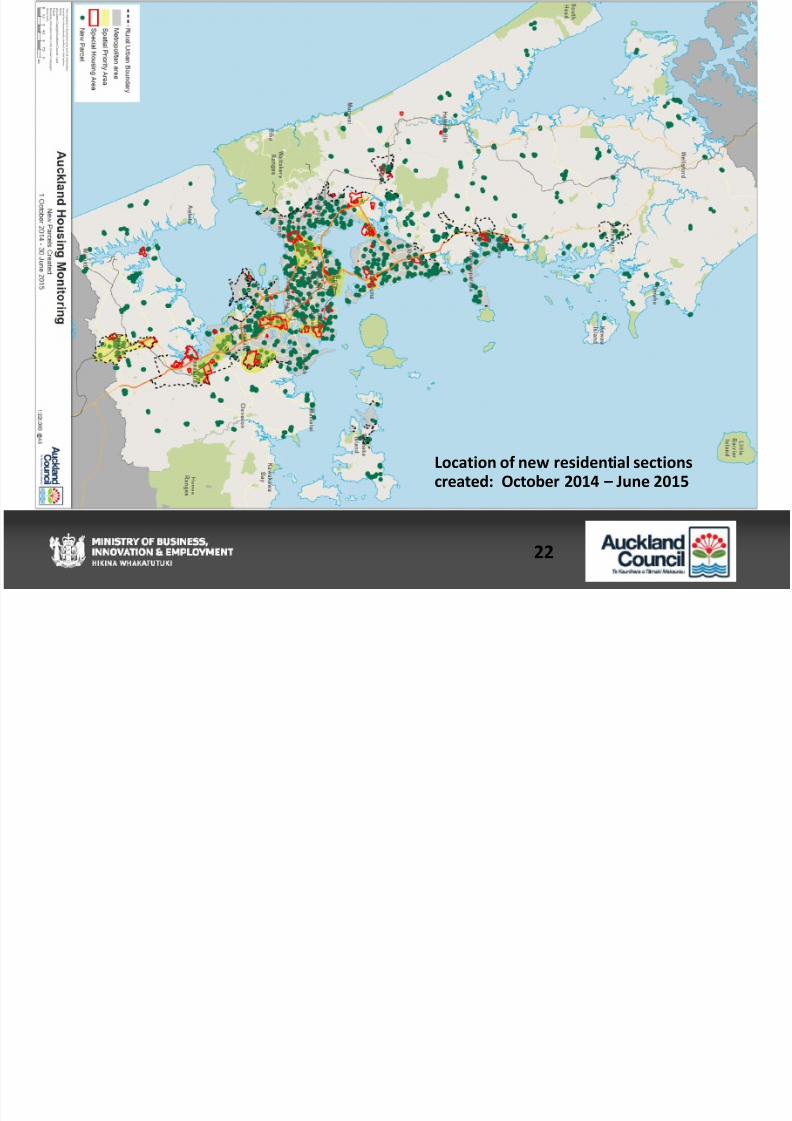
22
Location of new residential sectionscreated: October 2014 – June 2015
8/20/2019 3 Auckland Housing Accord Monitoring Report 7
http://slidepdf.com/reader/full/3-auckland-housing-accord-monitoring-report-7 23/38
23
Special Housing Areas
8/20/2019 3 Auckland Housing Accord Monitoring Report 7
http://slidepdf.com/reader/full/3-auckland-housing-accord-monitoring-report-7 24/38
24
Dwelling creation in special housing areas
8/20/2019 3 Auckland Housing Accord Monitoring Report 7
http://slidepdf.com/reader/full/3-auckland-housing-accord-monitoring-report-7 25/38
25
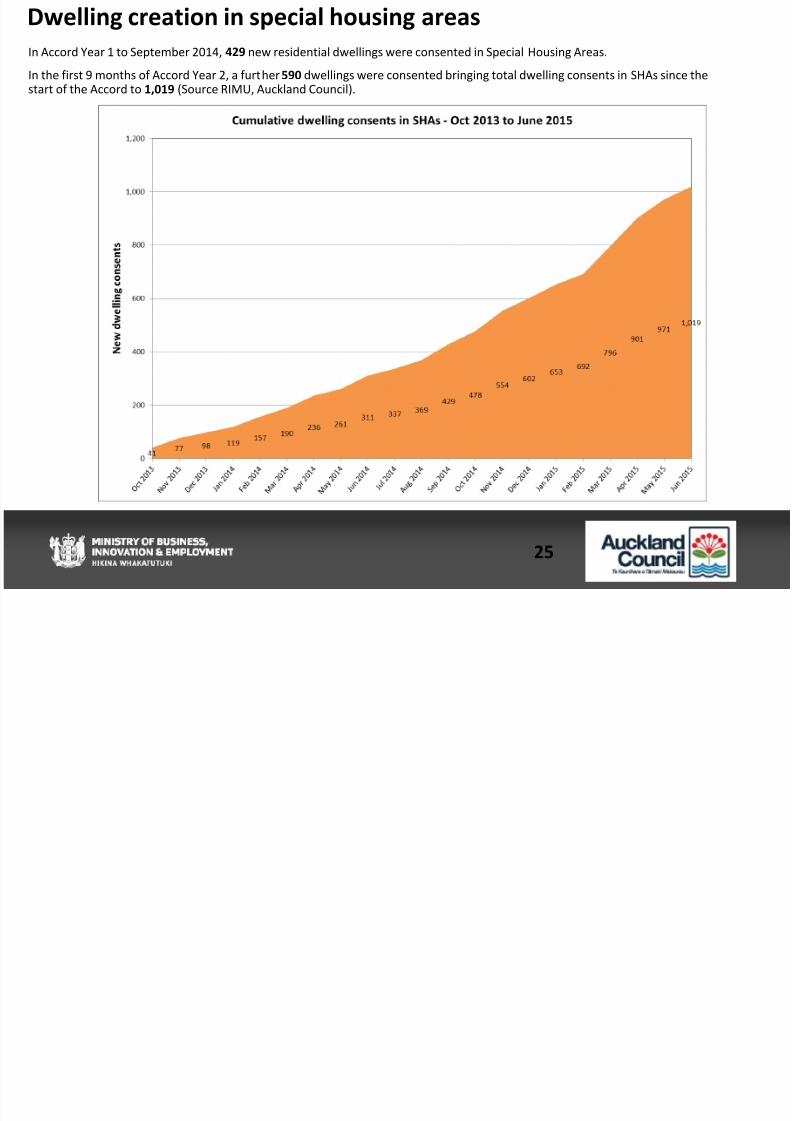
Dwelling creation in special housing areas
In Accord Year 1 to September 2014, 429 new residential dwellings were consented in Special Housing Areas.
In the first 9 months of Accord Year 2, a further 590 dwellings were consented bringing total dwelling consents in SHAs since thestart of the Accord to 1,019 (Source RIMU, Auckland Council).
8/20/2019 3 Auckland Housing Accord Monitoring Report 7
http://slidepdf.com/reader/full/3-auckland-housing-accord-monitoring-report-7 26/38
26
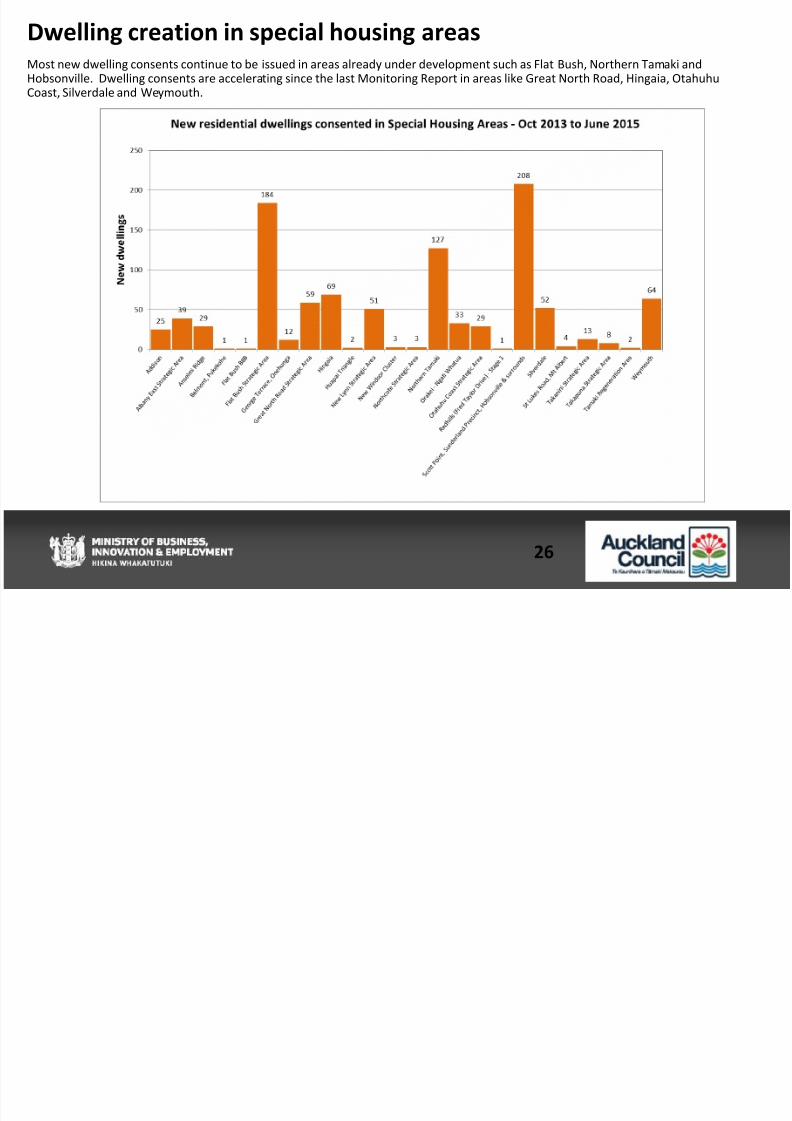
Dwelling creation in special housing areas Most new dwelling consents continue to be issued in areas already under development such as Flat Bush, Northern Tamaki andHobsonville. Dwelling consents are accelerating since the last Monitoring Report in areas like Great North Road, Hingaia, OtahuhuCoast, Silverdale and Weymouth.
S i i i i l h i
8/20/2019 3 Auckland Housing Accord Monitoring Report 7
http://slidepdf.com/reader/full/3-auckland-housing-accord-monitoring-report-7 27/38
27
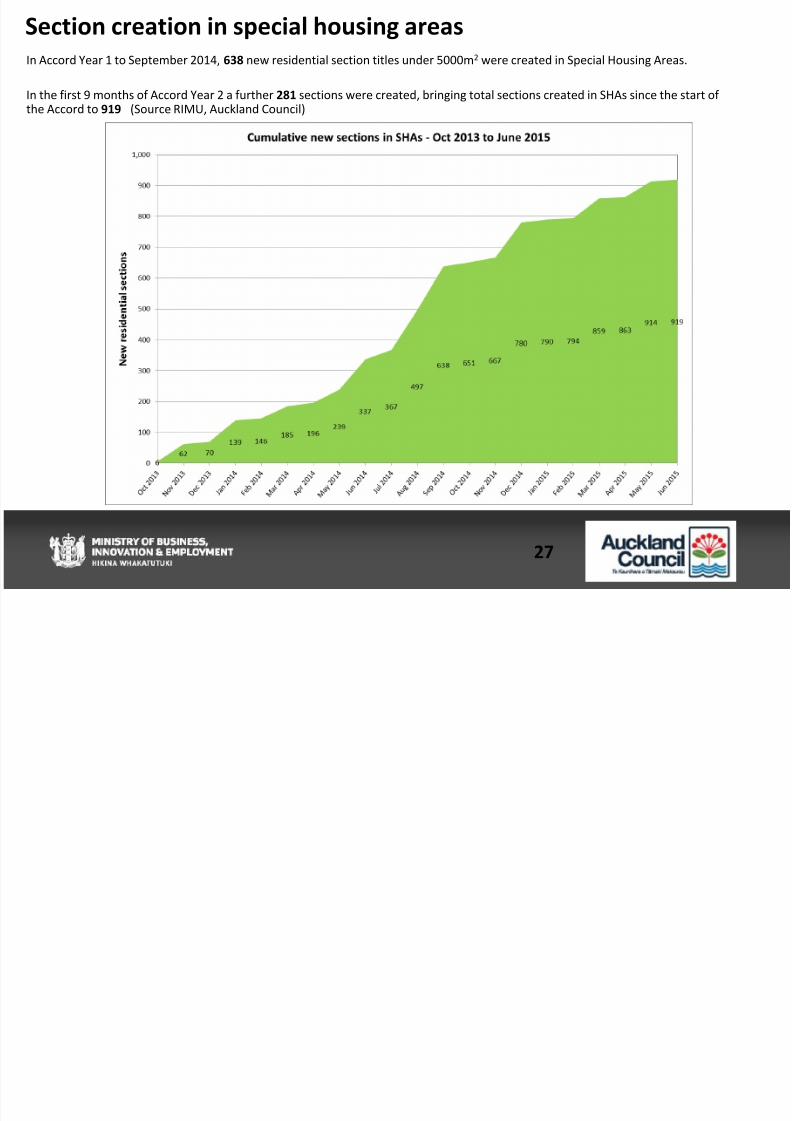
Section creation in special housing areas In Accord Year 1 to September 2014, 638 new residential section titles under 5000m2 were created in Special Housing Areas.
In the first 9 months of Accord Year 2 a further 281 sections were created, bringing total sections created in SHAs since the start ofthe Accord to 919 (Source RIMU, Auckland Council)
Section creation in special housing areas
8/20/2019 3 Auckland Housing Accord Monitoring Report 7
http://slidepdf.com/reader/full/3-auckland-housing-accord-monitoring-report-7 28/38
28
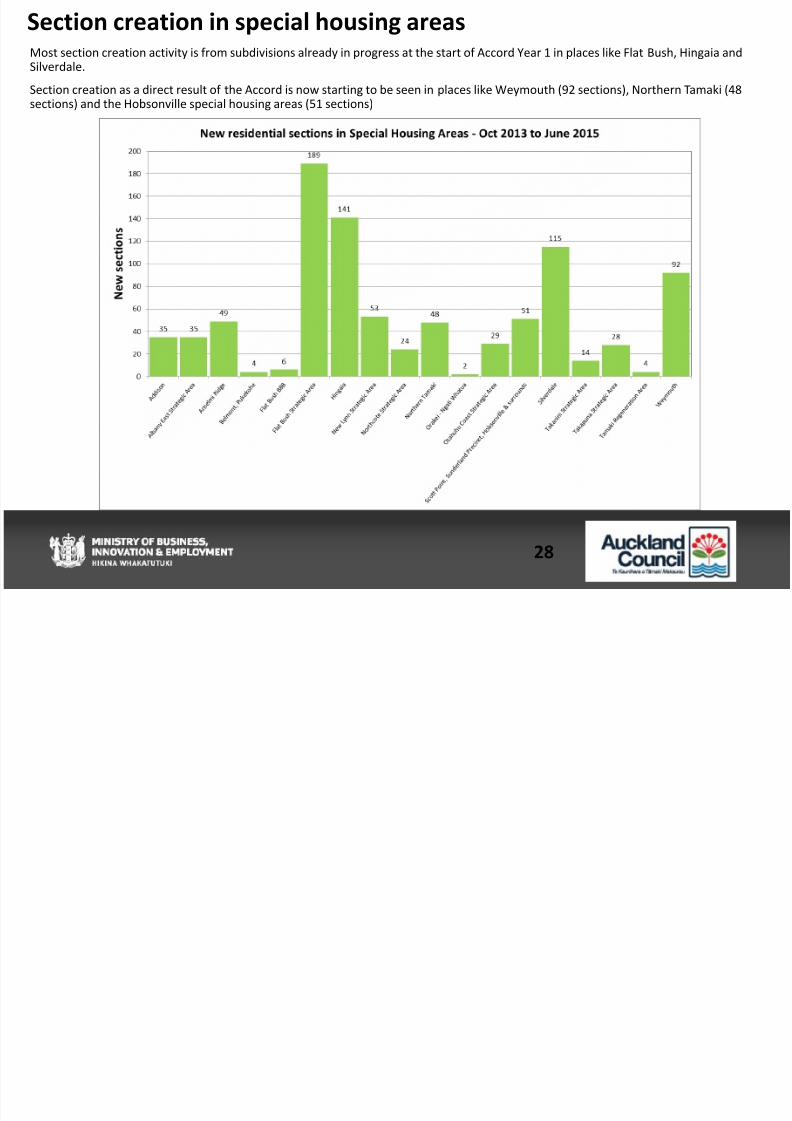
Section creation in special housing areas Most section creation activity is from subdivisions already in progress at the start of Accord Year 1 in places like Flat Bush, Hingaia andSilverdale.
Section creation as a direct result of the Accord is now starting to be seen in places like Weymouth (92 sections), Northern Tamaki (48sections) and the Hobsonville special housing areas (51 sections)
Special housing areas expected supply
8/20/2019 3 Auckland Housing Accord Monitoring Report 7
http://slidepdf.com/reader/full/3-auckland-housing-accord-monitoring-report-7 29/38
29
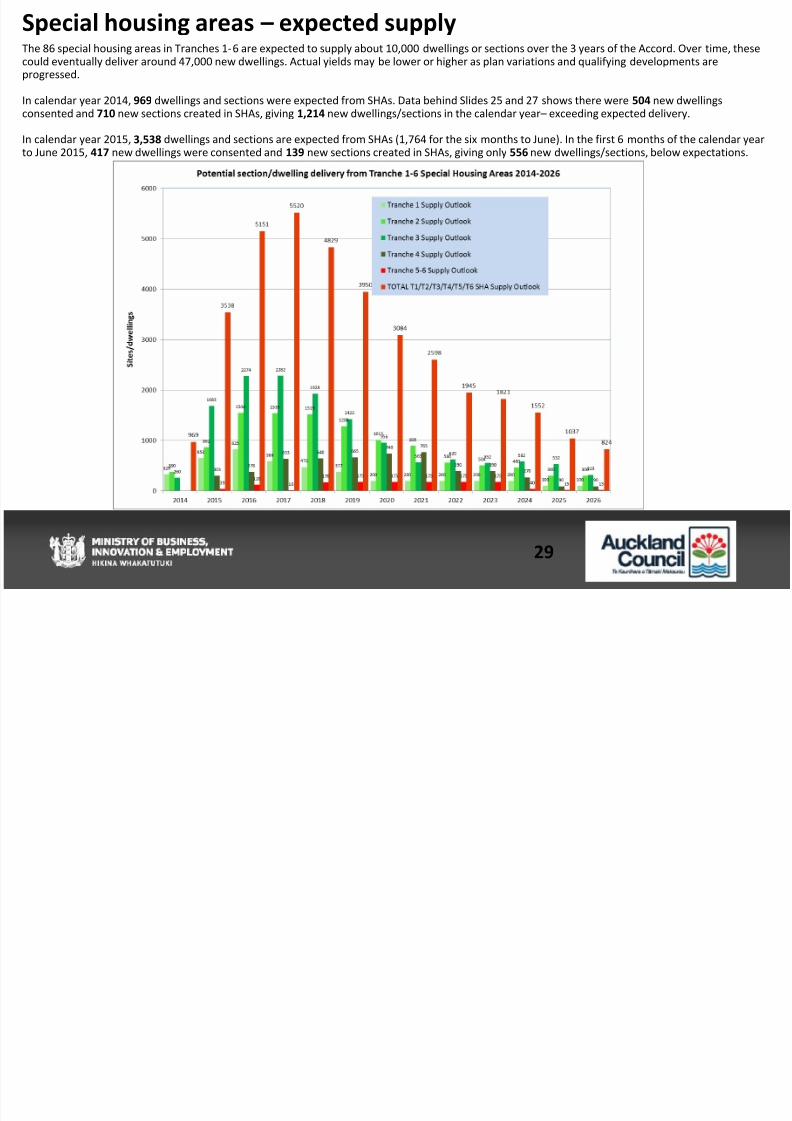
Special housing areas – expected supplyThe 86 special housing areas in Tranches 1-6 are expected to supply about 10,000 dwellings or sections over the 3 years of the Accord. Over time, thesecould eventually deliver around 47,000 new dwellings. Actual yields may be lower or higher as plan variations and qualifying developments areprogressed.
In calendar year 2014, 969 dwellings and sections were expected from SHAs. Data behind Slides 25 and 27 shows there were 504 new dwellingsconsented and 710 new sections created in SHAs, giving 1,214 new dwellings/sections in the calendar year – exceeding expected delivery.
In calendar year 2015, 3,538 dwellings and sections are expected from SHAs (1,764 for the six months to June). In the first 6 months of the calendar yearto June 2015, 417 new dwellings were consented and 139 new sections created in SHAs, giving only 556 new dwellings/sections, below expectations.
8/20/2019 3 Auckland Housing Accord Monitoring Report 7
http://slidepdf.com/reader/full/3-auckland-housing-accord-monitoring-report-7 30/38
30
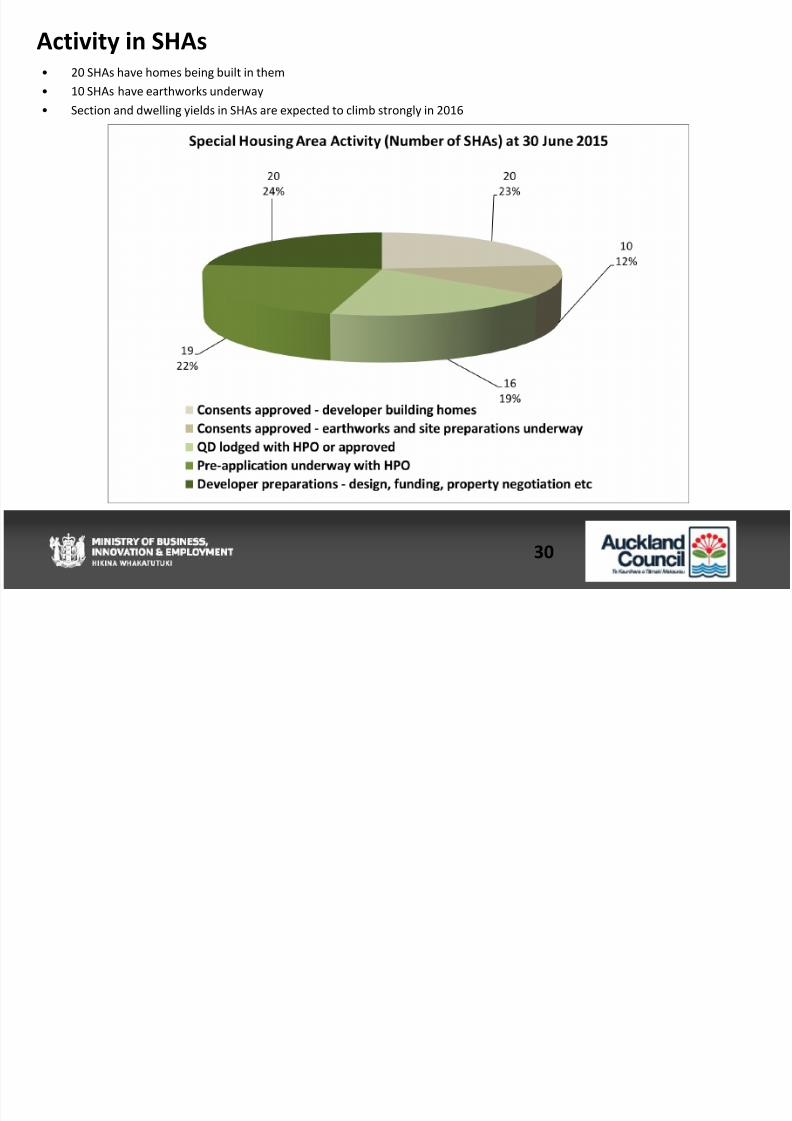
Activity in SHAs • 20 SHAs have homes being built in them
• 10 SHAs have earthworks underway
• Section and dwelling yields in SHAs are expected to climb strongly in 2016
8/20/2019 3 Auckland Housing Accord Monitoring Report 7
http://slidepdf.com/reader/full/3-auckland-housing-accord-monitoring-report-7 31/38
31
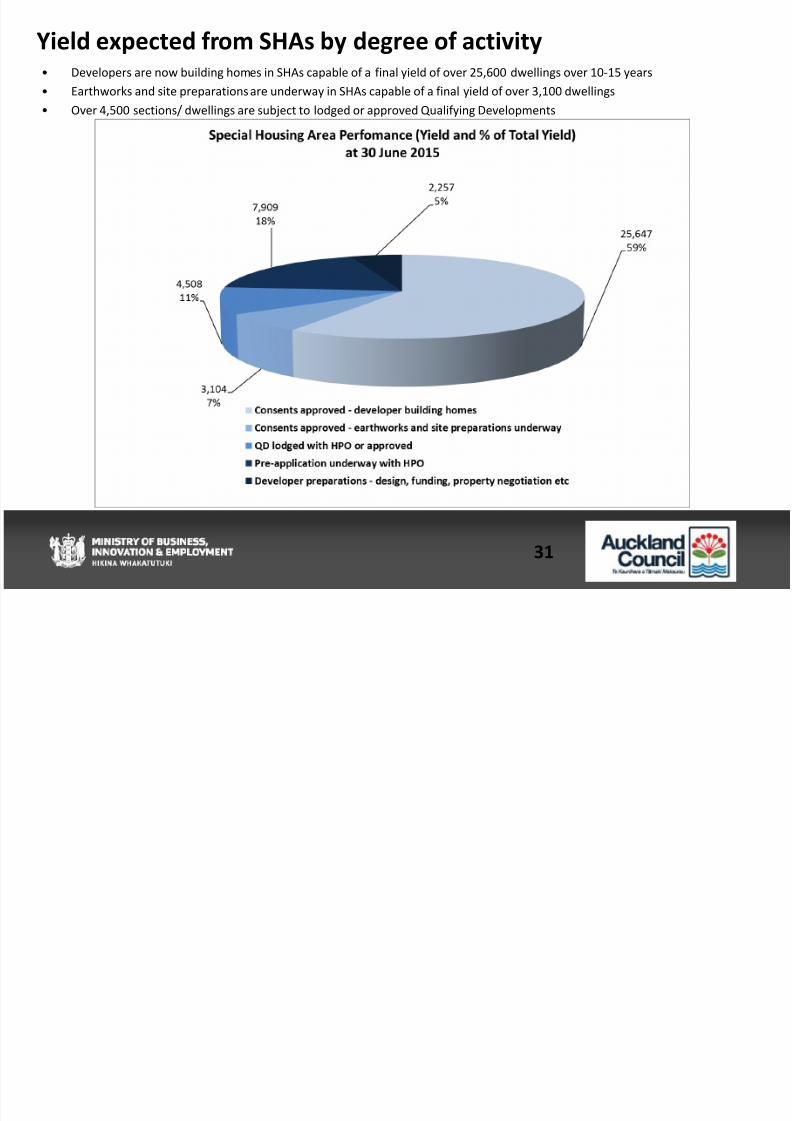
Yield expected from SHAs by degree of activity • Developers are now building homes in SHAs capable of a final yield of over 25,600 dwellings over 10-15 years
• Earthworks and site preparations are underway in SHAs capable of a final yield of over 3,100 dwellings
• Over 4,500 sections/ dwellings are subject to lodged or approved Qualifying Developments
8/20/2019 3 Auckland Housing Accord Monitoring Report 7
http://slidepdf.com/reader/full/3-auckland-housing-accord-monitoring-report-7 32/38
32
HPO Master planning and consenting
HPO Master planning activity – From the beginning of the Accord to 30 June 2015
8/20/2019 3 Auckland Housing Accord Monitoring Report 7
http://slidepdf.com/reader/full/3-auckland-housing-accord-monitoring-report-7 33/38
33
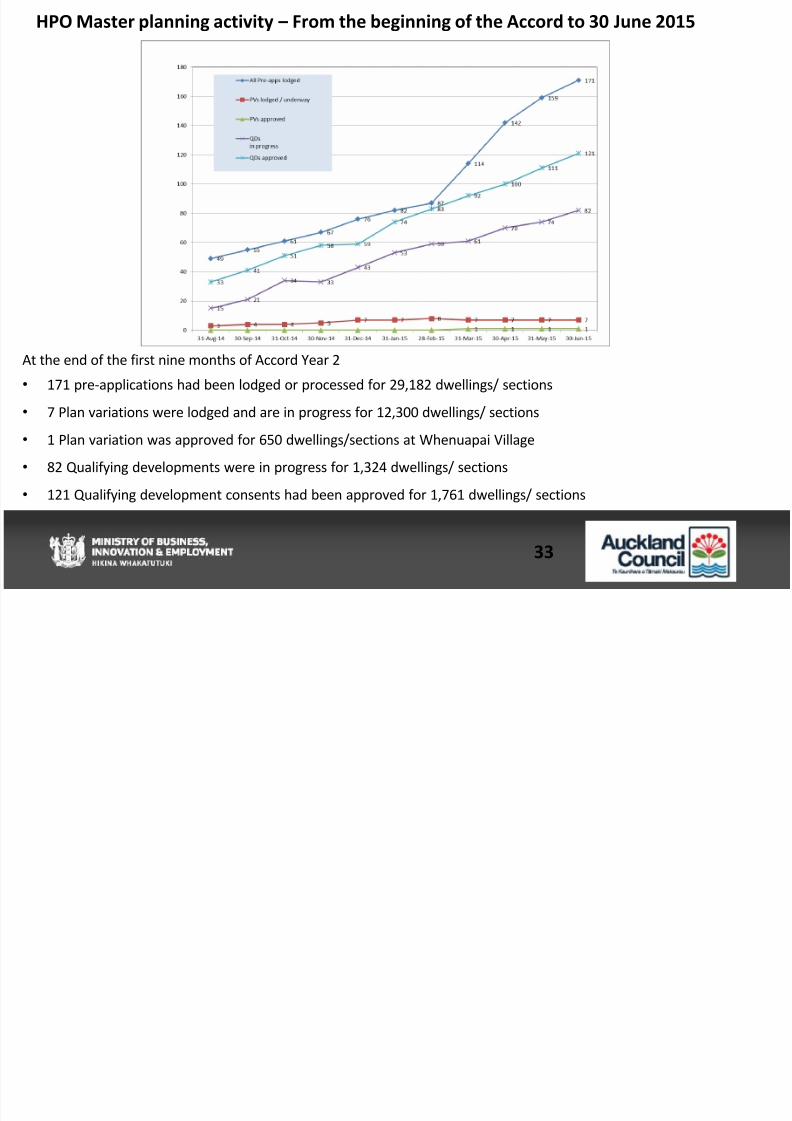
HPO Master planning activity – From the beginning of the Accord to 30 June 2015
At the end of the first nine months of Accord Year 2
• 171 pre-applications had been lodged or processed for 29,182 dwellings/ sections
•
7 Plan variations were lodged and are in progress for 12,300 dwellings/ sections• 1 Plan variation was approved for 650 dwellings/sections at Whenuapai Village
• 82 Qualifying developments were in progress for 1,324 dwellings/ sections
• 121 Qualifying development consents had been approved for 1,761 dwellings/ sections
8/20/2019 3 Auckland Housing Accord Monitoring Report 7
http://slidepdf.com/reader/full/3-auckland-housing-accord-monitoring-report-7 34/38
34
Land supply
8/20/2019 3 Auckland Housing Accord Monitoring Report 7
http://slidepdf.com/reader/full/3-auckland-housing-accord-monitoring-report-7 35/38
35
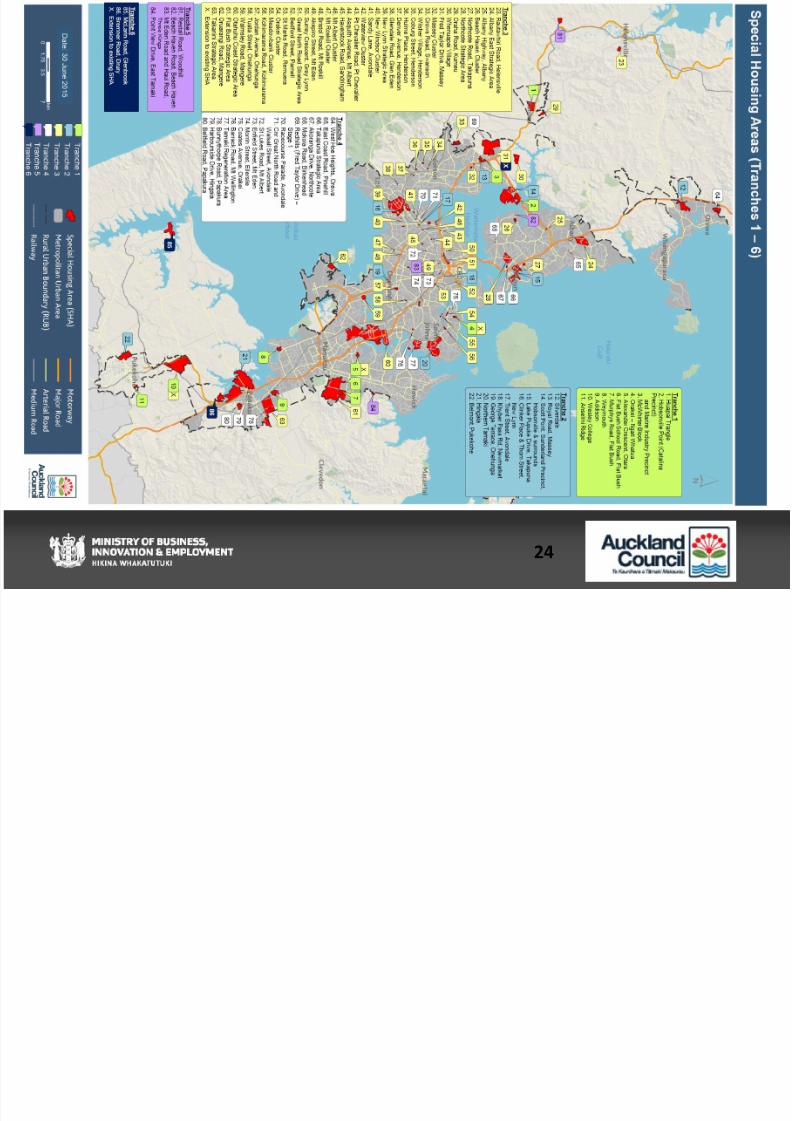
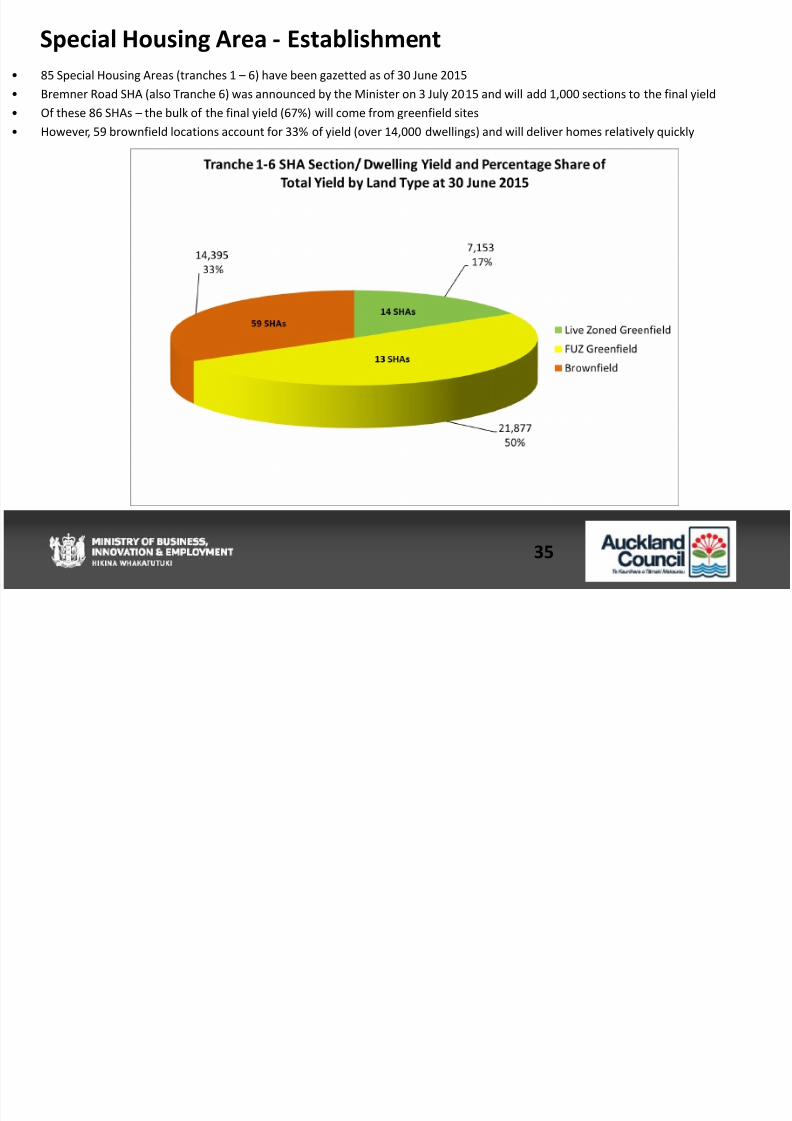
• 85 Special Housing Areas (tranches 1 – 6) have been gazetted as of 30 June 2015
• Bremner Road SHA (also Tranche 6) was announced by the Minister on 3 July 2015 and will add 1,000 sections to the final yield
• Of these 86 SHAs – the bulk of the final yield (67%) will come from greenfield sites
• However, 59 brownfield locations account for 33% of yield (over 14,000 dwellings) and will deliver homes relatively quickly
Special Housing Area - Establishment
SHAs and future urban land supply outside the 2010 MUL
8/20/2019 3 Auckland Housing Accord Monitoring Report 7
http://slidepdf.com/reader/full/3-auckland-housing-accord-monitoring-report-7 36/38
36
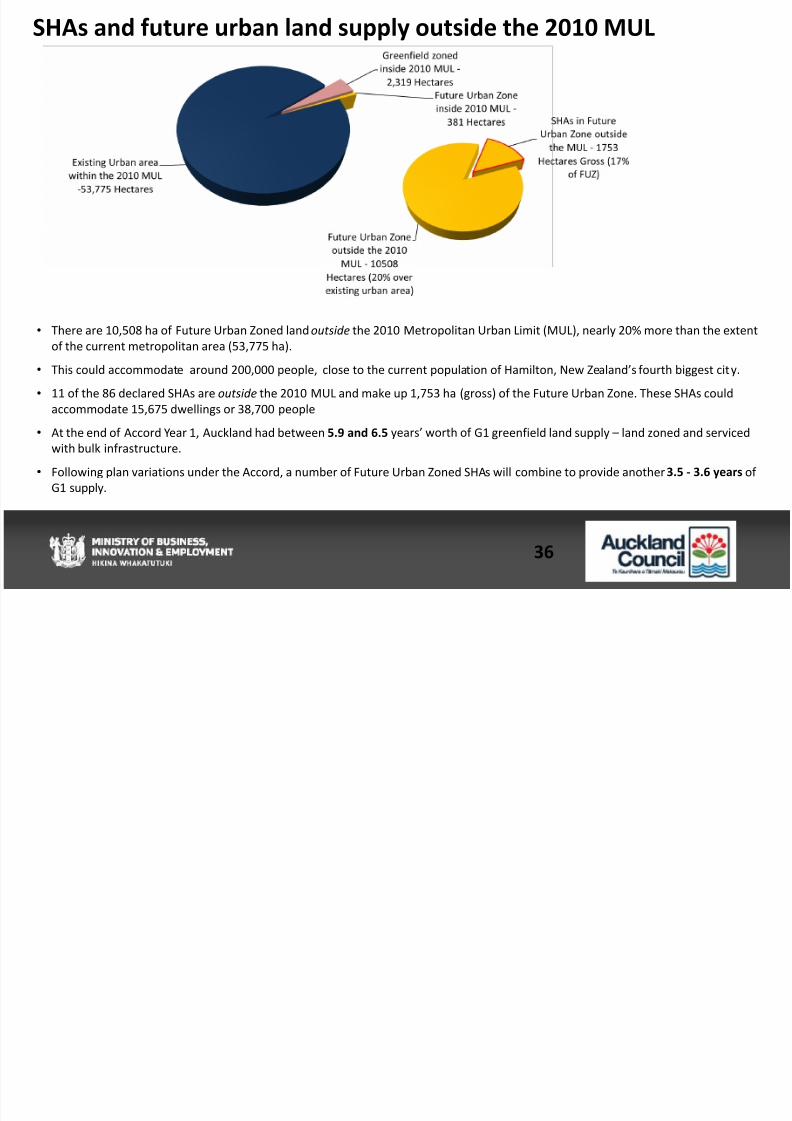
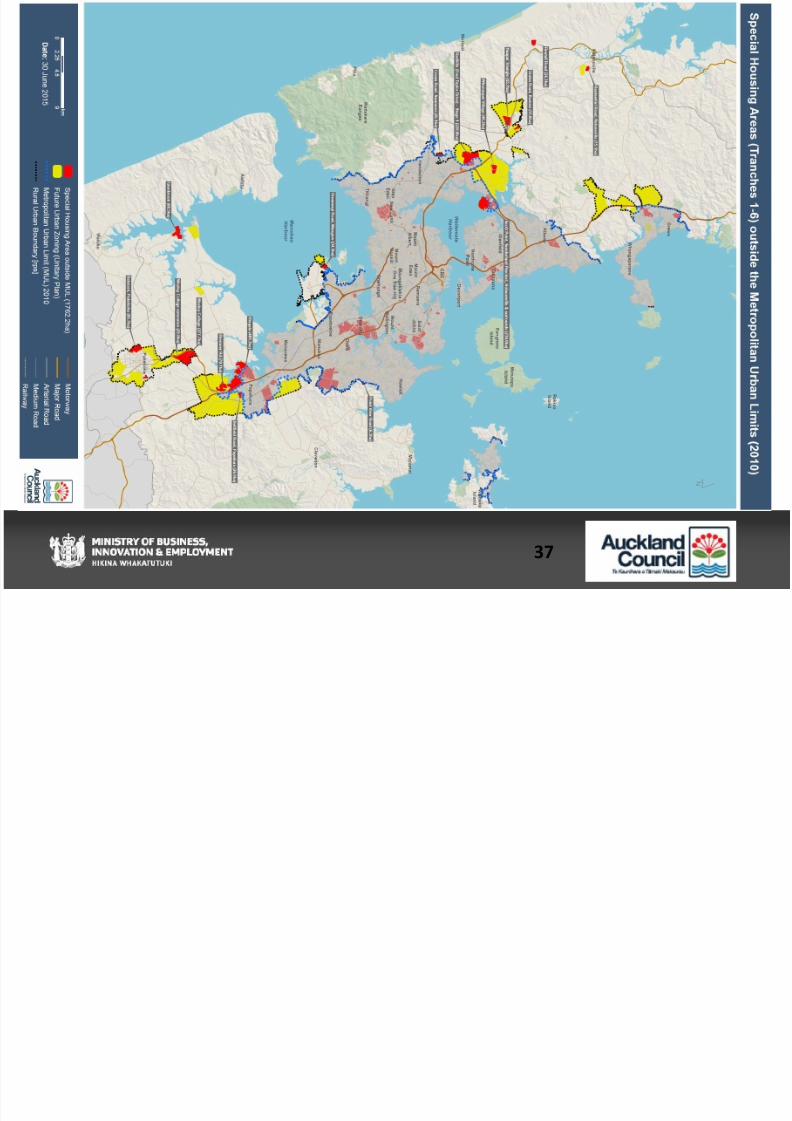
SHAs and future urban land supply outside the 2010 MUL
• There are 10,508 ha of Future Urban Zoned land outside the 2010 Metropolitan Urban Limit (MUL), nearly 20% more than the extent
of the current metropolitan area (53,775 ha).
• This could accommodate around 200,000 people, close to the current population of Hamilton, New Zealand’s fourth biggest city.
• 11 of the 86 declared SHAs are outside the 2010 MUL and make up 1,753 ha (gross) of the Future Urban Zone. These SHAs could
accommodate 15,675 dwellings or 38,700 people
• At the end of Accord Year 1, Auckland had between 5.9 and 6.5 years’ worth of G1 greenfield land supply – land zoned and serviced
with bulk infrastructure.
• Following plan variations under the Accord, a number of Future Urban Zoned SHAs will combine to provide another 3.5 - 3.6 years of
G1 supply.
SHAs and future urban land supply outside the 2010 MUL
8/20/2019 3 Auckland Housing Accord Monitoring Report 7
http://slidepdf.com/reader/full/3-auckland-housing-accord-monitoring-report-7 37/38
37
SHAs and future urban land supply outside the 2010 MUL
C l ti l t d lli l f t
8/20/2019 3 Auckland Housing Accord Monitoring Report 7
http://slidepdf.com/reader/full/3-auckland-housing-accord-monitoring-report-7 38/38
38
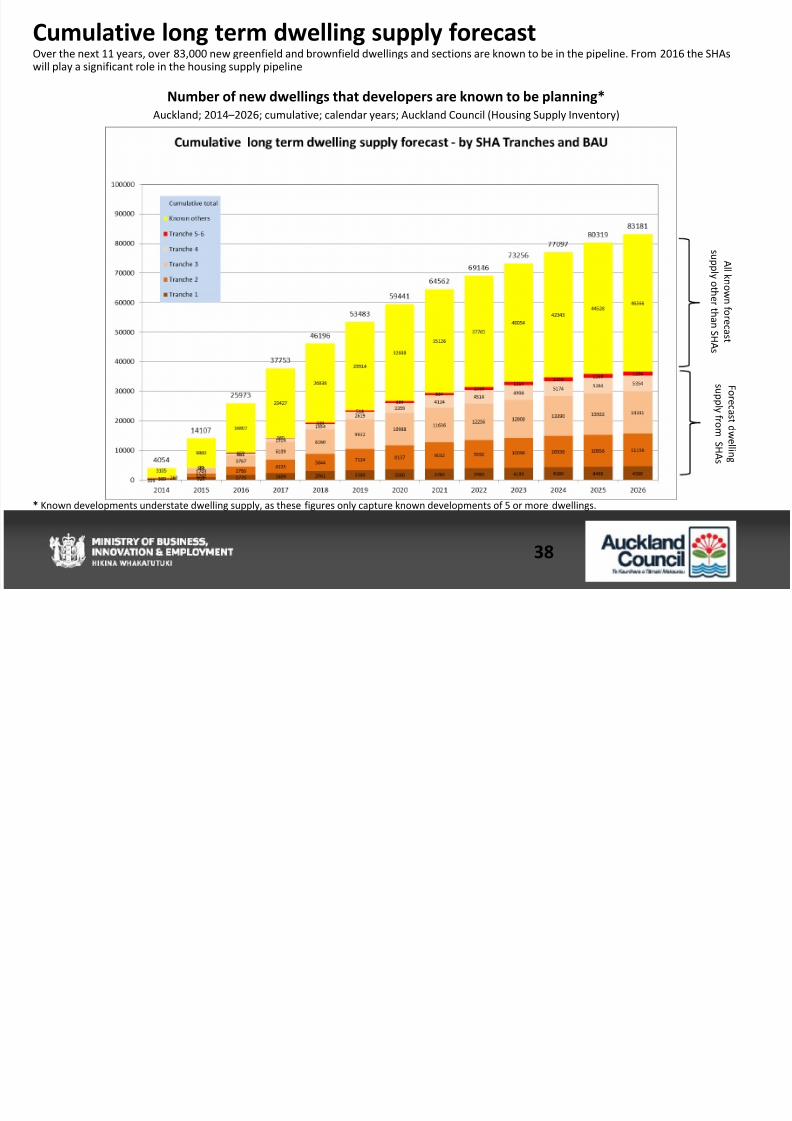
Cumulative long term dwelling supply forecastOver the next 11 years, over 83,000 new greenfield and brownfield dwellings and sections are known to be in the pipeline. From 2016 the SHAswill play a significant role in the housing supply pipeline
Number of new dwellings that developers are known to be planning*
Auckland; 2014 –2026; cumulative; calendar years; Auckland Council (Housing Supply Inventory)
* Known developments understate dwelling supply, as these figures only capture known developments of 5 or more dwellings.
F o r e c a
s t d w e l l i n g
s u p p l y
f r o m S H A s
A l l
k n o w n f o r e c a s t
s u p p l y o t h e r t h a n S H A s