Embed Size (px)
Citation preview

The African Statistical Journal, Volume 14, May 2012 83
3. An alternative approach for determining air transportation costs in the International Comparison Program
Abdoulaye Adam1
AbstractIn the International Comparison Program (ICP) the cost of air transportation is compared across countries. The cost of air transportation between two cities varies depending on the quality of service and the air carrier. The quality of service (aircraft type, meals and refreshments, on-board entertainment, flight schedule, etc) is reflected in the price of the ticket. The date of issuing the ticket before travel is also a price-determining factor. Precisely capturing all the price-determining characteristics in the product description is difficult and may not be feasible. Therefore, airfare prices constitute a challenge for ICP price collection if like is to be compared like with like.
This paper examines air transportation structured product descriptions (SPDs) from the 2005 and in 2011 ICP rounds and notes their deficiencies for purposes of comparison. It proposes a number of improvements: (i) using a geographic coordinate system (latitude and longitude) to determine orthodromic distances between departure and destination points; and (ii) basing comparisons on unit (kilometer or mile) costs of these orthodromic distances. It would then be possible for air transportation price data to be collected directly by Regional Coordination teams or by the Global Office through travel agencies, using the major Computer Reservation System (CRS) vendors.
Key words: Airfare prices, Structured Product Descriptions, Latitude, Longitude, Orthodromic Distances, Computer Reservation System
RésuméLes coûts du transport aérien sont comparés entre les pays dans le Programme de comparaison internationale (PCI). Le coût du transport aérien entre deux villes varie en fonction de la qualité du service et de la compagnie aérienne. La qualité du service (type d’aéronef, les repas, les rafraîchissements et le divertissement à bord, l’horaire de vol, etc.) est répercutée sur le prix du billet. La date d’émission du billet avant le voyage est aussi un facteur déterminant le prix. Capter avec précision toutes les caractéristiques déterminant le prix dans la description du produit est difficile et peut ne pas être réalisable. En conséquence, les prix des billets d’avion constituent un défi pour la collecte des prix du PCI en vue de comparer des choses comparables.
1 Abdoulaye ADAM, International Statistical Consultant BP 12965 Niamey NIGER, Email:[email protected]

Journal statistique africain, numéro 14, mai 201284
Abdoulaye Adam
Ce document examine les descriptions structurées de produits (DSP) du transport aérien des deux cycles 2005 et 2011 du PCI et met en exergue leurs lacunes en termes d’exhaustivité pour des fins de comparaison. Il propose un certain nombre d’améliorations et recommande de: (i) utiliser les coordonnées géographiques (latitude et longitude) pour déterminer les distances orthodromiques entre les points de départ et de destination et ; baser les comparaisons sur les coûts uni-taires (km ou mile) de ces distances orthodromiques. Alors il est possible de faire la collecte des prix du transport aérien directement par les équipes régionales de coordination ou par le Bureau mondial à travers des agences de voyages en utilisant les systèmes informatiques majeurs de réservation.
Mots clés : Tarifs aériens, Descriptions structurées de produits, Latitude, Lon-gitude, Distances orthodromiques, Système informatique de réservation
1. INTRODUCTION
The qualityof Purchasing Power Parities (PPPs), which are used for country comparisons, depends on the capacity to separate pure price levels from other factors, and to measure them accordingly. One of the most difficult problems in constructing those indices is accurately describing products so as to capture and treat quality change and/or differences across countries. A product is the smallest entity on which price measurements may be made and compared. It should be defined by a “complete description.”
In the 2005 International Comparison Program (ICP) round, Structured Product Descriptions (SPDs) were used to describe products, the prices of which were collected and compared among countries. An SPD is a coherent and structured set of price-determining characteristics or parameters aimed at describing goods and services in a rationalized fashion in order to develop an item list and harmonize item identification for price surveys in different countries. SPDs provide all the relevant characteristics of products, whereby each product represents a particular configuration of those characteristics.
Airfare prices were collected during the 2005 ICP round from two main sources: (i) airline companies and (ii) travel agencies using Computer Reser-vation Systems and/or airlines. In addition to airfare, surcharges, and taxes, the price of a ticket includes the quality of the service (aircraft type, meals and refreshments, on-board entertainment, flight schedule, etc). The date of issuing the ticket before travel is also a price-determinant.
The African Statistical Journal, Volume 14, May 2012 85
3. An alternative approach for determining air transportation costs in the International Comparison Program
The air transportation products in 2005 were not directly comparable. The SPDs failed to capture differences in the quality of services. As well, the distances involved differed considerably.
This paper examines the 2005 and in 2011 air transportation SPDs and notes their shortcomings for comparative purposes. To make the prices of air transportation more comparable, improvements are proposed for the 2011 ICP product list: (i) use of a geographic coordinate system (latitude and longitude) to determine orthodromic distances between the points of departure and destination, and (ii) basing the comparisons on the unit (kilometer or mile) cost of these orthodromic distances. This would make it possible for price data for air transportation to be collected directly by Regional Coordination teams or by the Global Office through travel agen-cies, using the major Computer Reservation System (CRS) vendors.
2. DEsCRIPTIONs UsED IN 2005 AND 2011 ICP-AfRICA ROUNDs
Structured Product Descriptions (SPDs) were used in 2005 to define prod-ucts in the ICP-Africa list, including transportation by air. An example is provided in Table 1.

Journal statistique africain, numéro 14, mai 201286
Abdoulaye Adam
Table 1: Example of air transportation product description in 2005 ICP-Africa
Basic heading: Passenger transport by air
Position élémentaire : Transport de voyageurs par air
Product name: Airfare to johannesburg Product code: 088.01
Nom du produit : Tarif vol aérien pour johannesburg
Code du produit : 088.01
Preferred quantity and unit of meas-urement:
1 service Quantité de référence et Unité de Mesure :
1 Service
Product description:
• Quantity: 1 service
• Type : Scheduled service
• Discounts/Type of ticket : Weekend rule (night Saturday/Sunday must be spent at destination)
• Discounts/Type of ticket : Minimum stay (of _7__ days)
• Discounts/Type of ticket : Maximum stay (of __60_ days)
• Discounts/Type of ticket : Advance reservation ( _14_ days)
• Discounts/Type of ticket : Advance payment ( _14_ days)
• Taxes : Airport tax included
• Type of Trip : Round trip
• Luggage : Included up to_25_kg
• Other item features : Cheapest non-rebookable Economy class fare
• Other item features : Exclude airport or departure tax
A problem with the description in Table 1 is that a major price-determining factor—the distance between the points of departure and destination—is not considered, so the product is not directly comparable across countries. And because the data source (airline or travel agency) is not indicated, the difficulty of product comparability is compounded. Furthermore, as

The African Statistical Journal, Volume 14, May 2012 87
3. An alternative approach for determining air transportation costs in the International Comparison Program
pointed out earlier, the quality of the service, and thus, the cost depends on the airline. One of the characteristics of the product is “Cheapest non-rebookable Economy class fare,” but this does not cover other restrictive conditions like date fixity or date change penalties. A better way of taking conditions of ticket usage into account would be to include the type of Economy class ticket.
The descriptions of Transportation by air products have been improved in the 2011 ICP product list. An example is presented in Table 2.
Table 2: Example of air transportation product description in 2011 ICP-Africa
Basic heading 1107331 Passenger transport by air
Product 110733106 Flight, International, return ticket – Long Distance
Number of units: 1 Unit of measurement: Ticket
Product specifications:
Transportation Type: International flight; round trip
Ticket type: Return ticket; not changeable after issue; non refundable
Starting point: Major airpoirt of the country
Destination: Most popular international destination
Distance: Approximately 14,000 km
Class: Economy adult passenger
Departure date: On or about last Wedneysday of April
Issued before departure: 42 - 56 days
Payment: When issued
Price includes: All additional taxes, fees, surcharges and charges included in the ticket, e.g. departure tax, passenger service charge, fuel surcharge
Price excludes: Price reductions, e.g. discount or special offer only for best customers
Purchasing place: Travel agent
Comments: Specify destination
The 2011 SPD is an improvement over 2005, but the description still does not properly address the distance issue, which is a major price determinant. The most popular international destinations vary in different countries and can be far less than 14,000 km away. The 2011 SPD requires that the destination, distance in km, additional taxes, fees, surcharges and charges be

Journal statistique africain, numéro 14, mai 201288
Abdoulaye Adam
specified. However, these data, all of which are important in determining the price of a ticket, may not be collected unless the it is clearly specified that they be included. Thus, the data collection instruments should have fields for these elements, just as there is for the price of the ticket. Also, it should be clear that distance refers to flying distance based on orthodromic distance.
3. sUggEsTED APPROACh fOR COllECTION Of AIR TRANsPORTATION PRICEs
3.1 Data sources
Airline companies and travel agencies are the two main sources of air trans-portation price data. Tariffs can be classified into two groups: (i) public domain information, which is accessible worldwide, provided by the three major global Computer Reservation System vendors—Amadeus, Sabre and Travelport (including Galileo and Worldspan); and (ii) market tariff, which is accessible in countries or regions only for the points of departure. For example, a travel agency in Tunis, Tunisia, does not have access to the U.S. market prices, and American travel agencies do not have access to price information for North Africa. To ensure comparability, it is essential that the same source be used to determine the price of air transportation products. This can be done if prices are determined globally.
3.2 Class types
In addition to the different data sources, prices vary within the same class depending on the class type:
• First Class: F, A and P• Business Class: J, C, D and Z• Economy Class: Y, L, K, Q, V, T, H, S and B
Each class type has different own conditions of ticket usage (e.g., date fixity, date change penalties, reimbursement, and validity).
3.3 geographic coordinate system
A location can be identified based on its latitude and its longitude, which Wikipedia defines as:
The African Statistical Journal, Volume 14, May 2012 89
3. An alternative approach for determining air transportation costs in the International Comparison Program
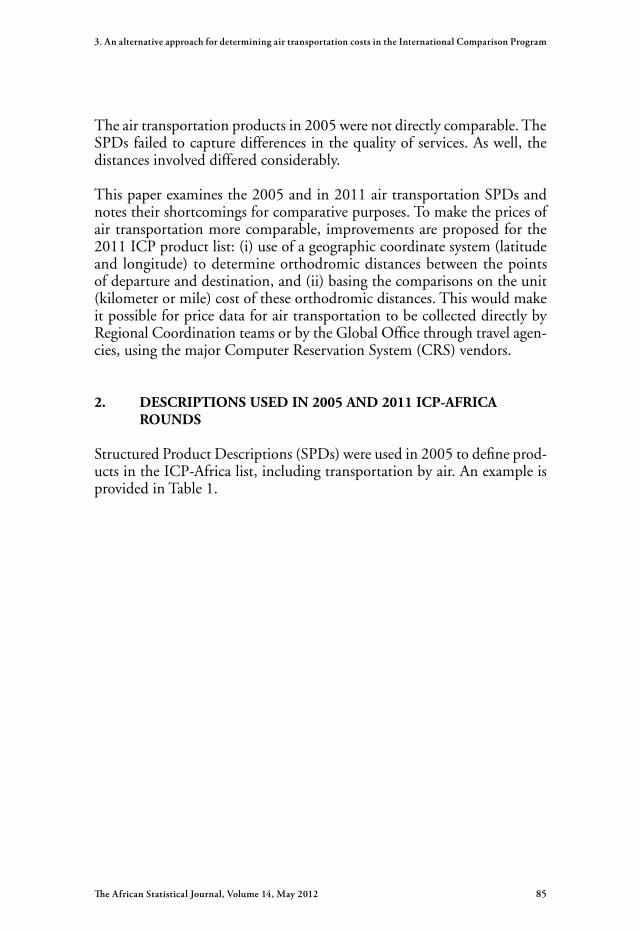
• The latitude of a location is the angular distance of that location south or north of the Equator. It is an angle and is usually measured in degrees. The Equator has a latitude of 0°, while the North and South Poles have, respectively, a latitude of 90° north (written 90° N or +90°), and a latitude of 90° south (written 90° S or −90°). The latitude of point A is the angle φ between the normal of the point and the Equator.
Figure 1: Definition of the latitude of a point A
• longitude specifies the east-west position of a point on the Earth’s surface. Points with the same longitude lie in lines running from the North to the South Pole, known as meridians. By convention, the position of zero degrees longitude is the position of the Prime Meridian, which passes through the Royal Observatory, Greenwich, England. The longitude of other places is measured as an angle east or west of the Prime Meridian. Specifically, it is the angle between a plane containing the Prime Meridian and a plane containing the North Pole, South Pole and the location in question. It ranges from 0° at the Prime Meridian to +180° eastward and −180° westward.
To precisely locate points on Earth, latitude and longitude are expressed in degrees, minutes, and seconds. A one-degree variation in latitude is about 69 miles; a minute of latitude, approximately 1.15 miles; and a second of latitude, approximately 0.02 miles. The magnitude of a difference induced by a longitude variation depends on the latitude. At the Equator, it is ap-proximately 69 miles, the same as a degree of latitude. At latitude of 45 degrees, a degree of longitude is approximately 49 miles. The size gradually decreases to zero as the meridians converge at the poles.
North Pole
φ Equator
Normal
Tangent
A

Journal statistique africain, numéro 14, mai 201290
Abdoulaye Adam
3.4 Central angle
A central angle is an angle whose vertex is the center of a circle and whose sides pass through a pair of points on the circle. The sides subtend an arc between the two points whose angle is (by definition) equal to the central angle itself.
Figure 2: Definition of a central angle
The angle AOB forms a central angle, with center O and sides OA and OB.
Let ffss λφλφ ,;, be the geographical latitude and longitude of the two points A and B (a point of departure and a point of destination of a journey), and let λφ ΔΔ , be, respectively, their differences; then , the central angle be-tween them, is given by the spherical law of cosines defined in Wikipedia as:
)coscoscossincos(sinˆ λφφφφσ Δ+=Δ fsfsar (1)
When the distance is small (the two points are not far apart), the above formula can have large rounding errors. In that case, the harversine formula below is more numerically stable.
⎟⎟⎠
⎞⎜⎜⎝
⎛⎟⎠
⎞⎜⎝
⎛ Δ+⎟⎠
⎞⎜⎝
⎛ Δ=Δ2
sincoscos2
sinarcsin2ˆ 22 λφφ
φσ fs (2)
If the points are on opposite ends of the sphere (antipodal points), the following more complicated formula, which is accurate for all distances, should be used:
O
B A

The African Statistical Journal, Volume 14, May 2012 91
3. An alternative approach for determining air transportation costs in the International Comparison Program
⎟⎟⎟
⎠
⎞
⎜⎜⎜
⎝
⎛
Δ+
Δ−+Δ=Δ
λφφφφ
λφφφφλφσ
coscoscossinsin
)coscossinsin(cos)sin(cosarctanˆ
22
fsfs
fsfsf
(3)
3.5 Orthodromic distance
In Euclidean geometry, the shortest distance between two points is the straight line joining them. In spherical geometry, distances are generally measured along a path on the surface of a sphere. The orthodromic distance, or the great-circle distance, between two points is the shortest distance between the two points on the surface of a sphere.
Geodesics/Great circles are defined as circles on the sphere whose centers are coincident with the center of the sphere. Geodesics/Great circles possess two essential features of Euclidean geometry:
• A point that moves along the surface of a sphere without turning will follow a great circle.
• The shortest distance between two points on a sphere lies along a great circle.
The distance d between two points on a sphere of radius r, and central angle σ̂Δ (expressed in radians) is given by:
σ̂Δ= rd (4)
The shape of the earth resembles a flattened sphere. The average radius for that approximation is 6371.01 km, while the quadratic mean or root mean square approximation of the average great circle circumference gives a radius of about 6372.8 km
Example of the computation of the orthodromic distanceTo calculate the orthodromic distance between Niamey, Niger and Paris, their latitudes and longitudes are converted into decimal degrees:
Niamey (Lat: 13.5167 / Long: 2.1167)
Paris (Lat: 48.8667 / Long: 2.3333)

Journal statistique africain, numéro 14, mai 201292
Abdoulaye Adam
Based on the above notation and the first equation:
φN = 13.5167 λN = 2.1167 φP = 48.8667 λN = 2.33333 Δφ = - 35.35 Δλ = - 0.2166 Cos φN = 0.9723 Cos φP = 0.6580 Cos Δλ = 0.9999 Sin φN = 0.0368 Sin φP = 0.0407
σ̂Δ = arcos{(0.2337)(0.7532) + (0.97237)(0.65780)(0.9999)} = 0.616981789
Orthodromic Distance Niamey-Paris = (0.616981789)(6372.8) = 3,931.9 km
Other orthodromic distances calculated using the above three expressions are presented in Annex 1. The same values of σ̂Δ , and thus, of distances were found with all three expressions.
An easier way to find the orthodromic distance between two cities is through Internet websites:
www.travelmath.com www.mapcrow.info www.infoplease.com www.globefeed.com www.worldatlas.com
However, because the latitude and longitude and the formulae used differ slightly from one site to another, these sites do not give exactly the same distances. For the ICP, it is important to use the same source for distances on which prices will be determined in order to control variations that are not due to price differences.
4. PROCEDURE TO DETERMINE ORThODROMIC AND CRs-BAsED AIRfARE PRICE
The price of air transportation products can be determined by ICP regional or global coordinates using orthodromic distances between points of depar-ture and destination and prices obtained from one of the main Computer Reservation System (CRS) vendors—Amadeus, Sabre and Travelport (in-cluding Galileo and Worldspan). The procedure is:
1. For each participating country, determine the geographical coordinates of the departure and destination points of the air transportation products and calculate orthodromic distances between them using one of the

The African Statistical Journal, Volume 14, May 2012 93
3. An alternative approach for determining air transportation costs in the International Comparison Program
central angle formulae. These distances can be obtained from one of websites listed above. However, it is important to use the same method to determine all the distances.
2. Obtain the cost of such journeys from one of the main CRS vendors. These prices are more comparable than those from airline companies, which differ globally and across categories like airfare, surcharges and taxes.
3. Calculate the price per kilometer (km) of each product. These prices will then be used to compute PPPs for the basic headings after converting them in local currencies if necessary.
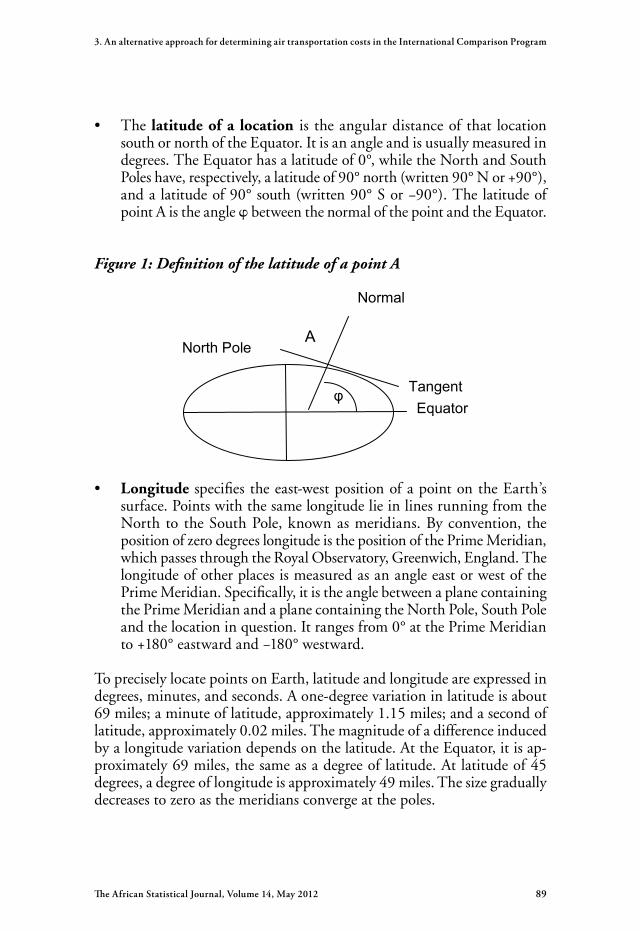
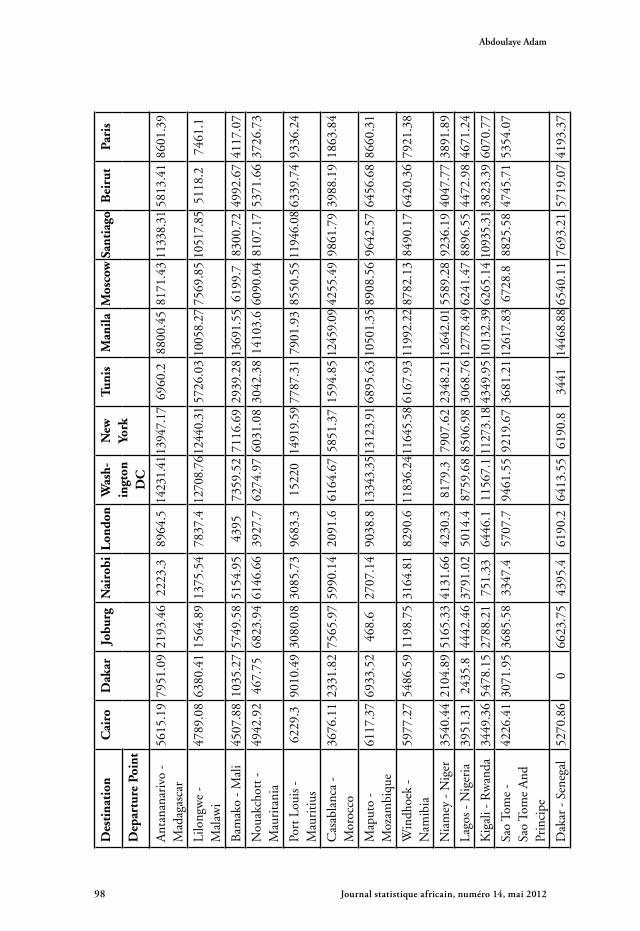
For ICP-Africa, the air transportation PPPs could be calculated based on the price per km of round-trip tickets from the capital cities of participat-ing African countries to selected destinations—London, Washington DC, New York, Johannesburg, Nairobi, Cairo and Dakar—and to cities where the implementing agencies for other ICP regions are located—Tunis (ICP-Africa), Manila (ICP-Asia), Moscow (CIS-Rosstat), Santiago, Chile (ICP-LAC), Beirut, Lebanon (ICP-Western Asia), and Paris (OECD). The final list of destinations for Africa may be decided based on the information in Amadeus, which is the most common CRS in Africa.
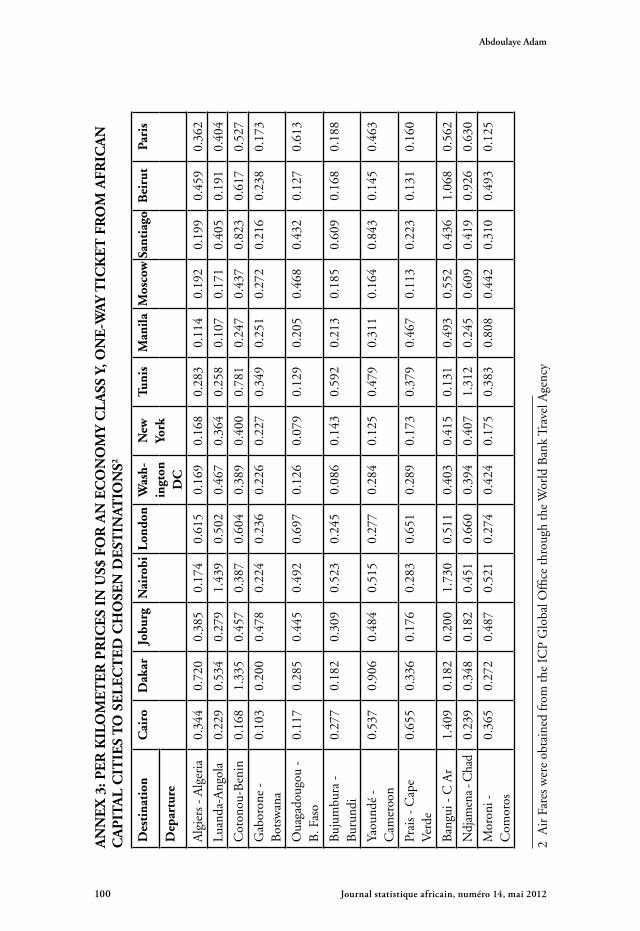
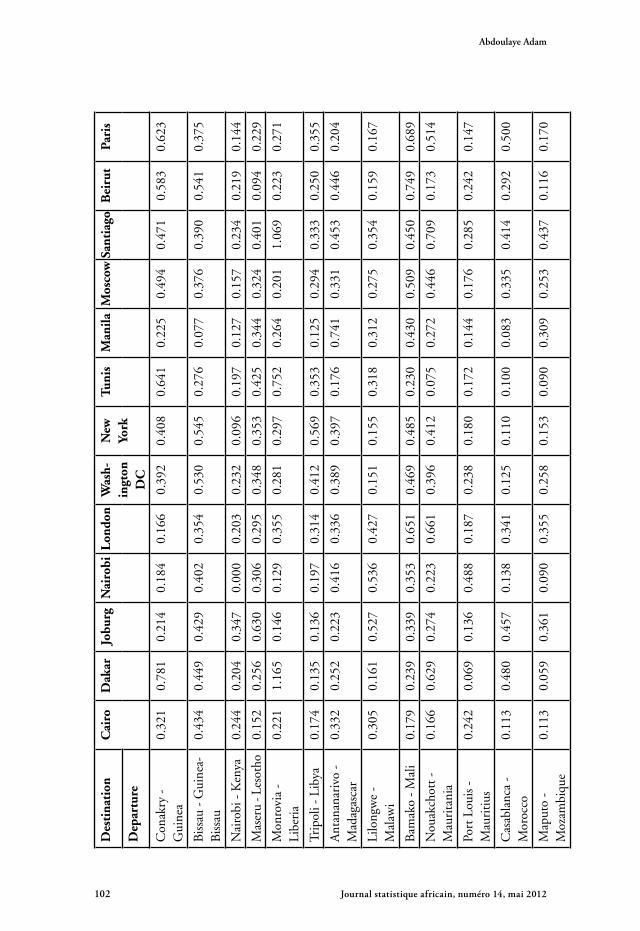
Orthodromic distances between each capital city and the above destina-tions, obtained from www.worldatlas.com, are presented in Annex 2. Prices of an Economy class Y, one-way ticket from African capital cities to those destinations were obtained by the World Bank Travel Agency (American Express) from the Amadeus database. These prices were converted into costs per km, as presented in Annex 3. The prices per km of all products will be converted into local currencies and used to compute the PPPs.
5. CONClUsION
Air transportation between any two cities is a product whose quality (aircraft type, meals and refreshments, on-board entertainment, flight schedule, etc.) depends on the services the air carrier offers. The quality of the serv-ice is reflected in the price of the ticket and is not entirely captured in the product description. Consequently, products of different qualities are being compared. In addition, the distance between the departure and destination points should be considered in the comparison. This study demonstrates that it is possible to collect airfare prices globally, or at least regionally, us-

Journal statistique africain, numéro 14, mai 201294
Abdoulaye Adam
ing one of the major CRS vendors, and to take the distance of the trip into consideration. Ideally, distance should be orthodromic, and comparisons should be based on prices per unit distance (kilometer or mile).
REfERENCE
African Development Bank (2005), Product Catalogue for ICP Price Survey in African Countries Vol 2.
Gade, K (2004), NavLab, a Generic Simulation and Post-processing Tool for Navigation- European,” Journal of Navigation 2 51-59
Longley, PA Goodchild, M.F, Maguire,D.J and Rhind,D.W (2003). Geo-graphic Information Systems and Science, John Wiley and Sons 2nd Edition
The World Bank, ICP Global Office, DECDG (2011). Product Catalogue for ICP Price Surveys Global Core List 2011
Wikipedia, the free Encyclopedia. Available at: http://en.wikipedia.org/wiki/Great-circle_distance

The African Statistical Journal, Volume 14, May 2012 95
3. An alternative approach for determining air transportation costs in the International Comparison Program
AN
NE
X 1
: DE
TE
RM
INAT
ION
Of
OR
Th
OD
RO
MIC
DIs
TA
NC
Es
UsI
Ng
CE
NT
RA
l A
Ng
lE
fO
RM
Ul
AE
Nia
mey
-Lon
don
13.5
251
.50
2.12
-0.1
22.
23-1
8.99
1.12
0.66
370.
6637
0.66
37N
iam
ey-N
ew Y
ork
13.5
240
.71
2.12
-74.
0176
.12
-13.
6038
.06
1.23
531.
2353
1.23
53N
iam
ey-P
aris
13.5
248
.87
2.12
2.33
-0.2
2-1
7.68
-0.1
10.
6170
0.61
700.
6170
Nia
mey
-W
ash
DC
13.5
238
.90
2.12
-77.
0479
.15
-12.
6939
.58
1.27
741.
2774
1.27
74T
unis
-Lon
don
34.0
051
.50
9.00
-0.1
29.
12-8
.75
4.56
0.32
640.
3264
0.32
64T
unis
-New
Yor
k34
.00
40.7
19.
00-7
4.01
83.0
1-3
.36
41.5
01.
1138
1.11
381.
1138
Tun
is-P
aris
34.0
048
.87
9.00
2.33
6.67
-7.4
33.
330.
2735
0.27
350.
2735
Tun
is-
Was
h D
C34
.00
38.9
09.
00-7
7.04
86.0
4-2
.45
43.0
21.
1640
1.16
401.
1640
Nai
robi
-Lon
don
-1.2
851
.50
36.8
2-0
.12
36.9
3-2
6.39
18.4
71.
0702
1.07
021.
0702
Nai
robi
-New
Yor
k-1
.28
40.7
136
.82
-74.
0111
0.82
-21.
0055
.41
1 .85
871.
8587
1.85
87N
airo
bi -
Par
is-1
.28
48.8
736
.82
2.33
34.4
8-2
5.08
17.2
41.
0178
1.01
781.
0178
Nai
robi
- W
ash
DC
-1.2
838
.90
36.8
2-7
7.04
113.
85-2
0.09
56.9
31.
9057
1.90
571.
9057
Jobu
rg-L
ondo
n-2
6.20
51.5
028
.08
-0.1
228
.20
-38.
8514
.10
1.42
351.
4235
1.42
35Jo
burg
-New
Yor
k-2
6.20
40.7
128
.08
-74.
0110
2.09
-33.
4651
.04
2.01
582.
0158
2.01
58Jo
burg
-Par
is-2
6.20
48.8
728
.08
2.33
25.7
5-3
7.53
12.8
81.
3704
1.37
041.
3704
Jobu
rg-W
ash
DC
-26.
2038
.90
28.0
8-7
7.04
105.
12-3
2.55
52.5
62.
0481
2.04
812.
0481
7097
.948
317
42.8
094
7417
.643
5
1305
2.04
62
1184
5.42
3864
86.3
451
1214
4.96
3490
71.8
909
1284
6.06
7887
33.1
164
6820
.195
2
4229
.502
378
72.4
912
3931
.901
6
Est
imat
ed F
lyin
g D
ista
nce
(km
)
8140
.910
020
80.1
855
Δλ
ΔØ
/2Δλ/
2D
ista
nce
Øs
Øf
λ sλ f
ΔσE1
ΔσE2
ΔσE3
Journal statistique africain, numéro 14, mai 201296
Abdoulaye Adam
AN
NE
X 2
: OR
Th
OD
RO
MIC
DIs
TA
NC
Es
BE
TW
EE
N A
fRIC
AN
CA
PIT
Al
CIT
IEs
AN
D s
El
EC
TE
D D
EsT
INAT
ION
s
Des
tina
tion
Cai
roD
akar
jobu
rgN
airo
bi l
ondo
nW
ash-
ingt
on
DC
New
yo
rkTu
nis
Man
ila M
osco
wsa
ntia
goB
eiru
tPa
ris
Dep
artu
re P
oint
Alg
iers
- A
lger
ia27
03.3
831
79.0
7376
.653
97.2
1687
.068
77.9
6547
.968
2.1
1145
6.1
3367
.110
829.
529
78.9
1335
.6
Luan
da -
Ang
ola
4643
.25
4166
.725
41.6
2725
.966
85.1
1057
7.7
1034
5.0
4575
.812
125.
373
62.6
8948
.451
31.3
6318
.1
Cot
onou
- B
enin
4026
.59
2337
.345
05.9
3896
.550
09.4
8674
.784
24.5
3091
.112
880.
262
83.6
8808
.845
47.5
4670
.2
Gab
oron
e -
Bot
swan
a60
31.5
363
17.7
309.
728
14.4
8721
.612
710.
712
504.
365
71.4
1113
8.3
8855
.191
44.0
6419
.183
44.6
Oua
gado
ugou
-
Bur
kina
Fas
o39
25.2
317
25.8
5300
.544
74.5
4338
.579
25.9
7666
.025
93.0
1305
0.4
5864
.888
52.5
4427
.040
19.3
Buj
umbu
ra -
B
urun
di36
74.9
354
83.0
2561
.385
8.0
6624
.611
646.
011
358.
645
13.3
1026
1.4
6493
.810
747.
440
54.7
6248
.0
Yaou
ndé
- C
amer
oon
3651
.26
3394
.836
82.9
2847
.254
47.4
9675
.594
11.9
3342
.212
015.
662
41.9
9453
.541
65.7
5080
.2
Prai
s - C
ape
Ver
de58
61.5
666
6.7
7132
.468
46.8
4619
.258
80.0
5678
.839
50.4
1501
7.1
6912
.872
27.4
6291
.444
68.0
Ban
gui -
Cen
tral
A
fric
an R
epub
lic31
84.2
140
88.6
3489
.121
03.9
5508
.610
222.
099
39.5
3358
.111
232.
959
24.1
1016
8.0
3673
.551
31.2
Ndj
amen
a - C
had
2607
.63
4173
.344
53.5
2805
.445
49.4
9369
.390
73.7
2401
.511
355.
951
70.4
1032
9.1
3128
.041
73.3
Mor
oni -
C
omor
os47
36.6
772
34.8
2309
.013
19.7
8061
.613
399.
613
103.
660
58.8
9006
.273
57.8
1147
6.7
4961
.376
97.7
Kin
shas
a -
Con
-go
, Dem
. Rep
.41
44.4
4118
.127
98.3
2413
.362
90.0
1048
5.7
1023
4.2
4158
.711
804.
268
74.6
9380
.246
31.5
5918
.2
Bra
zzav
ille
-Con
go41
45.2
241
16.2
627
99.3
2415
.36
6289
.510
484
1023
2.57
4158
.45
1180
6.21
6875
.193
78.3
946
32.4
259
17.8
3

The African Statistical Journal, Volume 14, May 2012 97
3. An alternative approach for determining air transportation costs in the International Comparison Program
Des
tina
tion
Cai
roD
akar
jobu
rgN
airo
bi l
ondo
nW
ash-
ingt
on
DC
New
yo
rkTu
nis
Man
ila M
osco
wsa
ntia
goB
eiru
tPa
ris
Dep
artu
re P
oint
Abi
djan
-
Cot
e D
’ivoi
re46
24.8
117
68.1
4881
.92
4585
.38
5127
.881
79.2
679
50.5
534
16.2
813
590.
7966
83.5
581
65.3
151
39.0
148
19.7
9
Djib
outi
-
Djib
outi
2444
.95
6557
.12
4426
.57
1506
.66
5923
1175
8.67
1142
442
09.2
8416
.86
4916
.54
1287
4.6
2568
.02
5590
.64
Cai
ro -
Egy
pt0
5270
.86
6236
.25
3497
.24
3487
.494
09.6
490
68.6
720
81.5
192
08.3
828
25.7
212
776.
3652
2.72
3167
.98
Mal
abo
- E
quat
o-ri
al G
uine
a38
22.2
131
16.8
838
33.5
531
47.6
354
02.1
9436
.03
9179
.14
3336
.77
1230
7.36
6338
.06
9200
.86
4341
.750
41.5
6
Asm
ara
- E
ritr
ea18
43.4
760
40.6
947
08.5
1794
.18
5302
.411
120.
9810
786.
435
73.1
487
74.1
4449
.23
1270
7.94
2031
.23
4965
.04
Add
is A
baba
-E
thio
pia
2461
.82
6123
.04
4060
.111
32.3
258
6411
566.
2811
238.
8740
11.7
8934
.84
5115
.94
1234
8.05
2689
.49
5514
.34
Libr
evill
e - G
abon
4055
.84
3333
.98
3511
.89
3044
.557
42.6
9700
.06
9450
.93
3669
.44
1232
5.26
6629
.94
9078
.27
4570
.553
81.2
4
Ban
jul -
Gam
bia
5252
.25
138
6488
.56
6088
.99
4478
.865
45.4
463
24.5
234
58.1
414
458.
0565
88.7
957
07.9
157
07.9
142
67.8
1
Acc
ra -
Gha
na43
11.6
821
27.2
345
99.0
741
64.9
451
1585
13.3
882
73.6
632
72.9
413
190.
7365
02.6
685
07.9
948
31.0
347
87.5
3
Con
akry
-
Gui
nea
5210
.36
683.
8159
55.6
957
02.3
148
32.7
7067
.15
6853
.34
3577
.16
1439
5.8
6800
.55
7611
.34
5692
.04
4590
.55
Bis
sau
- G
uine
a-B
issa
u52
71.0
338
3.08
6260
.66
5945
.05
4665
.367
64.7
6549
3544
.07
1447
7.74
6719
.78
7602
.157
39.1
4441
.62
Nai
robi
- K
enya
3497
.24
6190
.21
2934
.25
067
49.9
1214
5.82
1183
8.75
4739
.91
9403
.56
6227
.35
1155
8.34
3783
.17
6383
.72
Mas
eru
- Le
soth
o65
72.6
567
83.6
133
8.19
3267
.192
99.1
1313
412
946.
2771
48.9
411
088.
4693
90.4
989
75.2
6945
.64
8922
.12
Mon
rovi
a -
Libe
ria
5139
.78
1141
.35
5496
.42
5342
.72
5100
.675
23.3
373
1236
65.2
714
247.
4169
31.7
776
40.7
256
38.6
148
33.9
7
Trip
oli -
Lib
ya17
33.7
736
88.4
6639
.07
4432
.55
2377
.579
07.8
375
76.1
735
9.88
1079
3.55
3193
.84
1136
3.53
2091
.11
1999
.73
Journal statistique africain, numéro 14, mai 201298
Abdoulaye Adam
The African Statistical Journal, Volume 14, May 2012 99
3. An alternative approach for determining air transportation costs in the International Comparison Program
Des
tina
tion
Cai
roD
akar
jobu
rgN
airo
bi l
ondo
nW
ash-
ingt
on
DC
New
yo
rkTu
nis
Man
ila M
osco
wsa
ntia
goB
eiru
tPa
ris
Dep
artu
re P
oint
Ant
anan
ariv
o -
Mad
agas
car
5615
.19
7951
.09
2193
.46
2223
.389
64.5
1423
1.41
1394
7.17
6960
.288
00.4
581
71.4
311
338.
3158
13.4
186
01.3
9
Lilo
ngw
e -
Mal
awi
4789
.08
6380
.41
1564
.89
1375
.54
7837
.412
708.
7612
440.
3157
26.0
310
058.
2775
69.8
510
517.
8551
18.2
7461
.1
Bam
ako
- M
ali
4507
.88
1035
.27
5749
.58
5154
.95
4395
7359
.52
7116
.69
2939
.28
1369
1.55
6199
.783
00.7
249
92.6
741
17.0
7
Nou
akch
ott -
M
auri
tani
a49
42.9
246
7.75
6823
.94
6146
.66
3927
.762
74.9
760
31.0
830
42.3
814
103.
660
90.0
481
07.1
753
71.6
637
26.7
3
Port
Lou
is -
M
auri
tius
6229
.390
10.4
930
80.0
830
85.7
396
83.3
1522
014
919.
5977
87.3
179
01.9
385
50.5
511
946.
0863
39.7
493
36.2
4
Cas
abla
nca
- M
oroc
co36
76.1
123
31.8
275
65.9
759
90.1
420
91.6
6164
.67
5851
.37
1594
.85
1245
9.09
4255
.49
9861
.79
3988
.19
1863
.84
Map
uto
- M
ozam
biqu
e61
17.3
769
33.5
246
8.6
2707
.14
9038
.813
343.
3513
123.
9168
95.6
310
501.
3589
08.5
696
42.5
764
56.6
886
60.3
1
Win
dhoe
k -
Nam
ibia
5977
.27
5486
.59
1198
.75
3164
.81
8290
.611
836.
2411
645.
5861
67.9
311
992.
2287
82.1
384
90.1
764
20.3
679
21.3
8
Nia
mey
- N
iger
3540
.44
2104
.89
5165
.33
4131
.66
4230
.381
79.3
7907
.62
2348
.21
1264
2.01
5589
.28
9236
.19
4047
.77
3891
.89
Lago
s -
Nig
eria
3951
.31
2435
.844
42.4
637
91.0
250
14.4
8759
.68
8506
.98
3068
.76
1277
8.49
6241
.47
8896
.55
4472
.98
4671
.24
Kig
ali -
Rw
anda
3449
.36
5478
.15
2788
.21
751.
3364
46.1
1156
7.1
1127
3.18
4349
.95
1013
2.39
6265
.14
1093
5.31
3823
.39
6070
.77
Sao
Tom
e -
Sa
o To
me
And
Pr
inci
pe
4226
.41
3071
.95
3685
.58
3347
.457
07.7
9461
.55
9219
.67
3681
.21
1261
7.83
6728
.888
25.5
847
45.7
153
54.0
7
Dak
ar -
Sen
egal
5270
.86
066
23.7
543
95.4
6190
.264
13.5
561
90.8
3441
1446
8.88
6540
.11
7693
.21
5719
.07
4193
.37

Journal statistique africain, numéro 14, mai 201298
Abdoulaye Adam
The African Statistical Journal, Volume 14, May 2012 99
3. An alternative approach for determining air transportation costs in the International Comparison Program
Des
tina
tion
Cai
roD
akar
jobu
rgN
airo
bi l
ondo
nW
ash-
ingt
on
DC
New
yo
rkTu
nis
Man
ila M
osco
wsa
ntia
goB
eiru
tPa
ris
Dep
artu
re P
oint
Vic
tori
a -
Seyc
helle
s45
74.4
782
68.2
838
08.5
520
96.4
180
61.8
1390
1.76
1356
9.86
6342
.23
7494
.76
6762
.92
1300
9.59
4619
.86
7736
.59
Free
tow
n -
Sier
ra
Leon
e52
30.5
380
3.52
5844
.67
5637
.38
4931
.171
74.8
769
63.6
336
34.9
714
400.
3268
71.2
275
76.3
157
17.1
4683
.94
Joha
nnes
burg
So
uth
Afr
ica
6236
.25
5844
.67
5844
.67
5844
.67
4931
.171
74.8
769
63.6
336
34.9
714
400.
3268
71.2
275
76.3
157
17.1
4683
.94
Kha
rtou
m
- Sud
an16
73.0
853
57.8
345
84.7
518
40.4
749
51.2
1061
7.51
1028
9.63
3062
.32
9444
.76
4469
.37
1211
3.41
2023
.72
4594
.38
Mba
bane
-
Swaz
iland
6226
.93
6874
.41
308.
4128
45.7
490
94.4
1327
5.52
1306
4.32
6946
.98
1066
8.22
9028
.06
9459
.62
6576
.72
8716
Dar
Es
Sala
am
-Tan
zani
a40
93.4
566
28.4
2523
.08
619.
0273
68.9
1271
0.6
1241
0.13
5352
.67
9279
.26
6784
.62
1146
0.58
4354
.88
7002
.69
Lom
é - T
ogo
4122
.23
2215
.25
4587
.28
4028
.53
5005
.385
68.4
783
21.5
131
23.3
513
007.
163
37.3
986
99.5
146
41.9
946
71.4
4
Tuni
s - T
unis
ia20
71.2
3671
.571
44.9
749
53.2
118
58.9
7434
.39
7099
.59
338.
5210
880.
3329
70.3
611
361.
123
38.3
1480
.53
Kam
pala
-
Uga
nda
3338
.83
5707
.89
2931
.68
483.
964
52.2
1171
3.4
1141
2.13
4390
.94
9833
.36
6132
.93
1123
0.4
3682
.160
80.1
9
Lusa
ka-
Zam
bia
5013
.84
5964
.212
23.4
1816
.82
7841
.312
357.
1712
109.
0756
96.9
710
686.
8978
33.2
799
03.8
153
92.0
474
62.7
8
Har
are
- Z
imba
bwe
5226
.263
31.7
310
47.8
418
87.5
981
48.5
1272
6.97
1247
9.07
6011
.52
1044
9.52
8030
.110
022.
2855
79.7
577
70.2
9
* D
ista
nce
betw
een
citi
es in
kilo
met
ers.
Journal statistique africain, numéro 14, mai 2012100
Abdoulaye Adam
The African Statistical Journal, Volume 14, May 2012 101
3. An alternative approach for determining air transportation costs in the International Comparison Program
AN
NE
X 3
: PE
R K
IlO
ME
TE
R P
RIC
Es
IN U
s$ f
OR
AN
EC
ON
OM
y C
lA
ss y
, ON
E-W
Ay T
ICK
ET
fR
OM
AfR
ICA
N
CA
PIT
Al
CIT
IEs
TO
sE
lE
CT
ED
Ch
OsE
N D
EsT
INAT
ION
s2
Des
tina
tion
Cai
roD
akar
jobu
rgN
airo
bi l
ondo
nW
ash-
ingt
on
DC
New
yo
rkTu
nis
Man
ila M
osco
wsa
ntia
goB
eiru
tPa
ris
Dep
artu
re
Alg
iers
- A
lger
ia0.
344
0.72
00.
385
0.17
40.
615
0.16
90.
168
0.28
30.
114
0.19
20.
199
0.45
90.
362
Luan
da-A
ngol
a0.
229
0.53
40.
279
1.43
90.
502
0.46
70.
364
0.25
80.
107
0.17
10.
405
0.19
10.
404
Cot
onou
-Ben
in0.
168
1.33
50.
457
0.38
70.
604
0.38
90.
400
0.78
10.
247
0.43
70.
823
0.61
70.
527
Gab
oron
e -
Bot
swan
a0.
103
0.20
00.
478
0.22
40.
236
0.22
60.
227
0.34
90.
251
0.27
20.
216
0.23
80.
173
Oua
gado
ugou
-
B. F
aso
0.11
70.
285
0.44
50.
492
0.69
70.
126
0.07
90.
129
0.20
50.
468
0.43
20.
127
0.61
3
Buj
umbu
ra -
B
urun
di0.
277
0.18
20.
309
0.52
30.
245
0.08
60.
143
0.59
20.
213
0.18
50.
609
0.16
80.
188
Yaou
ndé
- C
amer
oon
0.53
70.
906
0.48
40.
515
0.27
70.
284
0.12
50.
479
0.31
10.
164
0.84
30.
145
0.46
3
Prai
s -
Cap
e V
erde
0.65
50.
336
0.17
60.
283
0.65
10.
289
0.17
30.
379
0.46
70.
113
0.22
30.
131
0.16
0
Ban
gui -
C A
r1.
409
0.18
20.
200
1.73
00.
511
0.40
30.
415
0.13
10.
493
0.55
20.
436
1.06
80.
562
Ndj
amen
a - C
had
0.23
90.
348
0.18
20.
451
0.66
00.
394
0.40
71.
312
0.24
50.
609
0.41
90.
926
0.63
0
Mor
oni -
C
omor
os0.
365
0.27
20.
487
0.52
10.
274
0.42
40.
175
0.38
30.
808
0.44
20.
310
0.49
30.
125
2 A
ir F
ares
wer
e ob
tain
ed fr
om th
e IC
P G
loba
l Offi
ce th
roug
h th
e W
orld
Ban
k Tr
avel
Age
ncy

Journal statistique africain, numéro 14, mai 2012100
Abdoulaye Adam
The African Statistical Journal, Volume 14, May 2012 101
3. An alternative approach for determining air transportation costs in the International Comparison Program
Des
tina
tion
Cai
roD
akar
jobu
rgN
airo
bi l
ondo
nW
ash-
ingt
on
DC
New
yo
rkTu
nis
Man
ila M
osco
wsa
ntia
goB
eiru
tPa
ris
Dep
artu
re
Kin
shas
a -
Con
go, D
em.
Rep
.
0.18
10.
349
0.86
90.
646
0.56
70.
114
0.32
60.
399
0.13
00.
383
0.43
10.
961
0.42
9
Bra
zzav
ille
- C
ongo
0.18
10.
345
0.76
60.
523
0.19
10.
095
0.35
30.
387
0.48
60.
529
0.45
70.
641
0.51
1
Abi
djan
- C
ote
D’iv
oire
0.32
90.
492
0.46
10.
389
0.21
50.
413
0.42
40.
706
0.13
00.
172
0.63
10.
217
0.65
3
Djib
outi
-
Djib
outi
0.16
30.
198
0.12
50.
200
0.11
20.
085
0.12
40.
352
0.28
40.
389
0.29
20.
144
0.12
3
Cai
ro -
Egy
pt0.
000
0.44
30.
109
0.12
00.
137
0.07
40.
053
0.09
20.
153
0.82
80.
382
0.41
70.
306
Mal
abo
-
E. G
uine
a0.
221
0.46
10.
384
0.46
70.
689
0.10
60.
237
0.88
40.
352
0.62
00.
535
1.02
30.
797
Asm
ara
- E
ritr
ea1.
323
0.15
60.
266
2.69
10.
330
0.20
10.
207
0.58
70.
203
0.51
60.
435
0.35
90.
219
Add
is A
baba
-
Eth
iopi
a0.
195
0.23
20.
151
0.40
60.
102
0.07
80.
101
0.17
40.
140
0.29
00.
350
0.23
40.
109
Libr
evill
e -
Gab
on0.
315
0.27
00.
615
0.42
00.
623
0.33
10.
340
0.42
40.
363
0.56
10.
864
0.91
80.
633
Ban
jul -
Gam
bia
0.17
81.
014
0.16
40.
305
0.17
20.
356
0.29
80.
287
0.24
70.
361
0.65
00.
166
0.42
0
Acc
ra -
Gha
na0.
181
0.40
00.
306
0.30
00.
205
0.27
30.
285
0.21
10.
121
0.34
40.
502
0.10
50.
380
Journal statistique africain, numéro 14, mai 2012102
Abdoulaye Adam
The African Statistical Journal, Volume 14, May 2012 103
3. An alternative approach for determining air transportation costs in the International Comparison Program
Des
tina
tion
Cai
roD
akar
jobu
rgN
airo
bi l
ondo
nW
ash-
ingt
on
DC
New
yo
rkTu
nis
Man
ila M
osco
wsa
ntia
goB
eiru
tPa
ris
Dep
artu
re
Con
akry
-
Gui
nea
0.32
10.
781
0.21
40.
184
0.16
60.
392
0.40
80.
641
0.22
50.
494
0.47
10.
583
0.62
3
Bis
sau
- G
uine
a-B
issa
u0.
434
0.44
90.
429
0.40
20.
354
0.53
00.
545
0.27
60.
077
0.37
60.
390
0.54
10.
375
Nai
robi
- K
enya
0.24
40.
204
0.34
70.
000
0.20
30.
232
0.09
60.
197
0.12
70.
157
0.23
40.
219
0.14
4
Mas
eru
- Les
otho
0.15
20.
256
0.63
00.
306
0.29
50.
348
0.35
30.
425
0.34
40.
324
0.40
10.
094
0.22
9
Mon
rovi
a -
Libe
ria
0.22
11.
165
0.14
60.
129
0.35
50.
281
0.29
70.
752
0.26
40.
201
1.06
90.
223
0.27
1
Trip
oli -
Lib
ya0.
174
0.13
50.
136
0.19
70.
314
0.41
20.
569
0.35
30.
125
0.29
40.
333
0.25
00.
355
Ant
anan
ariv
o -
Mad
agas
car
0.33
20.
252
0.22
30.
416
0.33
60.
389
0.39
70.
176
0.74
10.
331
0.45
30.
446
0.20
4
Lilo
ngw
e -
Mal
awi
0.30
50.
161
0.52
70.
536
0.42
70.
151
0.15
50.
318
0.31
20.
275
0.35
40.
159
0.16
7
Bam
ako
- M
ali
0.17
90.
239
0.33
90.
353
0.65
10.
469
0.48
50.
230
0.43
00.
509
0.45
00.
749
0.68
9
Nou
akch
ott -
M
auri
tani
a0.
166
0.62
90.
274
0.22
30.
661
0.39
60.
412
0.07
50.
272
0.44
60.
709
0.17
30.
514
Port
Lou
is -
M
auri
tius
0.24
20.
069
0.13
60.
488
0.18
70.
238
0.18
00.
172
0.14
40.
176
0.28
50.
242
0.14
7
Cas
abla
nca
- M
oroc
co0.
113
0.48
00.
457
0.13
80.
341
0.12
50.
110
0.10
00.
083
0.33
50.
414
0.29
20.
500
Map
uto
- M
ozam
biqu
e0.
113
0.05
90.
361
0.09
00.
355
0.25
80.
153
0.09
00.
309
0.25
30.
437
0.11
60.
170

Journal statistique africain, numéro 14, mai 2012102
Abdoulaye Adam
The African Statistical Journal, Volume 14, May 2012 103
3. An alternative approach for determining air transportation costs in the International Comparison Program
Des
tina
tion
Cai
roD
akar
jobu
rgN
airo
bi l
ondo
nW
ash-
ingt
on
DC
New
yo
rkTu
nis
Man
ila M
osco
wsa
ntia
goB
eiru
tPa
ris
Dep
artu
re
Win
dhoe
k -
Nam
ibia
0.17
40.
096
0.21
30.
306
0.21
00.
330
0.31
90.
636
0.29
50.
521
0.33
90.
717
0.18
7
Nia
mey
- N
iger
0.32
80.
301
0.34
30.
559
0.75
30.
436
0.43
80.
131
0.24
90.
527
0.40
40.
319
0.59
9
Lago
s -
Nig
eria
0.20
20.
263
0.19
60.
360
0.31
00.
181
0.18
60.
269
0.08
60.
148
0.19
50.
112
0.25
3
Kig
ali -
Rw
anda
0.16
80.
305
0.34
80.
261
0.18
60.
086
0.14
40.
485
0.75
70.
180
0.06
40.
177
0.35
4
Sao
Tom
e -
Stp
0.51
80.
952
0.38
20.
488
0.41
30.
593
0.43
01.
212
0.32
00.
145
0.51
30.
320
0.75
8
Dak
ar -
Sen
egal
0.21
20.
000
0.25
70.
480
0.41
90.
155
0.16
00.
103
0.07
00.
312
0.83
30.
432
0.46
5
Vic
tori
a -
Seyc
helle
s0.
247
0.15
70.
205
0.25
20.
161
0.11
00.
113
0.28
40.
096
0.08
50.
161
0.11
30.
190
Free
tow
n -
Sier
ra L
eone
0.32
00.
266
0.18
60.
396
0.23
70.
583
0.58
50.
172
0.21
90.
298
0.96
40.
159
0.36
7
Joha
nnes
burg
So
uth
Afr
ica
0.12
60.
260
0.00
00.
100
0.26
70.
605
0.62
30.
274
0.24
90.
152
0.29
60.
316
0.34
3
Kha
rtou
m
-Sud
an0.
130
0.27
50.
089
0.32
60.
147
0.07
30.
076
0.20
30.
926
0.17
10.
260
0.24
60.
242
Mba
bane
-
Swaz
iland
0.15
70.
249
0.61
90.
332
0.28
30.
279
0.26
90.
077
0.34
90.
302
0.25
80.
292
0.21
0
Dar
Es
Sala
am
-Tan
zani
a0.
161
0.16
50.
331
0.52
30.
183
0.07
10.
067
0.09
10.
141
0.21
50.
262
0.08
20.
070
Lom
é - T
ogo
0.28
20.
349
0.26
40.
486
0.18
20.
117
0.40
50.
774
0.25
30.
434
0.60
40.
170
0.52
8
Tuni
s Tun
isia
0.09
50.
162
0.30
80.
181
0.19
80.
302
0.27
40.
000
0.06
40.
233
0.25
40.
071
0.06
7

Journal statistique africain, numéro 14, mai 2012104
Abdoulaye Adam
The African Statistical Journal, Volume 14, May 2012 105
Des
tina
tion
Cai
roD
akar
jobu
rgN
airo
bi l
ondo
nW
ash-
ingt
on
DC
New
yo
rkTu
nis
Man
ila M
osco
wsa
ntia
goB
eiru
tPa
ris
Dep
artu
re
Kam
pala
-
Uga
nda
0.16
10.
169
0.29
60.
558
0.11
20.
071
0.07
30.
213
0.13
40.
233
0.59
10.
177
0.06
8
Lusa
ka-
Zam
bia
0.35
20.
103
0.31
50.
455
0.14
50.
119
0.11
40.
471
0.36
30.
133
0.26
00.
136
0.11
1
Har
are
- Z
imba
bwe
0.08
60.
082
0.30
30.
352
0.15
10.
278
0.28
30.
422
0.27
30.
340
0.24
30.
116
0.09
6