Embed Size (px)
Citation preview

OCTOBER 2010
3-4-50: Chronic Disease in San Diego County

3-4-50: Chronic Disease in San Diego County
3-4-50: Chronic Disease In San Diego County
County of San Diego Health and Human Services Agency
Public Health Services
October 2010
For additional information, contact:
Community Health Statistics Unit 6255 Mission Gorge Road
San Diego, CA 92120 (619) 285-6429
www.sdhealthstatistics.com

3-4-50: Chronic Disease in San Diego County
3-4-50: Chronic Disease in San Diego County
Suggested Citation: County of San Diego, Health and Human Services Agency, Public Health Services, Community Health Statistics Unit. (October, 2010). 3-4-50: Chronic Disease in San Diego County. Retrieved <date> from www.SDHealthStatistics.com.
QR CODES: QR codes are similar to barcodes. Use your smart
phone to scan the QR Code and navigate directly to the report online for download. Download a free
QR code reader from your app provider.
3-4-50: Chronic Disease in San Diego County
Acknowledgements This report represents a collaborative effort between many dedicated individuals within the Health and Human Services Agency. We gratefully acknowledge the contributions of the following people: Holly Shipp, MPH, Emergency Medical Services Julie Cooke, MPH, Community Health Statistics Lacey Hicks, MPH, Epidemiology and Immunization Services Leslie Ray, MPH, MPPA, MA, Community Health Statistics and Emergency Medical Services We are particularly grateful for the guidance and support of: Wilma Wooten, MD, MPH, Public Health Officer Dean Sidelinger, MD, MSEd, Deputy Public Health Officer Marcy Metz, RN, CEN, Chief of Emergency Medical Services An effort of this magnitude requires visionary leadership. We are fortunate to have Nick Macchione as the Director of the Health and Human Services Agency, and Wilma J. Wooten as the Public Health Officer.
3-4-50: Chronic Disease in San Diego County
Table of Contents Health Strategy Agenda…………………………………………………...…………...….…..1 Building Better Health Key Themes Putting Themes In To Action What is 3-4-50 …………………………………………………………………………….…...2 3 Behaviors Poor Diet Physical Inactivity Tobacco, Alcohol and Drug Use 4 Diseases Cancer Coronary Heart Disease and Stroke Diabetes Pulmonary Disease Over 50% of Deaths Prevention Opportunities What are the Modifiable Risk Factors of Cancer? What are the Modifiable Risk Factors of Coronary Heart Disease and Stroke? What are the Modifiable Risk Factors of Diabetes? What are the Modifiable Risk Factors of Pulmonary Disease? San Diego County………………………………………………………………...…...……….6 3-4-50 Risk Factors 3-4-50 Diseases Cancer Coronary Heart Disease and Stroke Diabetes Pulmonary Disease Medical Encounters for 3-4-50 Diseases Among San Diegans 3-4-50 Disease Projections Population Growth Deaths Among San Diegans Hospitalizations Among San Diegans Emergency Department Visits Among San Diegans Investing in the Future Regional Impacts North Central Region…...…………………………….………………………..…………….14 3-4-50 Risk Factors 3-4-50 Diseases Cancer Coronary Heart Disease and Stroke Diabetes Pulmonary Disease

3-4-50: Chronic Disease in San Diego County
North Coastal Region………………………………….……………………………..……….17 3-4-50 Risk Factors 3-4-50 Diseases Cancer Coronary Heart Disease and Stroke Diabetes Pulmonary Disease Central Region …………………………………………..………………………….………...20 3-4-50 Risk Factors 3-4-50 Diseases Cancer Coronary Heart Disease and Stroke Diabetes Pulmonary Disease South Region ………………………………………………………...………………………...23 3-4-50 Risk Factors 3-4-50 Diseases Cancer Coronary Heart Disease and Stroke Diabetes Pulmonary Disease East Region ………………………………………………………..………………………….26 3-4-50 Risk Factors 3-4-50 Diseases Cancer Coronary Heart Disease and Stroke Diabetes Pulmonary Disease North Inland Region ………………………………………………...………………………..29 3-4-50 Risk Factors 3-4-50 Diseases Cancer Coronary Heart Disease and Stroke Diabetes Pulmonary Disease Conclusions ……………………………………..…………………………………………….32 References………………...………………..……………………………………………….…33
3-4-50: Chronic Disease in San Diego County
1
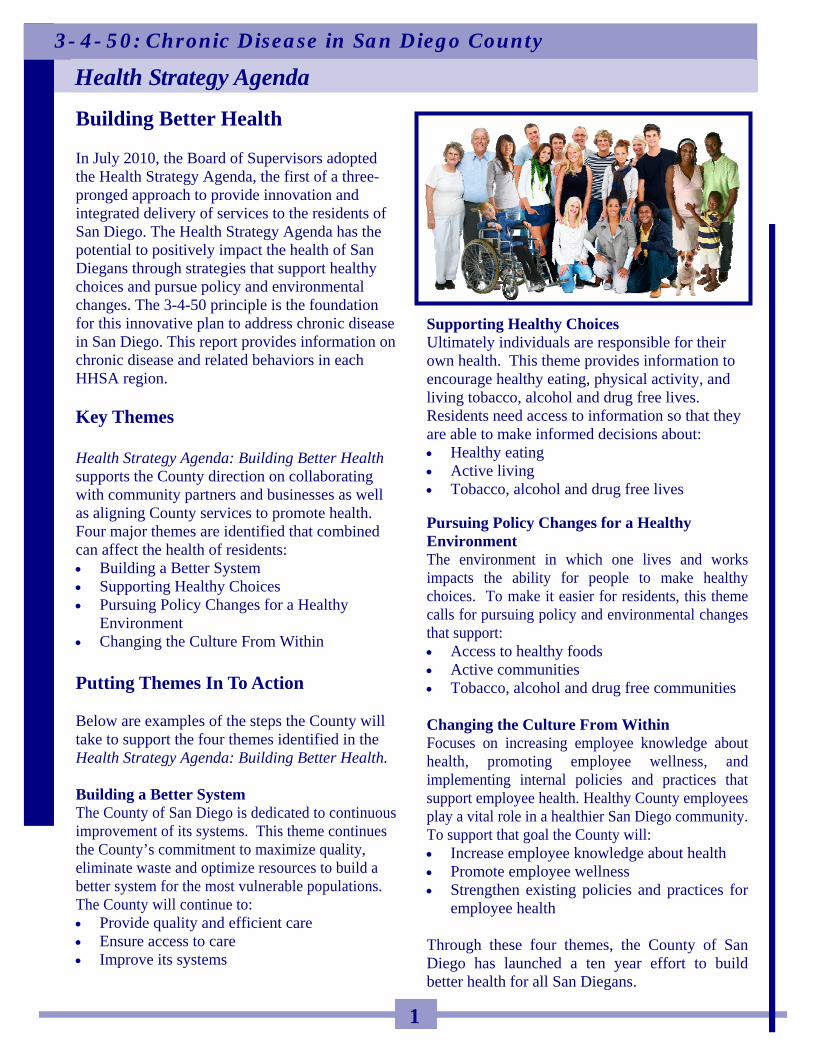
Building Better Health In July 2010, the Board of Supervisors adopted the Health Strategy Agenda, the first of a three-pronged approach to provide innovation and integrated delivery of services to the residents of San Diego. The Health Strategy Agenda has the potential to positively impact the health of San Diegans through strategies that support healthy choices and pursue policy and environmental changes. The 3-4-50 principle is the foundation for this innovative plan to address chronic disease in San Diego. This report provides information on chronic disease and related behaviors in each HHSA region. Key Themes Health Strategy Agenda: Building Better Health supports the County direction on collaborating with community partners and businesses as well as aligning County services to promote health. Four major themes are identified that combined can affect the health of residents: Building a Better System Supporting Healthy Choices Pursuing Policy Changes for a Healthy
Environment Changing the Culture From Within Putting Themes In To Action Below are examples of the steps the County will take to support the four themes identified in the Health Strategy Agenda: Building Better Health.
Building a Better System The County of San Diego is dedicated to continuous improvement of its systems. This theme continues the County’s commitment to maximize quality, eliminate waste and optimize resources to build a better system for the most vulnerable populations. The County will continue to: Provide quality and efficient care Ensure access to care Improve its systems
Supporting Healthy Choices Ultimately individuals are responsible for their own health. This theme provides information to encourage healthy eating, physical activity, and living tobacco, alcohol and drug free lives. Residents need access to information so that they are able to make informed decisions about: Healthy eating Active living Tobacco, alcohol and drug free lives Pursuing Policy Changes for a Healthy Environment The environment in which one lives and works impacts the ability for people to make healthy choices. To make it easier for residents, this theme calls for pursuing policy and environmental changes that support: Access to healthy foods Active communities Tobacco, alcohol and drug free communities Changing the Culture From Within Focuses on increasing employee knowledge about health, promoting employee wellness, and implementing internal policies and practices that support employee health. Healthy County employees play a vital role in a healthier San Diego community. To support that goal the County will: Increase employee knowledge about health Promote employee wellness Strengthen existing policies and practices for
employee health Through these four themes, the County of San Diego has launched a ten year effort to build better health for all San Diegans.
Health Strategy Agenda

3-4-50: Chronic Disease in San Diego County
2
Chronic diseases are now the major cause of death and disability worldwide, having surpassed infectious diseases and injuries. This reflects a significant change in diet habits, physical activity levels, and tobacco use.1
The 3-4-50 concept2 is defined as three behaviors (poor diet, physical inactivity, and tobacco use) which contribute to four chronic diseases (cancer, heart disease and stroke, type 2 diabetes, and pulmonary diseases such as asthma) that cause over 50 percent of all deaths worldwide. These chronic diseases are important to consider together because they are common causes of disability and death in San Diego County. They are also highly influenced by three unhealthy behaviors; behaviors that cause many cases of the specified chronic conditions that are preventable.
In San Diego County in 2007, the 3-4-50 diseases, considered together, cost $4 billion in direct treatment expenditures.3
3 Behaviors
Poor Diet
Diet, which is ultimately a personal choice, is one of the factors that can contribute to obesity. Obesity is the result of too many calories consumed and not enough calories expended. Understanding caloric requirements is key to maintaining a normal weight.
The environment plays an important role in diet. Easy access to fresh food at reasonable cost allows individuals the opportunity to make healthier choices. However they must also know how to prepare and cook fresh foods meaning the healthy choice is often less convenient.
Foods high in fats, sugar, and salt are inexpensive and easily available through fast food restaurants, convenience markets, and vending machines. Over a generation, our tastes have changed. These foods have become habit rather than occasional treats and portion size has grown exponentially. The recommended adult serving of meat, chicken, or fish is 3 ounces. Restaurant portions are typically 6 to 12 ounces, making it possible to consume an entire day’s requirement for protein and calories in one meal.
Physical Inactivity
As society evolved into the information or digital age, work has changed from primarily physical labor to primarily mental labor. Labor saving machines contributed to an increasingly sedentary lifestyle. The automobile became the main form of transportation for the majority of the population. The physical environment, including lack of sidewalks and adequate lighting, posed challenges to walking.
The single biggest challenge to becoming physically fit is making the time to exercise or play. The recommended level of physical activity for adults is a total of 150 minutes of moderate activity every week.
Tobacco, Alcohol and Drug Use
Smoking is the leading factor contributing to lung cancer and chronic obstructive pulmonary disease (COPD) deaths in the United States. Exposure to second hand smoke increases risk of heart disease and lung cancer in adults, and asthma attacks and respiratory infections in children.
In San Diego County, the Health and Human Services Agency also cautions against alcohol abuse and drug use/abuse because of the impact of these behaviors on several chronic diseases.
What is 3-4-50?
In the 19th Century, the challenge for Public Health was environmental, resulting in fresh
water and sanitation for the population.
In the 20th Century, the challenge was infec-tious disease, resulting in vaccinations to pre-
vent and antibiotics to treat deadly diseases.
In the 21st Century, we are faced with the chal-lenge of chronic disease. In order to meet this challenge Public Health must create an envi-
ronment that promotes physical activity, acces-sible nutritious food choices and is smoke-free.
Wilma J. Wooten, MD, MPH
Public Health Officer County of San Diego

3-4-50: Chronic Disease in San Diego County
3
4 Diseases
Cancer
Cancer is the second leading cause of death in the United States, second only to heart disease. Nationally, more than one million people are diagnosed with new cases of cancer every year,4 and more than half a million die from the disease.5 What is Cancer?
Cancer is a term used to describe a group of diseases in which abnormal cells divide without control and invade other tissues. Cancer cells can then spread to other parts of the body through the blood and lymph systems.6 There are more than 100 different types of cancer, which are named for the organ or type of cell in which they start. How Serious is Cancer?
Survival rates vary by type of cancer, but for all cancers combined, there is a relative 5‐year survival rate of 65 percent. This means that 65 out of 100 people who were diagnosed with cancer will be alive after 5 years. Unfortunately, one out of every five cancer patients will die from the illness.7 Based on rates from 2003‐2005, the lifetime risk of being diagnosed with any type of cancer is 40 percent.8 In other words, two out of every five people will be diagnosed with cancer in their lifetime. Heart Disease
In the United States, heart disease is the leading cause of death;9 it is also a major cause of illness, disability, and increases in health care costs. In 2006, more than 630,000 people died of heart disease.10 Coronary heart disease (CHD) accounts for the greatest proportion of heart disease. It is estimated that 12 million people have CHD in the United States.11 What is Heart Disease?
Heart disease refers to any acute or chronic condition that involves the heart or its blood vessels: the muscle itself, valves, blood flow, and
beating rhythm.12 Heart disease primarily affects older adults, and includes CHD, cardiomyopathy, cardiac arrhythmias, and congestive heart failure. Heart disease, together with stroke, make up cardiovascular disease. For the purpose of this analysis, heart disease is considered separately from hypertension due to the debilitating symptoms it presents on its own, which serve as an enabler for many other diseases.
Stroke
In the United States, stroke is the third leading cause of death,9 and a major cause of illness, disability, and increases in health care costs. In 2006, nearly 150,000 people died of stroke.13 About four million people have cerebrovascular disease, the most common type of which is stroke.13 Nearly 800,000 strokes occur each year in the United States.11 What is Stroke?
Stroke is a distinct type of cardiovascular disease, also called cerebrovascular disease. Specifically, stroke is a disease that affects the arteries leading to and within the brain. A stroke occurs when a blood vessel that carries oxygen and nutrients to the brain is either blocked by a clot, or ruptures. When this happens, part of the brain cannot get blood and oxygen, and begins to die.14
What is 3-4-50?

3-4-50: Chronic Disease in San Diego County
4
Diabetes
Diabetes is a major cause of premature illness and death. In the United States, 23.6 million children and adults have diabetes, representing 7.8% of the population. Furthermore, diabetes is increasing in both new and total cases.11 A total of 1.6 million new cases of diabetes were diagnosed in people ages 20 years or older in 2007.15
What is Diabetes?
Diabetes mellitus is a serious disease in which the levels of blood glucose, or blood sugar, are above normal. It is possible to live without knowing one has the disease; in fact one out of four people with diabetes do not even know they have the disease.9 Uncontrolled diabetes can cause major health problems and disability. People with uncontrolled diabetes are more likely to have heart disease and stroke, vision problems such as blindness, nerve damage to hands and feet leading to amputation, kidney failure, and loss of teeth.10
What is Type 2 Diabetes?
Of the three types of diabetes (Type 1 diabetes, Type 2 diabetes, and gestational diabetes), Type 2 diabetes is most common, accounting for 90% to 95% of all diabetes cases. Type 2 diabetes is typically associated with obesity and physical inactivity, and most commonly occurs after the age of 40.11 Pre-diabetes occurs when blood glucose levels are higher than normal but not high enough to be diagnosed as diabetes. Pre-diabetes often leads to type 2 diabetes. In addition to Americans already diagnosed with diabetes, another 57 million have pre-diabetes, and 25% of these do not know they have the disease .8
Pulmonary Disease
Pulmonary or respiratory diseases such as asthma and chronic obstructive pulmonary disease (COPD) are a significant public health problem in the United States. More than 23 million adults and children in the United States currently have asthma, and another 13.6 million adults currently have COPD.16,17 In 2006, there were 13.3 million visits, with asthma as the primary diagnosis, to physician offices, hospital outpatient clinics, and emergency departments; there were 444,000 hospitalizations for asthma.18 Asthma and COPD are among the ten leading causes of restricted activity, and asthma is the second most common cause of chronic disease in children.
What are Asthma and COPD?
Asthma is a chronic inflammatory disease of the respiratory system which causes the airways of the lungs to constrict and become inflamed in response to certain triggers. It is the most common chronic disease in children and can also be found in adults. COPD is a disease that makes it hard to breathe. The disease is progressive, meaning it gets worse over time, and includes chronic bronchitis and emphysema.17 Cigarette smoking is the leading cause of COPD; however, long-term exposure to environmental tobacco smoke and other lung irritants, such as air pollution, chemical fumes, or dust may also contribute to the disease. COPD occurs most often in older adults and may affect more than 10% of adults 65 years or older.9,19
What is 3-4-50?

3-4-50: Chronic Disease in San Diego County
5
Over 50% of Deaths
Three behaviors - poor diet, physical inactivity and tobacco use - contribute to four major chronic diseases - cancer, heart disease, type 2 diabetes, and pulmonary disease - which are responsible for more than 50% of deaths worldwide.
Prevention Opportunities
What are the Modifiable Risk Factors of Cancer?
Cancers that can be prevented through a healthy lifestyle, or detected earlier through screening, account for half of all cases in the United States.20 Thus, promoting healthy behaviors, and making cancer screening, information, and referral services available and accessible is essential for reducing the rates of cancer morbidity and mortality, as well as the associated costs of treatment.
What are the Modifiable Risk Factors of Heart Disease?
The most common risk factors for heart disease include physical inactivity, obesity, hypertension, cigarette smoking, high cholesterol, and diabetes. More than one-third of all U.S. adults reported having two or more of these risk factors in 2003.20
Behavioral and lifestyle changes can affect the factors leading to heart disease. As the U.S. population ages, the economic impact of heart disease on the nation’s health care system will become even greater. Primary prevention to promote heart-healthy behaviors is a key strategy in reducing development of heart disease.21
What are the Modifiable Risk Factors of Stroke?
Similar to heart disease, the most common risk factors for stroke include physical inactivity, obesity, hypertension, cigarette smoking, high cholesterol, and diabetes. More than one-third of all U.S. adults reported having two or more of these risk factors in 2003.12 Only 10% of stroke victims recover almost completely, leading to reduced quality of life, ongoing medical care, and increased costs of ongoing medical treatment. Making healthy lifestyle choices and managing
adverse medical conditions can help in preventing stroke.
What are the Modifiable Risk Factors of Diabetes?
The most common risk factors for type 2 diabetes include overweight and obesity, physical inactivity, smoking, hypertension and abnormal cholesterol. Two out of three Americans are now overweight or obese.22
Studies show that losing as little as 10 pounds and keeping it off can delay or prevent the onset of diabetes in individuals at risk. A reduction of 100 calories per day will lead to a 10 pound weight loss over a year.22
What are the Modifiable Risk Factors of Pulmonary Disease?
There are numerous behaviors and diseases that impact respiratory health and function, including smoking, tuberculosis, lung cancer, AIDS, pneumonia, and occupational lung diseases.13 The single, most effective way to prevent respiratory diseases such as asthma and COPD is to stop smoking.
What is 3-4-50?
How to Modify Your Risk Factors
Improve your diet: eat an apple instead of a me-dium serving of fries to lose 300 calories and gain vitamins and fiber. Incorporate physical activity into your daily routine: take the stairs, park in the furthest spot and walk 10,000 steps per day to im-prove cardiovascular and pulmonary health. Stop smoking: talk to your doctor for help.
3-4-50: Chronic Disease in San Diego County
6
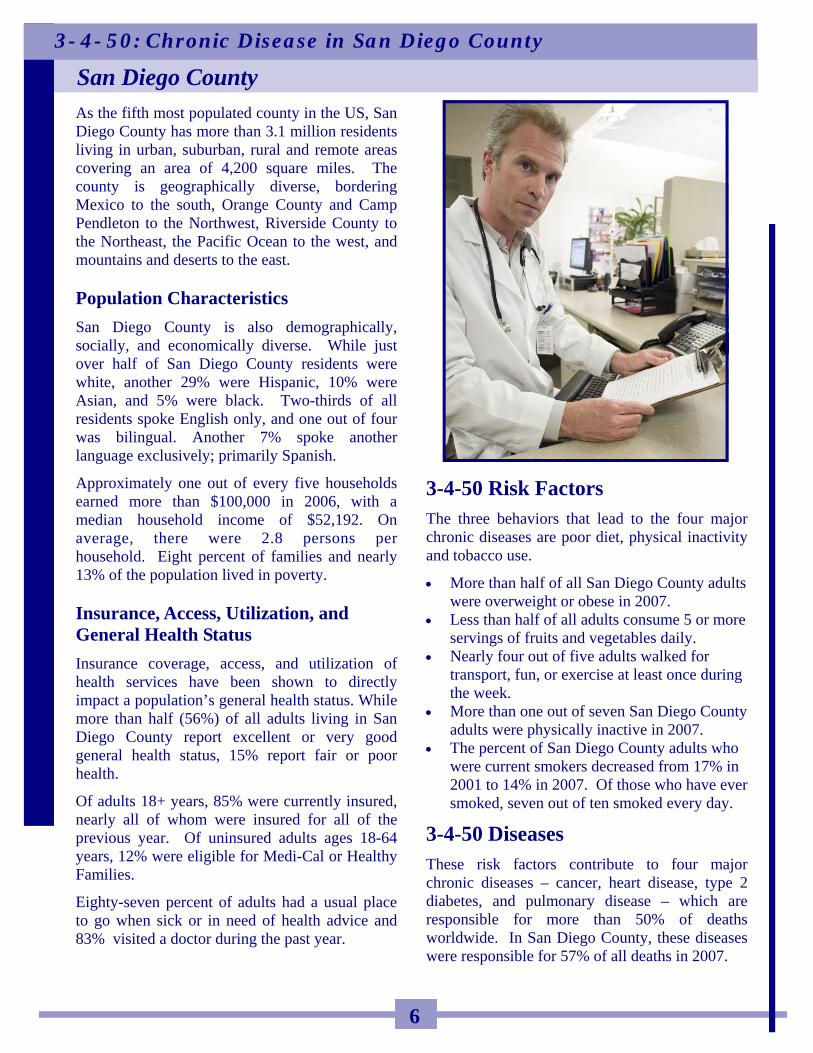
As the fifth most populated county in the US, San Diego County has more than 3.1 million residents living in urban, suburban, rural and remote areas covering an area of 4,200 square miles. The county is geographically diverse, bordering Mexico to the south, Orange County and Camp Pendleton to the Northwest, Riverside County to the Northeast, the Pacific Ocean to the west, and mountains and deserts to the east. Population Characteristics
San Diego County is also demographically, socially, and economically diverse. While just over half of San Diego County residents were white, another 29% were Hispanic, 10% were Asian, and 5% were black. Two-thirds of all residents spoke English only, and one out of four was bilingual. Another 7% spoke another language exclusively; primarily Spanish.
Approximately one out of every five households earned more than $100,000 in 2006, with a median household income of $52,192. On average, there were 2.8 persons per household. Eight percent of families and nearly 13% of the population lived in poverty. Insurance, Access, Utilization, and General Health Status
Insurance coverage, access, and utilization of health services have been shown to directly impact a population’s general health status. While more than half (56%) of all adults living in San Diego County report excellent or very good general health status, 15% report fair or poor health.
Of adults 18+ years, 85% were currently insured, nearly all of whom were insured for all of the previous year. Of uninsured adults ages 18-64 years, 12% were eligible for Medi-Cal or Healthy Families.
Eighty-seven percent of adults had a usual place to go when sick or in need of health advice and 83% visited a doctor during the past year.
3-4-50 Risk Factors
The three behaviors that lead to the four major chronic diseases are poor diet, physical inactivity and tobacco use.
More than half of all San Diego County adults were overweight or obese in 2007.
Less than half of all adults consume 5 or more servings of fruits and vegetables daily.
Nearly four out of five adults walked for transport, fun, or exercise at least once during the week.
More than one out of seven San Diego County adults were physically inactive in 2007.
The percent of San Diego County adults who were current smokers decreased from 17% in 2001 to 14% in 2007. Of those who have ever smoked, seven out of ten smoked every day.
3-4-50 Diseases
These risk factors contribute to four major chronic diseases – cancer, heart disease, type 2 diabetes, and pulmonary disease – which are responsible for more than 50% of deaths worldwide. In San Diego County, these diseases were responsible for 57% of all deaths in 2007.
San Diego County

3-4-50: Chronic Disease in San Diego County
7
Cancer
Cancer was the leading cause of death in San Diego County in 2007, however overall cancer death rates have been generally decreasing since 2000. One out of every ten residents of the County have ever been diagnosed with cancer.
Lung, prostate, female breast, and colorectal cancer were the most common causes of cancer death.
Three out of four women over 30 had their breasts examined for lumps by a doctor in the past year and nearly two-thirds had a mammogram in the past two years.
Nine out of ten women over 30 who have not had a hysterectomy have had a Pap Test in the past three years.
Three out of four adults over age 50 years have ever had a sigmoidoscopy, colonoscopy, or fecal occult blood test (FOBT).
In 2007, one out of every three males over age 40 had a prostate-specific antigen (PSA) screening in the previous year.
Coronary Heart Disease (CHD) and Stroke
Diseases of the heart (including CHD) and cerebrovascular diseases (stroke) were the second and third leading causes of death in the County in 2007; however the CHD and stroke death rates were both significantly lower than the Healthy People 2010 targets. Death and hospitalization rates for these diseases have steadily declined since 2000. Approximately 6% of San Diego County adults have ever been diagnosed with a disease of the heart, and more than 7% have ever been diagnosed with a stroke.
More than one out of every four San Diego County adults have ever been diagnosed with high blood pressure; two-thirds of whom were taking medicine to control their high blood pressure in 2007.
Among adults tested for high blood cholesterol, one out of five were diagnosed with high blood cholesterol.
The age-adjusted rate of CHD death and hospitalization was disproportionately high for blacks in San Diego County compared to all other racial/ethnic groups.
The age-adjusted rate of stroke death and hospitalization was disproportionately high for blacks and Hispanics in San Diego County compared to whites and Asian/Pacific Islanders.
San Diego County

3-4-50: Chronic Disease in San Diego County
8
Diabetes
Diabetes was the seventh leading cause of death in San Diego County in 2007. While diabetes death rates have fluctuated in recent years, diabetes hospitalization rates have generally increased since 2000, and were nearly as high as diabetes emergency department (ED) discharges in 2008. More than 6% of San Diego County adults have ever been diagnosed with diabetes.
The age-adjusted rates of diabetes death, hospitalization and ED discharge were significantly higher among black residents of the County than other racial/ethnic groups, but also disproportionately high among Hispanics compared to whites or Asian/Pacific Islanders.
More than one out of four adult diabetics reported taking insulin for their diabetes in 2007.
Pulmonary Disease
COPD and other chronic lower respiratory diseases were the fourth leading cause of death in San Diego County in 2007. While asthma deaths were relatively uncommon, asthma medical encounters were not. In 2008, there were four times the number of asthma ED discharges as asthma hospitalizations. More than one out of eight San Diego County adults have ever been diagnosed with asthma, three out of five of whom reported currently having asthma in 2007.
Asthma death, hospitalization, and ED discharge rates were more than three times higher for blacks compared to any other racial/ethnic group.
While asthma deaths and hospitalizations were highest among older adults ages 65+ years, asthma ED discharges were highest among children ages 0-14 years.
COPD death rates were significantly higher among whites than other racial/ethnic groups; however, the age-adjusted COPD hospitalization and ED discharge rates were disproportionately high among blacks compared to other racial/ethnic groups.
San Diego County

3-4-50: Chronic Disease in San Diego County
9
Medical Encounters for 3-4-50 Diseases Among San Diegans Since 2000, the overall County death rates for the 3-4-50 chronic diseases have trended downward, however in the last few years this trend has began to reverse. More San Diegans died from cancer in 2007 than in previous years, and the rate has increased so that 1 of every 645 San Diegans died of cancer in 2007. Death and hospitalization for heart disease and stroke have decreased, however 1 of every 315 San Diegans was hospitalized for heart disease in 2008. Emergency department visits have been increasing.
Rates for death, hospitalization, and emergency department visits for diabetes have increased since 2000. One of every 792 San Diegans was hospitalized and 1 of every 732 was discharged from the emergency department for diabetes. Death from asthma is a rare event, however in 2008, over 9,000 San Diegans visited the emergency department. Hospitalizations for COPD have increased since 2006, and emergency department visits have increased 27%. For more detailed information on chronic diseases by age group, race/ethnicity, gender, and location, please go to the Community Profiles online at www.sdhealthstatistics.com.
San Diego County
Year
Cancer CHD Stroke Diabetes Asthma COPD
Number Rate* Number Rate* Number Rate* Number Rate* Number Rate* Number Rate*
Deaths
2000 4,724 167.9 4,552 161.8 1,578 56.1 481 17.1 36 1.3 1,028 36.5
2001 4,666 162.9 4,512 157.6 1,616 56.4 491 17.1 44 1.5 1,133 39.6
2002 4,584 157.0 4,247 145.4 1,459 50.0 475 16.3 32 1.1 965 33.0
2003 4,715 158.7 4,180 140.7 1,521 51.2 499 16.8 31 1.0 1,020 34.3
2004 4,631 153.7 4,019 133.4 1,423 47.2 531 17.6 24 0.8 1,022 33.9
2005 4,664 153.5 3,767 123.9 1,218 40.1 604 19.9 41 1.3 1,066 35.1
2006 4,638 151.3 3,537 115.4 1,147 37.4 612 20 35 1.1 998 32.6
2007 4,812 155.2 3,489 112.5 1,122 36.2 520 16.8 30 1.0 973 31.4
Hospital Dis-charges
2000 14,512 515.7 7,484 266.0 2,949 104.8 2,463 87.5 3,692 131.2
2001 14,184 495.3 7,267 253.8 2,883 100.7 2,418 84.4 3,662 127.9
2002 14,176 485.5 6,938 237.6 3,041 104.1 2,416 82.7 3,445 118.0
2003 13,254 446.0 6,776 228.0 3,166 106.5 2,619 88.1 3,295 110.9
2004 12,471 413.9 6,339 210.4 3,245 107.7 2,263 75.1 2,954 98.0
2005 12,055 396.6 6,393 210.3 3,406 112.1 2,087 68.7 2,908 95.7
2006 11,075 361.3 6,435 209.9 3,729 121.7 1,898 61.9 2,752 89.8
2007 10,514 339.1 6,432 207.5 3,986 128.6 2,091 67.4 2,997 96.7
2008 9,973 317.0 6,488 206.2 3,972 126.2 2,267 72.1 3,468 110.2
Emergency Department Discharges
2006 897 29.3 1,288 42.0 4,179 136.3 9,217 300.7 5,482 178.9
2007 790 25.5 1,350 43.5 4,269 137.7 9,573 308.8 5,777 186.3
2008 827 26.3 1,321 42.0 4,302 136.7 9,251 294.0 7,135 226.8
* Rates per 100,000 population.
Cancer death refers to all malignant neoplams (underlying cause of death) ICD-10 codes C00-C97. Cancer hospitalizations and ED discharges not included here. Coronary Heart Disease (CHD) death refers to (underlying cause of death) ICD-10 codes I11, I20-I25; CHD hospitalization and ED discharge refers to ICD-9 codes 402, 410-414, 429.2. Stroke death refers to (underlying cause of death) ICD-10 codes I60-I69; Stroke hospitalization and ED discharge refers to ICD-9 codes 430-438. Stroke is sometimes referred to as Cerebrovascular disease. Diabetes death refers to (underlying cause of death) ICD-10 codes E10-E14; Data here represent only underlying cause of death and do not include those where Diabetes was a contributing cause of death; Diabetes hospitalization and ED discharge refers to ICD-9 code 250. Asthma death refers to (underlying cause of death) ICD-10 codes J45-J46; Asthma hospitalization and ED discharge refers to ICD-9 code 493. Chronic Obstructive Pulmonary Disease (COPD) death refers to (underlying cause of death) ICD-10 codes J40-44; COPD hospitalization and ED discharge refers to ICD-9 code 490-492, 496.
Sources: Death Statistical Master Files (CA DPH), County of San Diego, Health & Human Services Agency, Epidemiology & Immunization Services Branch; Hospital Discharge Data, (CA OSHPD), County of San Diego, Health & Human Services Agency, Epidemiology & Immunization Services Branch; HASD&IC, CHIP, County of San Diego, Health & Human Services Agency, Emergency Medical Services, Emergency Department Database; SANDAG, Current Population Estimates, 4/24/2009.

3-4-50: Chronic Disease in San Diego County
10
3-4-50 Disease Projections There are several factors that contribute to the urgency of addressing chronic disease in San Diego County, including the aging of the population and the increase in prevalence rates, or proportions of the population diagnosed with these diseases. These factors will lead to more patients who will ultimately utilize the emergency department and the hospital as their diseases progress.
Population Growth
By the year 2020, the population of San Diego County is projected to increase by 13% from 3.1 to 3.5 million people. Even more striking, the older adult population (ages 65+ years) is projected to increase by 40% to nearly 500,000 people.
By the year 2030, the population is projected to grow to 3.9 million and the older adult population is projected to double, approaching 750,000.
By the year 2050, the population of San Diego County is projected to grow to 4.4 million, an increase of 42%.
Deaths Among San Diegans
If no changes are made in risk behavior, based on
current disease rates, the total number of deaths for cancer, CHD, stroke, diabetes, asthma and COPD will increase 36% by the year 2020.
Cancer deaths will increase by 34% CHD deaths will increase by 38% Stroke deaths will increase by 38% Diabetes deaths will increase by 35% Asthma deaths will increase by 14% COPD deaths will increase by 40%
By 2050, the number of deaths from these chronic diseases will have increased 116% over current numbers. More than twice as many San Diegans will die from these chronic diseases in 2050 as died in 2007.
Cancer deaths will increase by 109% CHD deaths will increase by 121% Stroke deaths will increase by 124% Diabetes deaths will increase by 111% Asthma deaths will increase by 60% COPD deaths will increase by 129%
San Diego County
Source: County of San Diego, Health and Human Services Agency, Community Health Statistics Unit, 3/2010; SANDAG Population Projections, 10/2009 update. Projections based on most current available death rates and applied to age-specific population projections.
Selected 3-4-50 Disease Projections: DEATHS
-
5,000
10,000
15,000
20,000
25,000
2007 2020 2030 2040 2050
Num
ber
of D
eath
s
Cancer
CHD
Stroke
Diabetes
Asthma
COPD
Total
By 2020, the County’s population is projected to increase by 13%, however the number of deaths from these chronic diseases is projected to increase by 36%, almost three times greater, if no changes are made in risk behavior.

3-4-50: Chronic Disease in San Diego County
11
Hospitalizations Among San Diegans Individuals with chronic diseases are hospitalized at a higher rate than healthier individuals. These more frequent hospitalizations are often due to disease progression or complications from the disease. In 2007, there were over 26,000 hospitalizations for the 3-4-50 chronic diseases. Almost 63% were for coronary heart disease and stroke. Of these diseases, there were the fewest hospitalizations for patients with asthma. Cancer is not included in hospitalization data. If there are no changes, based on current rates, the total number of hospitalizations for CHD, stroke, diabetes, asthma and COPD will increase 27% by the year 2020. If nothing changes to modify risk behavior, based on current rates, by 2020 the number of :
CHD hospitalizations will increase 28%, Stroke hospitalizations will increase 31%, Diabetes hospitalizations will increase 19%, Asthma hospitalizations will increase 17%, COPD hospitalizations will increase 31%.
The rate of increase in the number of hospitalizations is projected to increase sharply through 2030 to 41,000, then more slowly to 49,000 by 2050. If there are no changes to modify risk behavior, based on current rates, the total number of hospitalizations for CHD, stroke, diabetes, asthma and COPD will increase 87% by the year 2050.
CHD hospitalizations will increase 91%, Stroke hospitalizations will increase 101%, Diabetes hospitalizations will increase 62%, Asthma hospitalizations will increase 51%, COPD hospitalizations will increase 101%.
San Diego County
Selected 3-4-50 Disease Projections: HOSPITALIZATIONS
-
10,000
20,000
30,000
40,000
50,000
2007 2020 2030 2040 2050
Num
ber
of H
ospi
taliz
atio
ns
CHD
Stroke
Diabetes
Asthma
COPD
Total
Source: County of San Diego, Health and Human Services Agency, Community Health Statistics Unit, 3/2010; SANDAG Population Projections, 10/2009 update. Projections based on most current available hospitalization rates and applied to age-specific population projections. Cancer hospitalization rates not available.
3-4-50: Chronic Disease in San Diego County
12
Emergency Department Visits Among San Diegans
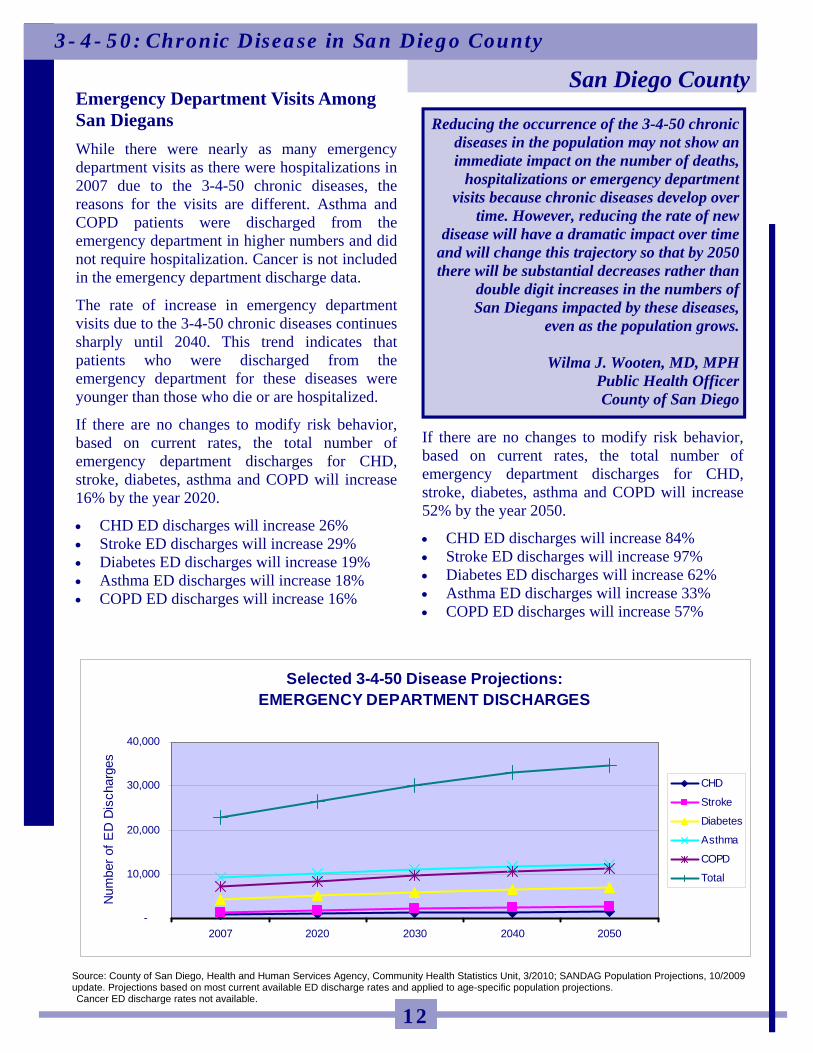
While there were nearly as many emergency department visits as there were hospitalizations in 2007 due to the 3-4-50 chronic diseases, the reasons for the visits are different. Asthma and COPD patients were discharged from the emergency department in higher numbers and did not require hospitalization. Cancer is not included in the emergency department discharge data.
The rate of increase in emergency department visits due to the 3-4-50 chronic diseases continues sharply until 2040. This trend indicates that patients who were discharged from the emergency department for these diseases were younger than those who die or are hospitalized.
If there are no changes to modify risk behavior, based on current rates, the total number of emergency department discharges for CHD, stroke, diabetes, asthma and COPD will increase 16% by the year 2020.
CHD ED discharges will increase 26% Stroke ED discharges will increase 29% Diabetes ED discharges will increase 19% Asthma ED discharges will increase 18% COPD ED discharges will increase 16%
If there are no changes to modify risk behavior, based on current rates, the total number of emergency department discharges for CHD, stroke, diabetes, asthma and COPD will increase 52% by the year 2050.
CHD ED discharges will increase 84% Stroke ED discharges will increase 97% Diabetes ED discharges will increase 62% Asthma ED discharges will increase 33% COPD ED discharges will increase 57%
San Diego County
Source: County of San Diego, Health and Human Services Agency, Community Health Statistics Unit, 3/2010; SANDAG Population Projections, 10/2009 update. Projections based on most current available ED discharge rates and applied to age-specific population projections. Cancer ED discharge rates not available.
Selected 3-4-50 Disease Projections: EMERGENCY DEPARTMENT DISCHARGES
-
10,000
20,000
30,000
40,000
2007 2020 2030 2040 2050
Num
ber
of E
D D
isch
arge
s
CHD
Stroke
Diabetes
Asthma
COPD
Total
Reducing the occurrence of the 3-4-50 chronic diseases in the population may not show an immediate impact on the number of deaths,
hospitalizations or emergency department visits because chronic diseases develop over
time. However, reducing the rate of new disease will have a dramatic impact over time
and will change this trajectory so that by 2050 there will be substantial decreases rather than
double digit increases in the numbers of San Diegans impacted by these diseases,
even as the population grows.
Wilma J. Wooten, MD, MPH Public Health Officer County of San Diego

3-4-50: Chronic Disease in San Diego County
13
Investing in The Future of San Diego County The number of San Diegans who are projected to develop cancer, heart disease and stroke, diabetes, or pulmonary disease threaten to overwhelm the health system in the coming decades unless action is taken immediately to reduce the risk of disease in the population.
Medical evidence has proven that the 3-4-50 chronic diseases can be prevented or delayed through changes in personal behaviors. Eating a healthy diet, staying physically active, and not smoking will greatly reduce an individual’s risk of chronic disease.
In July 2010, the County of San Diego Board of Supervisors for the took unprecedented action to change the future for the next generation. By adopting the Building Better Health strategy, they embarked on a ten year commitment to improve the health of San Diegans. While ultimately, behavior change is a personal decision, the County can create an environment that fosters better dietary choices, accessible opportunities to incorporate physical activity into daily life, and discourages tobacco and other substance use and abuse. This is the legacy we leave for the next generation of San Diegans.
Regional Impacts
The HHSA Regions vary widely in terms of their demographic, economic and disease risk profiles. The age of the population, risk behaviors, and access to health care all play a part in determining the health of the community.
The following sections summarize the impacts of the 3-4-50 behaviors and disease rates in each of the six HHSA Regions. More detailed regional and community level data on the demographics, economics, disease rates and health behaviors can be found online at www.sdhealthstatistics.com in the Community Profiles.
San Diego County
3-4-50: Chronic Disease in San Diego County
14
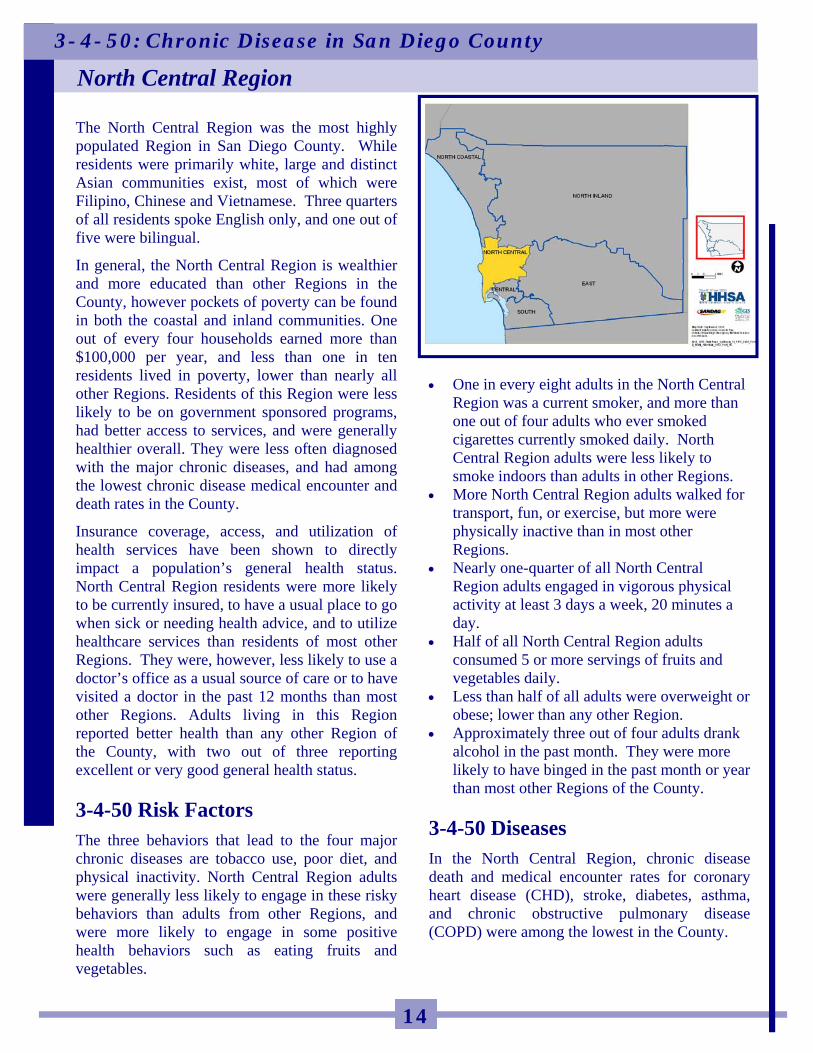
The North Central Region was the most highly populated Region in San Diego County. While residents were primarily white, large and distinct Asian communities exist, most of which were Filipino, Chinese and Vietnamese. Three quarters of all residents spoke English only, and one out of five were bilingual.
In general, the North Central Region is wealthier and more educated than other Regions in the County, however pockets of poverty can be found in both the coastal and inland communities. One out of every four households earned more than $100,000 per year, and less than one in ten residents lived in poverty, lower than nearly all other Regions. Residents of this Region were less likely to be on government sponsored programs, had better access to services, and were generally healthier overall. They were less often diagnosed with the major chronic diseases, and had among the lowest chronic disease medical encounter and death rates in the County.
Insurance coverage, access, and utilization of health services have been shown to directly impact a population’s general health status. North Central Region residents were more likely to be currently insured, to have a usual place to go when sick or needing health advice, and to utilize healthcare services than residents of most other Regions. They were, however, less likely to use a doctor’s office as a usual source of care or to have visited a doctor in the past 12 months than most other Regions. Adults living in this Region reported better health than any other Region of the County, with two out of three reporting excellent or very good general health status.
3-4-50 Risk Factors
The three behaviors that lead to the four major chronic diseases are tobacco use, poor diet, and physical inactivity. North Central Region adults were generally less likely to engage in these risky behaviors than adults from other Regions, and were more likely to engage in some positive health behaviors such as eating fruits and vegetables.
One in every eight adults in the North Central Region was a current smoker, and more than one out of four adults who ever smoked cigarettes currently smoked daily. North Central Region adults were less likely to smoke indoors than adults in other Regions.
More North Central Region adults walked for transport, fun, or exercise, but more were physically inactive than in most other Regions.
Nearly one-quarter of all North Central Region adults engaged in vigorous physical activity at least 3 days a week, 20 minutes a day.
Half of all North Central Region adults consumed 5 or more servings of fruits and vegetables daily.
Less than half of all adults were overweight or obese; lower than any other Region.
Approximately three out of four adults drank alcohol in the past month. They were more likely to have binged in the past month or year than most other Regions of the County.
3-4-50 Diseases
In the North Central Region, chronic disease death and medical encounter rates for coronary heart disease (CHD), stroke, diabetes, asthma, and chronic obstructive pulmonary disease (COPD) were among the lowest in the County.
North Central Region

3-4-50: Chronic Disease in San Diego County
15
Cancer Cancer was the leading cause of death in the North Central Region in 2007, the rate of which was lower, though not significantly, than the County overall. For each of the major cancers, including female breast, colorectal, and lung cancer, the death rate was lower in the North Central Region than in many other Regions. A higher percent of North Central Region adults, one in nine, were ever diagnosed with cancer than in other Regions. Overall cancer deaths were disproportionately
high for white residents of the North Central Region compared to other racial/ethnic groups within the Region, possibly because of the higher proportion of white residents who are 65+ years.
Women over 30 were more likely to have had their breasts examined for lumps by a doctor in the past year but less likely to have ever had a Pap Test than women in the County overall.
Adults over age 50 years were less likely to have ever had a sigmoidoscopy, colonoscopy, or fecal occult blood test (FOBT) than adults in any other Region.
Approximately one-third of males over age 40 in the North Central Region had a prostate-specific antigen (PSA) screening the past year.
Coronary Heart Disease (CHD) and Stroke Diseases of the heart and cerebrovascular diseases (stroke) were the second and fourth leading cause of death in the North Central Region in 2007. CHD and stroke death and hospitalization rates have declined significantly since 2000, and a lower percentage of adults living in the North Central Region were ever diagnosed with a disease of the heart than in any other Region. North Central Region adults were nearly as
likely as adults throughout the County to have ever been diagnosed with high blood pressure, and just as likely to be currently taking medication to control their high blood pressure.
Among adults tested for high blood cholesterol, North Central Region residents were more likely to have been diagnosed with high blood cholesterol than any other Region in the County.
North Central Region

3-4-50: Chronic Disease in San Diego County
16
Diabetes Diabetes death and hospitalization rates in the North Central Region have remained relatively stable since 2000, and hospitalization and emergency department (ED) discharge rates were statistically significantly lower than the County overall in 2008. The percent of North Central Region residents ever diagnosed with diabetes was lower than in any other Region. The rate of emergency department (ED)
discharge for diabetes was statistically significantly lower in the North Central Region than in any other Region, and close to 50% lower than the County overall.
Diabetes hospitalization and ED discharge rates were disproportionately high for blacks living in the North Central Region compared to other racial/ethnic groups in the Region, potentially reflecting a low use of primary care providers for early disease intervention.
Pulmonary Disease Asthma and COPD death and hospitalization rates have fluctuated slightly since 2000, but overall remained relatively stable. North Central Region asthma hospitalization and ED discharge rates were among the lowest in the County, and COPD hospitalization and ED discharge rates were the lowest. The percentage of North Central Region adults who were ever diagnosed with asthma was similar to the County overall, however only one out of two adults reported having asthma at the time of survey.
Among current asthmatics, nearly all have had asthma symptoms in the past year. However, fewer than four out of ten asthmatics took daily medication to control their asthma, lower than in the County overall.
Three out of ten current asthmatics had ever received an asthma management plan from a health professional.
Asthma hospitalization and ED discharge rates were disproportionately high among black residents of the North Central Region compared to other racial/ethnic groups within the Region.
The COPD hospitalization rate was highest among whites in the North Central Region compared to other racial/ethnic groups, however, the ED discharge rate was disproportionately high among blacks compared to other racial/ethnic groups.
North Central Region
3-4-50: Chronic Disease in San Diego County
17
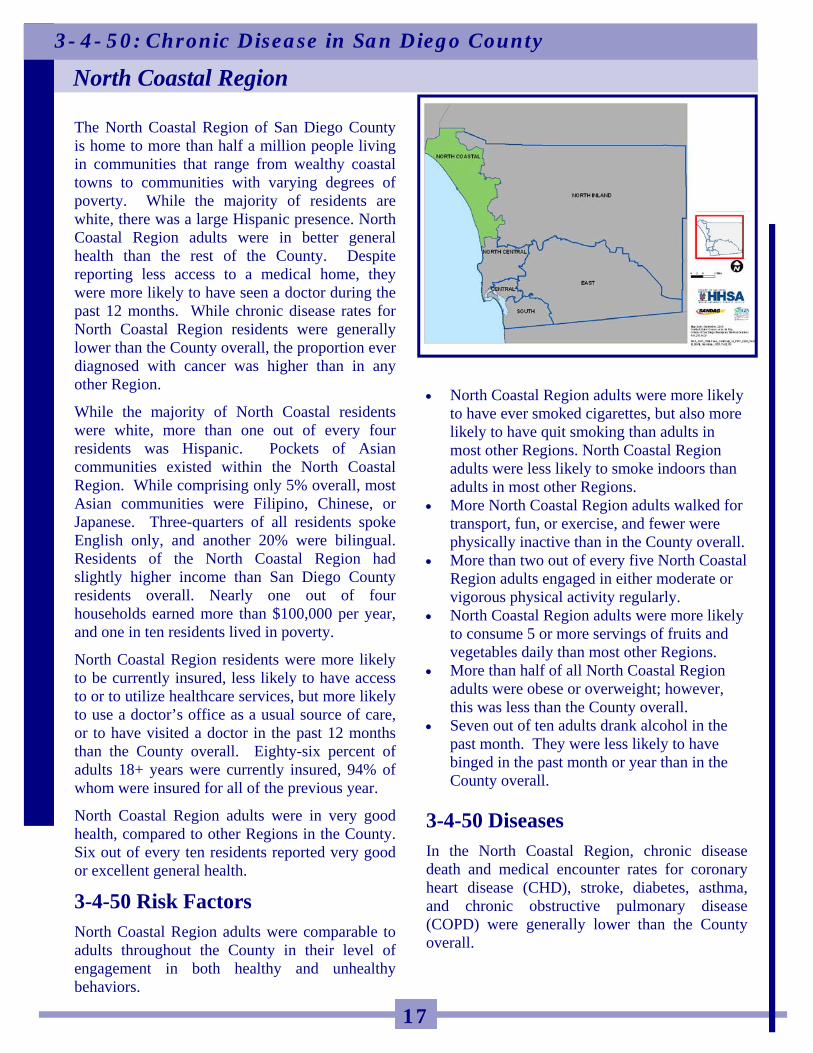
The North Coastal Region of San Diego County is home to more than half a million people living in communities that range from wealthy coastal towns to communities with varying degrees of poverty. While the majority of residents are white, there was a large Hispanic presence. North Coastal Region adults were in better general health than the rest of the County. Despite reporting less access to a medical home, they were more likely to have seen a doctor during the past 12 months. While chronic disease rates for North Coastal Region residents were generally lower than the County overall, the proportion ever diagnosed with cancer was higher than in any other Region.
While the majority of North Coastal residents were white, more than one out of every four residents was Hispanic. Pockets of Asian communities existed within the North Coastal Region. While comprising only 5% overall, most Asian communities were Filipino, Chinese, or Japanese. Three-quarters of all residents spoke English only, and another 20% were bilingual. Residents of the North Coastal Region had slightly higher income than San Diego County residents overall. Nearly one out of four households earned more than $100,000 per year, and one in ten residents lived in poverty.
North Coastal Region residents were more likely to be currently insured, less likely to have access to or to utilize healthcare services, but more likely to use a doctor’s office as a usual source of care, or to have visited a doctor in the past 12 months than the County overall. Eighty-six percent of adults 18+ years were currently insured, 94% of whom were insured for all of the previous year.
North Coastal Region adults were in very good health, compared to other Regions in the County. Six out of every ten residents reported very good or excellent general health.
3-4-50 Risk Factors
North Coastal Region adults were comparable to adults throughout the County in their level of engagement in both healthy and unhealthy behaviors.
North Coastal Region adults were more likely to have ever smoked cigarettes, but also more likely to have quit smoking than adults in most other Regions. North Coastal Region adults were less likely to smoke indoors than adults in most other Regions.
More North Coastal Region adults walked for transport, fun, or exercise, and fewer were physically inactive than in the County overall.
More than two out of every five North Coastal Region adults engaged in either moderate or vigorous physical activity regularly.
North Coastal Region adults were more likely to consume 5 or more servings of fruits and vegetables daily than most other Regions.
More than half of all North Coastal Region adults were obese or overweight; however, this was less than the County overall.
Seven out of ten adults drank alcohol in the past month. They were less likely to have binged in the past month or year than in the County overall.
3-4-50 Diseases
In the North Coastal Region, chronic disease death and medical encounter rates for coronary heart disease (CHD), stroke, diabetes, asthma, and chronic obstructive pulmonary disease (COPD) were generally lower than the County overall.
North Coastal Region
3-4-50: Chronic Disease in San Diego County
18
Cancer
Cancer was the leading cause of death in the North Coastal Region in 2007, the rate of which was similar to the County overall. One in every eight North Coastal Region adults were ever diagnosed with cancer, a higher proportion than in any other Region.
Overall cancer deaths were disproportionately high for white residents of the North Coastal Region compared to other racial/ethnic groups within the Region, possibly because of the higher proportion of white residents who are 65+ years.
Women over 30 were more likely to have had their breasts examined for lumps by a doctor in the past year and more likely to have ever had a Pap Test than women in any other Region.
Adults over age 50 years were more likely to have ever had a sigmoidoscopy, colonoscopy, or fecal occult blood test (FOBT) than adults in the County overall.
Approximately two out of every five males over age 40 in the North Coastal Region had a prostate-specific antigen (PSA) screening the past year. Coronary Heart Disease (CHD) and
Stroke
Diseases of the heart (including CHD) and cerebrovascular diseases (stroke) were the second and third leading cause of death in the North Coastal Region in 2007. CHD and stroke death and hospitalization rates have declined since 2000, as seen throughout the County. Nearly six percent of adults living in the North Coastal Region were ever diagnosed with heart .
North Coastal Region adults were less likely than adults in other Regions to have ever been diagnosed with high blood pressure. Two out of every three adults with high blood pressure were currently taking medication to control their blood pressure.
Two-thirds of all North Coastal Region adults were tested for high blood cholesterol during the previous year. Of those tested within the past 5 years, 19% were diagnosed with high blood cholesterol.
North Coastal Region

3-4-50: Chronic Disease in San Diego County
19
Diabetes Diabetes death and hospitalization rates in the North Coastal Region have remained relatively stable since 2000, and hospitalization and emergency department (ED) discharge rates were statistically significantly lower than the County overall in 2008. The percent of North Coastal Region residents ever diagnosed with diabetes was also lower than the County overall. The rate of hospitalization for diabetes was
lower in the North Coastal Region than almost all other Regions.
Diabetes hospitalization rates were higher for Hispanics living in the North Coastal Region compared to other racial/ethnic groups in the Region.
Pulmonary Disease Asthma and COPD hospitalization rates have fluctuated since 2000, but appear to be decreasing overall, while asthma death rates have increased. North Coastal Region asthma hospitalization and ED discharge rates were the lowest in the County, and the COPD hospitalization rate was among the lowest in the County. The percentage of North Coastal Region adults who were ever diagnosed with asthma was lower than any other Region.
Among current asthmatics, 85% have had asthma symptoms in the past year. However, fewer than four out of ten asthmatics took daily medication to control their asthma; lower than in the County overall.
Three out of ten adults who were ever diagnosed with asthma have ever received an asthma management plan from a health professional.
Black residents of the North Coastal Region had the highest rates of asthma hospitalization and ED discharge compared to other racial/ethnic groups in the Region.
The COPD ED discharge rate was higher among children ages 0-14 years living in the North Coastal Region than children living in almost every other Region.
North Coastal Region
3-4-50: Chronic Disease in San Diego County
20
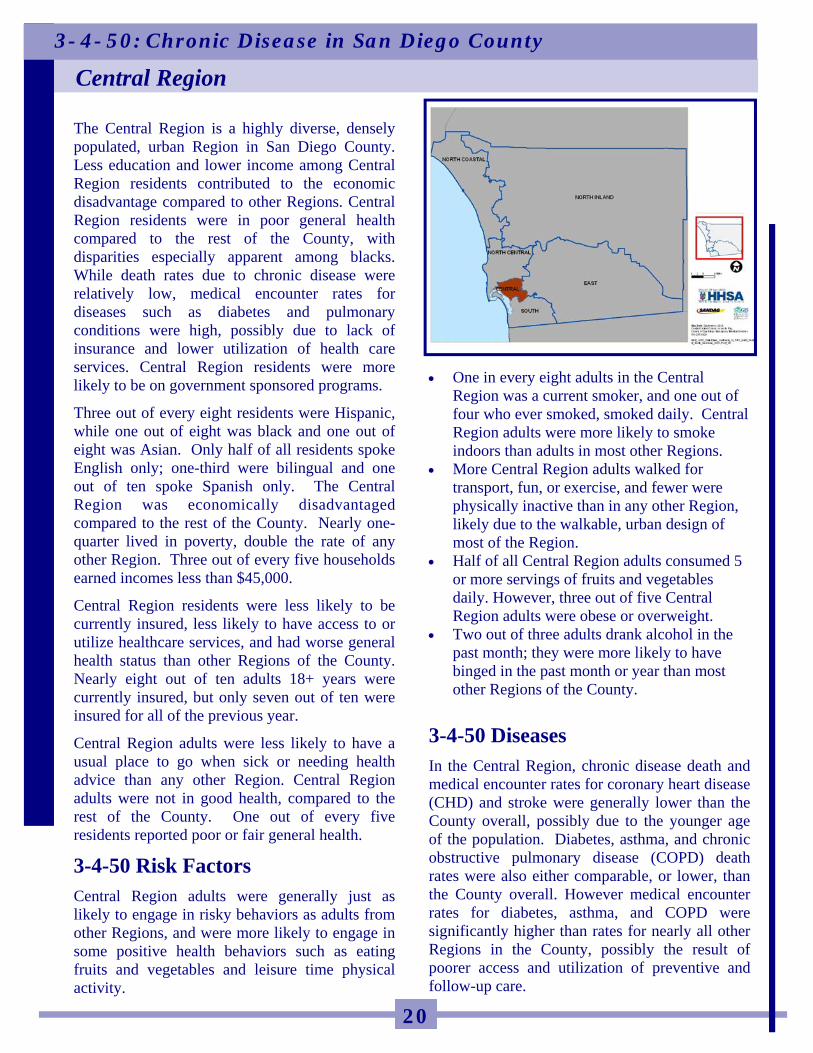
The Central Region is a highly diverse, densely populated, urban Region in San Diego County. Less education and lower income among Central Region residents contributed to the economic disadvantage compared to other Regions. Central Region residents were in poor general health compared to the rest of the County, with disparities especially apparent among blacks. While death rates due to chronic disease were relatively low, medical encounter rates for diseases such as diabetes and pulmonary conditions were high, possibly due to lack of insurance and lower utilization of health care services. Central Region residents were more likely to be on government sponsored programs.
Three out of every eight residents were Hispanic, while one out of eight was black and one out of eight was Asian. Only half of all residents spoke English only; one-third were bilingual and one out of ten spoke Spanish only. The Central Region was economically disadvantaged compared to the rest of the County. Nearly one-quarter lived in poverty, double the rate of any other Region. Three out of every five households earned incomes less than $45,000.
Central Region residents were less likely to be currently insured, less likely to have access to or utilize healthcare services, and had worse general health status than other Regions of the County. Nearly eight out of ten adults 18+ years were currently insured, but only seven out of ten were insured for all of the previous year.
Central Region adults were less likely to have a usual place to go when sick or needing health advice than any other Region. Central Region adults were not in good health, compared to the rest of the County. One out of every five residents reported poor or fair general health.
3-4-50 Risk Factors
Central Region adults were generally just as likely to engage in risky behaviors as adults from other Regions, and were more likely to engage in some positive health behaviors such as eating fruits and vegetables and leisure time physical activity.
One in every eight adults in the Central Region was a current smoker, and one out of four who ever smoked, smoked daily. Central Region adults were more likely to smoke indoors than adults in most other Regions.
More Central Region adults walked for transport, fun, or exercise, and fewer were physically inactive than in any other Region, likely due to the walkable, urban design of most of the Region.
Half of all Central Region adults consumed 5 or more servings of fruits and vegetables daily. However, three out of five Central Region adults were obese or overweight.
Two out of three adults drank alcohol in the past month; they were more likely to have binged in the past month or year than most other Regions of the County.
3-4-50 Diseases
In the Central Region, chronic disease death and medical encounter rates for coronary heart disease (CHD) and stroke were generally lower than the County overall, possibly due to the younger age of the population. Diabetes, asthma, and chronic obstructive pulmonary disease (COPD) death rates were also either comparable, or lower, than the County overall. However medical encounter rates for diabetes, asthma, and COPD were significantly higher than rates for nearly all other Regions in the County, possibly the result of poorer access and utilization of preventive and follow-up care.
Central Region

3-4-50: Chronic Disease in San Diego County
21
Cancer Overall cancer death rates in the Central Region have decreased since 2000, and were significantly lower than in the County overall. Compared to most other Regions, Central Region residents were less likely to die from prostate, female breast, colorectal, or lung cancer. A lower percent of Central Region adults were ever diagnosed with cancer than in other Regions. Overall cancer deaths were disproportionately
high for black residents of the Central Region compared to black residents of other Regions.
Women over 30 were less likely to have had their breasts examined for lumps by a doctor in the past year and less likely to have ever had a Pap Test than women in any other Region.
Adults over age 50 years were more likely to have ever had a sigmoidoscopy, colonoscopy, or fecal occult blood test (FOBT) than adults in most other Regions.
Approximately one-third of males over age 40 in the Central Region had a Prostate-Specific Antigen (PSA) screening during the past year.
Coronary Heart Disease (CHD) and Stroke Diseases of the heart and cerebrovascular diseases (stroke) were the first and third leading causes of death in the Central Region in 2007. CHD and stroke death and medical encounter rates have generally declined since 2000, and a lower percentage of adults living in the Central Region were ever diagnosed with a disease of the heart than in San Diego County overall. Central Region adults were just as likely as
residents throughout the County to have ever been diagnosed with high blood pressure, however, they were significantly less likely to be currently taking medication to control their high blood pressure.
Among adults tested for high blood cholesterol, Central Region residents were less likely to have been diagnosed with high blood cholesterol than any other Region in the County.
Black residents of the Central Region had disproportionately high rates of CHD and stroke death and hospitalization compared to black residents of other Regions.
Central Region

3-4-50: Chronic Disease in San Diego County
22
Diabetes While diabetes death rates in the Central Region have remained relatively stable and were comparable to the County overall, diabetes hospitalization rates have increased since 2000 and were significantly higher than the County. The percent of Central Region residents ever diagnosed with diabetes was higher than in any other Region. The rate of emergency department (ED)
discharge for diabetes was higher in the Central Region than in any other Region, and 50% higher than in the County overall.
Diabetes hospitalization and ED discharge rates were disproportionately high for blacks living in the Central Region compared to blacks living in most other Regions.
Diabetes hospitalization and ED discharge rates were disproportionately high for adults ages 25-64 and 65+ in the Central Region compared to the same age groups in other Regions.
Pulmonary Disease Asthma and COPD death and hospitalization rates have decreased slightly since 2000. Central Region asthma hospitalization and ED discharge rates were highest in the County, as were COPD ED discharge rates. More than one out of ten Central Region adults had ever been diagnosed with asthma, two-thirds of whom currently had asthma at the time of survey. While it appears that Central Region residents were more likely than residents of other Regions to seek treatment at hospitals and emergency departments for their asthma, they were also more likely to have taken steps to control the disease. Three out of every four asthmatics took daily
medication to control their asthma; higher than any other Region in the County.
Four out of ten asthmatics had ever received an asthma management plan from a health professional, higher than any other Region in the County.
Asthma hospitalization rates were disproportionately high among children less than 15 years, adults over 65 years, and black residents when compared to other Regions. Blacks were discharged from the ED for asthma at an especially high rate compared to blacks in most other Regions.
Central Region

3-4-50: Chronic Disease in San Diego County
23
The South Region is an ethnically diverse, impoverished border Region in San Diego County with a large Hispanic presence, more than half of the population was Hispanic, and one-quarter was White. While middle- and upper-class communities exist within the Region, many communities are economically disadvantaged. Unhealthy behaviors and the resultant chronic disease rates for heart disease, pulmonary conditions, and diabetes are high in this Region, despite the generally younger age of the population.
South Region households earned lower incomes than San Diego County households overall; almost half earned incomes less than $45,000, which was less than 300% of the Federal Poverty level (FPL) for a family of four. While South Region residents were poorer than the County overall, they were more likely than other Regions to be enrolled in public programs to supplement their needs. However, public programs and facilities such as supplemental nutrition, WIC, and community clinics are present and utilized by eligible residents more often than in other Regions of the County.
Insurance coverage, access, and utilization of health services have been shown to directly impact a population’s general health status. South Region residents were comparable to the County overall in their level of insurance coverage and their access to and utilization of healthcare services, however they were more likely to use public services such as community clinics for a usual source of care than other Regions of the County. South Region adults reported worse general health status than adults living in other Regions of the County.
3-4-50 Risk Factors
The three behaviors that lead to the four major chronic diseases are tobacco use, poor diet, and physical inactivity. South Region adults were generally just as likely to engage in risky behaviors such as drinking and smoking, and were more likely to have poor nutrition than the County overall.
Two out of every five adults in the South Region have ever smoked, one-quarter of whom reported smoking every day in 2007.
Similar to the County overall, nearly four out of five South Region adults walked for transport, fun, or exercise.
South Region adults were less likely than any other Region to engage in moderate physical activity five or more days per week, and less likely than most other Regions to engage in vigorous physically activity at least three days per week.
South Region adults were less likely to have consumed 5 or more servings of fruits and vegetables daily than almost every other Region.
Nearly 60% of South Region adults were overweight or obese; higher than almost every other Region.
South Region adults were less likely to have drunk alcohol in the past month than adults in other Regions, and less likely to have binged during the past month or year than most other Regions.
3-4-50 Diseases
In the South Region, chronic disease death and medical encounter rates for coronary heart disease (CHD), stroke, diabetes, asthma, and chronic obstructive pulmonary disease (COPD) were higher than most other Regions in the County.
South Region

3-4-50: Chronic Disease in San Diego County
24
Cancer Overall cancer death rates in the South Region have decreased slightly since 2000, and were significantly lower than in the County overall. A lower percent of South Region adults were ever diagnosed with cancer than in most other Regions.
Overall cancer deaths were higher for white residents of the South Region compared to any racial/ethnic group in any other Region.
Three out of four women over 30 had their breasts examined for lumps by a doctor in the past year and three out of five had a mammogram.
Nine out of ten South Region women over 30 who have not had a hysterectomy have had a Pap Test in the past three years.
Adults over age 50 years were more likely to have ever had a sigmoidoscopy, colonoscopy, or fecal occult blood test (FOBT) than adults in most other Regions.
Males over age 40 in the South Region were more likely to have had a PSA screening in the previous year than males in other Regions; nearly two out of every five in 2007.
Coronary Heart Disease (CHD) and Stroke Diseases of the heart and cerebrovascular diseases (stroke) were the first and third leading causes of death in the South Region in 2007. CHD and stroke death and hospitalization rates have generally declined since 2000, but were higher than in most other Regions. Additionally, a higher percentage of adults living in the South Region were ever diagnosed with a disease of the heart than in most other Regions.
South Region adults were more likely than residents of other Regions to have ever been diagnosed with high blood pressure; they were also more likely to be currently taking medication to control their high blood pressure.
Among adults tested for cholesterol, one out of five South Region residents were diagnosed with high blood cholesterol.
Hispanic residents of the South Region had disproportionately high rates of CHD death, hospitalization, and emergency department (ED) discharge compared to Hispanic residents of other Regions. Rates of CHD death and medical encounter were also disproportionately high for Asian/Pacific Islanders compared to other Regions.
CHD hospitalization rates were statistically significantly higher for older adults ages 65+ years in the South Region compared to older adults in any other Region.
Stroke hospitalization rates among residents ages 25-64 and 65+ years were higher than among the same age groups living in most other Regions.
South Region
3-4-50: Chronic Disease in San Diego County
25
Diabetes Diabetes death and hospitalization rates in the South Region have increased since 2000, and were higher than in almost all other Regions. The percent of South Region residents ever diagnosed with diabetes was also higher than most other Regions. The rates of diabetes death, hospitalization
and ED discharge were disproportionately high among Hispanics in the South Region compared to Hispanics in other Regions.
Diabetes death, hospitalization, and ED discharge rates were also disproportionately high among older adults living in the South Region compared to older adults in other Regions.
One out of four South Region adult diabetics reported taking insulin for their diabetes in 2007.
Pulmonary Disease Asthma hospitalization and ED discharge rates among South Region residents have decreased slightly since 2000, but were among the highest in the County; COPD hospitalization and ED discharge rates were statistically significantly higher than the County overall. More than one out of eight South Region adults had ever been diagnosed with asthma, nearly three-quarters of whom reported being current asthmatics in 2007; higher than any other Region. Asthma and COPD hospitalization and ED
discharge rates were disproportionately high among Asian/Pacific Islanders (API) living in the South Region compared to APIs living in other Regions.
South Region children less than 15 years of age were more likely to have been discharged from the ED for asthma than children from most other Regions.
South Region

3-4-50: Chronic Disease in San Diego County
26
The East Region is a large, diverse, mostly low- and middle-class Region with a high proportion of older, white adult residents. Due to the rural nature of most of the Region, access to care is often difficult. Despite transportation barriers, East Region residents do participate in public programs as often as or more often than residents of many other Regions.
The East Region of the County had a larger proportion of older, white adults compared to other Regions of the County. Two-thirds of the entire population was white, and one in five was Hispanic. English was the primary language spoken, with only 3% speaking a language other than English exclusively. While household income levels were slightly lower than San Diego County overall, fewer East Region residents lived in poverty, indicating a higher percent of middle-class households. However, pockets of poverty existed throughout the diverse Region.
Insurance coverage, access, and utilization of health services have been shown to directly impact a population’s general health status. In the East Region these were comparable to the County overall, as was self-reported general health status. Nearly 85% of adults living in the East Region were currently insured, and 95% of those had prescription drug coverage.
Similar to the County, nearly nine out of ten East Region residents had a usual place to go when sick or needing health advice, regardless of insurance status. East Region residents were more likely to go to a doctor’s office and less likely to go to a community clinic, when compared to the County overall.
3-4-50 Risk Factors
East Region adults were generally more likely than adults from other Regions to engage in these risky behaviors.
Adults in the East Region were more likely to have ever smoked than any other Region, and more likely to be current smokers than most other Regions. East Region adults were also significantly more likely to smoke indoors.
Fewer East Region adults walked for transport, fun, or exercise, and more were physically inactive than in most other Regions, possibly due to the vast differences in geography and community design.
East Region residents had poorer nutrition than the rest of the County. Adults were less likely to consume 5 or more servings of fruits and vegetables daily or talk to their health provider about diet in the previous year than the rest of the County.
East Region adults were more likely to be obese or overweight than adults in other Regions in the County. More than three out of every five adults was overweight or obese.
East Region adults were less likely to have drank alcohol in the past month than other Regions, and also less likely to have engaged in binge drinking in the past month or year.
3-4-50 Diseases
In the East Region, death rates due to coronary heart disease (CHD), stroke, diabetes, chronic obstructive pulmonary disease (COPD), female breast cancer, colorectal cancer, and lung cancer were notably higher than in the rest of the County, likely due to the older age of the population. Additionally, East Region residents were hospitalized for these chronic diseases at higher rates than the rest of the County, also due in part to the rural nature of the Region, which results in less easily accessible preventive and follow-up care.
East Region

3-4-50: Chronic Disease in San Diego County
27
Cancer Overall cancer death rates in the East Region have remained steady since 2000, but were higher than any other Region, as expected due to the older age of the population. Ten percent of East Region adults have ever been diagnosed with cancer. Death rates were especially high among adults
ages 65+ years and older, compared to other Regions.
Nearly all women over 30 living in the East Region have ever had a Pap Test, but one out of ten have not had one in the past three years.
Women over 30 were more likely to have had a mammogram within the past two years than any other Region.
Males over age 40 in the East Region were less likely to have had a Prostate-Specific Antigen (PSA) screening the past year than males over 40 in most other Regions.
Nearly two-thirds of adults over age 50 years have complied with colorectal cancer screening recommendations.
Coronary Heart Disease (CHD) and Stroke While CHD and stroke death and hospitalization rates have declined since 2000, a higher percentage of adults living in the East Region were diagnosed with a disease of the heart or high blood pressure than any other Region of the County This is possibly due to the high proportion of older, white adults living in the East Region.
Of those with high blood pressure, two-thirds were taking blood pressure medication.
East Region residents were slightly more likely than the County overall to have had a blood cholesterol check in the past five years, more than one out of five of whom were diagnosed with high blood cholesterol.
Older adults ages 65+ years died, were hospitalized, or discharged from the emergency department (ED) for CHD at statistically significantly higher rates than older adults throughout the County.
East Region

3-4-50: Chronic Disease in San Diego County
28
Diabetes Since 2000, diabetes death and hospitalization rates in the East Region have increased. However, the percent of East Region adults who were ever diagnosed with diabetes was comparable to the County overall. Among East Region adults ever diagnosed
with diabetes, more than one out of three were taking insulin for their diabetes, significantly higher than the County overall.
Diabetes death and hospitalization rates were disproportionately high for adults ages 25-64 in the East Region compared to adults of the same age in other Regions.
Diabetes death rates were especially high for whites compared to whites in other Regions.
Black and Hispanic residents of the East Region were hospitalized and discharged from the ED for diabetes at noticeably high rates compared to blacks and Hispanics living in other Regions.
Pulmonary Disease Asthma and COPD death and medical encounter rates in the East Region have remained fairly steady since 2000, but were higher than almost every other Region. More adults in the East Region have ever been diagnosed or currently have asthma than almost all other Regions.
Nearly half of asthmatics took daily medication to control their asthma.
Less than one out of four asthmatics ever received an asthma management plan from a health professional.
Asthma hospitalization rates were disproportionately high among females, and residents ages 25-64, compared to the same groups in other Regions.
ED discharge for asthma was higher among blacks living in the East Region than for blacks in any other Region.
The COPD hospitalization rate for adults ages 25-64 in the East Region was nearly double the rate for the County overall.
East Region

3-4-50: Chronic Disease in San Diego County
29
The North Inland Region is the largest geographical Region in San Diego County, most of which covers rural and remote areas. The diverse geographical landscape impacts the health of the Region, with varying degrees of access to health services and information. The Region overall is wealthier than the County, and has lower levels of poverty, however, pockets of extreme economic disadvantage exist. While the majority of North Inland residents were White, more than one out of every four residents was Hispanic. Generally, North Inland Region residents were in good health; while chronic disease rates were lower than or comparable to the County overall, some unhealthy behaviors, such as physical inactivity, were higher than most other Regions in the County. Insurance coverage, access, and utilization of health services have been shown to directly impact health status. North Inland Region adults were comparable to San Diego County overall in these areas. Eighty-four percent of adults 18+ years were currently insured, 98% of whom were insured for all of the previous year. Of the North Inland Region adults ages 18-64 who were not insured (18%), 7% were eligible for Medi-Cal or Healthy Families. Nearly nine out of ten North Inland Region adults had a usual place to go when sick or needing health advice, and 84% visited a doctor during the past year.
3-4-50 Risk Factors
The three behaviors that lead to the four major chronic diseases are tobacco use, poor diet, and physical inactivity. North Inland Region adults were comparable to adults throughout the County in their level of engagement in both healthy and unhealthy behaviors.
Thirty-eight percent of North Inland Region adults have ever smoked cigarettes, one-quarter of whom smoked every day.
North Inland Region adults were less likely to smoke indoors than adults in the County overall.
More than three-quarters of North Inland Region adults walked for transport, fun, or exercise, similar to the County overall. However, a higher percent were physically inactive than in any other Region in the County.
Less than half of North Inland Region adults consumed 5 or more servings of fruits and vegetables daily.
More than half of all North Inland Region adults were obese or overweight, comparable to the County overall.
Two-thirds of adults drank alcohol in the past month. They were less likely to have binged in the past month or year than in the County overall.
3-4-50 Diseases
In the North Inland Region, chronic disease death and medical encounter rates for coronary heart disease (CHD), diabetes, and asthma were generally lower than in all of San Diego County. Stroke and chronic obstructive pulmonary disease (COPD) were comparable to the County overall.
North Inland Region

3-4-50: Chronic Disease in San Diego County
30
Cancer Cancer was the leading cause of death in the North Inland Region in 2007, the rate of which was higher than nearly every other Region, and significantly higher than the County overall. Similar to the County, one in ten adult residents of the Region was ever diagnosed with cancer. Overall cancer death rates were higher for
white residents of the North Inland Region compared to white residents of most other Regions.
As of 2007, women over 30 were more likely to have had their breasts examined for lumps by a doctor in the previous year and more likely to have ever had a Pap Test than women in most other Regions. More than two-thirds of women over 30 had a mammogram within the previous 2 years.
Three-quarters of adults over age 50 years have ever had a sigmoidoscopy, colonoscopy, or fecal occult blood test (FOBT), as reported in 2007.
A lower percent of males over age 40 in the North Inland Region had a prostate-specific antigen (PSA) screening during the previous year than in any other Region.
Coronary Heart Disease (CHD) and Stroke Diseases of the heart and cerebrovascular diseases (stroke) were the second and fourth leading cause of death in the North Inland Region in 2007. CHD and stroke death and hospitalization rates have declined since 2000, as seen throughout the County. Nearly seven percent of adults living in the North Inland Region were ever diagnosed with a disease of the heart. North Inland Region adults were less likely
than adults in any other Region to have ever been diagnosed with high blood pressure. Two out of every three adults with high blood pressure were currently taking medication to control their blood pressure.
More than six out of ten North Inland Region adults were tested for high blood cholesterol during the previous year. Of those tested in the past five years, 19% were diagnosed with high blood cholesterol, lower than the County overall.
The rate of stroke death among whites living in the North Inland Region was higher than among whites living in any other Region, and disproportionately high compared to other racial/ethnic groups in the North Inland Region.
North Inland Region
3-4-50: Chronic Disease in San Diego County
31
Diabetes Diabetes death and hospitalization rates in the North Inland Region have remained relatively stable since 2000. Diabetes medical encounter rates were statistically significantly lower than the County overall. The percent of North Inland Region residents ever diagnosed with diabetes (6%) was comparable to the County overall. Diabetes hospitalization and ED discharge rates were disproportionately high for blacks living in the North Inland Region compared to other racial/ethnic groups in the Region.
Pulmonary Disease Asthma and COPD death and hospitalization rates have fluctuated since 2000, but appear to be decreasing overall. North Inland Region asthma hospitalization and ED discharge rates were among the lowest in the County, and the COPD hospitalization rate was comparable to the County overall. The proportion of North Inland Region adults who were ever diagnosed with asthma was higher than in any other Region. However, only 50% of those who were ever diagnosed with asthma were current asthmatics at the time of the survey. Among current asthmatics, 95% had asthma
symptoms during the previous year. However, one out of three current asthmatics took daily medication to control their asthma; lower than any other Region.
One-third of current asthmatics had ever received an asthma management plan from a health professional.
Black residents of the North Inland Region had higher rates of asthma hospitalization and ED discharge than other racial/ethnic groups in the Region.
North Inland Region

3-4-50: Chronic Disease in San Diego County
32
Changing the habits of a lifetime is not easy, how-ever, medical evidence has shown that changing 3 behaviors can prevent or delay the onset of 4 chronic diseases that account for more than 50% of deaths.
The three behaviors that lead to the four major chronic diseases are poor diet, physical inactivity and tobacco use. In 2007:
More than half of all San Diego County adults were overweight or obese.
Less than half of all adults consume 5 or more servings of fruits and vegetables daily.
More than one out of seven San Diego County adults were physically inactive.
14 percent of San Diego County adults were current smokers.
These behaviors contribute to four major chronic diseases – cancer, heart disease, type 2 diabetes, and pulmonary disease – which are responsible for 57% of deaths in San Diego County in 2007. In San Diego by 2020, the number of deaths from cancer, heart disease and stroke, type 2 diabetes
Conclusions
and pulmonary disease is projected to increase by 36%. This is almost triple the rate of the population growth and an alarming wake up call to all San Diegans. In adopting the Building Better Health strategy, the County of San Diego has embarked on a ten year commitment to improve the health of San Diegans. While behavior change is a personal decision, the County can create an environment that fosters better dietary choices, accessible op-portunities to incorporate physical activity into daily life, and discourages tobacco and other sub-stance use and abuse. Everyone has a part to play in Building Better Health. Eat a healthy diet Get physically active Don’t smoke Three behaviors that will help all San Diegans live longer, healthier lives.

3-4-50: Chronic Disease in San Diego County
33
1 World Health Organization (WHO). “The Global Strategy on Diet, Physical Activity and Health.” http://www.who.int/dietphysicalactivity/media/en/gsfs_general.pdf (Accessed September 29, 2010).
2 3Four50, www.3four50.com (Accessed July 2, 2010).
3 County of San Diego, Health and Human Services Agency, Public Health Services, Community Health Statistics Unit, “Economic Burden of Chronic Disease” (September 2010).
4 Centers for Disease Control and Prevention, “Cancer ‐ A to Z.” http://www.cdc.gov/cancer/az/ (Accessed March 7, 2009).
5 U.S. Department of Health and Human Services, “Cancer” in Healthy People 2010. 2nd ed. With Understanding and Improving Health and Objectives for Improving Health. 2 vols. (Washington, DC: U.S. Government Printing Office. November 2000), http://www.healthypeople.gov/Document/HTML/Volume1/03Cancer.htm (Accessed March 7, 2009).
6 National Cancer Institute, “What is Cancer?” (November 2008), http://www.cancer.gov/cancertopics/what‐is‐cancer (Accessed March 7, 2009).
7 California Cancer Registry (CCR), http://www.ccrcal.org/ (Accessed August 1, 2010).
8 National Cancer Institute, Surveillance Epidemiology and End Results, “SEER Stat Fact Sheets—Cancer, All Sites”, http://seer.cancer.gov/statfacts/html/all.html (Accessed March 7, 2009).
9 Centers for Disease Control and Prevention, Division for Heart Disease and Stroke Prevention (DHDSP), “Health Topics,” (October 2008), http://www.cdc.gov/DHDSP/ (Accessed April 1, 2009).
10 Centers for Disease Control and Prevention, Division for Heart Disease and Stroke Prevention (DHDSP), “Heart Disease Facts and Statistics,” (February 2009), http://www.cdc.gov/heartdisease/statistics.htm, (Accessed April 1, 2009).
11 U.S. Department of Health and Human Services. “Heart Disease and Stroke” in Healthy People 2010. 2nd ed. With Understanding and Improving Health and Objectives for Improving Health. 2 vols. (Washington, DC: U.S. Government Printing Office. November 2000), http://www.healthypeople.gov/Document/HTML/Volume1/12Heart.htm, (Accessed April 1,2009).
12 Mayo Clinic, “Heart Disease: Definition,” http://www.mayoclinic.com/health/heart-disease/DS01120, (Accessed August 6, 2010).
13 Centers for Disease Control and Prevention, Division for Heart Disease and Stroke Prevention (DHDSP), “Stroke Facts and Statistics,” (February 2009), http://www.cdc.gov/Stroke/stroke_facts.htm, (Accessed April 1, 2009).
14 American Stroke Association, “What is Stroke?” http://www.strokeassociation.org/presenter.jhtml?identifier=3030066 (Accessed August 6, 2010).
15 UCLA Center for Health Policy Research, California Health Interview Survey, “AskCHIS,” http://www.chis.ucla.edu/main/ (Accessed July 14, 2010).
16 American Heart Association, “High Blood Pressure Statistics,” http://www.americanheart.org/presenter.jhtml?identifier=4621 (Accessed July 19, 2010).
17 National Heart Lung and Blood Institute, National Institutes of Health, “What is High Blood Pressure?” http://www.nhlbi.nih.gov/health/dci/Diseases/Hbp/HBP_WhatIs.html (Accessed April 2, 2009).
18 San Diego Association of Governments, 2007 population estimates (October 2009).
19 American Heart Association, “High Blood Pressure,” http://www.americanheart.org/presenter.jhtml?identifier=2114 (Accessed April 2, 2009).
20 The Milken Institute, “An Unhealthy America: The Economic Burden of Chronic Disease.” (October 2007), http:// www.milkeninstitute.org/publications/ (Accessed May 15, 2010).
21 U.S. Department of Health and Human Services. “Respiratory Diseases”, in Healthy People 2010: Understanding and Improving Health. 2nd ed. Washington, DC: U.S. Government Printing Office, November 2000. http://www.healthypeople.gov/Document/HTML/Volume2/24Respiratory.htm (Accessed April 16, 2009).
References

County of San Diego Health and Human Services Agency
Board of SupervisorsGreg Cox, District One
Dianne Jacob, District TwoPam Slater-Price, District Three
Ron Roberts, District FourBill Horn, District Five
Chief Administrative Officer Walter F. Ekard
Health and Human Services Agency Director
Nick Macchione, FACHE
Public Health ServicesPublic Health Officer
Wilma J. Wooten, MD, MPH