Embed Size (px)
Citation preview

© NovaCast Foundry Solutions AB 2010
This paper will handle the process of simulating different kinds of filters for filtering various metallic
materials such as cast irons and steels. These filters can be grouped as follows:
1. Extruded filters with rectangular holes.
2. Extruded filters with round holes.
3. Foam filters in different types of ceramic materials.
4. Combination of extruded and foam filters in one product.
5. Woven filters SiO2 filter, known as FIRAM™ filter technology.
The following effects can be tested with simulation:
Pressure drop
Flow through filter – Velocity
Temperature drop through the filter
Feeding possibility through the filter
Filter area efficiency – How much of the filter area is used during filling.
A simple geometry can be used to illustrate the superiority of FVM compared to FDM. The circle
below has a diameter of 60 mm and is meshed in 2D by 10 mm cells. According to figure 3 FDM is
unable to accurately describe the circle, or any curved geometry. The cubical shape of FDM cells
always results in an approximation of the geometry. In order to increase accuracy the cell size needs
to be reduced, resulting in increased number of total cells. In figure 4 the cell size has been
decreased to 3.6 mm, but the shape is still not accurate. However, the number of cells has almost
increased by a factor of 10, but in 3D the increase would be even larger!

© NovaCast Foundry Solutions AB 2010
FVM, or as we call it CVM technology, utilizes the same fluid dynamics and heat transfer theories as
FDM, with better or equal accuracy.
Advantages of CVM technology compared to FDM
Using fewer cells with CVM greatly decreases simulation time, often more than 10 times
Less than one cell can be used in the casting thickness, which enables simulation of virtually
any shape, for example large thin-walled castings
Higher accuracy compared to FDM due to a correct geometrical description of the casting
The considerably smaller file-size makes it possible to transfer complete simulation results
on-line for support or consultancy issues
Correct thermal gradient with only a few cells
Simulation of filters presents certain difficulties. As always, the lack of really good material and
process data tends to cause higher uncertainty in the calculation. Traditionally, filter calculations
have more or less been based on formulas and some empirical data that describes the pressure drop.
Calculating temperature drop and feeding has not been possible and therefore the use of filtering in
simulations has been limited. NovaFlow & Solid CV can simulate the work of extruded filters using
“real” 3D filters with correct dimensions and inner holes, in fact also Foam filters would be possible if
complex inner shapes could be modeled. For foam filters we use a type of combined shape and
formula function for pressure drop and temperature drop. Various examples are given further on in
this paper. So-called woven filters can be simulated either as “real” geometry filters or by using
formula for pressure drop.
Extruded filters can be simulated with “real” geometry, which means modeling the filter boundaries
and then modeling the holes that go straight through the filter. In this way no data need be
developed in order to describe the pressure drop. Instead this comes naturally due to friction and
geometry when the melt flows through the filter. Simulations like this are possible solely in Control
Volume technology. With FDM the simulation would be more or less impossible. Pressure drop,
temperature drop and feeding through the filter are simulated accurately.

© NovaCast Foundry Solutions AB 2010
Picture 2: Velocity viewing showing pressure drop through a “real” extruded filter.
Picture 3: Temperature viewing showing temperature drop through a “real” extruded filter.

© NovaCast Foundry Solutions AB 2010
Picture 4: It is quite interesting to study how much of the filter area will be used initially and during the filling
and here you can zoom in and watch it.

© NovaCast Foundry Solutions AB 2010
Two different ways can be used to simulate foam filters in NovaFlow & Solid CV:
1. Measure real filters: Average pore diameter and using the PPI number, which means Pores
per linear inch. However instead we use pores per quadratic centimeter. If foam filters are
used, the following filter pressure drop factors should be used: 10 PPI = 16 pores /cm2
(Average pore diameter ~ 2.0 mm); 20 PPI = 64 pores/cm2 (Average pore diameter ~ 1.05
mm); 30 PPI = 144 pores/cm2 (Average pore diameter ~ 0.7 mm).
2. Darcian and non-Darcian Permeability Coefficients for Iron Filters. These factors have been
developed by Foseco and presented in the paper titled “Pressure drop characteristics of iron
filters”. The two different factors K1 and K2 can be seen in the table below taken from this
document. These factors are probably most representative for Foseco filters since the so
called PPI number differs from supplier to supplier. We have correlated their results against
our simulation system.

© NovaCast Foundry Solutions AB 2010
Picture 5: Temperature viewing showing temperature drop through a foam filter using method 1 (measured data).
Picture 6: Velocity viewing showing pressure drop through a foam filter using method 1 (measured data).

© NovaCast Foundry Solutions AB 2010
Picture 7: Shrinkage viewing showing that feeding is proceeding longer in the 10 PPI filter than the others and
therefore the pipe is deeper and the shrinkage below the filter is smaller.
Picture 8: Velocity viewing showing pressure drop through a foam filter using method 1 (measured data). Here
in section mode and then the flow inside the filter (by velocity vectors), which is not visible in 3D.
© NovaCast Foundry Solutions AB 2010
Woven filers can also be simulated and this is done by making the filter as a very thin solid object of
say 2 – 3 mm thickness. Then the measured variant for Extruded filters can be used since it is in fact
like a thin extruded filter. The number of holes per cm2 can be counted, then measure the diameter
of the pores and use the filter in NovaFlow & Solid CV. Firam filter is available with pore diameters of
either 1.5 or 2.0 mm.
Picture 9: Velocity viewing showing pressure drop through a Firam filter using method 1 (measured data).
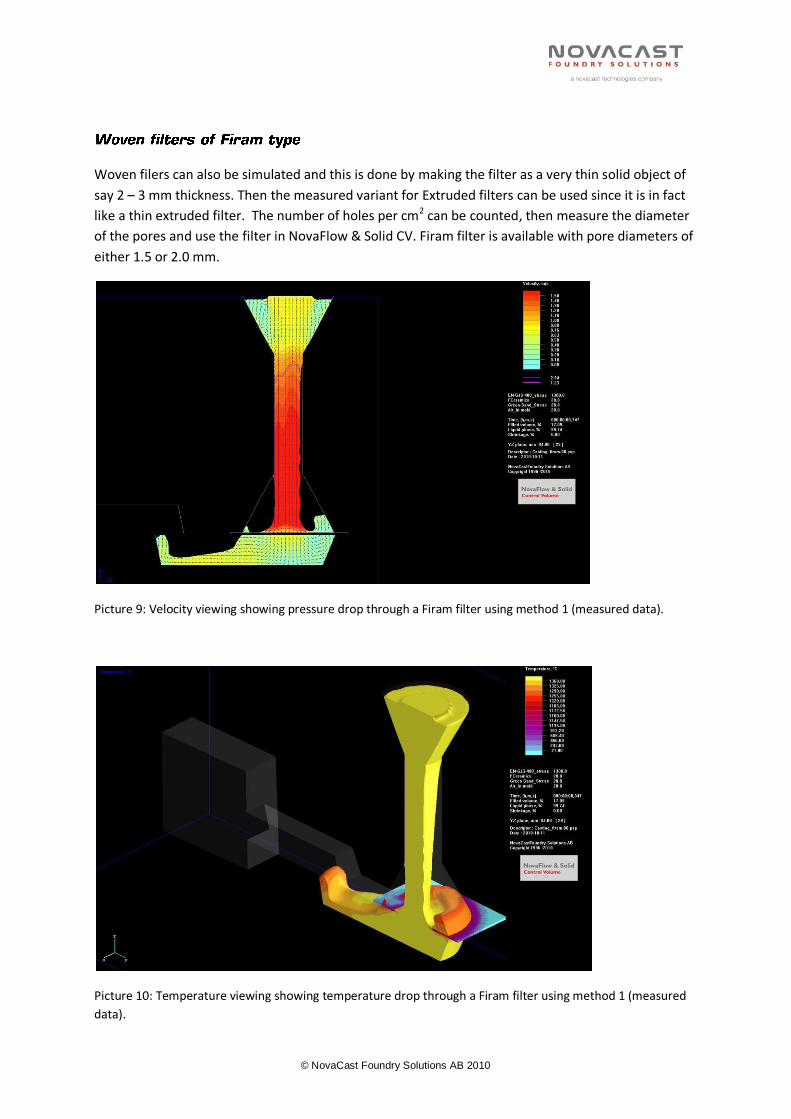
Picture 10: Temperature viewing showing temperature drop through a Firam filter using method 1 (measured
data).

© NovaCast Foundry Solutions AB 2010
When using real extruded filter, material data is of less concern and testing against real cases is not
as urgent as for foam filters. Regarding foam filters, the results for new types of filters must be
verified due to large differences between filters with a certain PPI and other filters with the same PPI
if they come from different suppliers. Regarding Foseco filters, the experimental data in the table
above can be used and then the second variant of method using K1 and K2 factors using Darcian and
non-Darcian Permeability Coefficients for Iron Filters. Because the geometry description in the
control volume method is different from that used by FDM, much less elements can be used with
Control Volume method, which shortens the simulation time by 5 – 10 times. In the future we will
also have the possibility to simulate Foam filters as “real” filters. The problem currently lies in
modeling the Foam filter. I believe that the next step is to make a simplified representation of the
filter and then in the not so distant future to be able to describe it more accurately, for example by
3D scanning.
Håkan Fransson
Product manager NovaFlow & Solid CV
NovaCast Foundry Solutions AB
Date: 2010-10-12