Embed Size (px)
Citation preview

3- 1Copyright © 2017 McGraw-Hill Education. All rights reserved. No reproduction or distribution without the prior written consent of McGraw-Hill Education.

3- 2Copyright © 2017 McGraw-Hill Education. All rights reserved. No reproduction or distribution without the prior written consent of McGraw-Hill Education.
Marshall,McManus,andViele11thEdition
AccountingWhattheNumbersMean
CHAPTER3:FundamentalInterpretationsMadefromFinancialStatementData

3- 3Copyright © 2017 McGraw-Hill Education. All rights reserved. No reproduction or distribution without the prior written consent of McGraw-Hill Education.
After studying this chapter you should understand and be able to:LO 3-1: Discuss why financial statement ratios are important.
LO 3-2: Explain the importance and show the calculation of return on investment.
LO 3-3: Illustrate how to calculate and interpret margin and turnover using the DuPont model.
LO 3-4: Explain the importance and show the calculation of return on equity.
LO 3-5: Explain the meaning of liquidity and discuss why it is important.
LO 3-6: Discuss the significance and calculation of working capital, the current ratio, and the acid-test ratio.
LO 3-7: Generalize about how trend analysis can be used most effectively.
LearningObjectives

3- 4Copyright © 2017 McGraw-Hill Education. All rights reserved. No reproduction or distribution without the prior written consent of McGraw-Hill Education.
FinancialRatiosandTrendAnalysis
A ratio is simply the relationship between
two numbers. The large dollar amounts reported on the financial
statements of many companies, and the
varying size of companies, make ratio
analysis the only sensible method of evaluating
various financial characteristics.
Learning Objective 3-1: Discuss why financial statement ratios are important.

3- 5Copyright © 2017 McGraw-Hill Education. All rights reserved. No reproduction or distribution without the prior written consent of McGraw-Hill Education.
TrendAnalysisTrend analysis compares a single
observation over several years.
Trend analysis example: Suppose a student’s grade point average for last semester was 3.5 on a 4.0 scale. That GPA may be interesting, but it says little about the student’s work. However, suppose you learn that this student’s GPA was 1.9 four semesters ago, 2.7 three semesters ago, and 3.0 two semesters ago. The upward trend of grades suggests that the student is working “smarter and harder.”
Learning Objective 3-1: Discuss why financial statement ratios are important.

3- 6Copyright © 2017 McGraw-Hill Education. All rights reserved. No reproduction or distribution without the prior written consent of McGraw-Hill Education.
RateofReturn
This ratio provides the return on a given investment alternative. All other things being equal, the higher the rate of return, the more
profitable the alternative.
Rate of return
Amount of return Amount of investment=
The rate of return calculation is derived from the interest calculation.
Interest = Principal × Rate × Time
Higher rates of return are associated with greater risk!
Learning Objective 3-2: Explain the importance and show the calculation of return on investment

3- 7Copyright © 2017 McGraw-Hill Education. All rights reserved. No reproduction or distribution without the prior written consent of McGraw-Hill Education.
ReturnonInvestment(R.O.I.)
This ratio describes the rate of return management was able to earn on the assets
that it had available during the year.
Return on investment
Net income Average total assets=
An informed judgment about the firm’s profitability requires relating net income to
the assets used to generate that net income.
Learning Objective 3-2: Explain the importance and show the calculation of return on investment

3- 8Copyright © 2017 McGraw-Hill Education. All rights reserved. No reproduction or distribution without the prior written consent of McGraw-Hill Education.
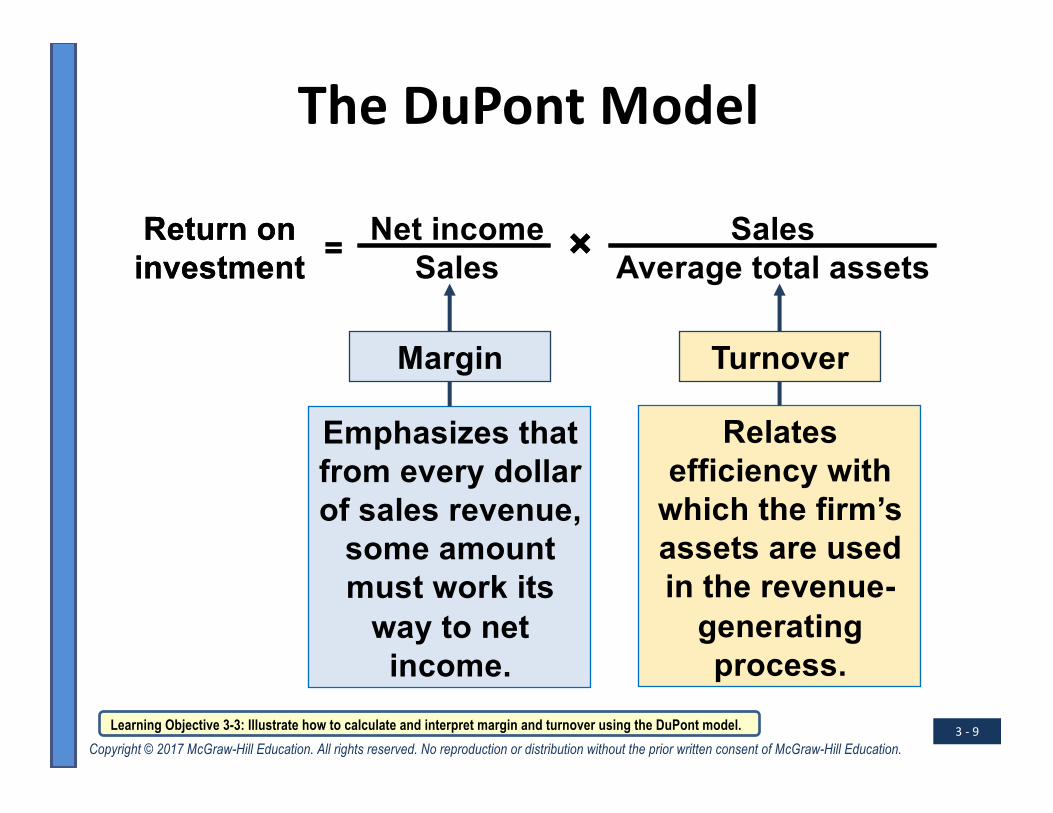
TheDuPontModel
The DuPont model is an expansion of the basic ROI calculation.
The developers of the model reasoned that profitability from sales and utilization of
assets to generate sales revenue were both important factors to be considered when
evaluating profitability.
Return on investment
Net income Sales= Sales
Average total assets×
Margin Turnover
Return on investment = ×
Learning Objective 3-3: Illustrate how to calculate and interpret margin and turnover using the DuPont model.
3- 9Copyright © 2017 McGraw-Hill Education. All rights reserved. No reproduction or distribution without the prior written consent of McGraw-Hill Education.
TheDuPontModel
Emphasizes that from every dollar of sales revenue,
some amount must work its
way to net income.
Relates efficiency with
which the firm’s assets are used in the revenue-
generating process.
Return on investment
Net income Sales= Sales
Average total assets×
Margin Turnover
Return on investment = ×
Learning Objective 3-3: Illustrate how to calculate and interpret margin and turnover using the DuPont model.

3- 10Copyright © 2017 McGraw-Hill Education. All rights reserved. No reproduction or distribution without the prior written consent of McGraw-Hill Education.
TheDuPontModel
A rule of thumb useful for putting ROI in perspective is that average ROI, based on
net income, for most American merchandising and manufacturing
companies is between 8% and 12%.
Return on investment
Net income Sales= Sales
Average total assets×
Margin Turnover
Return on investment = ×
Learning Objective 3-3: Illustrate how to calculate and interpret margin and turnover using the DuPont model.

3- 11Copyright © 2017 McGraw-Hill Education. All rights reserved. No reproduction or distribution without the prior written consent of McGraw-Hill Education.
ReturnonEquity(ROE)
Owners are interested in expressing the profits of the firm as a rate of return on the
amount of stockholders' equity.
Return on equity
Net income Average stockholders' equity=
As a rule of thumb, average ROE for most American merchandising and
manufacturing companies has historically ranged from 10% to 15%.
Learning Objective 3-4: Explain the significance and calculation of return on equity.
3- 12Copyright © 2017 McGraw-Hill Education. All rights reserved. No reproduction or distribution without the prior written consent of McGraw-Hill Education.
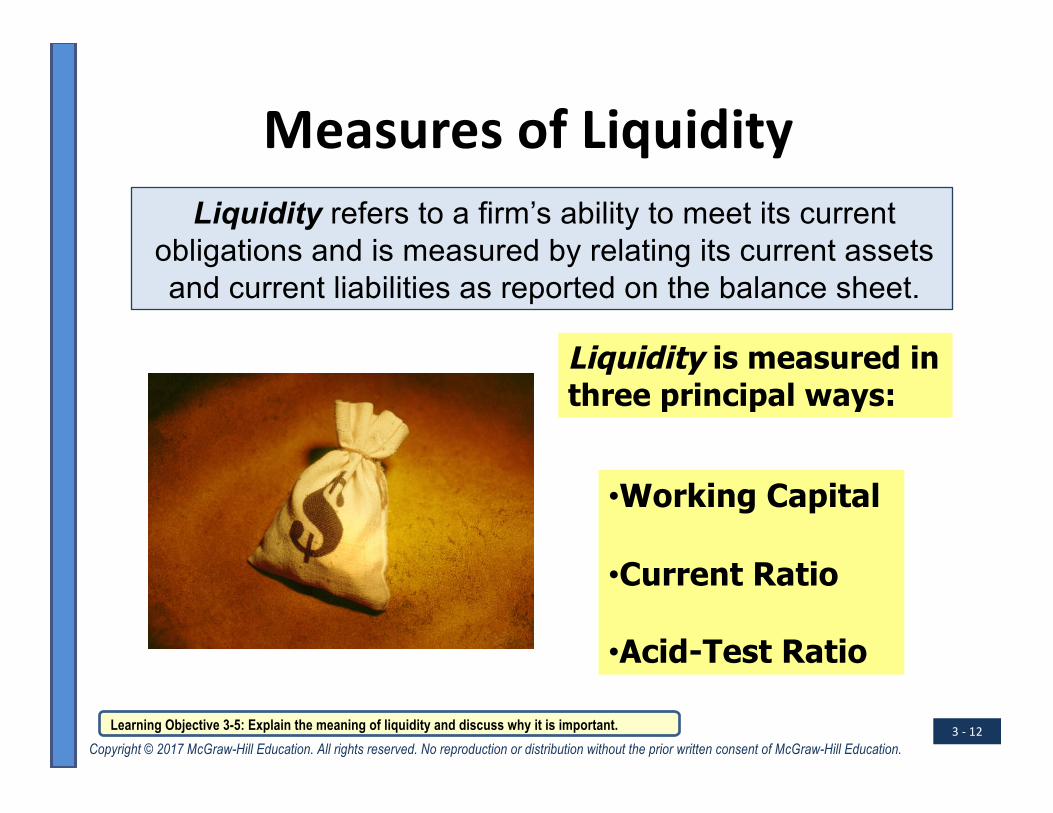
MeasuresofLiquidityLiquidity refers to a firm’s ability to meet its current
obligations and is measured by relating its current assets and current liabilities as reported on the balance sheet.
•Working Capital
•Current Ratio
•Acid-Test Ratio
Liquidity is measured in three principal ways:
Learning Objective 3-5: Explain the meaning of liquidity and discuss why it is important.

3- 13Copyright © 2017 McGraw-Hill Education. All rights reserved. No reproduction or distribution without the prior written consent of McGraw-Hill Education.
WorkingCapital
Current assets
- Current liabilities
Working capital
Working capital is the excess of a firm’s current assets over its current liabilities.
Learning Objective 3-6: Discuss the significance and calculation of working capital, the current ratio, and the acid-test ratio.

3- 14Copyright © 2017 McGraw-Hill Education. All rights reserved. No reproduction or distribution without the prior written consent of McGraw-Hill Education.
CurrentRatio
This ratio measures the abilityof the company to pay current
debts as they become due.
Currentratio
Current assets Current liabilities=
As a rule of thumb, a current ratio of2.0 is considered indicative of
adequate liquidity.
Learning Objective 3-6: Discuss the significance and calculation of working capital, the current ratio, and the acid-test ratio.
3- 15Copyright © 2017 McGraw-Hill Education. All rights reserved. No reproduction or distribution without the prior written consent of McGraw-Hill Education.
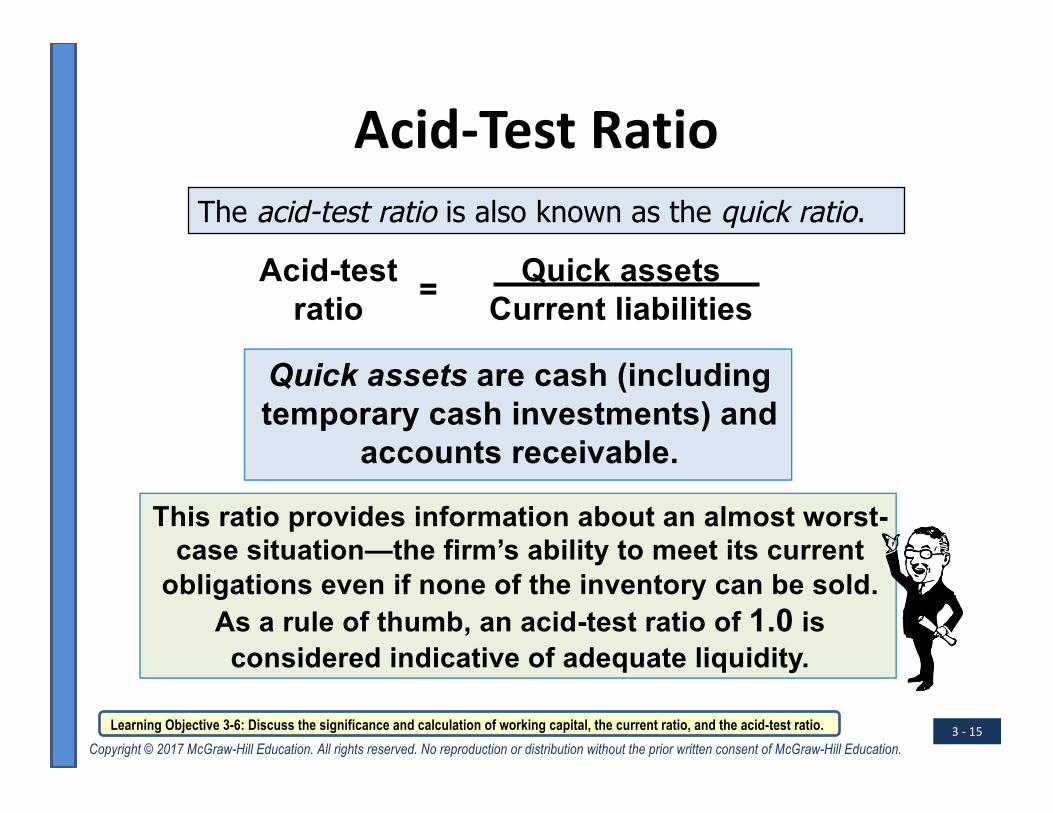
Acid-TestRatio
Quick assets Current liabilities=Acid-test
ratio
Quick assets are cash (including temporary cash investments) and
accounts receivable.
This ratio provides information about an almost worst-case situation—the firm’s ability to meet its current
obligations even if none of the inventory can be sold. As a rule of thumb, an acid-test ratio of 1.0 is
considered indicative of adequate liquidity.
The acid-test ratio is also known as the quick ratio.
Learning Objective 3-6: Discuss the significance and calculation of working capital, the current ratio, and the acid-test ratio.

3- 16Copyright © 2017 McGraw-Hill Education. All rights reserved. No reproduction or distribution without the prior written consent of McGraw-Hill Education.
TrendAnalysis
Remember our student’s grades example at the beginning of this presentation?
A trend analysis is an evaluation of selected data over time.
TABLE3.1 CAMPBELLSOUPCOMPANY(PROFITABILITY*ANDLIQUIDITYDATA,† 2010–2014)2014 2013 2012 2011 2010
Margin (net earnings‡/net sales) 9.9 5.7 10.8 11.3 11.9
Turnover (net sales/average total assets) 1.01 1.08 1.07 1.09 1.15
ROI (net earnings/average total assets) 10.0 6.2 11.6 12.3 13.7
ROE (net earnings/average total equity) 58.2 43.5 77.6 79.5 101.7Year-end position (in millions):Current assets $2,100 $2,221 $1,771 $1,963 $1,687Current liabilities 2,989 3,282 2,070 1,989 2,065Working capital (889) (1,061) (299) (26) (378)Current ratio 0.70 0.68 0.86 0.99 0.82
This table illustrates the trend analysis of return on investment, return on equity, and working capital for Campbell Soup over a five-year period.
Learning Objective 3-7: Generalize about how trend analysis can be used most effectively.

3- 17Copyright © 2017 McGraw-Hill Education. All rights reserved. No reproduction or distribution without the prior written consent of McGraw-Hill Education.
TrendAnalysisWe can also use the trend analysis
to construct graphs so we can see trends over
time.
Learning Objective 3-7: Generalize about how trend analysis can be used most effectively.

3- 18Copyright © 2017 McGraw-Hill Education. All rights reserved. No reproduction or distribution without the prior written consent of McGraw-Hill Education.
EndofChapter3