Embed Size (px)
Citation preview
2Q19
Earnings Release
Financial diligence in the face of an adverse scenario
São Paulo, August 8, 2019. Suzano S.A. (B3:SUZB3 | NYSE: SUZ), one of the world’s largest pulp and integrated paper producers, today announces its consolidated results for the second quarter of 2019 (2Q19). Comparison data with 2018 (2Q18, 6M18 and LTM4) represent the simple sum or weighted average of Suzano + Fibria.
HIGHLIGHTS
Pulp sales of 2,214 thousand tons, up 28% from 1Q19.
Paper sales of 301 thousand tons, up 10% from 1Q19.
Adjusted EBITDA¹ and Operating Cash Generation²: R$3.1 billion and R$2.2 billion, respectively.
Adjusted EBITDA¹/ton of pulp of R$1,305/ton (-12% vs. 1Q19).
Adjusted EBITDA/ton of paper of R$1,219/ton (+15% vs. 1Q19).
Average net price of paper of R$4,030/ton (+1% vs. 1Q19).
Pulp cash cost of R$ 733/ton, or R$ 697/ton ex-downtimes.
Reduction in estimated Capex for 2019 from R$ 6.4 billion to R$ 5.9 billion.
Capture of synergies in line with the target for 2019 (40% in Dec. 19).
Deliberation and payment of minimum mandatory dividends in the amount of R$ 600 million.
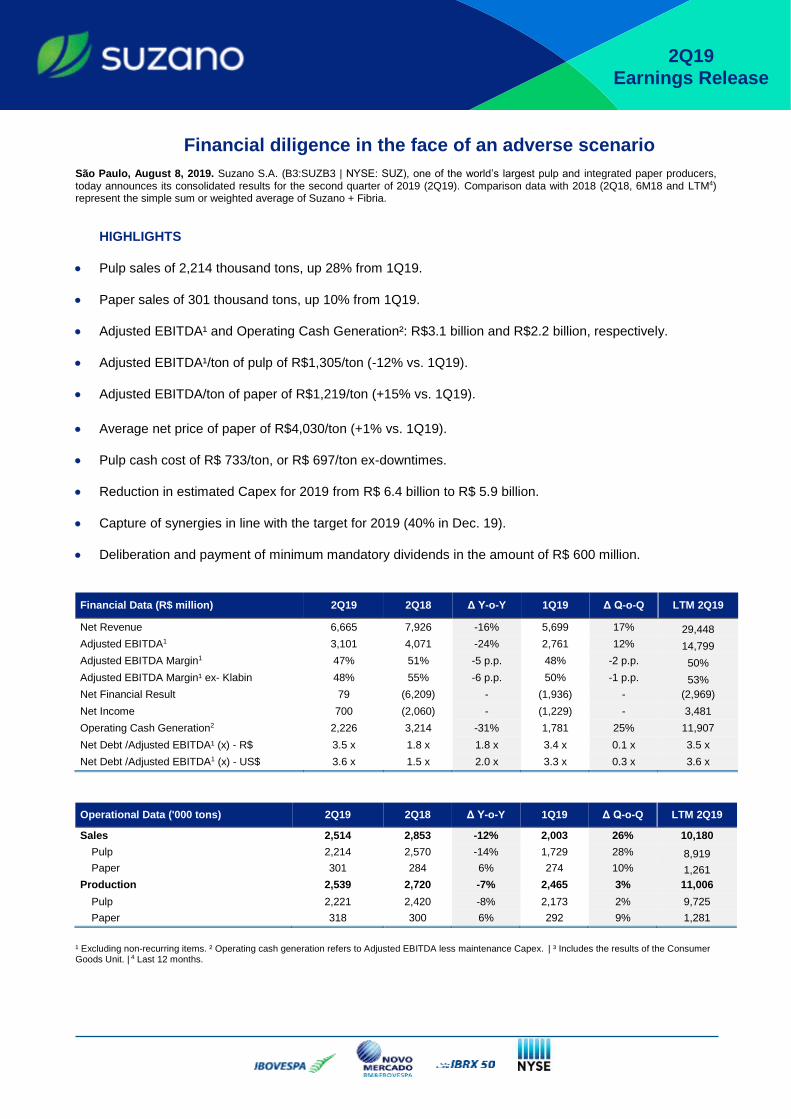
Financial Data (R$ million) 2Q19 2Q18 Δ Y-o-Y 1Q19 Δ Q-o-Q LTM 2Q19
Net Revenue 6,665 7,926 -16% 5,699 17% 29,448
Adjusted EBITDA1 3,101 4,071 -24% 2,761 12% 14,799
Adjusted EBITDA Margin1 47% 51% -5 p.p. 48% -2 p.p. 50%
Adjusted EBITDA Margin¹ ex- Klabin 48% 55% -6 p.p. 50% -1 p.p. 53%
Net Financial Result 79 (6,209) - (1,936) - (2,969)
Net Income 700 (2,060) - (1,229) - 3,481
Operating Cash Generation2 2,226 3,214 -31% 1,781 25% 11,907
Net Debt /Adjusted EBITDA¹ (x) - R$ 3.5 x 1.8 x 1.8 x 3.4 x 0.1 x 3.5 x
Net Debt /Adjusted EBITDA1 (x) - US$ 3.6 x 1.5 x 2.0 x 3.3 x 0.3 x 3.6 x
Operational Data ('000 tons) 2Q19 2Q18 Δ Y-o-Y 1Q19 Δ Q-o-Q LTM 2Q19
Sales 2,514 2,853 -12% 2,003 26% 10,180
Pulp 2,214 2,570 -14% 1,729 28% 8,919
Paper 301 284 6% 274 10% 1,261
Production 2,539 2,720 -7% 2,465 3% 11,006
Pulp 2,221 2,420 -8% 2,173 2% 9,725
Paper 318 300 6% 292 9% 1,281
¹ Excluding non-recurring items. ² Operating cash generation refers to Adjusted EBITDA less maintenance Capex. | ³ Includes the results of the Consumer Goods Unit. | 4 Last 12 months.
Page 2 of 33
2Q19 EARNINGS RELEASE
The consolidated quarterly information has been prepared in accordance with the Securities and Exchange Commission (CVM) and Accounting Standards Committee (CPC) standards and is in compliance with International Accounting Standard (IFRS) issued by the International Accounting Standard Board (IASB). The data contained in this document was obtained from the financial information as made available to the CVM. The operating and financial information is presented based on consolidated numbers in Reais (R$). Summaries may diverge due to rounding. Non-financial data, such as volume, quantity, average price, average price, in Reais and Dollars, were not reviewed by independent auditors.
CONTENTS
PULP BUSINESS PERFORMANCE ................................................................................................................ 3 PULP SALES VOLUME AND REVENUE ............................................................................................... 3 PULP CASH COST ................................................................................................................................. 4 PULP SEGMENT EBITDA ...................................................................................................................... 5 OPERATING CASH FLOW FROM THE PULP SEGMENT .................................................................... 6
PAPER BUSINESS PERFORMANCE .............................................................................................................. 6 PAPER SALES VOLUME AND REVENUE ............................................................................................ 6 OPERATING CASH FLOW FROM PAPER ............................................................................................ 8
ECONOMIC AND FINANCIAL PERFORMANCE ............................................................................................ 9 NET REVENUE ....................................................................................................................................... 9 PRODUCTION ........................................................................................................................................ 9 COST OF GOODS SOLD ..................................................................................................................... 10 OPERATING EXPENSES ..................................................................................................................... 11 ADJUSTED EBITDA.............................................................................................................................. 13 FINANCIAL INCOME AND EXPENSES ............................................................................................... 14 DERIVATIVES OPERATIONS .............................................................................................................. 15 DEBT ..................................................................................................................................................... 17 CAPITAL INVESTMENTS ..................................................................................................................... 19 OPERATING CASH FLOW GENERATION .......................................................................................... 19 IFRS 16 ................................................................................................................................................. 20 SYNERGIES .......................................................................................................................................... 20 DIVIDENDS ........................................................................................................................................... 20
CAPITAL MARKETS ...................................................................................................................................... 21 FIXED INCOME ............................................................................................................................................... 22 RATING ........................................................................................................................................................... 22 UPCOMING EVENTS ...................................................................................................................................... 23 IR CONTACTS ................................................................................................................................................ 23 APPENDICES ................................................................................................................................................. 24
APPENDIX 1² – Operating Data ............................................................................................................ 24 APPENDIX 2² – Consolidated Statement of Income ............................................................................. 26 APPENDIX 3¹ – Consolidated Balance Sheet ...................................................................................... 27 APPENDIX 4¹ – Consolidated Statement of Cash Flow ....................................................................... 28 APPENDIX 5² – EBITDA ....................................................................................................................... 30 APPENDIX 6² – Segmented Income Statement .................................................................................................... 31
Forward-Looking Statements ....................................................................................................................... 33
Page 3 of 33
2Q19 EARNINGS RELEASE
PULP BUSINESS PERFORMANCE PULP SALES VOLUME AND REVENUE
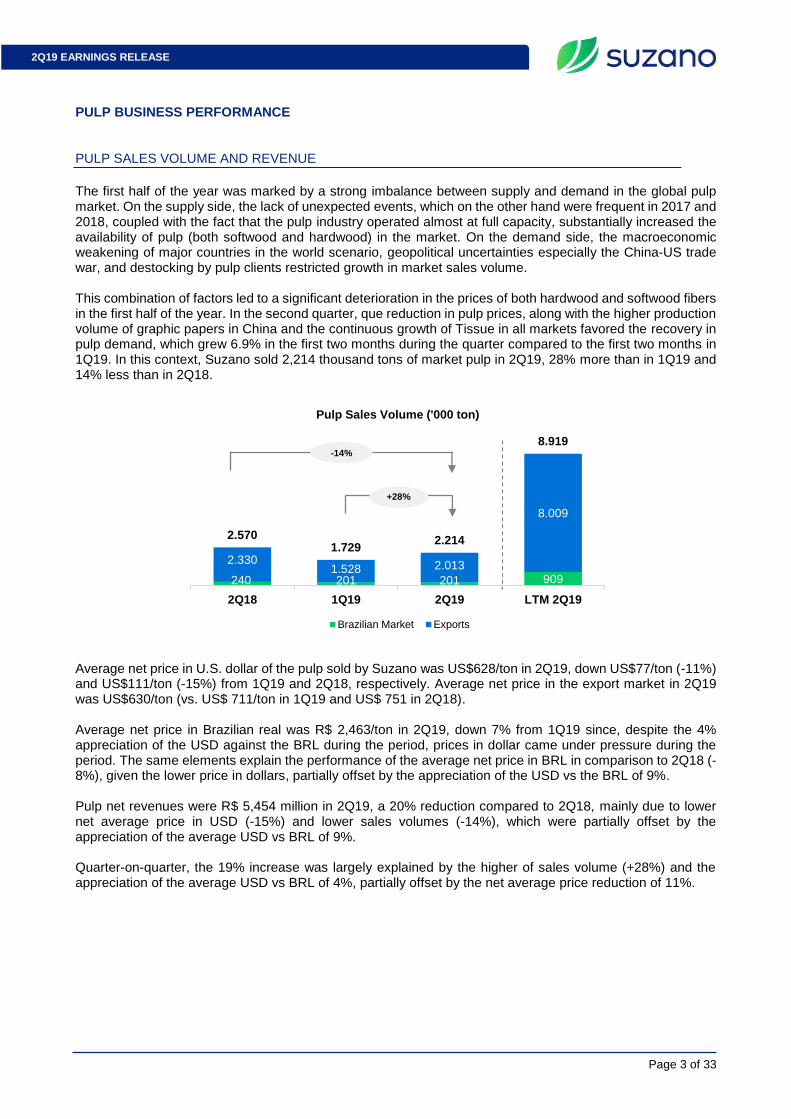
The first half of the year was marked by a strong imbalance between supply and demand in the global pulp market. On the supply side, the lack of unexpected events, which on the other hand were frequent in 2017 and 2018, coupled with the fact that the pulp industry operated almost at full capacity, substantially increased the availability of pulp (both softwood and hardwood) in the market. On the demand side, the macroeconomic weakening of major countries in the world scenario, geopolitical uncertainties especially the China-US trade war, and destocking by pulp clients restricted growth in market sales volume. This combination of factors led to a significant deterioration in the prices of both hardwood and softwood fibers in the first half of the year. In the second quarter, que reduction in pulp prices, along with the higher production volume of graphic papers in China and the continuous growth of Tissue in all markets favored the recovery in pulp demand, which grew 6.9% in the first two months during the quarter compared to the first two months in 1Q19. In this context, Suzano sold 2,214 thousand tons of market pulp in 2Q19, 28% more than in 1Q19 and 14% less than in 2Q18.
Average net price in U.S. dollar of the pulp sold by Suzano was US$628/ton in 2Q19, down US$77/ton (-11%) and US$111/ton (-15%) from 1Q19 and 2Q18, respectively. Average net price in the export market in 2Q19 was US$630/ton (vs. US$ 711/ton in 1Q19 and US$ 751 in 2Q18). Average net price in Brazilian real was R$ 2,463/ton in 2Q19, down 7% from 1Q19 since, despite the 4% appreciation of the USD against the BRL during the period, prices in dollar came under pressure during the period. The same elements explain the performance of the average net price in BRL in comparison to 2Q18 (-8%), given the lower price in dollars, partially offset by the appreciation of the USD vs the BRL of 9%. Pulp net revenues were R$ 5,454 million in 2Q19, a 20% reduction compared to 2Q18, mainly due to lower net average price in USD (-15%) and lower sales volumes (-14%), which were partially offset by the appreciation of the average USD vs BRL of 9%. Quarter-on-quarter, the 19% increase was largely explained by the higher of sales volume (+28%) and the appreciation of the average USD vs BRL of 4%, partially offset by the net average price reduction of 11%.
240 201 201 909
2.3301.528 2.013
8.009
2.5701.729
2.214
8.919
2Q18 1Q19 2Q19 LTM 2Q19
Pulp Sales Volume ('000 ton)
Brazilian Market Exports
-14%
+28%

Page 4 of 33
2Q19 EARNINGS RELEASE
PULP CASH COST
Consolidated cash cost of market pulp production in 2Q19 was R$697/ton excluding downtime and R$733/ton including downtime.
Cash cost excluding downtime in 2Q19 increased R$69/ton from 2Q18 (+11%), mainly due to: i) higher cost of wood due to the supply mix (higher share of third-party wood and higher average radius); and ii) lower dilution of fixed costs due to lower production volume.
541 506 479 2.300
6.313 4.096 4.975
22.108
6.854
4.602 5.454
24.408
2Q18 1Q19 2Q19 LTM 2Q19
Pulp Net Revenues (R$ million)
Brazilian Market Exports
Europe29%
Asia44%
Brazil9%
North America
18%
Distribution of Pulp Net Revenue (2Q19)
628 667 697598 650
2Q18 1Q19 2Q19 LTM 2Q18 LTM 2Q19
Consolidated Pulp Cash Cost ex-maintence downtime (R$/ton)
697 697
36
697 733
Cash Cost 2Q19(ex-maintence
downtime)
Cash Cost 2Q19(with maintence
downtime)
Consolidated Pulp Cash Cost (R$/ton)
Cash Cost ex-downtime
Maintence downtime effect
(37)
7
(29)
287
40
327
253
(10)
244
124
32156
628697
2Q18Cash Cost
Δ Wood Δ Chemicals Δ Fixed Cost Δ Energy 2Q19Cash Cost
Consolidated Pulp Cash Cost ex-maintenance (R$/ton)
Energy Wood Chemicals Fixed Cost
-20%
19%
+9% +5%
+11%
+R$69/ton

Page 5 of 33
2Q19 EARNINGS RELEASE
Cash cost excluding downtime in 2Q19 increased R$30/ton from 1Q19 (+5%), mainly due to: i) higher cost of wood, explained by the higher average radius and lower dilution of fixed costs in forest operations; and ii) lower result from energy sales, largely due to lower prices.
In the last 12 months, consolidated cash cost of market pulp production was R$ 650/ton excluding downtime (vs. R$ 598/ton in LTM 2Q18) and R$ 677/ton including downtime (vs. R$ 633/ton in LTM 2Q18). This variation was due to lower dilution of fixed cost on account of lower production, higher input prices and higher wood cost.
PULP SEGMENT EBITDA
Pulp segment 2Q19 2Q18 Δ Y-o-Y 1Q19 Δ Q-o-Q LTM 2Q19
Adjusted EBITDA (R$ million) 2,734 3,818 -28% 2,471 11% 13,305
Sales volume (k ton) – ex-Klabin 2,095 2,384 -12% 1,674 25% 8,381
Pulp Adjusted EBITDA ex-Klabin (R$/ton) 1,305 1,602 -19% 1,476 -12% 1,588
Adjusted EBITDA from pulp in 2Q19 in relation to 2Q18 mainly reflects the decrease in the average net price of pulp in USD (-15%), the lower sales volume (-14%) and the higher ex-Klabin cash COGS (higher cash production cost), partially offset by the 9% increase in average USD in relation to BRL. The same factors explain the decrease in Adjusted EBITDA per ton. Compared to 1Q19, the 11% increase in EBITDA reflects the 28% growth in sales volume, the 4% appreciation of average USD compared to BRL and lower ex-Klabin cash COGS (largely due to lower maintenance downtimes impact). These effects were partially offset by the 7% decrease in average net price of pulp in USD, which explains the Adjusted EBITDA per ton reduction.
(40)
10
(29)
304
23
327
250
(6)
244
153
4156
667 697
1Q19Cash Cost
Δ Wood Δ Chemicals Δ Fixed Cost Δ Energy 2Q19Cash Cost
Consolidated Pulp Cash Cost ex-maintenance (R$/ton)
Energy Wood Chemicals Fixed Cost
(41)
(1)
(42)
283
15
298
235
17
252
121
21
141
598650
LTM 2Q18 Δ Wood Δ Chemicals Δ Fixed Cost Δ Energy LTM 2Q19
Consolidated Pulp Cash Cost ex-maintenance (R$/ton)
Energy Wood Chemicals Fixed Cost
+R$52/ton
+R$30/ton
Page 6 of 33
2Q19 EARNINGS RELEASE
OPERATING CASH FLOW FROM THE PULP SEGMENT
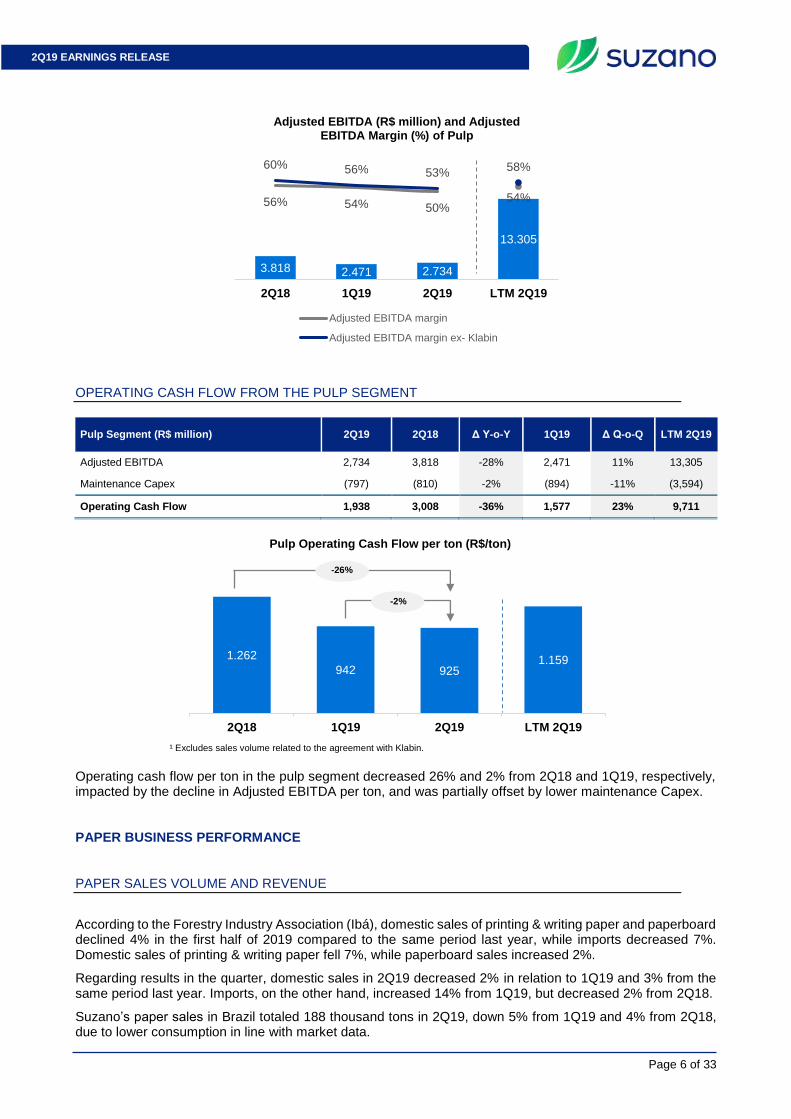
Pulp Segment (R$ million) 2Q19 2Q18 Δ Y-o-Y 1Q19 Δ Q-o-Q LTM 2Q19
Adjusted EBITDA 2,734 3,818 -28% 2,471 11% 13,305
Maintenance Capex (797) (810) -2% (894) -11% (3,594)
Operating Cash Flow 1,938 3,008 -36% 1,577 23% 9,711
¹ Excludes sales volume related to the agreement with Klabin.
Operating cash flow per ton in the pulp segment decreased 26% and 2% from 2Q18 and 1Q19, respectively, impacted by the decline in Adjusted EBITDA per ton, and was partially offset by lower maintenance Capex. PAPER BUSINESS PERFORMANCE PAPER SALES VOLUME AND REVENUE
According to the Forestry Industry Association (Ibá), domestic sales of printing & writing paper and paperboard declined 4% in the first half of 2019 compared to the same period last year, while imports decreased 7%. Domestic sales of printing & writing paper fell 7%, while paperboard sales increased 2%.
Regarding results in the quarter, domestic sales in 2Q19 decreased 2% in relation to 1Q19 and 3% from the same period last year. Imports, on the other hand, increased 14% from 1Q19, but decreased 2% from 2Q18.
Suzano’s paper sales in Brazil totaled 188 thousand tons in 2Q19, down 5% from 1Q19 and 4% from 2Q18, due to lower consumption in line with market data.
3.818 2.471 2.734
13.305
56% 54% 50%54%
60% 56% 53%58%
-30,0%
-10,0%
10,0%
30,0%
50,0%
70,0%
0
2.000
4.000
6.000
8.000
10.000
12.000
14.000
16.000
18.000
20.000
2Q18 1Q19 2Q19 LTM 2Q19
Adjusted EBITDA (R$ million) and Adjusted EBITDA Margin (%) of Pulp
Adjusted EBITDA margin
Adjusted EBITDA margin ex- Klabin
1.262
942 9251.159
2Q18 1Q19 2Q19 LTM 2Q19
Pulp Operating Cash Flow per ton (R$/ton)
-2%
-26%

Page 7 of 33
2Q19 EARNINGS RELEASE
Paper sales in 2Q19 totaled 301 thousand tons, increasing 10% from 1Q19 and 6% from the same period last year, thanks to our strategy of allocating higher volumes to international markets due to our flexibility and presence in more than 60 countries.
Average net price of paper in the domestic market was R$ 4,177/ton in 2Q19, representing increases of R$ 79/ton (2%) and R$ 396/ton (10%) from 1Q19 and 2Q18, respectively, driven by the price implementation in the period. Through our profitability management strategy and operations in multiple markets, we could mitigate most of the fluctuation in international prices. Average net price of paper exported in 2Q19 was US$ 966/ton, down US$ 29/ton (3%) from 1Q19 and US$ 23/ton (2%) from 2Q18. In BRL, the export price of paper in 2Q19 came to R$ 3,786/ton, up R$ 34/ton (1%) from 1Q19 and R$ 219/ton (6%) from 2Q18, mainly due to the exchange rate variation in the periods.
Net revenue from paper sales was R$ 1,211 million in 2Q19, increasing 16% from 2Q18, mainly due to higher average net price (+9%), higher export sales volume (+29%), and the 9% appreciation of the average USD in relation to BRL. Compared to 1Q19, the main factors behind the 16% increase were higher export volume (+46%) and the 4% appreciation of average USD in relation to BRL.
195 197 188
875
87 77 113
383
282 274 301
1.258
2Q18 1Q19 2Q19 LTM 2Q19
Paper Sales Volume ('000 ton)
Brazilian Market Exports
737 808 784
3.526
311 289 427
1.466
1.049 1.097 1.211
4.992
2Q18 1Q19 2Q19 LTM 2Q19
Paper Net Revenues (R$ million)
Brazilian Market Exports
Others; 8%
Brazil; 65%
North America;
12%
South/ Central
America; 15%
Distribution of Paper Net Revenue (2Q19)
+15%
+7%
+10%
+10%
Page 8 of 33
2Q19 EARNINGS RELEASE
PAPER EBITDA
Paper Segment 2Q19 2Q18 Δ Y-o-Y 1Q19 Δ Q-o-Q LTM 2Q19
Adjusted EBITDA (R$ million) 366 253 45% 290 26% 1,494
Sales volume (k ton) 301 284 6% 274 10% 1,261
Adjusted EBITDA Paper (R$/ton) 1,219 892 37% 1,058 15% 1,185
The performance of Adjusted EBITDA from paper in 2Q19 compared to 2Q18 is mainly explained by: i) price increases; ii) the use of the Company’s commercial flexibility to better allocate sales; iii) the reduction in administrative expenses; and iv) the 9% depreciation of BRL against USD. Compared to 1Q19, the increase is due to the decrease in administrative expenses, higher sales volume (+46%), and lower cost in the period, reflecting the stability of production. Note that the paper business is incorporating the results from the consumer goods business, which is still in the ramp-up phase.
OPERATING CASH FLOW FROM PAPER
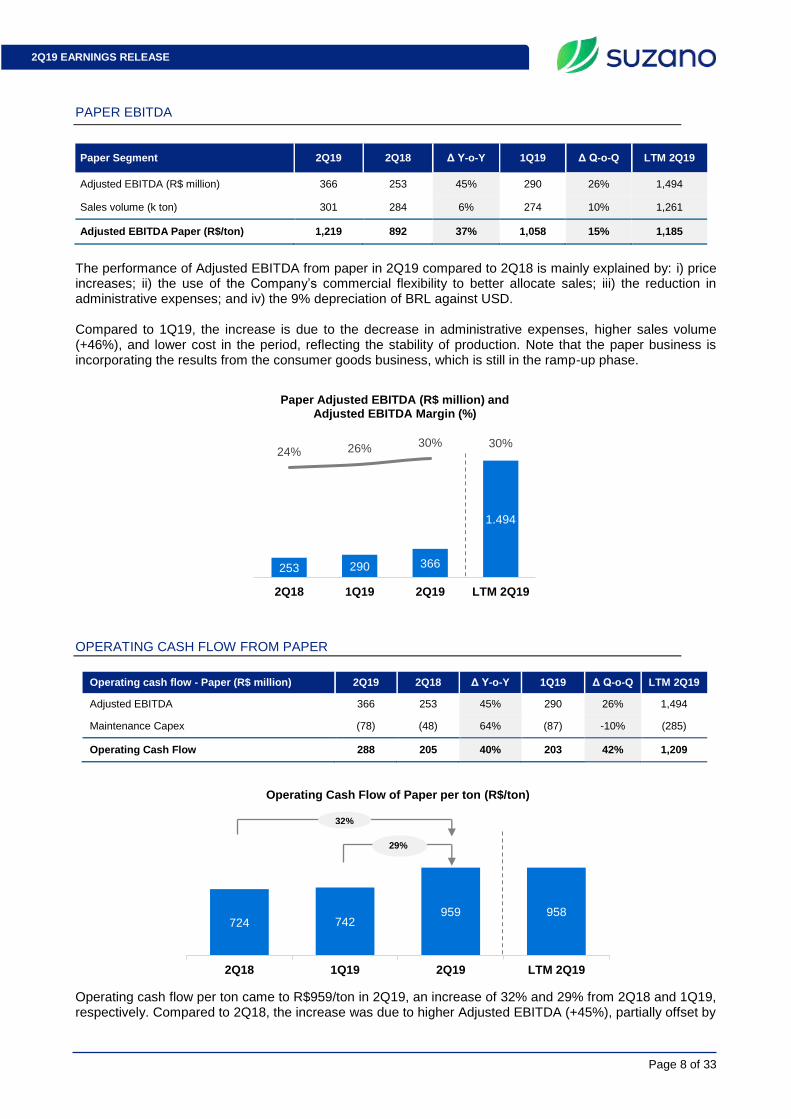
Operating cash flow - Paper (R$ million) 2Q19 2Q18 Δ Y-o-Y 1Q19 Δ Q-o-Q LTM 2Q19
Adjusted EBITDA 366 253 45% 290 26% 1,494
Maintenance Capex (78) (48) 64% (87) -10% (285)
Operating Cash Flow 288 205 40% 203 42% 1,209
Operating cash flow per ton came to R$959/ton in 2Q19, an increase of 32% and 29% from 2Q18 and 1Q19, respectively. Compared to 2Q18, the increase was due to higher Adjusted EBITDA (+45%), partially offset by
253 290 366
1.494
24% 26%30% 30%
-50,0%
-40,0%
-30,0%
-20,0%
-10,0%
0,0%
10,0%
20,0%
30,0%
40,0%
0
200
400
600
800
1.000
1.200
1.400
1.600
1.800
2Q18 1Q19 2Q19 LTM 2Q19
Paper Adjusted EBITDA (R$ million) and Adjusted EBITDA Margin (%)
724 742959 958
2Q18 1Q19 2Q19 LTM 2Q19
Operating Cash Flow of Paper per ton (R$/ton)
29%
32%

Page 9 of 33
2Q19 EARNINGS RELEASE
higher maintenance Capex. Compared to the previous quarter, in addition to the increase in Adjusted EBITDA (+26%), maintenance Capex decreased 10%.
ECONOMIC AND FINANCIAL PERFORMANCE
NET REVENUE
Suzano’s net revenue in 2Q19 was R$ 6,665 million, 81% of which came from exports (vs. 84% in 2Q18 and 77% in 1Q19). Pulp and paper sales in the quarter totaled 2,514 thousand tons, up 26% from 1Q19 and down 12% from 2Q18.
¹ Does not include service revenue at Portocel.
Consolidated net revenue in 2Q19 compared to 1Q19 was influenced by the 26% growth in pulp sales volume (pulp volume alone increased 28%) and by the 4% appreciation of the USD against the BRL, partially offset by the decline in average net price of pulp in USD (-11%).
Compared to 2Q18, the reduction in net revenue was mainly due to the decline in the average net price of pulp in USD (-15%) and the 14% decline in pulp sales volume. These effects were partially offset by the 9% appreciation of average USD in relation to BRL. PRODUCTION
Production (k ton) 2Q19 2Q18 Δ Y-o-Y 1Q19 Δ Q-o-Q LTM 2Q19
Market pulp 2,221 2,420 -8% 2,173 +2% 9,725
Paper 318 300 +6% 292 +9% 1,281
Total 2,539 2,720 -7% 2,465 +3% 11,006
In the 2nd quarter of 2019, the following units underwent scheduled maintenance downtimes: lines A and C (partially) at the Aracruz Unit, Imperatriz Unit, and line 1 and line 2 (partially) of the Três Lagoas Unit. Apart from these effects, production volume was also impacted by the Company’s decision to continue producing below capacity in order to better manage its inventories (currently higher than historical levels). The Company is planning total market pulp production of approximately 9.0 million in 2019, depending on conditions of global pulp market, according to Material Fact released on 05/09/2019. This production adjustment is aimed at managing inventories for the year after having fully ensured the availability of pulp to meet client demand.
1.279 1.313 1.2635.826
6.624 4.386 5.402
23.573
7.9035.699 6.665
29.399
2Q18 1Q19 2Q19 LTM 2Q19
Net Revenue¹ (R$ million)
Brazilian Market Exports
Pulp82%
Printing & Writing
13%
Paperboard3%
Other Paper2%
Net Revenue Breakdown (2Q19)
-16%
+17%
Page 10 of 33
2Q19 EARNINGS RELEASE
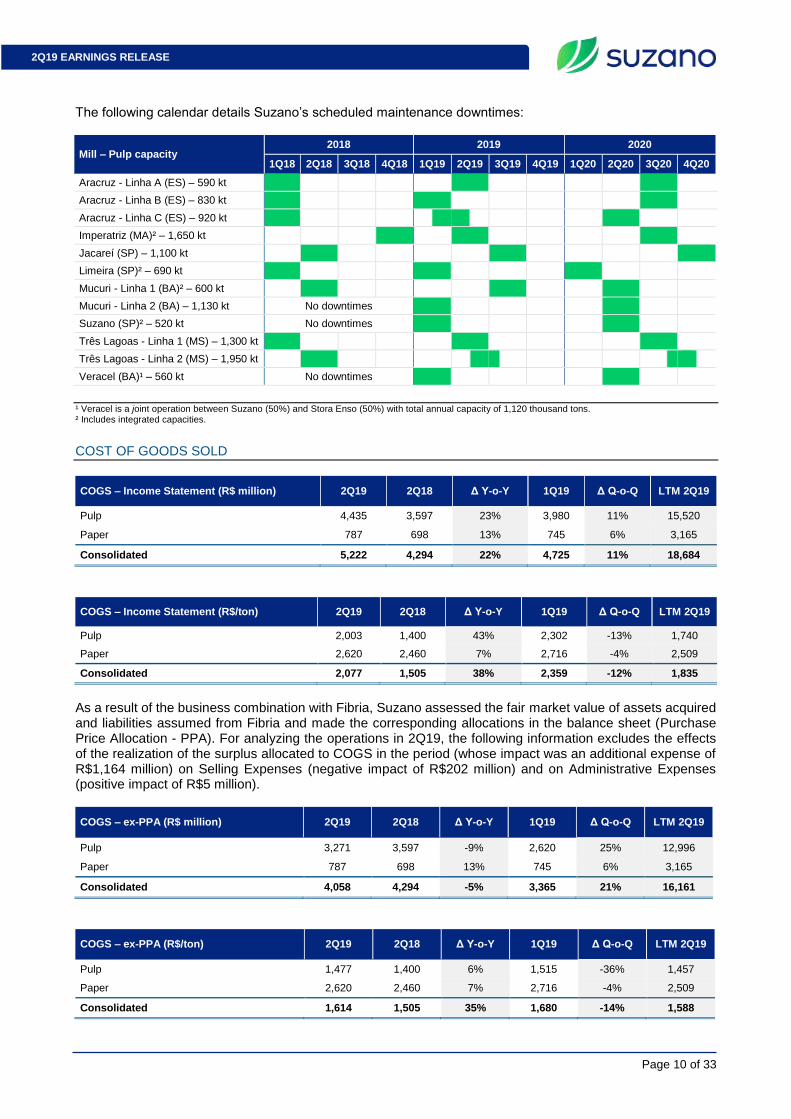
The following calendar details Suzano’s scheduled maintenance downtimes:
Mill – Pulp capacity 2018 2019 2020
1Q18 2Q18 3Q18 4Q18 1Q19 2Q19 3Q19 4Q19 1Q20 2Q20 3Q20 4Q20
Aracruz - Linha A (ES) – 590 kt
Aracruz - Linha B (ES) – 830 kt
Aracruz - Linha C (ES) – 920 kt
Imperatriz (MA)² – 1,650 kt
Jacareí (SP) – 1,100 kt
Limeira (SP)² – 690 kt
Mucuri - Linha 1 (BA)² – 600 kt
Mucuri - Linha 2 (BA) – 1,130 kt No downtimes
Suzano (SP)² – 520 kt No downtimes
Três Lagoas - Linha 1 (MS) – 1,300 kt
Três Lagoas - Linha 2 (MS) – 1,950 kt
Veracel (BA)¹ – 560 kt No downtimes
¹ Veracel is a joint operation between Suzano (50%) and Stora Enso (50%) with total annual capacity of 1,120 thousand tons. ² Includes integrated capacities. COST OF GOODS SOLD
COGS – Income Statement (R$ million) 2Q19 2Q18 Δ Y-o-Y 1Q19 Δ Q-o-Q LTM 2Q19
Pulp 4,435 3,597 23% 3,980 11% 15,520
Paper 787 698 13% 745 6% 3,165
Consolidated 5,222 4,294 22% 4,725 11% 18,684
COGS – Income Statement (R$/ton) 2Q19 2Q18 Δ Y-o-Y 1Q19 Δ Q-o-Q LTM 2Q19
Pulp 2,003 1,400 43% 2,302 -13% 1,740
Paper 2,620 2,460 7% 2,716 -4% 2,509
Consolidated 2,077 1,505 38% 2,359 -12% 1,835
As a result of the business combination with Fibria, Suzano assessed the fair market value of assets acquired and liabilities assumed from Fibria and made the corresponding allocations in the balance sheet (Purchase Price Allocation - PPA). For analyzing the operations in 2Q19, the following information excludes the effects of the realization of the surplus allocated to COGS in the period (whose impact was an additional expense of R$1,164 million) on Selling Expenses (negative impact of R$202 million) and on Administrative Expenses (positive impact of R$5 million).
COGS – ex-PPA (R$ million) 2Q19 2Q18 Δ Y-o-Y 1Q19 Δ Q-o-Q LTM 2Q19
Pulp 3,271 3,597 -9% 2,620 25% 12,996
Paper 787 698 13% 745 6% 3,165
Consolidated 4,058 4,294 -5% 3,365 21% 16,161
COGS – ex-PPA (R$/ton) 2Q19 2Q18 Δ Y-o-Y 1Q19 Δ Q-o-Q LTM 2Q19
Pulp 1,477 1,400 6% 1,515 -36% 1,457
Paper 2,620 2,460 7% 2,716 -4% 2,509
Consolidated 1,614 1,505 35% 1,680 -14% 1,588
Page 11 of 33
2Q19 EARNINGS RELEASE
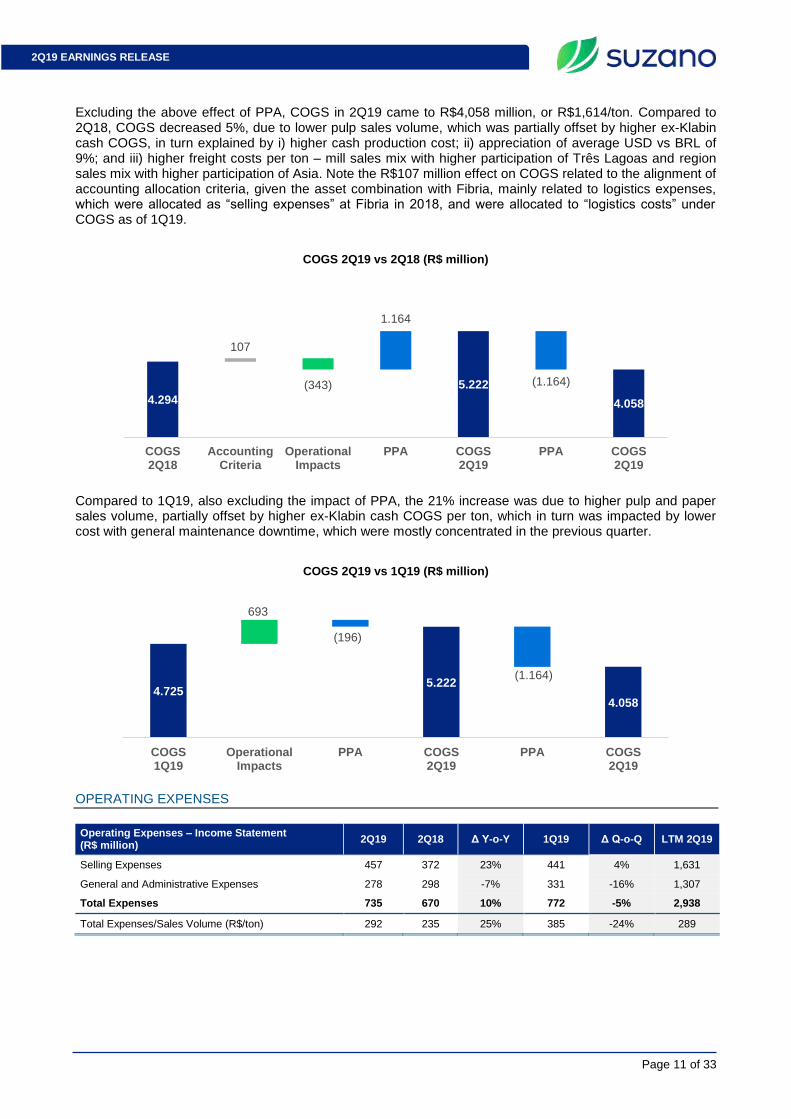
Excluding the above effect of PPA, COGS in 2Q19 came to R$4,058 million, or R$1,614/ton. Compared to 2Q18, COGS decreased 5%, due to lower pulp sales volume, which was partially offset by higher ex-Klabin cash COGS, in turn explained by i) higher cash production cost; ii) appreciation of average USD vs BRL of 9%; and iii) higher freight costs per ton – mill sales mix with higher participation of Três Lagoas and region sales mix with higher participation of Asia. Note the R$107 million effect on COGS related to the alignment of accounting allocation criteria, given the asset combination with Fibria, mainly related to logistics expenses, which were allocated as “selling expenses” at Fibria in 2018, and were allocated to “logistics costs” under COGS as of 1Q19.
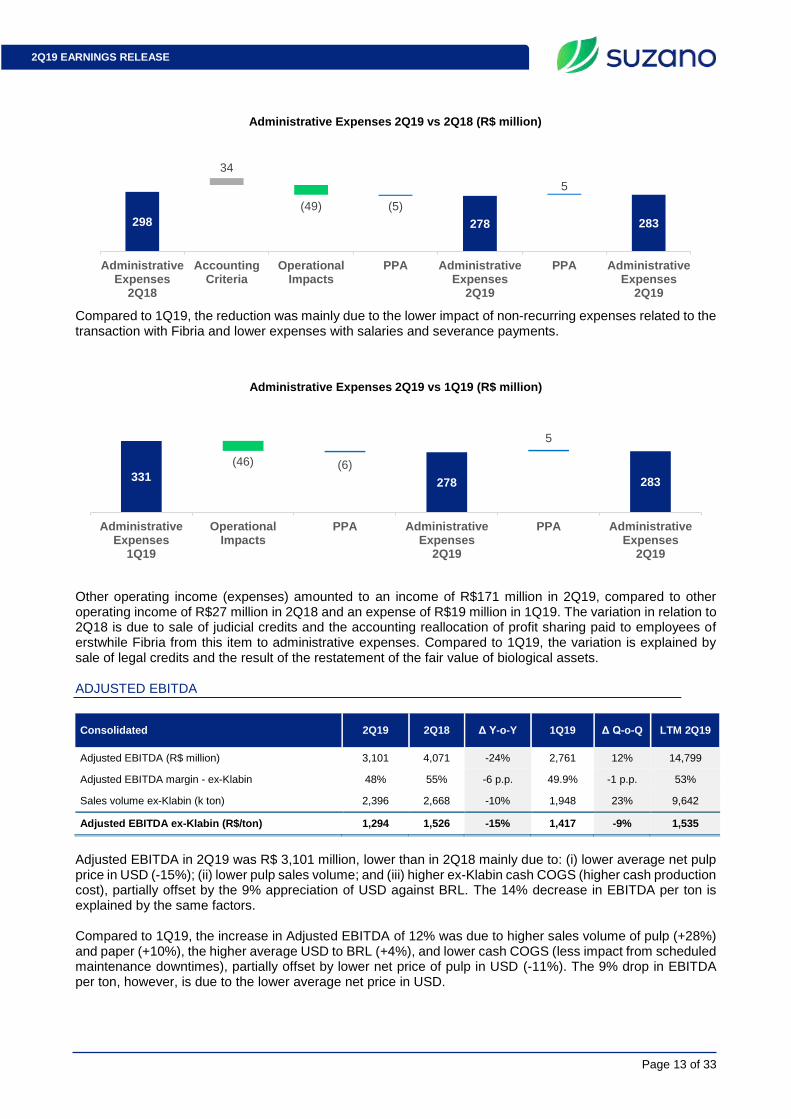
Compared to 1Q19, also excluding the impact of PPA, the 21% increase was due to higher pulp and paper sales volume, partially offset by higher ex-Klabin cash COGS per ton, which in turn was impacted by lower cost with general maintenance downtime, which were mostly concentrated in the previous quarter.
OPERATING EXPENSES
Operating Expenses – Income Statement (R$ million)
2Q19 2Q18 Δ Y-o-Y 1Q19 Δ Q-o-Q LTM 2Q19
Selling Expenses 457 372 23% 441 4% 1,631
General and Administrative Expenses 278 298 -7% 331 -16% 1,307
Total Expenses 735 670 10% 772 -5% 2,938
Total Expenses/Sales Volume (R$/ton) 292 235 25% 385 -24% 289
4.294 4.294 4.058 4.058
5.222
4.058 4.058
107
(343)
1.164
(1.164)
COGS2Q18
AccountingCriteria
OperationalImpacts
PPA COGS2Q19
PPA COGS2Q19
COGS 2Q19 vs 2Q18 (R$ million)
4.725 4.7255.222 5.222
4.058 4.058
693
(196)
(1.164)
COGS1Q19
OperationalImpacts
PPA COGS2Q19
PPA COGS2Q19
COGS 2Q19 vs 1Q19 (R$ million)

Page 12 of 33
2Q19 EARNINGS RELEASE
Operating Expenses –ex-PPA (R$ million)
2Q19 2Q18 Δ Y-o-Y 1Q19 Δ Q-o-Q LTM 2Q19
Selling Expenses 255 372 -32% 236 8% 1,223
General and Administrative Expenses 283 298 -5% 330 -14% 1,312
Total Expenses 538 670 -20% 566 -5% 2,535
Total Expenses/Sales Volume (R$/ton) 214 235 -9% 282 -24% 249
Excluding the R$202 million effect of PPA from 2Q19 results, Selling Expenses decreased 32% from 2Q18, mainly due to the impact of the alignment of the accounting allocation criteria with the merger of Fibria shares (especially selling expenses, which are recorded as COGS as of 1Q19), and the lower sales volume (-12%). Selling expenses per ton increased 10%, mainly due to the 9% appreciation of USD in relation to BRL and lower fixed expenses dilution.
Compared to 1Q19, the 8% increase is explained by higher sales volume and 4% appreciation of the USD against the BRL.
Excluding the effect of PPA on administrative expenses (-R$ 5 million), which was positive in the period due to the closure of lawsuits, compared to 2Q18, the 5% decrease in this item is explained by lower expenses due to the transaction with Fibria, expenses with outsourced services, and synergies, partially offset by the accounting allocation of R$34 million (related to a portion of variable compensation and contingencies, which were earlier recorded in Fibria as “other operating income and expenses”).
372263 255 255
457
255 255
(109) (8)
202
(202)
SellingExpenses
2Q18
AccountingCriteria
OperationalImpacts
PPA SellingExpenses
2Q19
PPA SellingExpenses
2Q19
Selling Expenses 2Q19 vs 2Q18 (R$ million)
441 441 457 457
255 255
19
(3)
(202)
SellingExpenses
1Q19
OperationalImpacts
PPA SellingExpenses
2Q19
PPA SellingExpenses
2Q19
Selling Expenses 2Q19 vs 1Q19 (R$ million)
Page 13 of 33
2Q19 EARNINGS RELEASE
Compared to 1Q19, the reduction was mainly due to the lower impact of non-recurring expenses related to the transaction with Fibria and lower expenses with salaries and severance payments.
Other operating income (expenses) amounted to an income of R$171 million in 2Q19, compared to other operating income of R$27 million in 2Q18 and an expense of R$19 million in 1Q19. The variation in relation to 2Q18 is due to sale of judicial credits and the accounting reallocation of profit sharing paid to employees of erstwhile Fibria from this item to administrative expenses. Compared to 1Q19, the variation is explained by sale of legal credits and the result of the restatement of the fair value of biological assets.
ADJUSTED EBITDA
Consolidated 2Q19 2Q18 Δ Y-o-Y 1Q19 Δ Q-o-Q LTM 2Q19
Adjusted EBITDA (R$ million) 3,101 4,071 -24% 2,761 12% 14,799
Adjusted EBITDA margin - ex-Klabin 48% 55% -6 p.p. 49.9% -1 p.p. 53%
Sales volume ex-Klabin (k ton) 2,396 2,668 -10% 1,948 23% 9,642
Adjusted EBITDA ex-Klabin (R$/ton) 1,294 1,526 -15% 1,417 -9% 1,535
Adjusted EBITDA in 2Q19 was R$ 3,101 million, lower than in 2Q18 mainly due to: (i) lower average net pulp price in USD (-15%); (ii) lower pulp sales volume; and (iii) higher ex-Klabin cash COGS (higher cash production cost), partially offset by the 9% appreciation of USD against BRL. The 14% decrease in EBITDA per ton is explained by the same factors. Compared to 1Q19, the increase in Adjusted EBITDA of 12% was due to higher sales volume of pulp (+28%) and paper (+10%), the higher average USD to BRL (+4%), and lower cash COGS (less impact from scheduled maintenance downtimes), partially offset by lower net price of pulp in USD (-11%). The 9% drop in EBITDA per ton, however, is due to the lower average net price in USD.
298 332 283 278 278 283 283
34
(49) (5)
5
AdministrativeExpenses
2Q18
AccountingCriteria
OperationalImpacts
PPA AdministrativeExpenses
2Q19
PPA AdministrativeExpenses
2Q19
Administrative Expenses 2Q19 vs 2Q18 (R$ million)
331 284 278 278 283 283
(46) (6)
5
AdministrativeExpenses
1Q19
OperationalImpacts
PPA AdministrativeExpenses
2Q19
PPA AdministrativeExpenses
2Q19
Administrative Expenses 2Q19 vs 1Q19 (R$ million)

Page 14 of 33
2Q19 EARNINGS RELEASE
FINANCIAL INCOME AND EXPENSES
Financial Result (R$ million) 2Q19 2Q18 Δ Y-o-Y 1Q19 Δ Q-o-Q LTM 2Q19
Financial Expenses (1,086) (666) 63% (993) 9% (3,802)
Interest on loans and financing (local currency)
(345) (203) 70% (421) -18% (1,391)
Interest on loans and financing (foreign currency)
(538) (264) 104% (448) 20% (1,666)
Capitalized interest1 1 3 -69% 1 65% 4
Other financial expenses (205) (203) 1% (125) 64% (749)
Financial Income 150 129 17% 149 0% 889
Interest on financial investments 74 111 -33% 140 -47% 769
Other financial income 76 18 324% 9 720% 120
Monetary and Exchange Variations 758 (2,641) -129% (456) -266% 239
Foreign exchange variations (Debt) 647 (3,224) -120% (306) -312% 465
Other foreign exchange variations 112 583 -81% (150) -174% (226)
Derivative income (loss), net2 257 (3,031) -108% (637) -140% (296)
Cash flow hedge 408 (2,243) -118% (75) -642% 725
Debt hedge (177) (768) -77% (563) -69% (979)
Others3 26 (19) -238% 2 1409% (41)
Net Financial Result 79 (6,209) -101% (1,936) -104% (2,969)
¹ Capitalization of interest related to work in progress.
² Variation in mark-to-market adjustment plus adjustments paid and received, considering the end-of-month exchange rate (R$/US$3.8322 on 6/30/2019).
³ Includes commodity hedge and embedded derivatives.
Interest expenses totaled R$1,086 million in 2Q19, increasing 9% from 1Q19, mainly due to the 4% increase in average USD in relation to BRL, and the Company’s liability management actions during the period, which lengthened the average debt term. Compared to 2Q18, the 63% increase reflects the financing taken out for the asset combination with Fibria and the higher average USD versus BRL (2Q19: 3.92 | 2Q18: 3.60). “Other financial expenses” came to an expense of R$205 million, up 64% from 1Q19, mainly due to the early settlement of the ECA Finnvera financing facility, causing the full derecognition of funding costs. The settlement of the facility eliminated the existence of financial covenants in the Company’s debt agreements. Compared to 2Q18, the item remained stable. Financial income remained virtually stable between 1Q19 and 2Q19. The reduction in Interest income is due to (1) the yield on the cash raised for the asset combination with Fibria in 1Q19; and (2) the concentration of cash at the end of 2Q19 due to the liability management actions in June. These effects were partially offset by the increase in “Other financial income” in 2Q19, due to the amortization of the goodwill related to the asset combination with Fibria (for further details, please refer to note 24 in the Financial Statements). Compared to 2Q18, the 17% increase is mainly due to the amortization of the surplus related to the business combination with Fibria. Inflation adjustment and exchange variation had a positive impact of R$758 million on the Company’s financial result in the quarter, due to the 2% depreciation of BRL against the USD on the foreign currency portion of the debt (72% of total debt). The positive accounting impact of exchange variation on foreign currency debt has cash impact only on the respective maturities. The result from operations with derivatives was positive, impacted by the high volatility in the financial markets during the quarter, which caused significant variation in the mark-to-market (MtM) adjustment of derivative operations. The MtM variation is mainly explained by: 1) new operations contracted during the quarter (positive variation); 2) the variation in the Fixed, Coupon and Libor curves on operations (negative variation); and 3) the depreciation of the closing USD against the BRL on existing agreements (positive variation). The mark-to-
Page 15 of 33
2Q19 EARNINGS RELEASE
market adjustment of derivative instruments on June 30, 2019 was an negative in R$1,254 million, compared to negative R$1,541 million on March 31, 2019, resulting in a positive variation of R$257 million. Due to the above factors, the Company posted net financial income of R$79 million in 2Q19, compared to net financial expense of R$1,936 million in 1Q19 and R$6,209 million in 2Q18. DERIVATIVES OPERATIONS
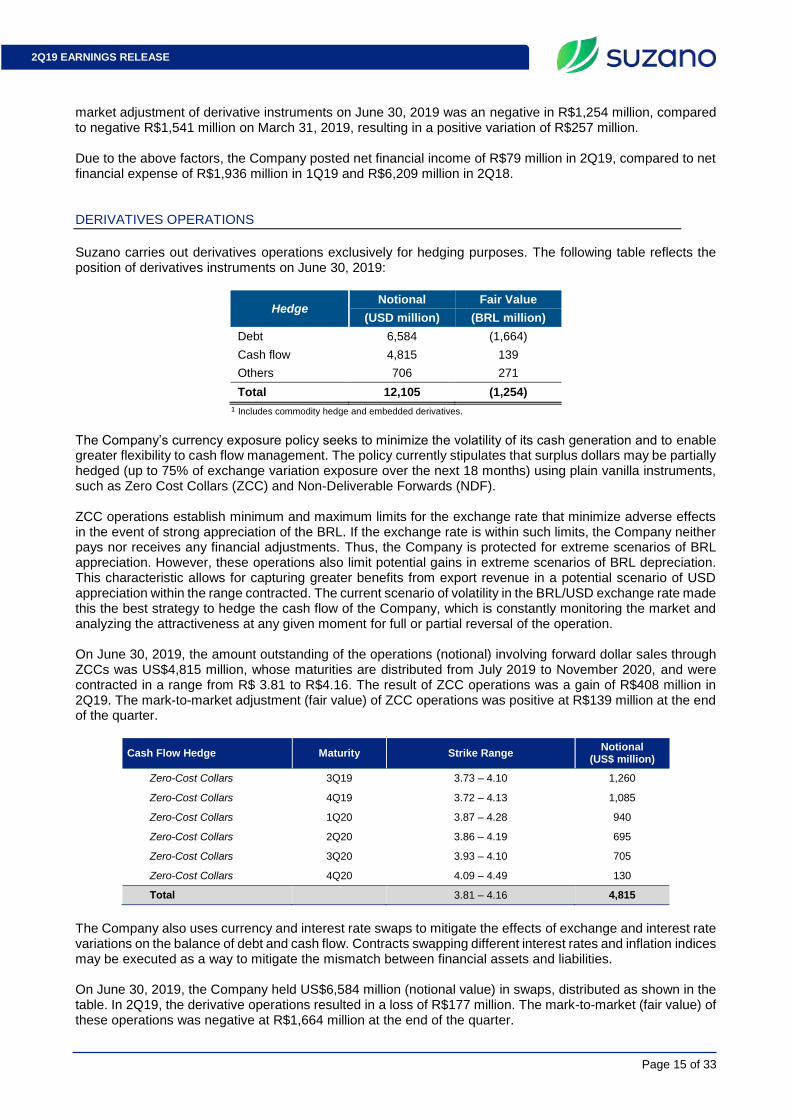
Suzano carries out derivatives operations exclusively for hedging purposes. The following table reflects the position of derivatives instruments on June 30, 2019:
Hedge Notional Fair Value
(USD million) (BRL million)
Debt 6,584 (1,664)
Cash flow 4,815 139
Others 706 271
Total 12,105 (1,254)
¹ Includes commodity hedge and embedded derivatives. The Company’s currency exposure policy seeks to minimize the volatility of its cash generation and to enable greater flexibility to cash flow management. The policy currently stipulates that surplus dollars may be partially hedged (up to 75% of exchange variation exposure over the next 18 months) using plain vanilla instruments, such as Zero Cost Collars (ZCC) and Non-Deliverable Forwards (NDF). ZCC operations establish minimum and maximum limits for the exchange rate that minimize adverse effects in the event of strong appreciation of the BRL. If the exchange rate is within such limits, the Company neither pays nor receives any financial adjustments. Thus, the Company is protected for extreme scenarios of BRL appreciation. However, these operations also limit potential gains in extreme scenarios of BRL depreciation. This characteristic allows for capturing greater benefits from export revenue in a potential scenario of USD appreciation within the range contracted. The current scenario of volatility in the BRL/USD exchange rate made this the best strategy to hedge the cash flow of the Company, which is constantly monitoring the market and analyzing the attractiveness at any given moment for full or partial reversal of the operation. On June 30, 2019, the amount outstanding of the operations (notional) involving forward dollar sales through ZCCs was US$4,815 million, whose maturities are distributed from July 2019 to November 2020, and were contracted in a range from R$ 3.81 to R$4.16. The result of ZCC operations was a gain of R$408 million in 2Q19. The mark-to-market adjustment (fair value) of ZCC operations was positive at R$139 million at the end of the quarter.
Cash Flow Hedge Maturity Strike Range Notional
(US$ million)
Zero-Cost Collars 3Q19 3.73 – 4.10 1,260
Zero-Cost Collars 4Q19 3.72 – 4.13 1,085
Zero-Cost Collars 1Q20 3.87 – 4.28 940
Zero-Cost Collars 2Q20 3.86 – 4.19 695
Zero-Cost Collars 3Q20 3.93 – 4.10 705
Zero-Cost Collars 4Q20 4.09 – 4.49 130
Total 3.81 – 4.16 4,815
The Company also uses currency and interest rate swaps to mitigate the effects of exchange and interest rate variations on the balance of debt and cash flow. Contracts swapping different interest rates and inflation indices may be executed as a way to mitigate the mismatch between financial assets and liabilities. On June 30, 2019, the Company held US$6,584 million (notional value) in swaps, distributed as shown in the table. In 2Q19, the derivative operations resulted in a loss of R$177 million. The mark-to-market (fair value) of these operations was negative at R$1,664 million at the end of the quarter.
Page 16 of 33
2Q19 EARNINGS RELEASE
Debt Hedge Maturity Currency Notional
(US$ million)
Swap (PRÉ x USD) 2024 USD 352
Swap (CDI x USD) 2026 USD 3,137
Swap (IPCA x CDI)¹ 2023 BRL 220
Swap (IPCA x USD) 2023 USD 121
Swap (LIBOR x USD) 2024 USD 2,754
Total 6,584
¹Translated at the closing exchange rate on 6/30/2019 of 3.8322
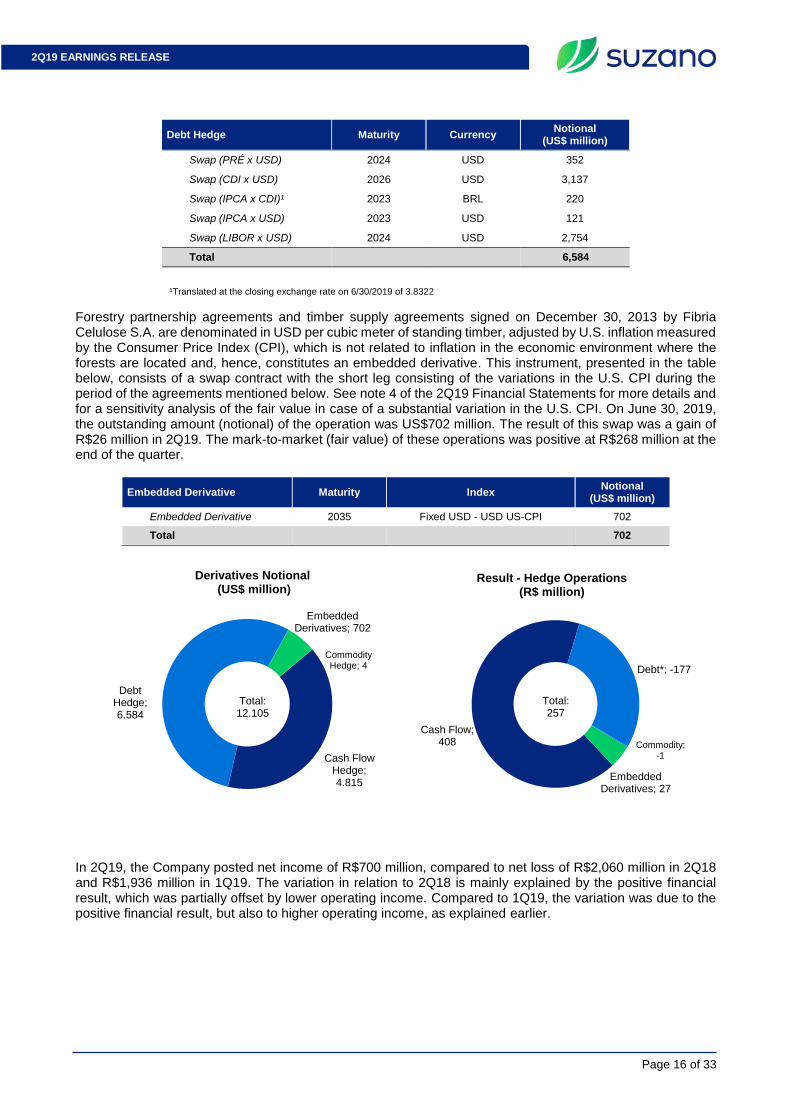
Forestry partnership agreements and timber supply agreements signed on December 30, 2013 by Fibria Celulose S.A. are denominated in USD per cubic meter of standing timber, adjusted by U.S. inflation measured by the Consumer Price Index (CPI), which is not related to inflation in the economic environment where the forests are located and, hence, constitutes an embedded derivative. This instrument, presented in the table below, consists of a swap contract with the short leg consisting of the variations in the U.S. CPI during the period of the agreements mentioned below. See note 4 of the 2Q19 Financial Statements for more details and for a sensitivity analysis of the fair value in case of a substantial variation in the U.S. CPI. On June 30, 2019, the outstanding amount (notional) of the operation was US$702 million. The result of this swap was a gain of R$26 million in 2Q19. The mark-to-market (fair value) of these operations was positive at R$268 million at the end of the quarter.
Embedded Derivative Maturity Index Notional
(US$ million)
Embedded Derivative 2035 Fixed USD - USD US-CPI 702
Total 702
In 2Q19, the Company posted net income of R$700 million, compared to net loss of R$2,060 million in 2Q18 and R$1,936 million in 1Q19. The variation in relation to 2Q18 is mainly explained by the positive financial result, which was partially offset by lower operating income. Compared to 1Q19, the variation was due to the positive financial result, but also to higher operating income, as explained earlier.
Cash Flow Hedge; 4.815
Debt Hedge; 6.584
Commodity Hedge; 4
Embedded Derivatives; 702
Derivatives Notional(US$ million)
Cash Flow; 408
Debt*; -177
Commodity; -1
Embedded Derivatives; 27
Result - Hedge Operations(R$ million)
Total: 12,105
Total: 257
Page 17 of 33
2Q19 EARNINGS RELEASE
DEBT
Debt (R$ million) 06/30/2019 06/30/2018 Δ Y-o-Y 03/31/2019 Δ Q-o-Q
Local Currency 17,221 16,434 16% 19,605 -12%
Short Term 2,227 1,860 138% 3,740 -40%
Long Term 14,994 14,574 8% 15,865 -5%
Foreign Currency 43,259 22,551 79% 41,160 5%
Short Term 2,466 1,535 0% 3,694 -33%
Long Term 40,793 21,016 88% 37,466 9%
Gross Debt 60,480 38,985 55% 60,765 0%
(-) Cash 7,972 15,247 -50% 6,959 15%
Net Debt 52,508 23,738 127% 53,806 -2%
Net Debt/Adjusted EBITDA1 (x) – R$ 3.5x 1.8x 1.8x 3.4x 0.1x
Net Debt/EBITDA Ajustado¹ (x) – US$ 3.6x 1.5x 2.1x 3.3x 0.3x
¹ Excluding non-recurring items.
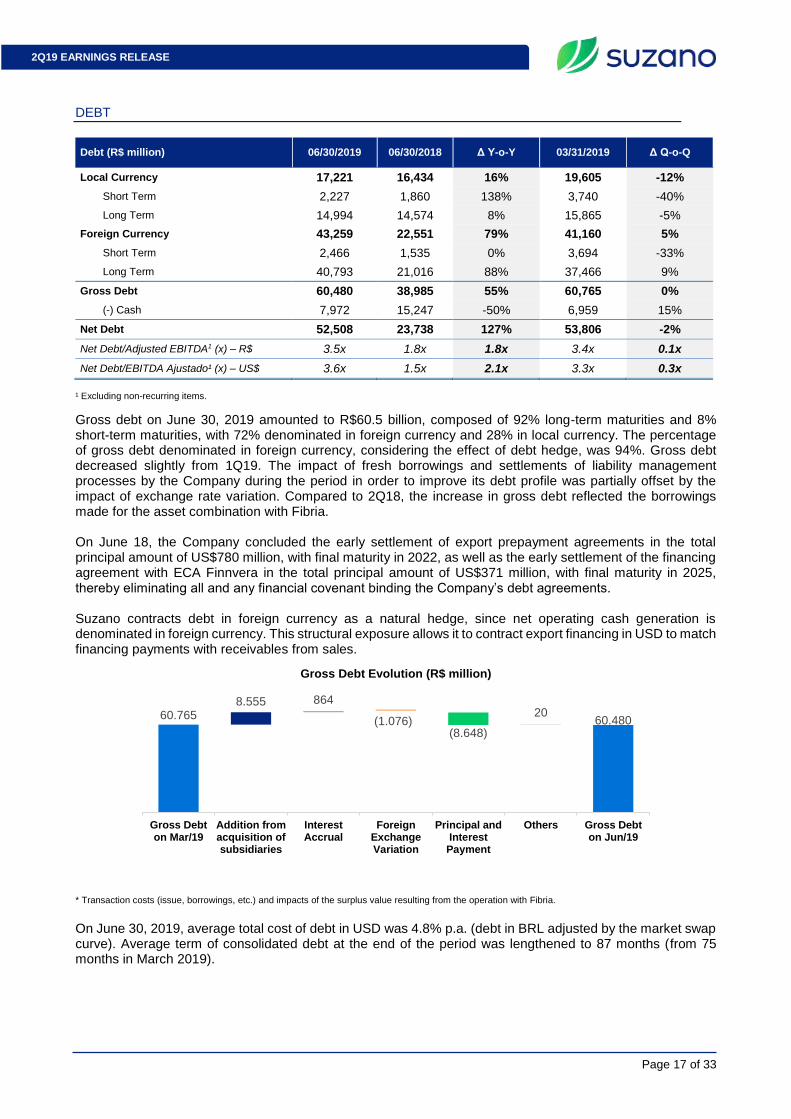
Gross debt on June 30, 2019 amounted to R$60.5 billion, composed of 92% long-term maturities and 8% short-term maturities, with 72% denominated in foreign currency and 28% in local currency. The percentage of gross debt denominated in foreign currency, considering the effect of debt hedge, was 94%. Gross debt decreased slightly from 1Q19. The impact of fresh borrowings and settlements of liability management processes by the Company during the period in order to improve its debt profile was partially offset by the impact of exchange rate variation. Compared to 2Q18, the increase in gross debt reflected the borrowings made for the asset combination with Fibria. On June 18, the Company concluded the early settlement of export prepayment agreements in the total principal amount of US$780 million, with final maturity in 2022, as well as the early settlement of the financing agreement with ECA Finnvera in the total principal amount of US$371 million, with final maturity in 2025, thereby eliminating all and any financial covenant binding the Company’s debt agreements. Suzano contracts debt in foreign currency as a natural hedge, since net operating cash generation is denominated in foreign currency. This structural exposure allows it to contract export financing in USD to match financing payments with receivables from sales.
* Transaction costs (issue, borrowings, etc.) and impacts of the surplus value resulting from the operation with Fibria. On June 30, 2019, average total cost of debt in USD was 4.8% p.a. (debt in BRL adjusted by the market swap curve). Average term of consolidated debt at the end of the period was lengthened to 87 months (from 75 months in March 2019).
60.7658.555 864
(1.076)(8.648)
2060.480
Gross Debton Mar/19
Addition fromacquisition ofsubsidiaries
InterestAccrual
ForeignExchangeVariation
Principal andInterestPayment
Others Gross Debton Jun/19
Gross Debt Evolution (R$ million)

Page 18 of 33
2Q19 EARNINGS RELEASE
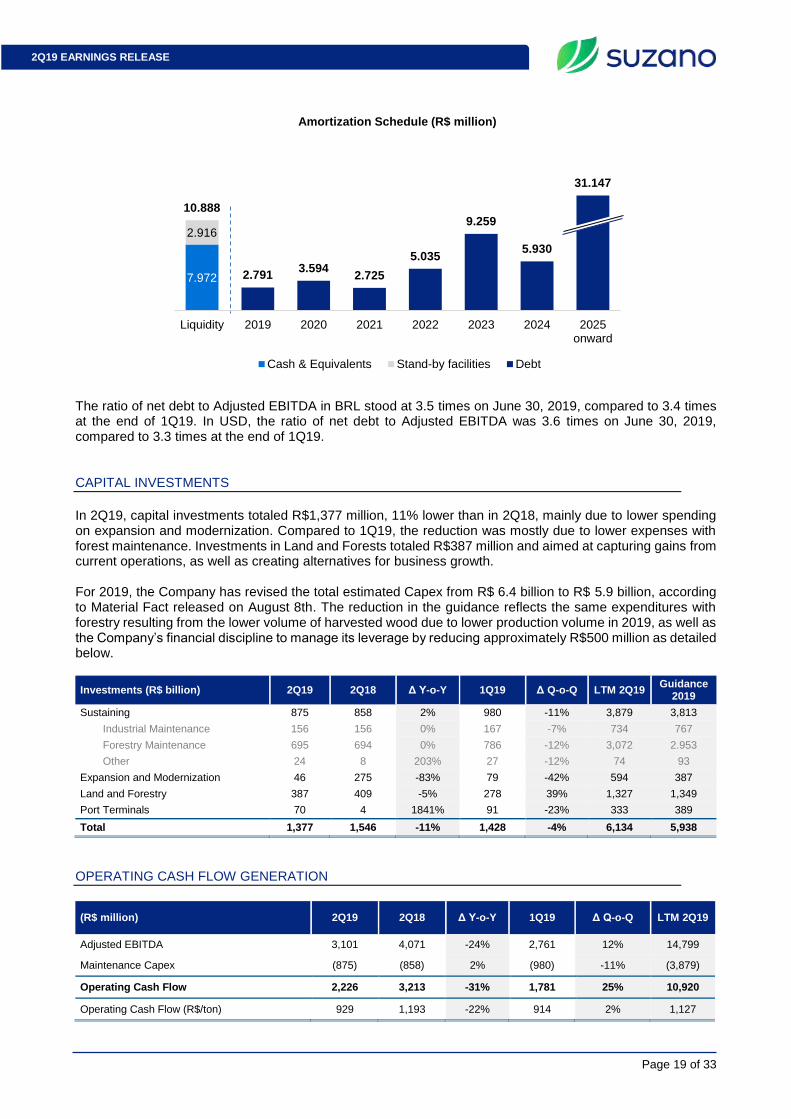
¹ Considers the portion of debt with swap to foreign currency. The original debt was 72% in USD and 28% in BRL. ² Agribusiness Receivables Certificates. Cash and cash equivalents at the end of June 30, 2019 amounted to R$7,972 million, 59% of them invested in local currency in government bonds and fixed income securities, and the balance in short-term investments abroad. The company has two stand-by credit facilities totaling R$ 2,916 million, available through 2024, with one line in local currency amounting to R$ 1 billion at a cost of CDI plus 2.5% p.a. when used (while not in use the cost in BRL is 0.40% p.a.) and the other in foreign currency, currently amounting to US$ 500 million at a cost of 3 month Libor plus 1.0% p.a., which could reach 2.50%, depending on the Company’s credit rating, when used (while not in use, the cost in USD is 0.30% p.a.). These funds, although untapped, help improve the company’s liquidity conditions. As a result, the current cash position of R$7,972 million plus these lines totaling R$2,916 million amounts to a readily available cash position of R$10,888 million. Accordingly, the ratio of cash (including the stand-by credit facilities) to short-term debt stood at 2.3 times on June 30, 2019.
Net debt stood at R$52.5 billion (US$13.8 billion) on June 30, 2019, compared to R$53.8 billion (US$13.7 billion) on March 31, 2019. The reduction is due to the increase in the cash position and the slight decrease in gross debt.
Export financing;
30%
Bond; 44%
Debenture; 8%
ARC²; 10%
BNDES; 5%
Others; 3%
Type Expousure
Libor; 7%
Fixed (US$); 84%
CDI; 1%
TJLP; 3%
Fixed (R$); 4%
Index Exposure
BRL6%
USD94%
Currency Exposure1
1,8 1,5 1,5
3,4 3,5
1,5 1,3 1,4
3,3 3,6
2Q18 3Q18 4Q18 1Q19 2Q19
Net Debt / Adjusted EBITDA in R$ and US$ (x)
R$ US$
23,737 23,570 24,372
53,806 52,508
6.156 5.887 6.290 6.290 6.290
2T18 3T18 4T18 1T19 2T19
Net Debt (R$ and US$ millions)
R$ US$
Page 19 of 33
2Q19 EARNINGS RELEASE
The ratio of net debt to Adjusted EBITDA in BRL stood at 3.5 times on June 30, 2019, compared to 3.4 times at the end of 1Q19. In USD, the ratio of net debt to Adjusted EBITDA was 3.6 times on June 30, 2019, compared to 3.3 times at the end of 1Q19.
CAPITAL INVESTMENTS
In 2Q19, capital investments totaled R$1,377 million, 11% lower than in 2Q18, mainly due to lower spending on expansion and modernization. Compared to 1Q19, the reduction was mostly due to lower expenses with forest maintenance. Investments in Land and Forests totaled R$387 million and aimed at capturing gains from current operations, as well as creating alternatives for business growth. For 2019, the Company has revised the total estimated Capex from R$ 6.4 billion to R$ 5.9 billion, according to Material Fact released on August 8th. The reduction in the guidance reflects the same expenditures with forestry resulting from the lower volume of harvested wood due to lower production volume in 2019, as well as the Company’s financial discipline to manage its leverage by reducing approximately R$500 million as detailed below.
Investments (R$ billion) 2Q19 2Q18 Δ Y-o-Y 1Q19 Δ Q-o-Q LTM 2Q19 Guidance
2019
Sustaining 875 858 2% 980 -11% 3,879 3,813
Industrial Maintenance 156 156 0% 167 -7% 734 767
Forestry Maintenance 695 694 0% 786 -12% 3,072 2.953
Other 24 8 203% 27 -12% 74 93
Expansion and Modernization 46 275 -83% 79 -42% 594 387
Land and Forestry 387 409 -5% 278 39% 1,327 1,349
Port Terminals 70 4 1841% 91 -23% 333 389
Total 1,377 1,546 -11% 1,428 -4% 6,134 5,938
OPERATING CASH FLOW GENERATION
(R$ million) 2Q19 2Q18 Δ Y-o-Y 1Q19 Δ Q-o-Q LTM 2Q19
Adjusted EBITDA 3,101 4,071 -24% 2,761 12% 14,799
Maintenance Capex (875) (858) 2% (980) -11% (3,879)
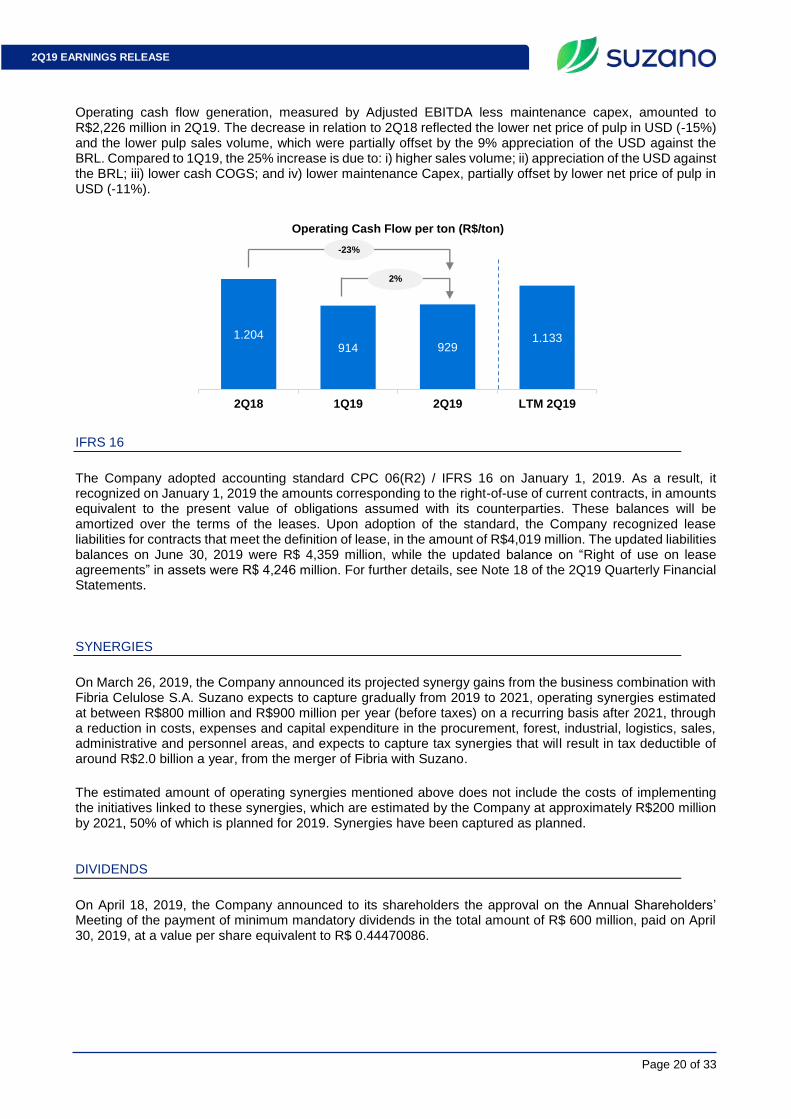
Operating Cash Flow 2,226 3,213 -31% 1,781 25% 10,920
Operating Cash Flow (R$/ton) 929 1,193 -22% 914 2% 1,127
7.972
2.916
10.888
2.7913.594
2.725
5.035
9.259
5.930
31.147
Liquidity 2019 2020 2021 2022 2023 2024 2025onward
Amortization Schedule (R$ million)
Cash & Equivalents Stand-by facilities Debt
Page 20 of 33
2Q19 EARNINGS RELEASE
Operating cash flow generation, measured by Adjusted EBITDA less maintenance capex, amounted to R$2,226 million in 2Q19. The decrease in relation to 2Q18 reflected the lower net price of pulp in USD (-15%) and the lower pulp sales volume, which were partially offset by the 9% appreciation of the USD against the BRL. Compared to 1Q19, the 25% increase is due to: i) higher sales volume; ii) appreciation of the USD against the BRL; iii) lower cash COGS; and iv) lower maintenance Capex, partially offset by lower net price of pulp in USD (-11%).
IFRS 16
The Company adopted accounting standard CPC 06(R2) / IFRS 16 on January 1, 2019. As a result, it recognized on January 1, 2019 the amounts corresponding to the right-of-use of current contracts, in amounts equivalent to the present value of obligations assumed with its counterparties. These balances will be amortized over the terms of the leases. Upon adoption of the standard, the Company recognized lease liabilities for contracts that meet the definition of lease, in the amount of R$4,019 million. The updated liabilities balances on June 30, 2019 were R$ 4,359 million, while the updated balance on “Right of use on lease agreements” in assets were R$ 4,246 million. For further details, see Note 18 of the 2Q19 Quarterly Financial Statements.
SYNERGIES
On March 26, 2019, the Company announced its projected synergy gains from the business combination with Fibria Celulose S.A. Suzano expects to capture gradually from 2019 to 2021, operating synergies estimated at between R$800 million and R$900 million per year (before taxes) on a recurring basis after 2021, through a reduction in costs, expenses and capital expenditure in the procurement, forest, industrial, logistics, sales, administrative and personnel areas, and expects to capture tax synergies that will result in tax deductible of around R$2.0 billion a year, from the merger of Fibria with Suzano.
The estimated amount of operating synergies mentioned above does not include the costs of implementing the initiatives linked to these synergies, which are estimated by the Company at approximately R$200 million by 2021, 50% of which is planned for 2019. Synergies have been captured as planned.
DIVIDENDS
On April 18, 2019, the Company announced to its shareholders the approval on the Annual Shareholders’ Meeting of the payment of minimum mandatory dividends in the total amount of R$ 600 million, paid on April 30, 2019, at a value per share equivalent to R$ 0.44470086.
1.204914 929
1.133
2Q18 1Q19 2Q19 LTM 2Q19
Operating Cash Flow per ton (R$/ton)
-23%
2%
Page 21 of 33
2Q19 EARNINGS RELEASE
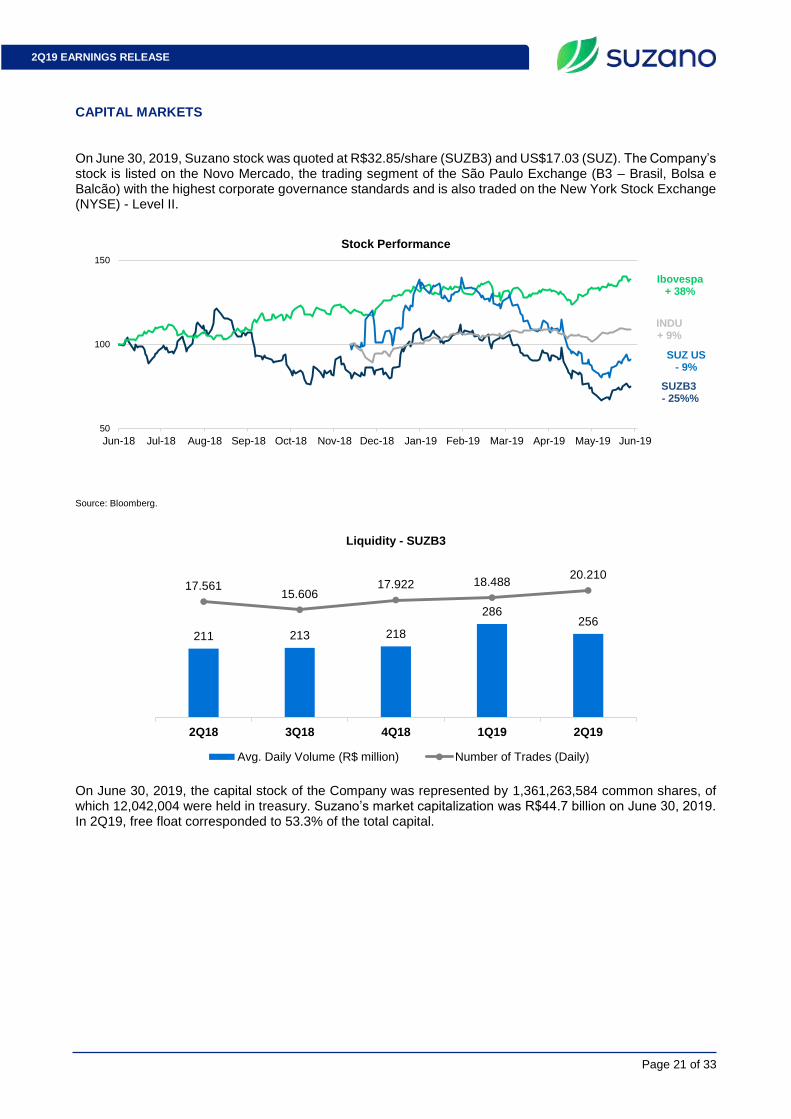
CAPITAL MARKETS On June 30, 2019, Suzano stock was quoted at R$32.85/share (SUZB3) and US$17.03 (SUZ). The Company’s stock is listed on the Novo Mercado, the trading segment of the São Paulo Exchange (B3 – Brasil, Bolsa e Balcão) with the highest corporate governance standards and is also traded on the New York Stock Exchange (NYSE) - Level II.
Source: Bloomberg.
On June 30, 2019, the capital stock of the Company was represented by 1,361,263,584 common shares, of which 12,042,004 were held in treasury. Suzano’s market capitalization was R$44.7 billion on June 30, 2019. In 2Q19, free float corresponded to 53.3% of the total capital.
50
100
150
Jun-18 Jul-18 Aug-18 Sep-18 Oct-18 Nov-18 Dec-18 Jan-19 Feb-19 Mar-19 Apr-19 May-19 Jun-19
Stock Performance
Ibovespa+ 38%
SUZB3- 25%%
SUZ US - 9%
INDU+ 9%
211 213 218
286256
17.56115.606
17.922 18.48820.210
-10.000
-5.000
0
5.000
10.000
15.000
20.000
25.000
0
50
100
150
200
250
300
350
400
450
2Q18 3Q18 4Q18 1Q19 2Q19
Liquidity - SUZB3
Avg. Daily Volume (R$ million) Number of Trades (Daily)

Page 22 of 33
2Q19 EARNINGS RELEASE
Free Float Distribution on 6/30/2019 Ownership structure (6/30/2019) (B3 + NYSE)
FIXED INCOME
Unit Jun/19 Mar/19 Jun/19
Suzano 2021 – Price USD/k 104.1 104.6 104.5
Suzano 2021 – Yield % 4.3 3.3 2.9
Fibria 2024 – Price USD/k 100.9 105.2 106.4
Fibria 2024 – Yield % 5.1 4.1 3.8
Fibria 2025 – Price USD/k 92.6 98.7 100.8
Fibria 2025 – Yield % 5.4 4.2 3.8
Suzano 2026 – Price USD/k 102.0 106.6 109.1
Suzano 2026 - Yield % 5.4 4.7 4.2
Fibria 2027 – Price USD/k 99.4 105.0 107.4
Fibria 2027 – Yield % 5.6 4.7 4.3
Suzano 2029 – Price USD/k - 106.5 109.1
Suzano 2029 - Yield % - 5.1 4.8
Suzano 2030 – Price USD/k - - 101.1
Suzano 2030 - Yield % - - 4.9
Suzano 2047 – Price USD/k 102.9 111.6 113.6
Suzano 2047 - Yield % 6.8 6.1 6.0
Treasury 10 years % 2.9 2.4 2.0
Note: Senior Notes issued with face value of 100 USD/k
RATING
Agency National Scale Global Scale Outlook
Fitch Ratings AAA BBB- Stable
Standard & Poor’s brAAA BBB- Stable
Moody’s Aaa.br Ba1 Stable
Local52%
Foreign48%
Institutional Investors93%
Individual Investors7%
Controlling Shareholders
; 46%
Treasury; 1%
BNDESPAR; 11%
Votorantim S.A.; 5%
Other Shareholders; 37%
Page 23 of 33
2Q19 EARNINGS RELEASE
UPCOMING EVENTS Earnings Conference Call (2Q19) Date: August 9, 2019 (Friday)
Portuguese (simultaneous translation) 10:00 a.m. (Brasília) 9:00 a.m. (New York) 2 p.m. (London) Tel.: +55 (11) 4003-4860
English 10 a.m. (Brasília) 9 a.m. (New York) 2 p.m. (London) Tel.: +1 866 890 2584 (access code: Suzano)
Please connect 10 minutes before the conference call is scheduled to begin.
The conference call will be held in English, feature a slide presentation and be transmitted simultaneously via webcast. The access links will be available on the Company’s Investor Relations website (www.suzano.com.br/ir).
If you are unable to participate, the webcast link will be available for future consultation on the Investor Relations website of Suzano S.A. IR CONTACTS Marcelo Bacci Camila Nogueira Danielle Cheade Roberto Costa Raimundo Guimarães Luiz Otávio Souza Fonseca Tel.: +55 (11) 3503-9330 [email protected] www.suzano.com.br/ir

Page 24 of 33
2Q19 EARNINGS RELEASE
APPENDICES APPENDIX 1² – Operating Data
Revenue breakdown (R$ '000)
2Q19 2Q18 Δ Y-o-Y 1Q19 Δ Q-o-Q 6M19 6M18 Δ Y-o-Y
Exports 5,402,279 6,623,977 -18% 4,385,794 23% 9,788,073 12,136,462 -19%
Pulp 4,975,200 6,312,858 -21% 4,096,451 21% 9,071,651 11,533,072 -21%
Paper 427,079 311,119 37% 289,343 48% 716,422 603,390 19%
Domestic Market 1,262,800 1,278,812 -1% 1,313,206 -4% 2,576,006 2,433,220 6%
Pulp 478,569 541,317 -12% 505,535 -5% 984,104 1,065,462 -8%
Paper 784,231 737,496 6% 807,672 -3% 1,591,902 1,367,757 16%
Total Net Revenue 6,665,082 7,902,789 -16% 5,699,000 17% 12,364,079 14,569,681 -15%
Pulp 5,453,769 6,854,175 -20% 4,601,986 19% 10,055,755 12,598,534 -20%
Paper 1,211,310 1,048,615 16% 1,097,014 10% 2,308,324 1,971,147 17%
Sales volume (tons)
2Q19 2Q18 Δ Y-o-Y 1Q19 Δ Q-o-Q 6M19 6M18 Δ Y-o-Y
Exports 2,126,088 2,417,082 -12% 1,604,730 32% 3,730,817 4,724,386 -21%
Pulp 2,013,287 2,329,866 -14% 1,527,621 32% 3,540,907 4,541,818 -22%
Paper 112,801 87,215 29% 77,109 46% 189,910 182,568 4%
Paperboard 15,691 12,279 28% 10,940 43% 26,631 26,611 0%
Printing & Writing
97,110 74,936 30% 65,855 47% 162,209 155,957 4%
Domestic Market 388,334 434,724 -11% 398,574 -3% 786,908 878,400 -10%
Pulp 200,598 239,656 -16% 201,462 0% 402,060 494,644 -19%
Paper 187,736 195,067 -4% 197,112 -5% 384,848 383,755 0%
Paperboard 32,866 30,139 9% 30,174 9% 63,040 60,160 5%
Printing & Writing
133,459 143,457 -7% 145,321 -8% 278,781 291,822 -4%
Other paper1 21,410 21,471 0% 21,617 -1% 43,027 31,774 35%
Total sales volume
2,514,422 2,853,132 -12% 2,003,304 26% 4,517,726 5,604,113 -19%
Pulp 2,213,885 2,569,523 -14% 1,729,082 28% 3,942,967 5,036,462 -22%
Paper 300,537 283,610 6% 274,222 10% 574,759 567,651 1%
Paperboard 48,557 42,418 14% 41,114 18% 89,671 86,771 3%
Printing & Writing
229,814 218,393 5% 211,177 9% 440,990 447,779 -2%
Other paper1 22,166 22,798 -3% 21,931 1% 44,097 33,101 33%
Average net price (R$/ton)
2Q19 2Q18 Δ Y-o-Y 1Q19 Δ Q-o-Q 6M19 6M18 Δ Y-o-Y
Exports 2,541 2,740 -7% 2,733 -7% 2,624 2,569 2%
Pulp 2,471 2,710 -9% 2,682 -8% 2,562 2,539 1%
Paper 3,786 3,567 6% 3,752 1% 3,772 3,305 14%
Domestic Market 3,252 2,942 11% 3,295 -1% 3,274 2,770 18%
Pulp 2,386 2,259 6% 2,509 -5% 2,448 2,154 14%
Paper 4,177 3,781 10% 4,098 2% 4,136 3,564 16%
Total 2,651 2,770 -4% 2,845 -7% 2,737 2,600 5%
Pulp 2,463 2,667 -8% 2,662 -7% 2,550 2,501 2%
Paper 4,030 3,697 9% 4,000 1% 4,016 3,472 16%

Page 25 of 33
2Q19 EARNINGS RELEASE
Average net price (US$/ton) 2Q19 2Q18 Δ Y-o-Y 1Q19 Δ Q-o-Q 6M19 6M18 Δ Y-o-Y
Exports 648 760 -15% 725 -11% 696 792 -12%
Pulp 631 751 -16% 711 -11% 679 783 -13%
Paper 966 989 -2% 995 -3% 1,000 1,019 -2%
Domestic Market 830 816 2% 874 -5% 868 854 2%
Pulp 609 626 -3% 665 -9% 649 664 -2%
Paper 1,066 1,049 2% 1,087 -2% 1,097 1,099 0%
Total 676 768 -12% 754 -10% 726 801 -9%
Pulp 629 740 -15% 706 -11% 676 771 -12%
Paper 1,028 1,025 0% 1,061 -3% 1,065 1,071 -1%
¹ Paper of other manufacturers sold by Suzano and tissue paper. ² Comparison data with 2018 (2Q18, 6M18 and LTM) are a simple sum or weighted average of Suzano + Fibria.
Taxa R$/US$ 2Q19 2Q18 Δ Y-o-Y 1Q19 Δ Q-o-Q
Closing 3.83 3.86 -1% 3.90 -2%
Average 3.92 3.61 9% 3.77 4%
Page 26 of 33
2Q19 EARNINGS RELEASE
APPENDIX 2² – Consolidated Statement of Income
Demonstração de Resultado (R$ mil)
2Q19 2Q18 Δ Y-o-Y 1Q19 Δ Q-o-Q 6M19 6M18 Δ Y-o-Y
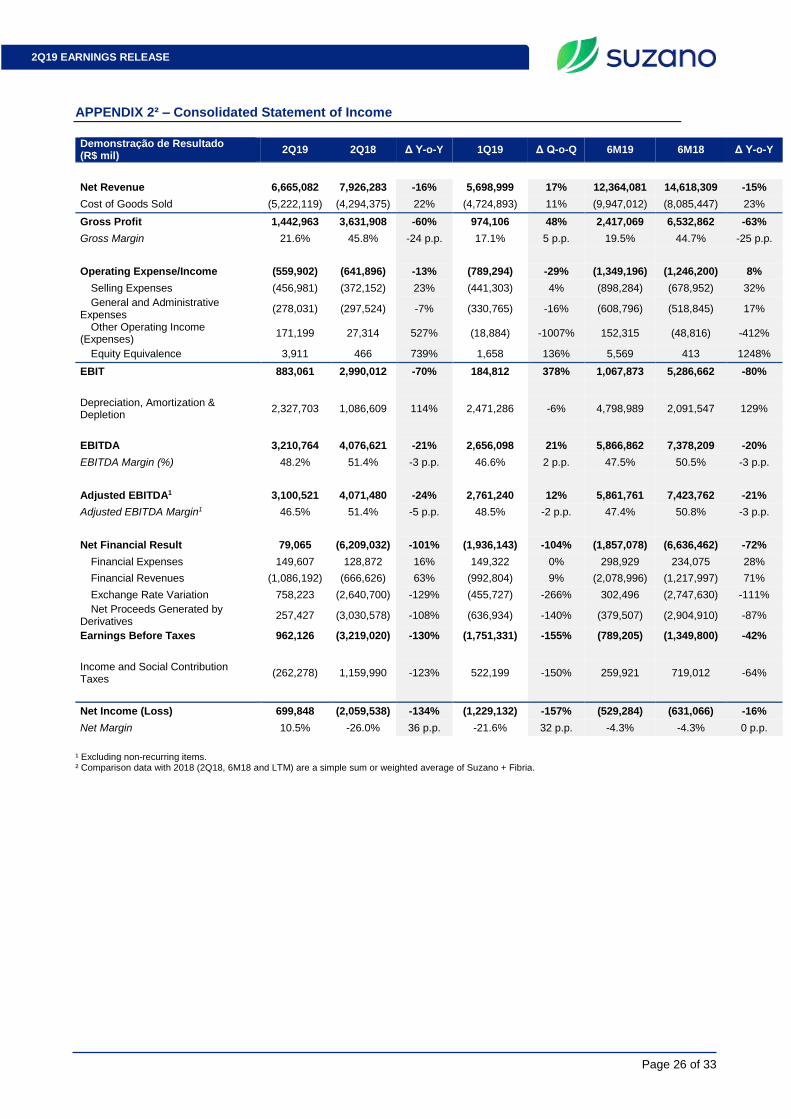
Net Revenue 6,665,082 7,926,283 -16% 5,698,999 17% 12,364,081 14,618,309 -15%
Cost of Goods Sold (5,222,119) (4,294,375) 22% (4,724,893) 11% (9,947,012) (8,085,447) 23%
Gross Profit 1,442,963 3,631,908 -60% 974,106 48% 2,417,069 6,532,862 -63%
Gross Margin 21.6% 45.8% -24 p.p. 17.1% 5 p.p. 19.5% 44.7% -25 p.p.
Operating Expense/Income (559,902) (641,896) -13% (789,294) -29% (1,349,196) (1,246,200) 8%
Selling Expenses (456,981) (372,152) 23% (441,303) 4% (898,284) (678,952) 32%
General and Administrative Expenses
(278,031) (297,524) -7% (330,765) -16% (608,796) (518,845) 17%
Other Operating Income (Expenses)
171,199 27,314 527% (18,884) -1007% 152,315 (48,816) -412%
Equity Equivalence 3,911 466 739% 1,658 136% 5,569 413 1248%
EBIT 883,061 2,990,012 -70% 184,812 378% 1,067,873 5,286,662 -80%
Depreciation, Amortization & Depletion
2,327,703 1,086,609 114% 2,471,286 -6% 4,798,989 2,091,547 129%
EBITDA 3,210,764 4,076,621 -21% 2,656,098 21% 5,866,862 7,378,209 -20%
EBITDA Margin (%) 48.2% 51.4% -3 p.p. 46.6% 2 p.p. 47.5% 50.5% -3 p.p.
Adjusted EBITDA1 3,100,521 4,071,480 -24% 2,761,240 12% 5,861,761 7,423,762 -21%
Adjusted EBITDA Margin1 46.5% 51.4% -5 p.p. 48.5% -2 p.p. 47.4% 50.8% -3 p.p.
Net Financial Result 79,065 (6,209,032) -101% (1,936,143) -104% (1,857,078) (6,636,462) -72%
Financial Expenses 149,607 128,872 16% 149,322 0% 298,929 234,075 28%
Financial Revenues (1,086,192) (666,626) 63% (992,804) 9% (2,078,996) (1,217,997) 71%
Exchange Rate Variation 758,223 (2,640,700) -129% (455,727) -266% 302,496 (2,747,630) -111%
Net Proceeds Generated by Derivatives
257,427 (3,030,578) -108% (636,934) -140% (379,507) (2,904,910) -87%
Earnings Before Taxes 962,126 (3,219,020) -130% (1,751,331) -155% (789,205) (1,349,800) -42%
Income and Social Contribution Taxes
(262,278) 1,159,990 -123% 522,199 -150% 259,921 719,012 -64%
Net Income (Loss) 699,848 (2,059,538) -134% (1,229,132) -157% (529,284) (631,066) -16%
Net Margin 10.5% -26.0% 36 p.p. -21.6% 32 p.p. -4.3% -4.3% 0 p.p.
¹ Excluding non-recurring items. ² Comparison data with 2018 (2Q18, 6M18 and LTM) are a simple sum or weighted average of Suzano + Fibria.
Page 27 of 33
2Q19 EARNINGS RELEASE
APPENDIX 3¹ – Consolidated Balance Sheet
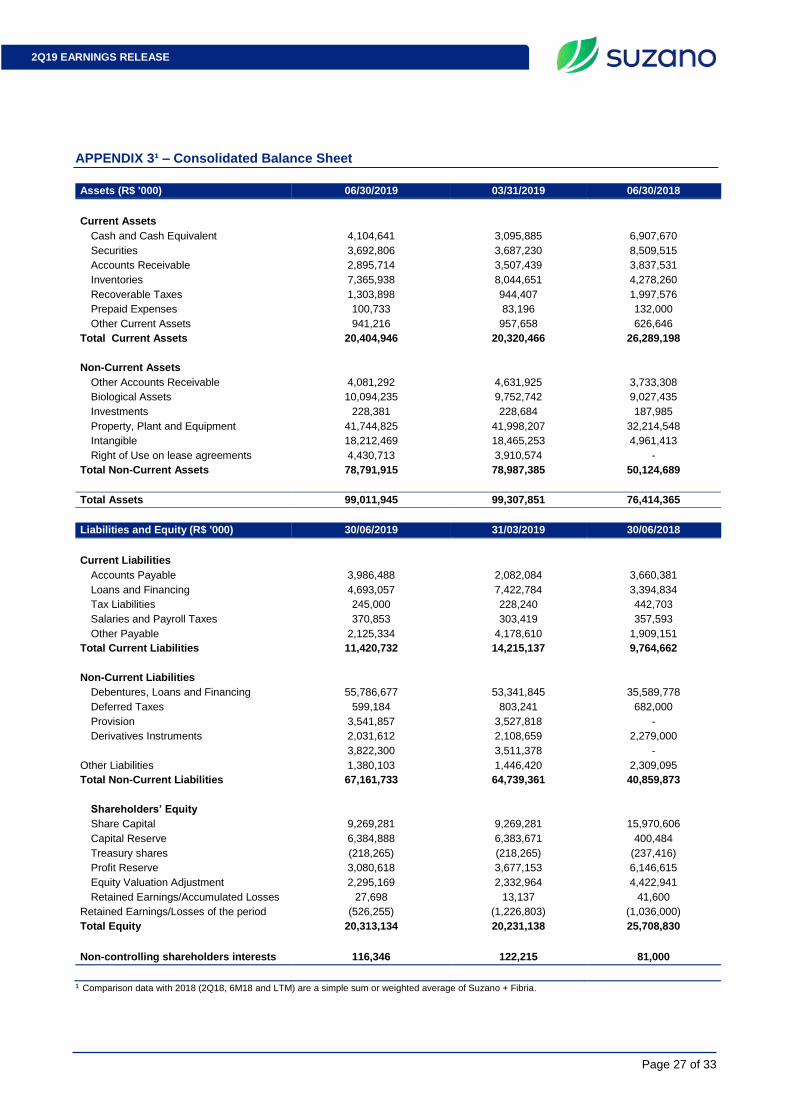
Assets (R$ '000) 06/30/2019 03/31/2019 06/30/2018
Current Assets
Cash and Cash Equivalent 4,104,641 3,095,885 6,907,670
Securities 3,692,806 3,687,230 8,509,515
Accounts Receivable 2,895,714 3,507,439 3,837,531
Inventories 7,365,938 8,044,651 4,278,260
Recoverable Taxes 1,303,898 944,407 1,997,576
Prepaid Expenses 100,733 83,196 132,000
Other Current Assets 941,216 957,658 626,646
Total Current Assets 20,404,946 20,320,466 26,289,198
Non-Current Assets
Other Accounts Receivable 4,081,292 4,631,925 3,733,308
Biological Assets 10,094,235 9,752,742 9,027,435
Investments 228,381 228,684 187,985
Property, Plant and Equipment 41,744,825 41,998,207 32,214,548
Intangible 18,212,469 18,465,253 4,961,413
Right of Use on lease agreements 4,430,713 3,910,574 -
Total Non-Current Assets 78,791,915 78,987,385 50,124,689
Total Assets 99,011,945 99,307,851 76,414,365
Liabilities and Equity (R$ '000) 30/06/2019 31/03/2019 30/06/2018
Current Liabilities
Accounts Payable 3,986,488 2,082,084 3,660,381
Loans and Financing 4,693,057 7,422,784 3,394,834
Tax Liabilities 245,000 228,240 442,703
Salaries and Payroll Taxes 370,853 303,419 357,593
Other Payable 2,125,334 4,178,610 1,909,151
Total Current Liabilities 11,420,732 14,215,137 9,764,662
Non-Current Liabilities
Debentures, Loans and Financing 55,786,677 53,341,845 35,589,778
Deferred Taxes 599,184 803,241 682,000
Provision 3,541,857 3,527,818 -
Derivatives Instruments 2,031,612 2,108,659 2,279,000 3,822,300 3,511,378 -
Other Liabilities 1,380,103 1,446,420 2,309,095
Total Non-Current Liabilities 67,161,733 64,739,361 40,859,873
Shareholders’ Equity
Share Capital 9,269,281 9,269,281 15,970,606
Capital Reserve 6,384,888 6,383,671 400,484
Treasury shares (218,265) (218,265) (237,416)
Profit Reserve 3,080,618 3,677,153 6,146,615
Equity Valuation Adjustment 2,295,169 2,332,964 4,422,941
Retained Earnings/Accumulated Losses 27,698 13,137 41,600
Retained Earnings/Losses of the period (526,255) (1,226,803) (1,036,000)
Total Equity 20,313,134 20,231,138 25,708,830
Non-controlling shareholders interests 116,346 122,215 81,000
¹ Comparison data with 2018 (2Q18, 6M18 and LTM) are a simple sum or weighted average of Suzano + Fibria.

Page 28 of 33
2Q19 EARNINGS RELEASE
APPENDIX 4¹ – Consolidated Statement of Cash Flow
Cash Flow Statement (R$ '000) 2Q19 2Q18 6M19 6M18
Cash flow from operating activities
Net income/(loss) for the period 699,848 (2,059,030) (529,284) (630,788)
Depreciation, depletion and amortization (Note 26) 915,830 1,086,608 1,779,304 2,091,183
Depletion of wood resources from forestry partnership programs 9,919 - 18,905 -
Fair value adjustment on business combination with Fibria - Amortization (Note 26) 1,257,905 - 2,824,553 -
Fair value adjustment on business combination with Facepa - Amortization (Note 26) 4,579 - 8,797 -
Amortization of lease-use right 35,930 - 63,889 -
Interest expense on lease liabilities 58,278 - 96,993 -
Provision for losses and write-off with fixed and biological assets - 3,317 - 12,299
Results from sale and disposals of property, plant and equipment and biological assets, net
14,792 21,678 3,504 30,423
Equity in earnings of subsidiaries (Note 13 (a) e (c)) (3,910) (465) (5,568) (428)
Exchange rate and monetary variations, net (758,223) 2,804,015 (302,496) 2,899,192
Interest expenses with financing and loans and debentures, net 850,652 387,187 1,674,610 775,761
Accrual of interest on financial investments (19,006) - (247,053) -
Amortization of the cost of funding, goodwill and negative goodwill 128,282 - 159,856 -
Derivative (gains) losses, net (Note 23) (257,427) 3,030,578 379,507 2,904,910
Fair value adjustment of biological assets (83,453) (95,661) (83,453) (95,661)
Deferred income tax and social contribution expenses (Note 11.1) 199,949 (1,385,086) (451,499) (1,041,867)
Interest on employee benefits (Note 20.2) 13,421 8,617 26,842 17,234
Provision/ (Reversal) for judicial liabilities 12,771 27,727 2,475 27,960
Allowance for doubtful accounts, net (17,652) (1,369) (9,928) 4,923
Reversal for rebates - 27,903 - 11,286
Estimated loss (reversal) in inventories and write-offs (10,289) 21,418 (12,028) 18,373
Reduction of financial investments - - - -
Provision for loss of ICMS credits, net 32,128 41,116 69,191 74,976
Provision for stock-based compensation plan - 57,395 - 76,657
Other provisions 1,515 5,449 66,742 8,609
Decrease (increase) in assets
Related parties (2,178) - (2,178) -
Trade accounts receivable 735,765 39,201 1,067,666 (58,004)
Inventories (265,885) (318,503) (1,208,554) (786,660)
Recoverable taxes (76,777) (122,170) (18,032) (140,299)
Other assets (38,541) 39,318 46,023 (163,256)
Increase (decrease) in liabilities
Related parties 57,322 - 57,322 -
Trade accounts payables (441,206) 347,180 (366,119) (317,191)
Taxes payable 7,065 413,961 252,757 321,507
Payroll and charges 69,611 - (262,909) -
Other liabilities (45,600) 155,348 (350,419) 376,611
Cash provided by operations
Payment of interest with financing and loans and debentures (678,936) (434,945) (1,462,681) (829,369)
Interest received from financial investments 110,865 25,901 285,922 78,815
Payment of other taxes and contributions - (84,171) - (238,652)
Payment of income taxes (94,280) (63,035) (405,257) (83,092)
Net cash from operating activities 2,423,064 3,979,482 3,167,400 5,345,452
Cash flow from investing activities
Derivative transactions settled - (8,653) - 28,909
Additions to fixed assets, intangible assets and biological assets (1,108,340) (1,936,838) (2,655,950) (3,072,724)
Proceeds from sale of assets 49,762 20,916 83,695 33,995
Increase of capital in subsidiaries and associates (Note 13 c)) - - (11,216) -
Financial investments 76,774 (4,065,088) 21,833,286 (4,179,291)
Advance for acquisition of wood from operations with development (non-current) (85,284) - (212,150) -
Acquisition of subsidiaries, net cash 1 (6,032) (26,002,54
0) (315,904)
Other investments (269) - (269) -
Net cash (used in) / provided by investment activities (1,067,356) (5,995,695) (6,965,144) (7,483,579)
Page 29 of 33
2Q19 EARNINGS RELEASE
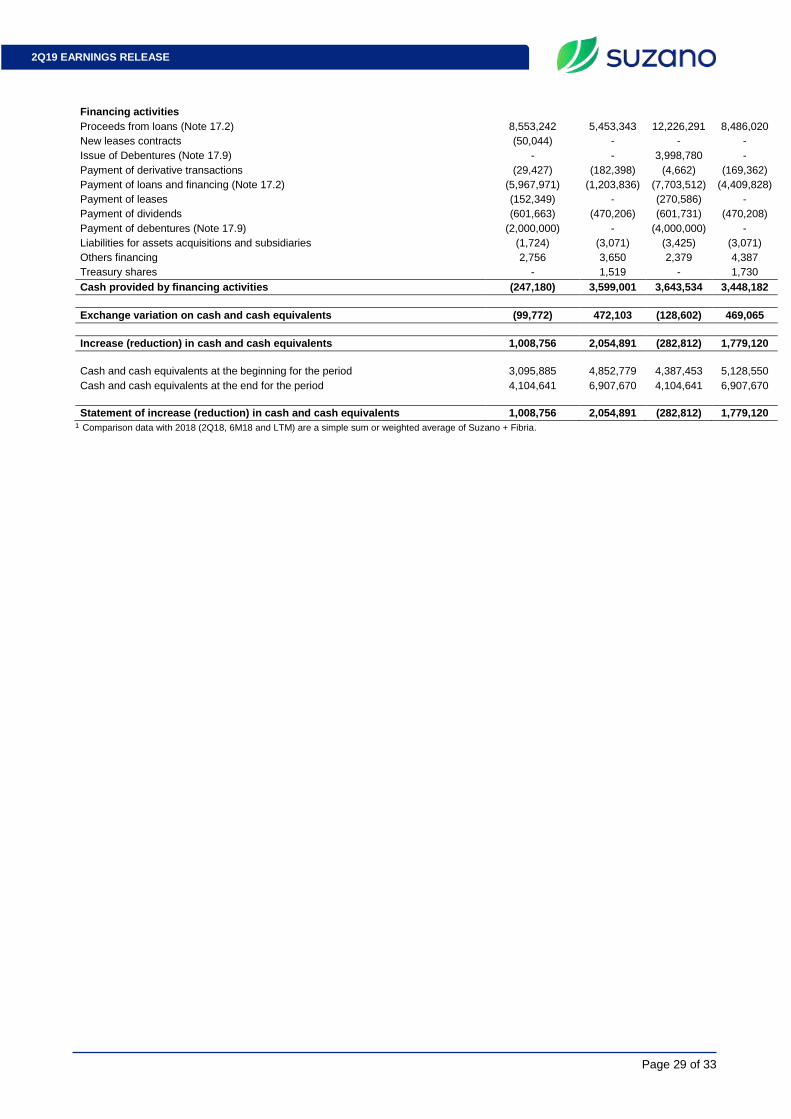
Financing activities
Proceeds from loans (Note 17.2) 8,553,242 5,453,343 12,226,291 8,486,020
New leases contracts (50,044) - - -
Issue of Debentures (Note 17.9) - - 3,998,780 -
Payment of derivative transactions (29,427) (182,398) (4,662) (169,362)
Payment of loans and financing (Note 17.2) (5,967,971) (1,203,836) (7,703,512) (4,409,828)
Payment of leases (152,349) - (270,586) -
Payment of dividends (601,663) (470,206) (601,731) (470,208)
Payment of debentures (Note 17.9) (2,000,000) - (4,000,000) -
Liabilities for assets acquisitions and subsidiaries (1,724) (3,071) (3,425) (3,071)
Others financing 2,756 3,650 2,379 4,387
Treasury shares - 1,519 - 1,730
Cash provided by financing activities (247,180) 3,599,001 3,643,534 3,448,182
Exchange variation on cash and cash equivalents (99,772) 472,103 (128,602) 469,065
Increase (reduction) in cash and cash equivalents 1,008,756 2,054,891 (282,812) 1,779,120
Cash and cash equivalents at the beginning for the period 3,095,885 4,852,779 4,387,453 5,128,550
Cash and cash equivalents at the end for the period 4,104,641 6,907,670 4,104,641 6,907,670
Statement of increase (reduction) in cash and cash equivalents 1,008,756 2,054,891 (282,812) 1,779,120
¹ Comparison data with 2018 (2Q18, 6M18 and LTM) are a simple sum or weighted average of Suzano + Fibria.
Page 30 of 33
2Q19 EARNINGS RELEASE
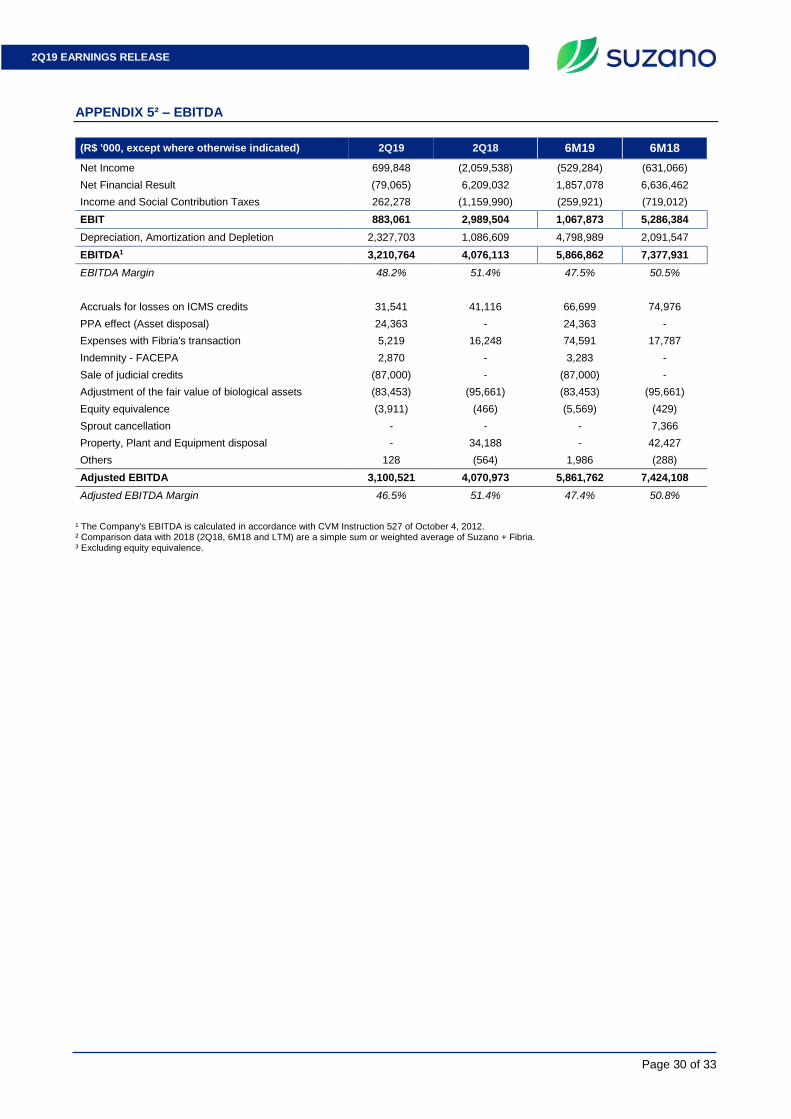
APPENDIX 5² – EBITDA
(R$ '000, except where otherwise indicated) 2Q19 2Q18 6M19 6M18
Net Income 699,848 (2,059,538) (529,284) (631,066)
Net Financial Result (79,065) 6,209,032 1,857,078 6,636,462
Income and Social Contribution Taxes 262,278 (1,159,990) (259,921) (719,012)
EBIT 883,061 2,989,504 1,067,873 5,286,384
Depreciation, Amortization and Depletion 2,327,703 1,086,609 4,798,989 2,091,547
EBITDA1 3,210,764 4,076,113 5,866,862 7,377,931
EBITDA Margin 48.2% 51.4% 47.5% 50.5%
Accruals for losses on ICMS credits 31,541 41,116 66,699 74,976
PPA effect (Asset disposal) 24,363 - 24,363 -
Expenses with Fibria's transaction 5,219 16,248 74,591 17,787
Indemnity - FACEPA 2,870 - 3,283 -
Sale of judicial credits (87,000) - (87,000) -
Adjustment of the fair value of biological assets (83,453) (95,661) (83,453) (95,661)
Equity equivalence (3,911) (466) (5,569) (429)
Sprout cancellation - - - 7,366
Property, Plant and Equipment disposal - 34,188 - 42,427
Others 128 (564) 1,986 (288)
Adjusted EBITDA 3,100,521 4,070,973 5,861,762 7,424,108
Adjusted EBITDA Margin 46.5% 51.4% 47.4% 50.8%
¹ The Company's EBITDA is calculated in accordance with CVM Instruction 527 of October 4, 2012. ² Comparison data with 2018 (2Q18, 6M18 and LTM) are a simple sum or weighted average of Suzano + Fibria. ³ Excluding equity equivalence.
Page 31 of 33
2Q19 EARNINGS RELEASE
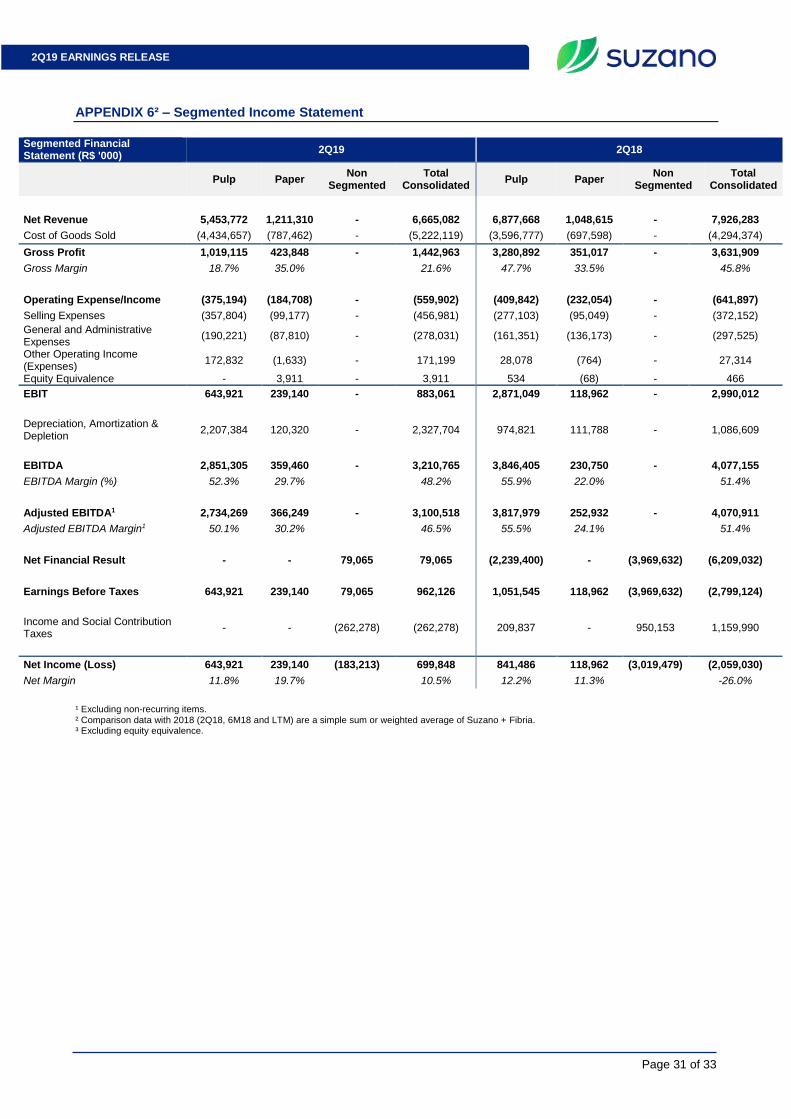
APPENDIX 6² – Segmented Income Statement
Segmented Financial Statement (R$ '000)
2Q19 2Q18
Pulp Paper Non
Segmented Total
Consolidated Pulp Paper
Non Segmented
Total Consolidated
Net Revenue 5,453,772 1,211,310 - 6,665,082 6,877,668 1,048,615 - 7,926,283
Cost of Goods Sold (4,434,657) (787,462) - (5,222,119) (3,596,777) (697,598) - (4,294,374)
Gross Profit 1,019,115 423,848 - 1,442,963 3,280,892 351,017 - 3,631,909
Gross Margin 18.7% 35.0% 21.6% 47.7% 33.5% 45.8%
Operating Expense/Income (375,194) (184,708) - (559,902) (409,842) (232,054) - (641,897)
Selling Expenses (357,804) (99,177) - (456,981) (277,103) (95,049) - (372,152)
General and Administrative Expenses
(190,221) (87,810) - (278,031) (161,351) (136,173) - (297,525)
Other Operating Income (Expenses)
172,832 (1,633) - 171,199 28,078 (764) - 27,314
Equity Equivalence - 3,911 - 3,911 534 (68) - 466
EBIT 643,921 239,140 - 883,061 2,871,049 118,962 - 2,990,012
Depreciation, Amortization & Depletion
2,207,384 120,320 - 2,327,704 974,821 111,788 - 1,086,609
EBITDA 2,851,305 359,460 - 3,210,765 3,846,405 230,750 - 4,077,155
EBITDA Margin (%) 52.3% 29.7% 48.2% 55.9% 22.0% 51.4%
Adjusted EBITDA1 2,734,269 366,249 - 3,100,518 3,817,979 252,932 - 4,070,911
Adjusted EBITDA Margin1 50.1% 30.2% 46.5% 55.5% 24.1% 51.4%
Net Financial Result - - 79,065 79,065 (2,239,400) - (3,969,632) (6,209,032)
Earnings Before Taxes 643,921 239,140 79,065 962,126 1,051,545 118,962 (3,969,632) (2,799,124)
Income and Social Contribution Taxes
- - (262,278) (262,278) 209,837 - 950,153 1,159,990
Net Income (Loss) 643,921 239,140 (183,213) 699,848 841,486 118,962 (3,019,479) (2,059,030)
Net Margin 11.8% 19.7% 10.5% 12.2% 11.3% -26.0%
¹ Excluding non-recurring items. ² Comparison data with 2018 (2Q18, 6M18 and LTM) are a simple sum or weighted average of Suzano + Fibria. ³ Excluding equity equivalence.
Page 32 of 33
2Q19 EARNINGS RELEASE
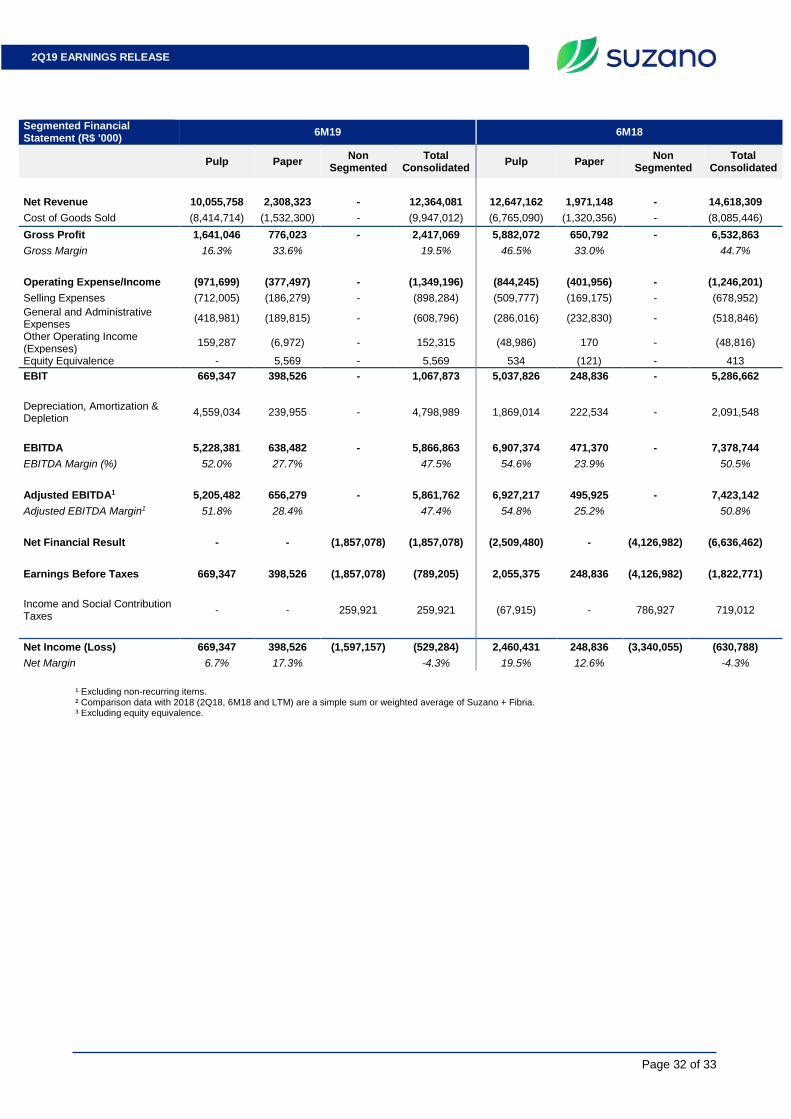
Segmented Financial Statement (R$ '000)
6M19 6M18
Pulp Paper Non
Segmented Total
Consolidated Pulp Paper
Non Segmented
Total Consolidated
Net Revenue 10,055,758 2,308,323 - 12,364,081 12,647,162 1,971,148 - 14,618,309
Cost of Goods Sold (8,414,714) (1,532,300) - (9,947,012) (6,765,090) (1,320,356) - (8,085,446)
Gross Profit 1,641,046 776,023 - 2,417,069 5,882,072 650,792 - 6,532,863
Gross Margin 16.3% 33.6% 19.5% 46.5% 33.0% 44.7%
Operating Expense/Income (971,699) (377,497) - (1,349,196) (844,245) (401,956) - (1,246,201)
Selling Expenses (712,005) (186,279) - (898,284) (509,777) (169,175) - (678,952)
General and Administrative Expenses
(418,981) (189,815) - (608,796) (286,016) (232,830) - (518,846)
Other Operating Income (Expenses)
159,287 (6,972) - 152,315 (48,986) 170 - (48,816)
Equity Equivalence - 5,569 - 5,569 534 (121) - 413
EBIT 669,347 398,526 - 1,067,873 5,037,826 248,836 - 5,286,662
Depreciation, Amortization & Depletion
4,559,034 239,955 - 4,798,989 1,869,014 222,534 - 2,091,548
EBITDA 5,228,381 638,482 - 5,866,863 6,907,374 471,370 - 7,378,744
EBITDA Margin (%) 52.0% 27.7% 47.5% 54.6% 23.9% 50.5%
Adjusted EBITDA1 5,205,482 656,279 - 5,861,762 6,927,217 495,925 - 7,423,142
Adjusted EBITDA Margin1 51.8% 28.4% 47.4% 54.8% 25.2% 50.8%
Net Financial Result - - (1,857,078) (1,857,078) (2,509,480) - (4,126,982) (6,636,462)
Earnings Before Taxes 669,347 398,526 (1,857,078) (789,205) 2,055,375 248,836 (4,126,982) (1,822,771)
Income and Social Contribution Taxes
- - 259,921 259,921 (67,915) - 786,927 719,012
Net Income (Loss) 669,347 398,526 (1,597,157) (529,284) 2,460,431 248,836 (3,340,055) (630,788)
Net Margin 6.7% 17.3% -4.3% 19.5% 12.6% -4.3%
¹ Excluding non-recurring items. ² Comparison data with 2018 (2Q18, 6M18 and LTM) are a simple sum or weighted average of Suzano + Fibria. ³ Excluding equity equivalence.
Page 33 of 33
2Q19 EARNINGS RELEASE
Forward-Looking Statements This release may contain forward-looking statements. Such statements are subject to known and unknown risks and uncertainties that could cause the expectations expressed to not materialize or differ substantially from expected results. These risks include, among others, changes in future demand for the Company’s products, changes in factors affecting domestic and international product prices, changes in the cost structure, changes in the seasonal patterns of markets, changes in prices charged by competitors, foreign exchange variations, changes in the political or economic situation of Brazil, as well as emerging and international markets. The forward-looking statements were not reviewed by our independent auditors.