Embed Size (px)
Citation preview
0
2Q13 Earnings Release
July 24th 2013
All information regarding management performance and financial results of LG Electronics (the “Company”) during the 2nd
quarter of 2013 as contained herein has been prepared on a consolidated basis in accordance with International Financial
Reporting Standards (“IFRS”). Please note that starting from January 1, 2013, the Company accounted LG Innotek as a
consolidated subsidiary of the Company pursuant to the enactment of K-IFRS 1110, 'Consolidated Financial Statements'. The
comparative consolidated financial data are restated accordingly.
In addition, the information regarding results of 2nd quarter of 2013 has been prepared in advance, prior to being reviewed by
outside auditors, solely for the convenience of investors of the Company, and is subject to change in the process of final
reviewing by external auditors.
The information contained herein includes forward-looking statements in respect to future plans, prospects, and performances
of the Company as well as the Company‟s projected sales plan for 3rd quarter of 2013. These forward-looking statements also
refer to the Company‟s performance on consolidated base, as indicated.
The aforementioned forward-looking statements are influenced by changes in the management environment and relative
events, and by their nature, these statements refer to uncertain circumstances. Consequently, due to these uncertainties, the
Company‟s actual future results may differ materially from those expressed or implied by such statements.
Please note that as the forward-looking statements contained herein are based on the current market situation and the
Company‟s management direction, they are subject to change according to the changes in future market environment and
business strategy.
The information contained herein should not be utilized for any legal purposes in regards to investors‟ investment results. The
Company hereby expressly disclaims any and all liability for any loss or damage resulting from the investors‟ reliance on the
information contained herein.
Ⅰ. Overview
Ⅱ. 2Q13 Results (Consolidated)
Ⅲ. Performance and Outlook by Sector
Table of Contents
Ⅰ. Overview
1
Comment on 2Q13 Results
Comment on 3Q13 Outlook
2Q13 Results
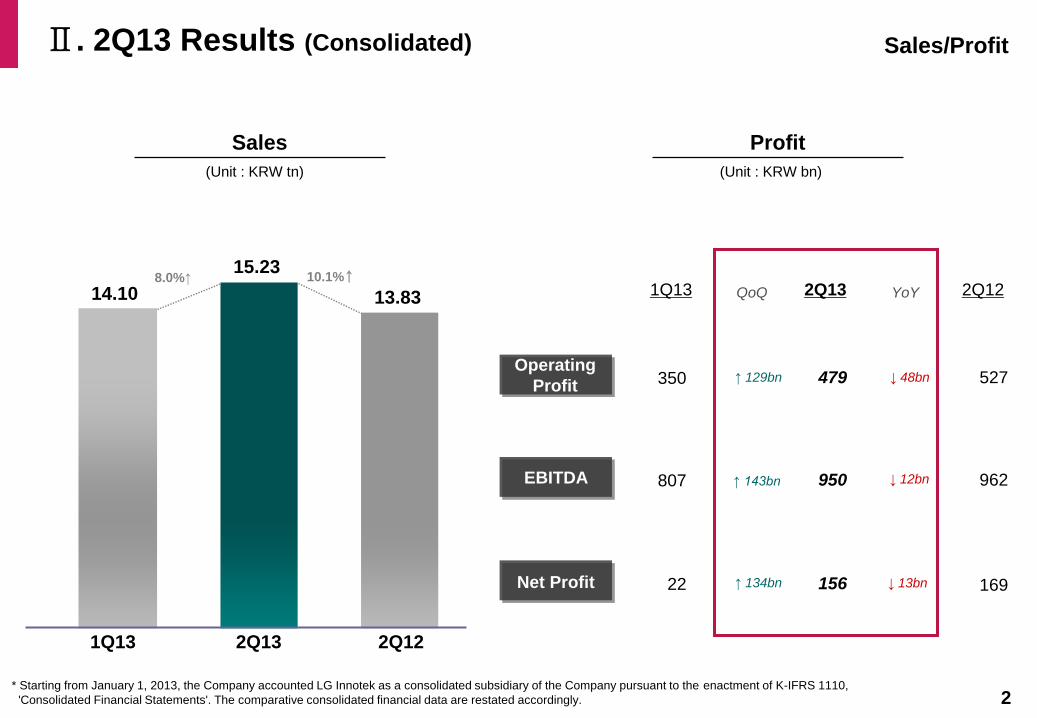
Ⅱ. 2Q13 Results (Consolidated)
2
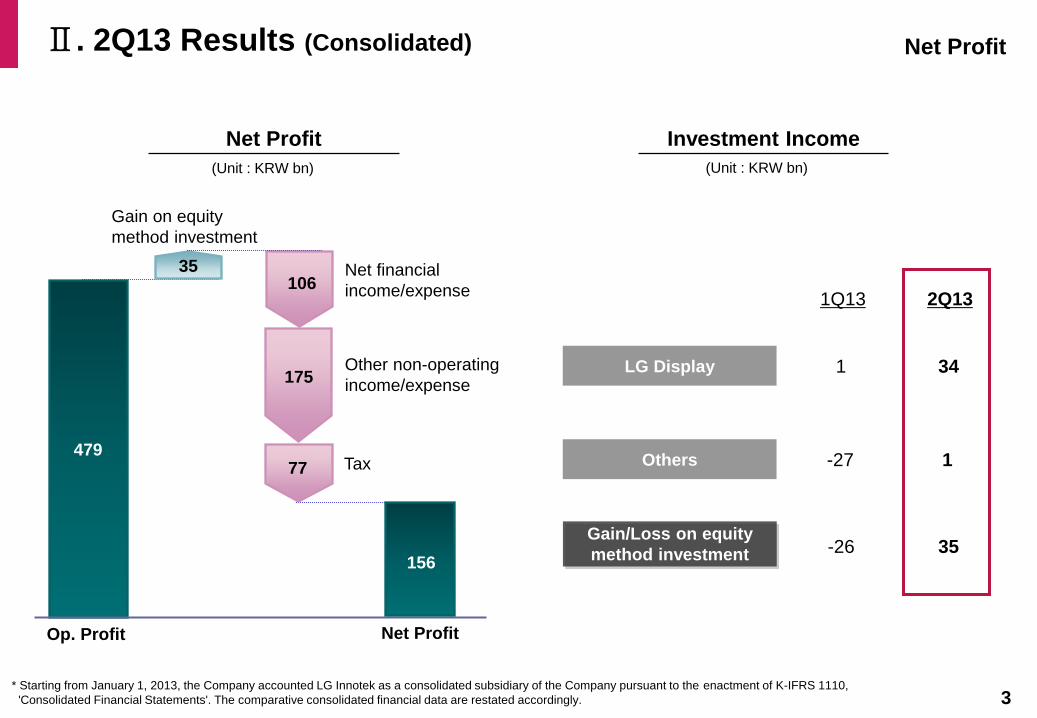
Net Profit
Operating
Profit
EBITDA
8.0%↑
14.10 13.83
15.23
2Q12 1Q13 2Q13
10.1%↑ 2Q13 2Q12
479
156
950
1Q13 QoQ YoY
527
962
169
↑ 129bn ↓ 48bn
↓ 12bn
↓ 13bn
350
22
807 ↑ 143bn
↑ 134bn
Sales/Profit
Profit
(Unit : KRW bn)
Sales
(Unit : KRW tn)
* Starting from January 1, 2013, the Company accounted LG Innotek as a consolidated subsidiary of the Company pursuant to the enactment of K-IFRS 1110,
'Consolidated Financial Statements'. The comparative consolidated financial data are restated accordingly.
Ⅱ. 2Q13 Results (Consolidated)
3
LG Display
Others
Gain/Loss on equity
method investment
2Q13
34
35
1 479
175
77
106
156
1Q13
1
-26
-27
35
Net Profit
Net Profit Op. Profit
Gain on equity
method investment
Other non-operating
income/expense
Net financial
income/expense
Tax
* Starting from January 1, 2013, the Company accounted LG Innotek as a consolidated subsidiary of the Company pursuant to the enactment of K-IFRS 1110,
'Consolidated Financial Statements'. The comparative consolidated financial data are restated accordingly.
Net Profit Investment Income
(Unit : KRW bn) (Unit : KRW bn)
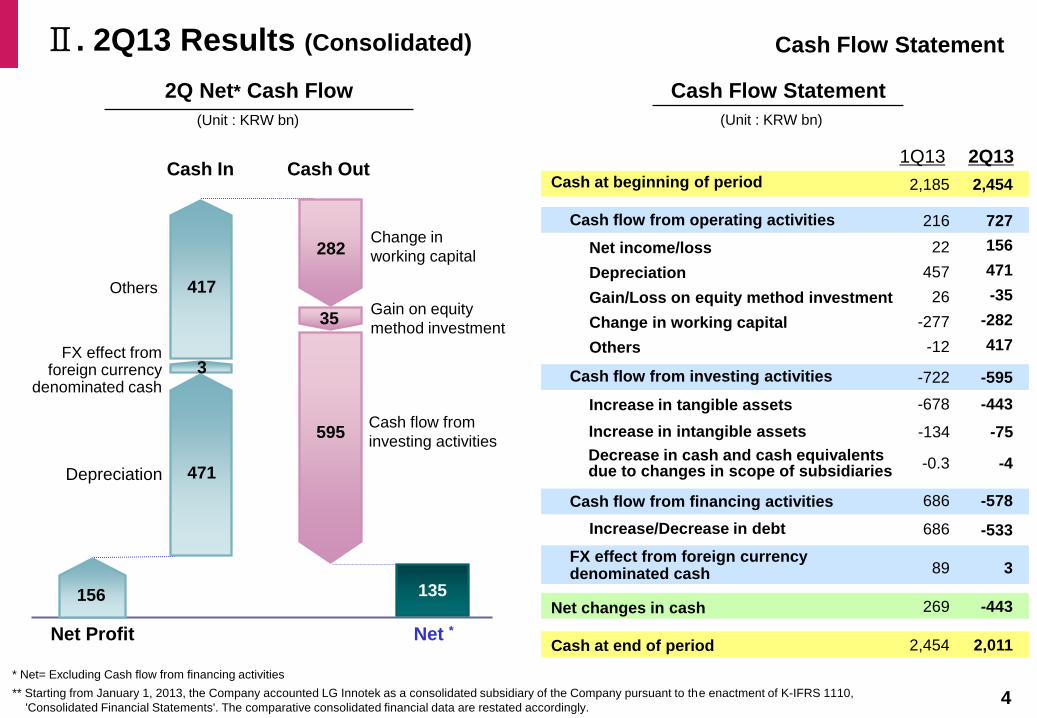
Ⅱ. 2Q13 Results (Consolidated) Cash Flow Statement
2Q13
156
471
-35
-282
417
-443
-533
2,454
727
-595
2,011
-443
-578
3
-75
Cash Out Cash In
471
135 156
3
282
35
595
-4
4
1Q13
22
457
26
-277
-12
-678
686
2,185
216
-722
2,454
269
686
89
-134
-0.3
417
* Net= Excluding Cash flow from financing activities
** Starting from January 1, 2013, the Company accounted LG Innotek as a consolidated subsidiary of the Company pursuant to the enactment of K-IFRS 1110,
'Consolidated Financial Statements'. The comparative consolidated financial data are restated accordingly.
2Q Net* Cash Flow Cash Flow Statement
(Unit : KRW bn) (Unit : KRW bn)
Cash flow from operating activities
Cash at beginning of period
Net income/loss
Depreciation
Gain/Loss on equity method investment
Change in working capital
Others
Cash flow from investing activities
Increase in tangible assets
Cash at end of period
Increase/Decrease in debt
Net changes in cash
Cash flow from financing activities
FX effect from foreign currency denominated cash
Increase in intangible assets
Decrease in cash and cash equivalents due to changes in scope of subsidiaries Depreciation
Gain on equity
method investment
FX effect from foreign currency
denominated cash
Net Profit Net *
Cash flow from
investing activities
Change in
working capital
Others
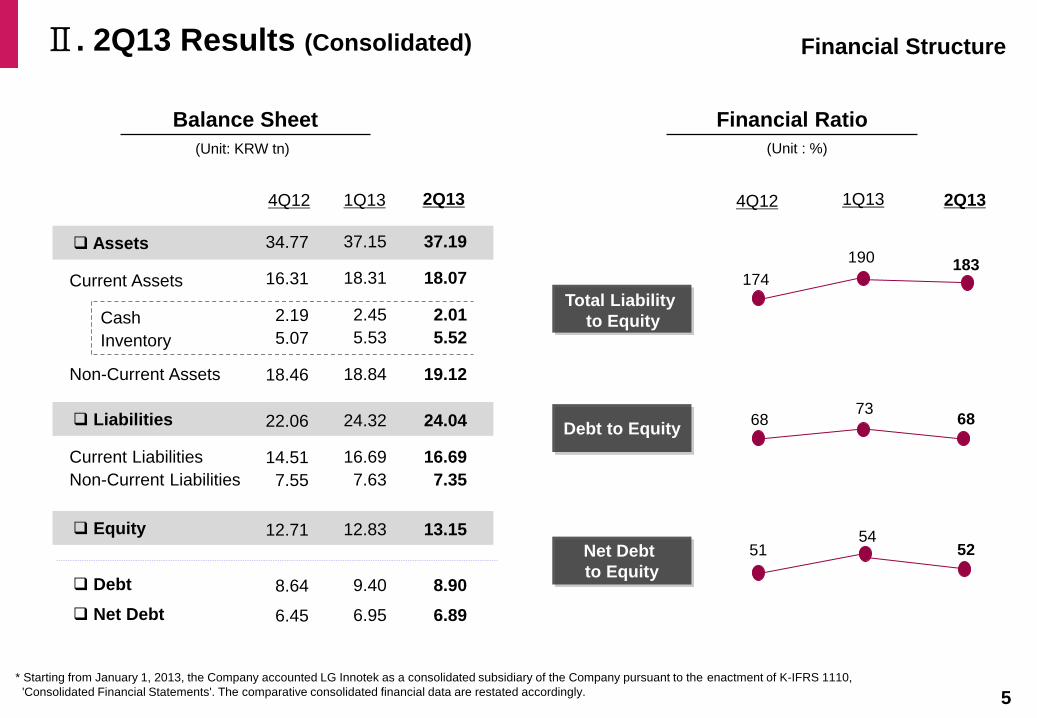
Ⅱ. 2Q13 Results (Consolidated)
5
4Q12 2Q13
Debt to Equity
Net Debt
to Equity
Total Liability
to Equity
1Q13
190
54
174
51
4Q12 1Q13
37.15
24.32
12.83
16.69
7.63
18.31
2Q13
9.40
2.45
5.53
18.84
6.95
73 68
34.77
22.06
12.71
14.51
7.55
16.31
8.64
2.19
5.07
18.46
6.45
37.19
24.04
13.15
16.69
7.35
18.07
8.90
2.01
5.52
19.12
6.89
183
68
52
Financial Structure
Balance Sheet
(Unit: KRW tn)
Financial Ratio
(Unit : %)
Assets
Liabilities
Equity
Current Liabilities
Non-Current Liabilities
Current Assets
Debt
Cash
Inventory
Non-Current Assets
Net Debt
* Starting from January 1, 2013, the Company accounted LG Innotek as a consolidated subsidiary of the Company pursuant to the enactment of K-IFRS 1110,
'Consolidated Financial Statements'. The comparative consolidated financial data are restated accordingly.

Performance and Outlook
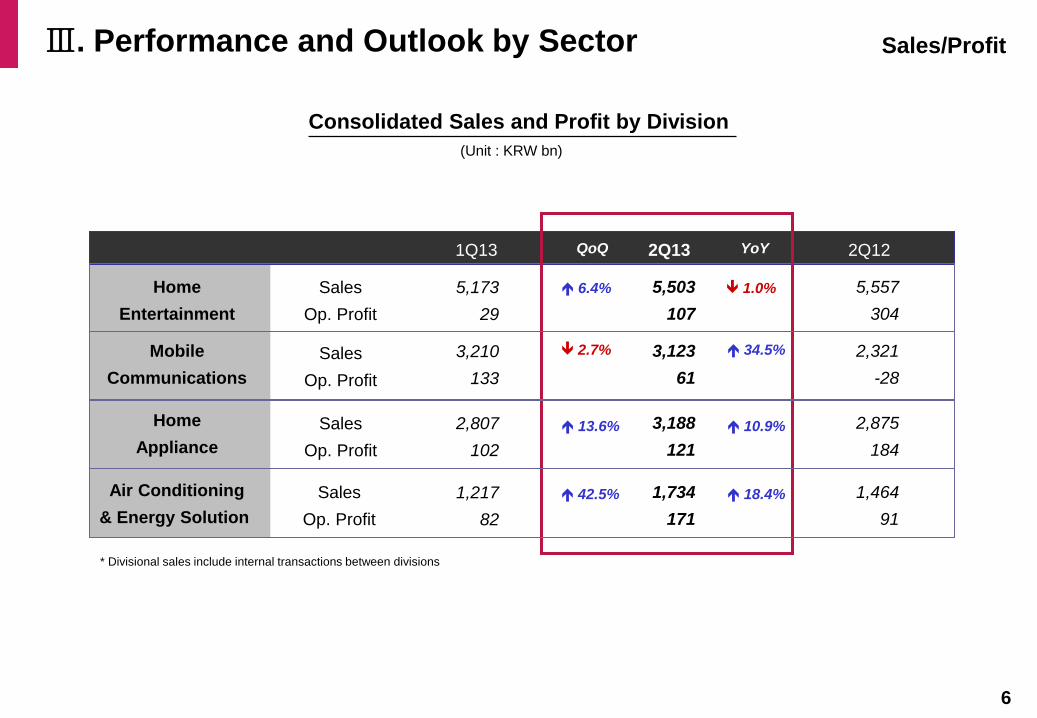
Ⅲ. Performance and Outlook by Sector
6
2Q13
5,503
107
2Q12
5,557
304
QoQ YoY
Home
Entertainment
3,123
61
2,321
-28
Mobile
Communications
3,188
121
2,875
184
Home
Appliance
1,734
171
1,464
91
Air Conditioning
& Energy Solution
1Q13
1.0% 5,173
29
3,210
133
2,807
102
1,217
82
2.7% 34.5%
6.4%
13.6%
42.5%
10.9%
18.4%
Sales
Op. Profit
Sales
Op. Profit
Sales
Op. Profit
Sales
Op. Profit
* Divisional sales include internal transactions between divisions
Consolidated Sales and Profit by Division
(Unit : KRW bn)
Sales/Profit
Ⅲ. Performance and Outlook by Sector Home Entertainment
7
2Q13 Performance
3Q13 Outlook
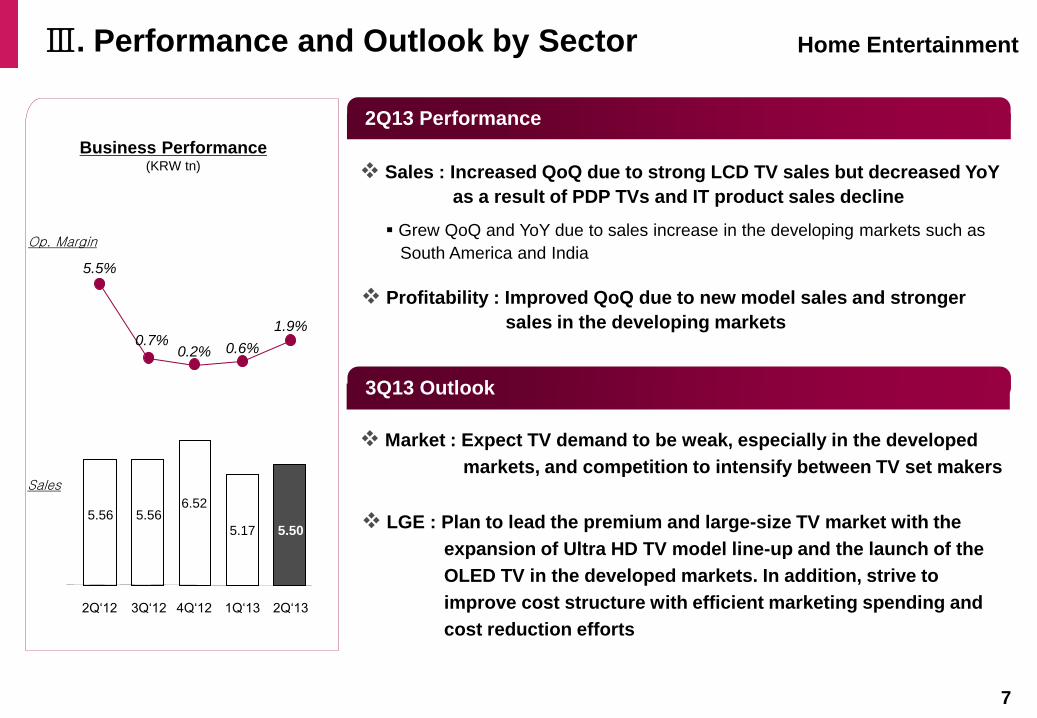
5.5%
2Q„12 3Q„12
0.2%
4Q„12
5.56
Sales : Increased QoQ due to strong LCD TV sales but decreased YoY
as a result of PDP TVs and IT product sales decline
Grew QoQ and YoY due to sales increase in the developing markets such as
South America and India
Profitability : Improved QoQ due to new model sales and stronger
sales in the developing markets
Market : Expect TV demand to be weak, especially in the developed
markets, and competition to intensify between TV set makers
LGE : Plan to lead the premium and large-size TV market with the
expansion of Ultra HD TV model line-up and the launch of the
OLED TV in the developed markets. In addition, strive to
improve cost structure with efficient marketing spending and
cost reduction efforts
0.6%
1Q„13
5.56 6.52
5.17
0.7% 1.9%
2Q„13
5.50
Business Performance (KRW tn)
Sales
Op. Margin
Ⅲ. Performance and Outlook by Sector Mobile Communications
8
2Q13 Performance
3Q13 Outlook
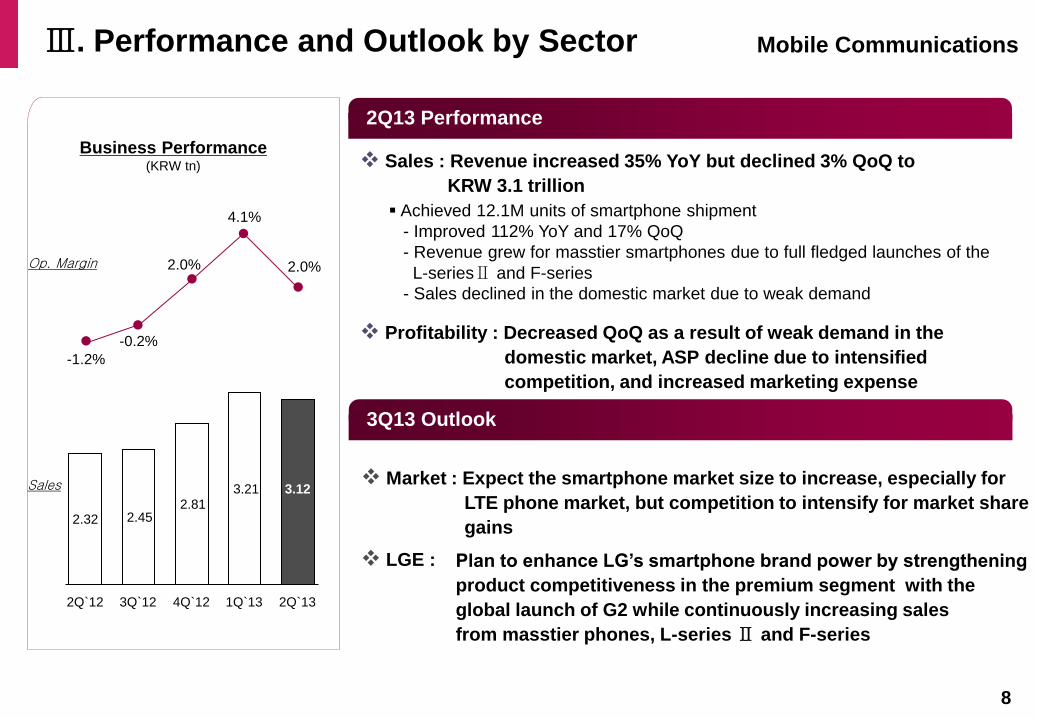
2Q`12 3Q`12
2.32
-1.2%
4Q`12
2.81
-0.2%
2.45
2.0%
Profitability : Decreased QoQ as a result of weak demand in the
domestic market, ASP decline due to intensified
competition, and increased marketing expense
1Q`13
3.21
4.1%
Sales : Revenue increased 35% YoY but declined 3% QoQ to
KRW 3.1 trillion
Achieved 12.1M units of smartphone shipment
- Improved 112% YoY and 17% QoQ
- Revenue grew for masstier smartphones due to full fledged launches of the
L-seriesⅡ and F-series
- Sales declined in the domestic market due to weak demand
2Q`13
3.12 3.21
2.0%
Market : Expect the smartphone market size to increase, especially for
LTE phone market, but competition to intensify for market share
gains
Business Performance (KRW tn)
Sales
Op. Margin
LGE : Plan to enhance LG’s smartphone brand power by strengthening
product competitiveness in the premium segment with the
global launch of G2 while continuously increasing sales
from masstier phones, L-series Ⅱ and F-series
Ⅲ. Performance and Outlook by Sector
9
Home Appliance
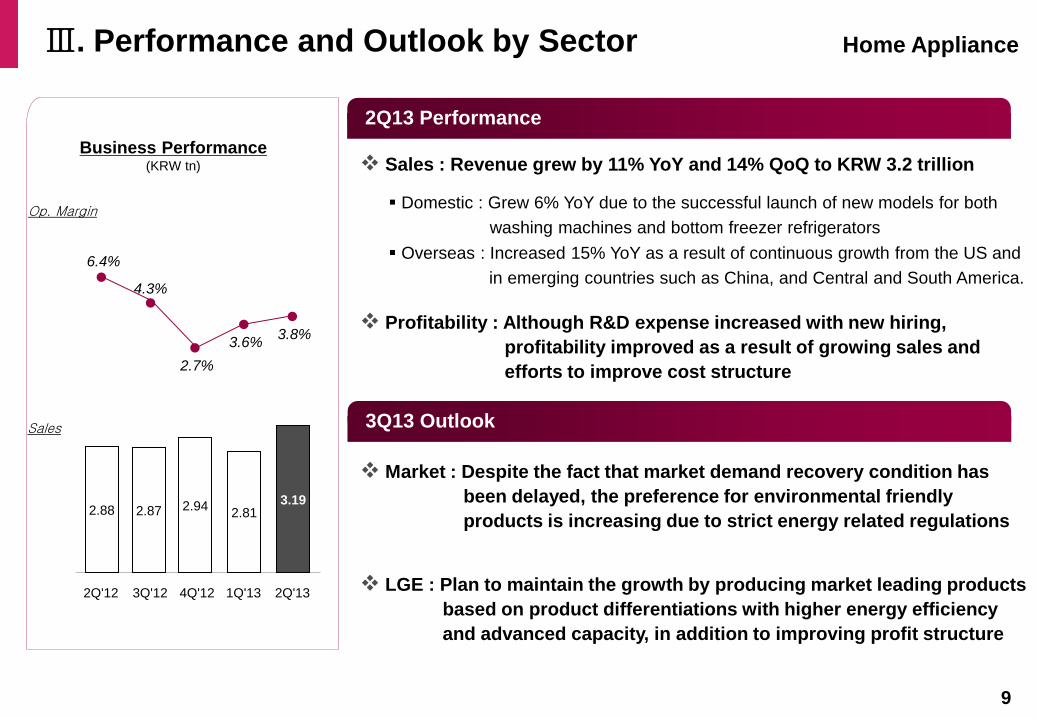
2Q13 Performance
3Q13 Outlook
2Q'12 3Q'12 4Q'12 1Q'13
Sales : Revenue grew by 11% YoY and 14% QoQ to KRW 3.2 trillion
Domestic : Grew 6% YoY due to the successful launch of new models for both
washing machines and bottom freezer refrigerators
Profitability : Although R&D expense increased with new hiring,
profitability improved as a result of growing sales and
efforts to improve cost structure
Overseas : Increased 15% YoY as a result of continuous growth from the US and
in emerging countries such as China, and Central and South America.
Market : Despite the fact that market demand recovery condition has
been delayed, the preference for environmental friendly
products is increasing due to strict energy related regulations
LGE : Plan to maintain the growth by producing market leading products
based on product differentiations with higher energy efficiency
and advanced capacity, in addition to improving profit structure
2Q'13
2.88 2.94 2.87 2.81 3.19
6.4%
4.3%
2.7%
3.6% 3.8%
Business Performance (KRW tn)
Sales
Op. Margin
Ⅲ. Performance and Outlook by Sector Air-Conditioning & Energy Solution
10
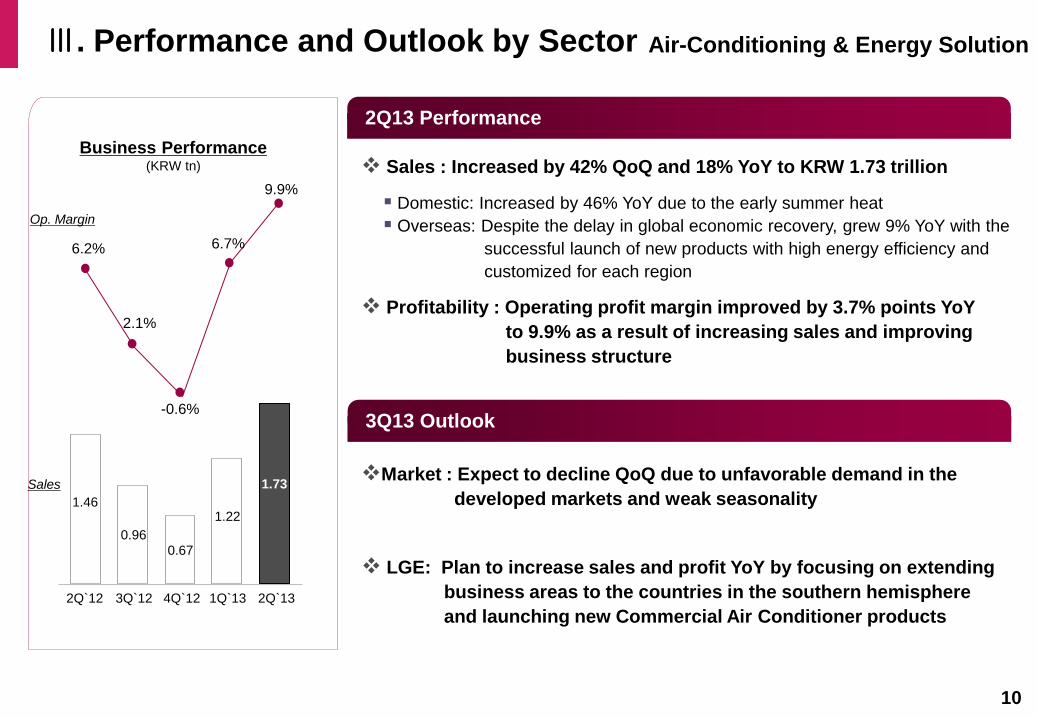
Sales : Increased by 42% QoQ and 18% YoY to KRW 1.73 trillion
LGE: Plan to increase sales and profit YoY by focusing on extending
business areas to the countries in the southern hemisphere
and launching new Commercial Air Conditioner products
Market : Expect to decline QoQ due to unfavorable demand in the
developed markets and weak seasonality
Profitability : Operating profit margin improved by 3.7% points YoY
to 9.9% as a result of increasing sales and improving
business structure
Domestic: Increased by 46% YoY due to the early summer heat
Overseas: Despite the delay in global economic recovery, grew 9% YoY with the
successful launch of new products with high energy efficiency and
customized for each region
2Q`12 3Q`12 4Q`12 1Q`13 2Q`13
0.67
1.22
1.73
9.9%
6.2%
2.1%
-0.6%
1.46
0.96
6.7%
2Q13 Performance
3Q13 Outlook
Business Performance (KRW tn)
Sales
Op. Margin
http://www.lg.com
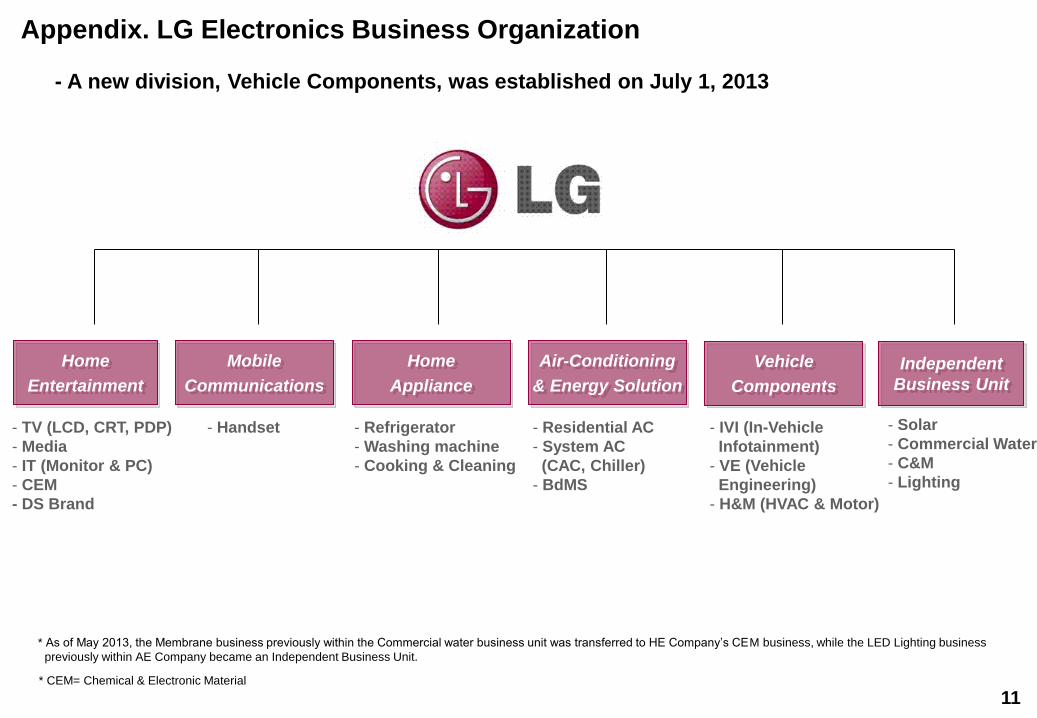
Appendix. LG Electronics Business Organization
11
Home
Appliance
Air-Conditioning
& Energy Solution
Home
Entertainment
Mobile
Communications
Vehicle
Components
- Solar
- Commercial Water
- C&M
- Lighting
- TV (LCD, CRT, PDP)
- Media
- IT (Monitor & PC)
- CEM
- DS Brand
- Handset
- Refrigerator
- Washing machine
- Cooking & Cleaning
- Residential AC
- System AC
(CAC, Chiller)
- BdMS
* CEM= Chemical & Electronic Material
Independent
Business Unit
- IVI (In-Vehicle
Infotainment)
- VE (Vehicle
Engineering)
- H&M (HVAC & Motor)
- A new division, Vehicle Components, was established on July 1, 2013
* As of May 2013, the Membrane business previously within the Commercial water business unit was transferred to HE Company‟s CEM business, while the LED Lighting business
previously within AE Company became an Independent Business Unit.
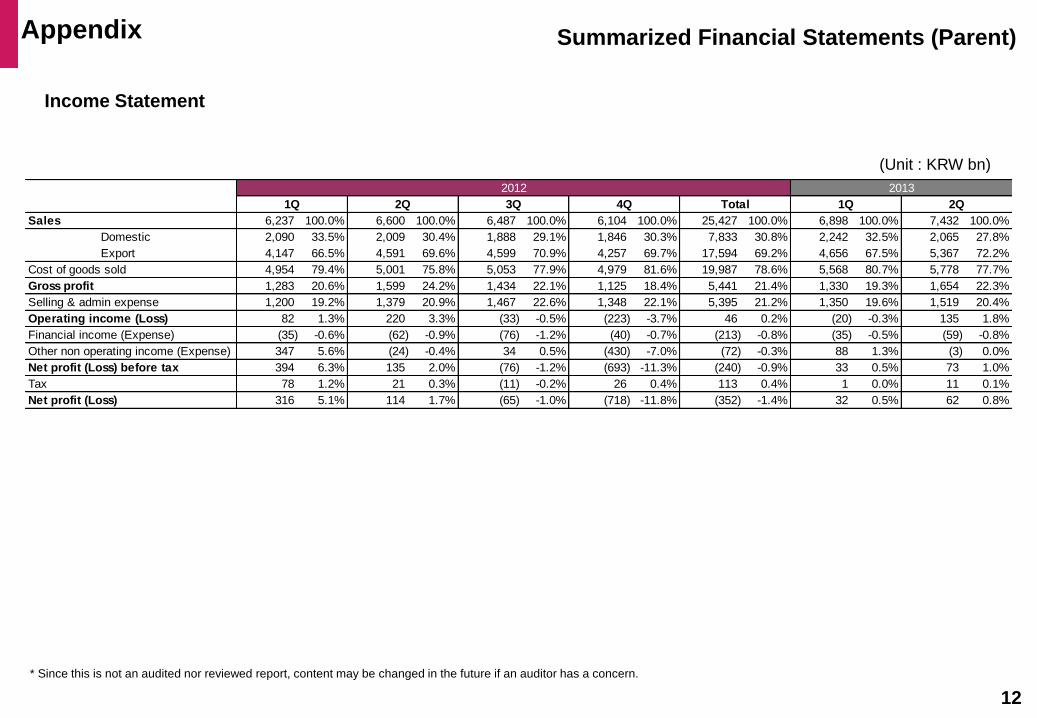
Appendix
Income Statement
12
Summarized Financial Statements (Parent)
* Since this is not an audited nor reviewed report, content may be changed in the future if an auditor has a concern.
(Unit : KRW bn)
Sales 6,237 100.0% 6,600 100.0% 6,487 100.0% 6,104 100.0% 25,427 100.0% 6,898 100.0% 7,432 100.0%
Domestic 2,090 33.5% 2,009 30.4% 1,888 29.1% 1,846 30.3% 7,833 30.8% 2,242 32.5% 2,065 27.8%
Export 4,147 66.5% 4,591 69.6% 4,599 70.9% 4,257 69.7% 17,594 69.2% 4,656 67.5% 5,367 72.2%
Cost of goods sold 4,954 79.4% 5,001 75.8% 5,053 77.9% 4,979 81.6% 19,987 78.6% 5,568 80.7% 5,778 77.7%
Gross profit 1,283 20.6% 1,599 24.2% 1,434 22.1% 1,125 18.4% 5,441 21.4% 1,330 19.3% 1,654 22.3%
Selling & admin expense 1,200 19.2% 1,379 20.9% 1,467 22.6% 1,348 22.1% 5,395 21.2% 1,350 19.6% 1,519 20.4%
Operating income (Loss) 82 1.3% 220 3.3% (33) -0.5% (223) -3.7% 46 0.2% (20) -0.3% 135 1.8%
Financial income (Expense) (35) -0.6% (62) -0.9% (76) -1.2% (40) -0.7% (213) -0.8% (35) -0.5% (59) -0.8%
Other non operating income (Expense) 347 5.6% (24) -0.4% 34 0.5% (430) -7.0% (72) -0.3% 88 1.3% (3) 0.0%
Net profit (Loss) before tax 394 6.3% 135 2.0% (76) -1.2% (693) -11.3% (240) -0.9% 33 0.5% 73 1.0%
Tax 78 1.2% 21 0.3% (11) -0.2% 26 0.4% 113 0.4% 1 0.0% 11 0.1%
Net profit (Loss) 316 5.1% 114 1.7% (65) -1.0% (718) -11.8% (352) -1.4% 32 0.5% 62 0.8%
Total1Q 2Q 3Q 4Q
2012 2013
1Q 2Q
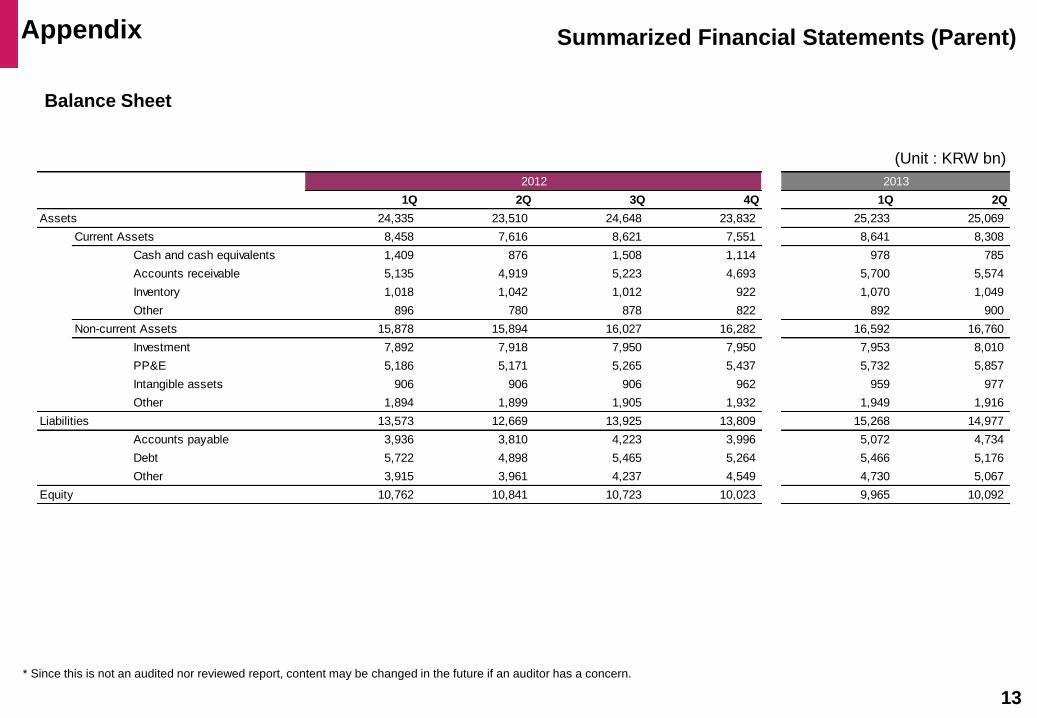
Appendix
Balance Sheet
13
Summarized Financial Statements (Parent)
(Unit : KRW bn)
* Since this is not an audited nor reviewed report, content may be changed in the future if an auditor has a concern.
1Q 2Q 3Q 4Q 1Q 2Q
Assets 24,335 23,510 24,648 23,832 25,233 25,069
Current Assets 8,458 7,616 8,621 7,551 8,641 8,308
Cash and cash equivalents 1,409 876 1,508 1,114 978 785
Accounts receivable 5,135 4,919 5,223 4,693 5,700 5,574
Inventory 1,018 1,042 1,012 922 1,070 1,049
Other 896 780 878 822 892 900
Non-current Assets 15,878 15,894 16,027 16,282 16,592 16,760
Investment 7,892 7,918 7,950 7,950 7,953 8,010
PP&E 5,186 5,171 5,265 5,437 5,732 5,857
Intangible assets 906 906 906 962 959 977
Other 1,894 1,899 1,905 1,932 1,949 1,916
Liabilities 13,573 12,669 13,925 13,809 15,268 14,977
Accounts payable 3,936 3,810 4,223 3,996 5,072 4,734
Debt 5,722 4,898 5,465 5,264 5,466 5,176
Other 3,915 3,961 4,237 4,549 4,730 5,067
Equity 10,762 10,841 10,723 10,023 9,965 10,092
2012 2013
Appendix
14
Income Statement
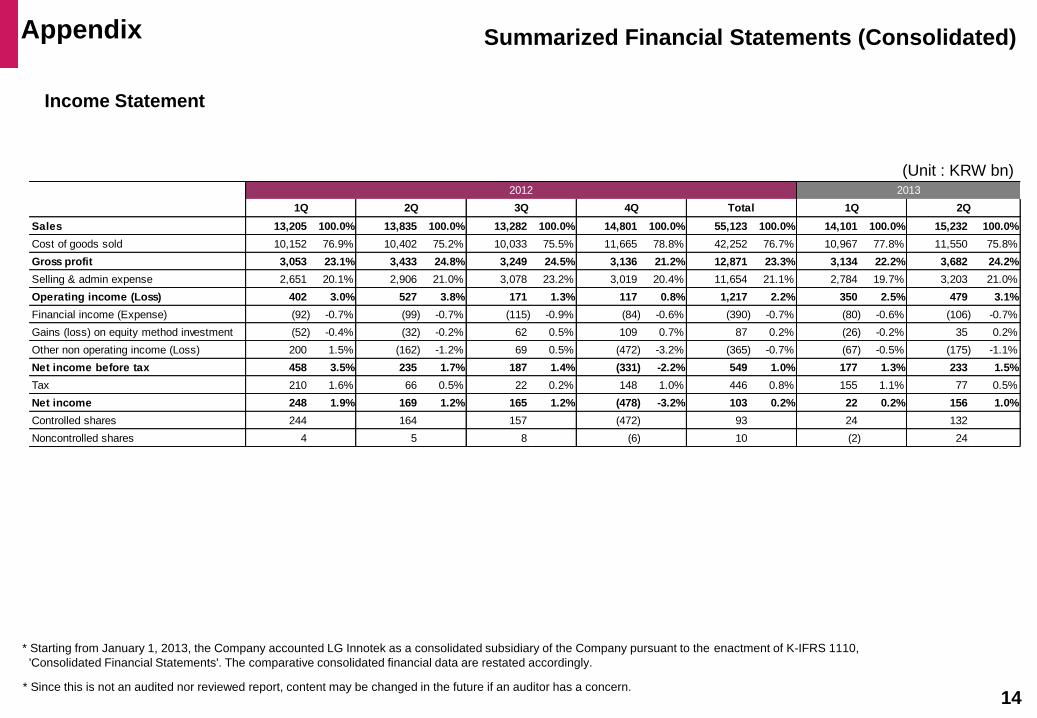
Summarized Financial Statements (Consolidated)
(Unit : KRW bn)
* Starting from January 1, 2013, the Company accounted LG Innotek as a consolidated subsidiary of the Company pursuant to the enactment of K-IFRS 1110,
'Consolidated Financial Statements'. The comparative consolidated financial data are restated accordingly. * Since this is not an audited nor reviewed report, content may be changed in the future if an auditor has a concern.
Sales 13,205 100.0% 13,835 100.0% 13,282 100.0% 14,801 100.0% 55,123 100.0% 14,101 100.0% 15,232 100.0%
Cost of goods sold 10,152 76.9% 10,402 75.2% 10,033 75.5% 11,665 78.8% 42,252 76.7% 10,967 77.8% 11,550 75.8%
Gross profit 3,053 23.1% 3,433 24.8% 3,249 24.5% 3,136 21.2% 12,871 23.3% 3,134 22.2% 3,682 24.2%
Selling & admin expense 2,651 20.1% 2,906 21.0% 3,078 23.2% 3,019 20.4% 11,654 21.1% 2,784 19.7% 3,203 21.0%
Operating income (Loss) 402 3.0% 527 3.8% 171 1.3% 117 0.8% 1,217 2.2% 350 2.5% 479 3.1%
Financial income (Expense) (92) -0.7% (99) -0.7% (115) -0.9% (84) -0.6% (390) -0.7% (80) -0.6% (106) -0.7%
Gains (loss) on equity method investment (52) -0.4% (32) -0.2% 62 0.5% 109 0.7% 87 0.2% (26) -0.2% 35 0.2%
Other non operating income (Loss) 200 1.5% (162) -1.2% 69 0.5% (472) -3.2% (365) -0.7% (67) -0.5% (175) -1.1%
Net income before tax 458 3.5% 235 1.7% 187 1.4% (331) -2.2% 549 1.0% 177 1.3% 233 1.5%
Tax 210 1.6% 66 0.5% 22 0.2% 148 1.0% 446 0.8% 155 1.1% 77 0.5%
Net income 248 1.9% 169 1.2% 165 1.2% (478) -3.2% 103 0.2% 22 0.2% 156 1.0%
Controlled shares 244 164 157 (472) 93 24 132
Noncontrolled shares 4 5 8 (6) 10 (2) 24
Total
2012
3Q2Q1Q 4Q
2013
1Q 2Q
Appendix
15
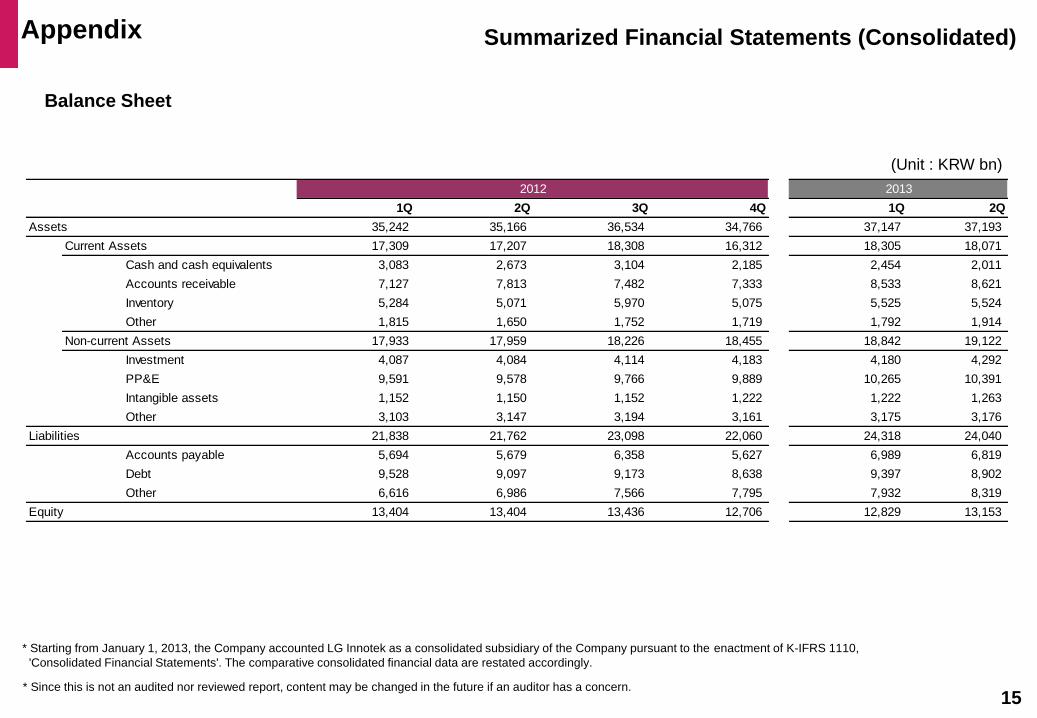
Summarized Financial Statements (Consolidated)
Balance Sheet
(Unit : KRW bn)
* Starting from January 1, 2013, the Company accounted LG Innotek as a consolidated subsidiary of the Company pursuant to the enactment of K-IFRS 1110,
'Consolidated Financial Statements'. The comparative consolidated financial data are restated accordingly. * Since this is not an audited nor reviewed report, content may be changed in the future if an auditor has a concern.
1Q 2Q 3Q 4Q 1Q 2Q
Assets 35,242 35,166 36,534 34,766 37,147 37,193
Current Assets 17,309 17,207 18,308 16,312 18,305 18,071
Cash and cash equivalents 3,083 2,673 3,104 2,185 2,454 2,011
Accounts receivable 7,127 7,813 7,482 7,333 8,533 8,621
Inventory 5,284 5,071 5,970 5,075 5,525 5,524
Other 1,815 1,650 1,752 1,719 1,792 1,914
Non-current Assets 17,933 17,959 18,226 18,455 18,842 19,122
Investment 4,087 4,084 4,114 4,183 4,180 4,292
PP&E 9,591 9,578 9,766 9,889 10,265 10,391
Intangible assets 1,152 1,150 1,152 1,222 1,222 1,263
Other 3,103 3,147 3,194 3,161 3,175 3,176
Liabilities 21,838 21,762 23,098 22,060 24,318 24,040
Accounts payable 5,694 5,679 6,358 5,627 6,989 6,819
Debt 9,528 9,097 9,173 8,638 9,397 8,902
Other 6,616 6,986 7,566 7,795 7,932 8,319
Equity 13,404 13,404 13,436 12,706 12,829 13,153
20132012
Appendix
16
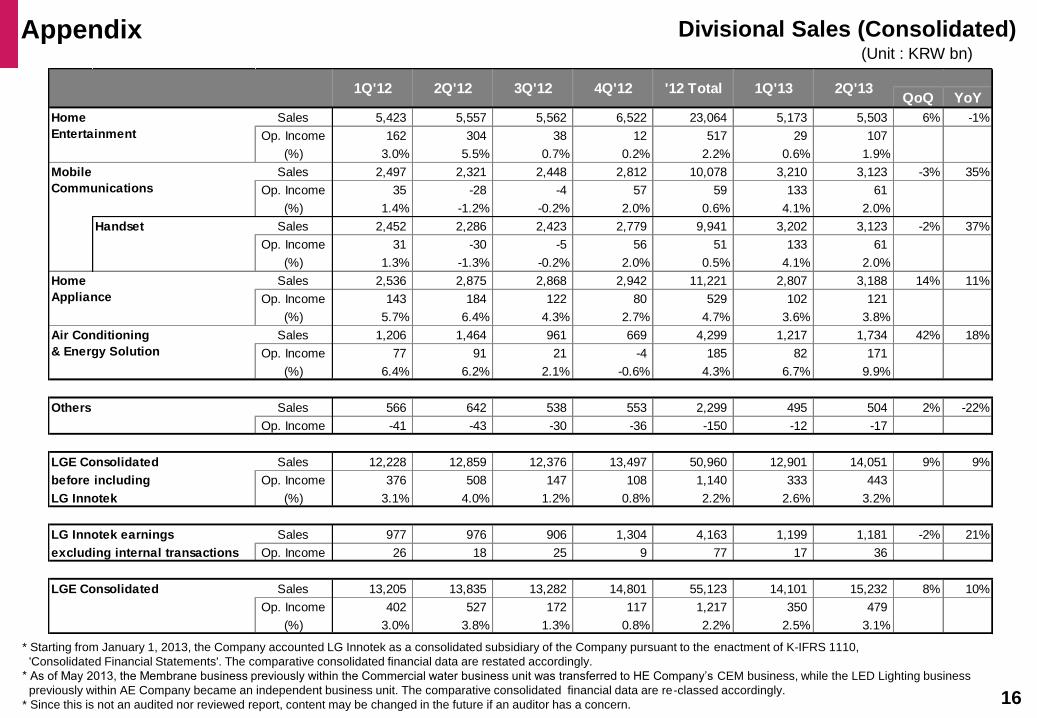
Divisional Sales (Consolidated) (Unit : KRW bn)
* Starting from January 1, 2013, the Company accounted LG Innotek as a consolidated subsidiary of the Company pursuant to the enactment of K-IFRS 1110,
'Consolidated Financial Statements'. The comparative consolidated financial data are restated accordingly.
* As of May 2013, the Membrane business previously within the Commercial water business unit was transferred to HE Company‟s CEM business, while the LED Lighting business
previously within AE Company became an independent business unit. The comparative consolidated financial data are re-classed accordingly.
* Since this is not an audited nor reviewed report, content may be changed in the future if an auditor has a concern.
QoQ YoY
Sales 5,423 5,557 5,562 6,522 23,064 5,173 5,503 6% -1%
Op. Income 162 304 38 12 517 29 107
(%) 3.0% 5.5% 0.7% 0.2% 2.2% 0.6% 1.9%
Sales 2,497 2,321 2,448 2,812 10,078 3,210 3,123 -3% 35%
Op. Income 35 -28 -4 57 59 133 61
(%) 1.4% -1.2% -0.2% 2.0% 0.6% 4.1% 2.0%
Handset Sales 2,452 2,286 2,423 2,779 9,941 3,202 3,123 -2% 37%
Op. Income 31 -30 -5 56 51 133 61
(%) 1.3% -1.3% -0.2% 2.0% 0.5% 4.1% 2.0%
Sales 2,536 2,875 2,868 2,942 11,221 2,807 3,188 14% 11%
Op. Income 143 184 122 80 529 102 121
(%) 5.7% 6.4% 4.3% 2.7% 4.7% 3.6% 3.8%
Sales 1,206 1,464 961 669 4,299 1,217 1,734 42% 18%
Op. Income 77 91 21 -4 185 82 171
(%) 6.4% 6.2% 2.1% -0.6% 4.3% 6.7% 9.9%
Others Sales 566 642 538 553 2,299 495 504 2% -22%
Op. Income -41 -43 -30 -36 -150 -12 -17
LGE Consolidated Sales 12,228 12,859 12,376 13,497 50,960 12,901 14,051 9% 9%
before including Op. Income 376 508 147 108 1,140 333 443
LG Innotek. (%) 3.1% 4.0% 1.2% 0.8% 2.2% 2.6% 3.2%
LG Innotek earnings Sales 977 976 906 1,304 4,163 1,199 1,181 -2% 21%
excluding internal transactions Op. Income 26 18 25 9 77 17 36
LGE Consolidated Sales 13,205 13,835 13,282 14,801 55,123 14,101 15,232 8% 10%
Op. Income 402 527 172 117 1,217 350 479
(%) 3.0% 3.8% 1.3% 0.8% 2.2% 2.5% 3.1%
Home
Entertainment
Mobile
Communications
Home
Appliance
Air Conditioning
& Energy Solution
2Q'131Q'12 2Q'12 3Q'12 4Q'12 '12 Total 1Q'13