Embed Size (px)
Citation preview
SOFTWARE SECTOR REVIEW
BostonTwo International Place
24 Floor
Boston, MA 02110
617-482-7501
Jeff [email protected]
San Francisco575 Market Street
31 Floor
San Francisco, CA 94105
415-288-4260
Mike [email protected]
London63 Brook St
London, W1K 4HS
United Kingdom
Phone: +44 (0) 20 7518 8900
Thierry [email protected]
2Q 2014
TECHNOLOGY • MEDIA • TELECOM GROUP:
Technology • Media • Telecom
To subscribe please email:
Investment banking services are provided by Harris Williams LLC, a registered broker-dealer and member of FINRA and SIPC, and Harris Williams & Co.Ltd, which is authorized and regulated by the Financial Conduct Authority. Harris Williams & Co. is a trade name under which Harris Williams LLC andHarris Williams & Co. Ltd conduct business.
TABLE OF CONTENTS
2
3
4
5
6
8
14
16
DEAL SPOTLIGHT
HW&CO. TMT GROUP OVERVIEW
WHAT WE’VE BEEN READING
NOTEWORTHY SOFTWARE TRANSACTIONS
SOFTWARE M&A ACTIVITY
SOFTWARE SECTOR OVERVIEWS
SOFTWARE IPO OVERVIEW
MIDDLE MARKET DEBT OVERVIEW
Technology • Media • Telecom
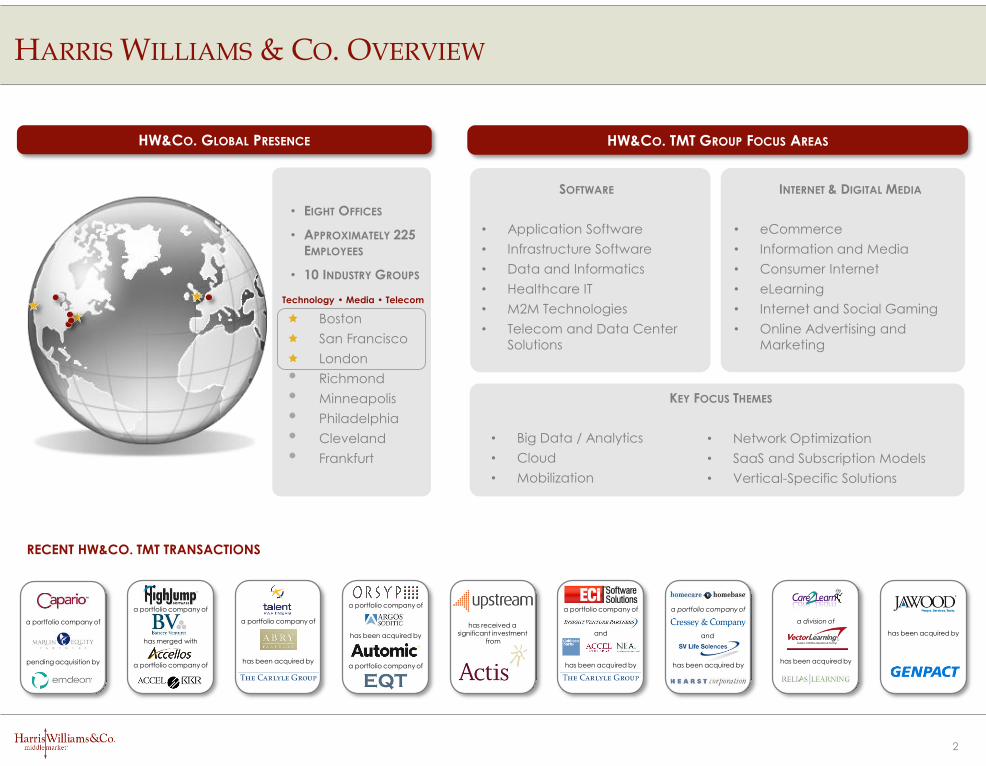
RECENT HW&CO. TMT TRANSACTIONS
SOFTWARE
• Application Software
• Infrastructure Software
• Data and Informatics
• Healthcare IT
• M2M Technologies
• Telecom and Data Center
Solutions
KEY FOCUS THEMES
• Big Data / Analytics
• Cloud
• Mobilization
INTERNET & DIGITAL MEDIA
• eCommerce
• Information and Media
• Consumer Internet
• eLearning
• Internet and Social Gaming
• Online Advertising and
Marketing
• Network Optimization
• SaaS and Subscription Models
• Vertical-Specific Solutions
HW&CO. TMT GROUP FOCUS AREAS
• EIGHT OFFICES
• APPROXIMATELY 225
EMPLOYEES
• 10 INDUSTRY GROUPS
Boston
San Francisco
London
Richmond
Minneapolis
Philadelphia
Cleveland
Frankfurt
HW&CO. GLOBAL PRESENCE
Technology • Media • Telecom
RECENT HW&CO. TMT TRANSACTIONS
HARRIS WILLIAMS & CO. OVERVIEW
2
has been acquired by
a division of
has been acquired by
a portfolio company of
and
has been acquired by
a portfolio company of
and
has been acquired by
a portfolio company of
has been acquired by
a portfolio company of
has received a significant investment
from
a portfolio company of
has been acquired by
a portfolio company of
has merged with
a portfolio company of
a portfolio company of
pending acquisition by
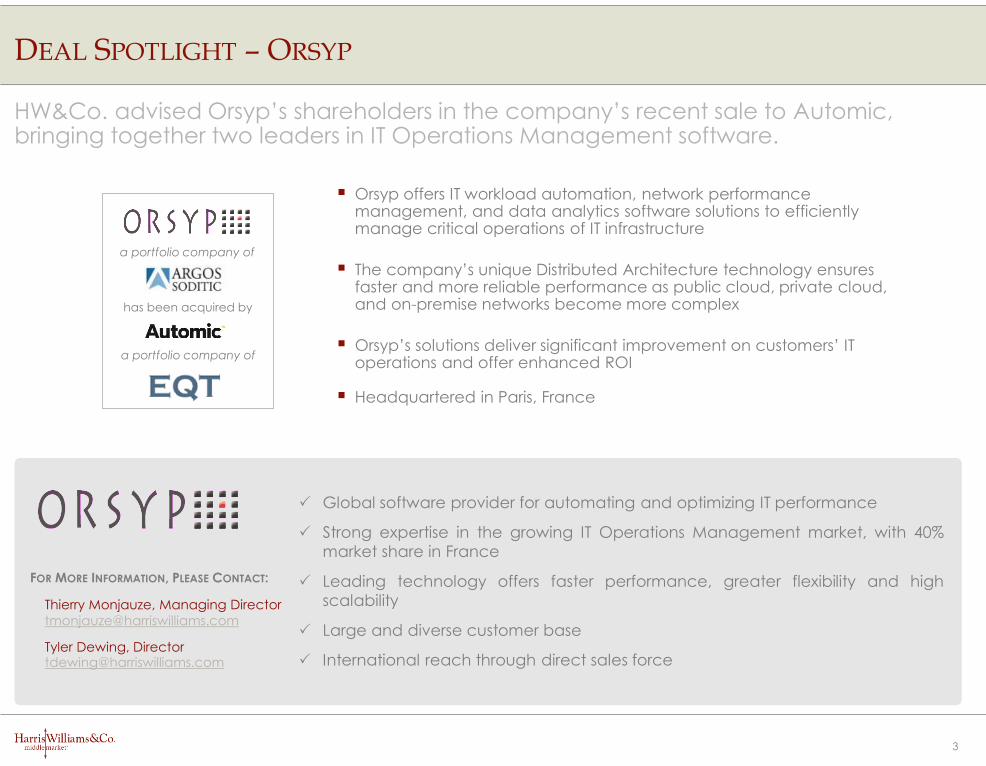
DEAL SPOTLIGHT – ORSYP
HW&Co. advised Orsyp’s shareholders in the company’s recent sale to Automic, bringing together two leaders in IT Operations Management software.
3
Global software provider for automating and optimizing IT performance
Strong expertise in the growing IT Operations Management market, with 40%
market share in France
Leading technology offers faster performance, greater flexibility and high
scalability
Large and diverse customer base
International reach through direct sales force
FOR MORE INFORMATION, PLEASE CONTACT:
Thierry Monjauze, Managing Director
Tyler Dewing, [email protected]
has been acquired by
a portfolio company of
a portfolio company of
Orsyp offers IT workload automation, network performance management, and data analytics software solutions to efficiently manage critical operations of IT infrastructure
The company’s unique Distributed Architecture technology ensures faster and more reliable performance as public cloud, private cloud, and on-premise networks become more complex
Orsyp’s solutions deliver significant improvement on customers’ IT operations and offer enhanced ROI
Headquartered in Paris, France
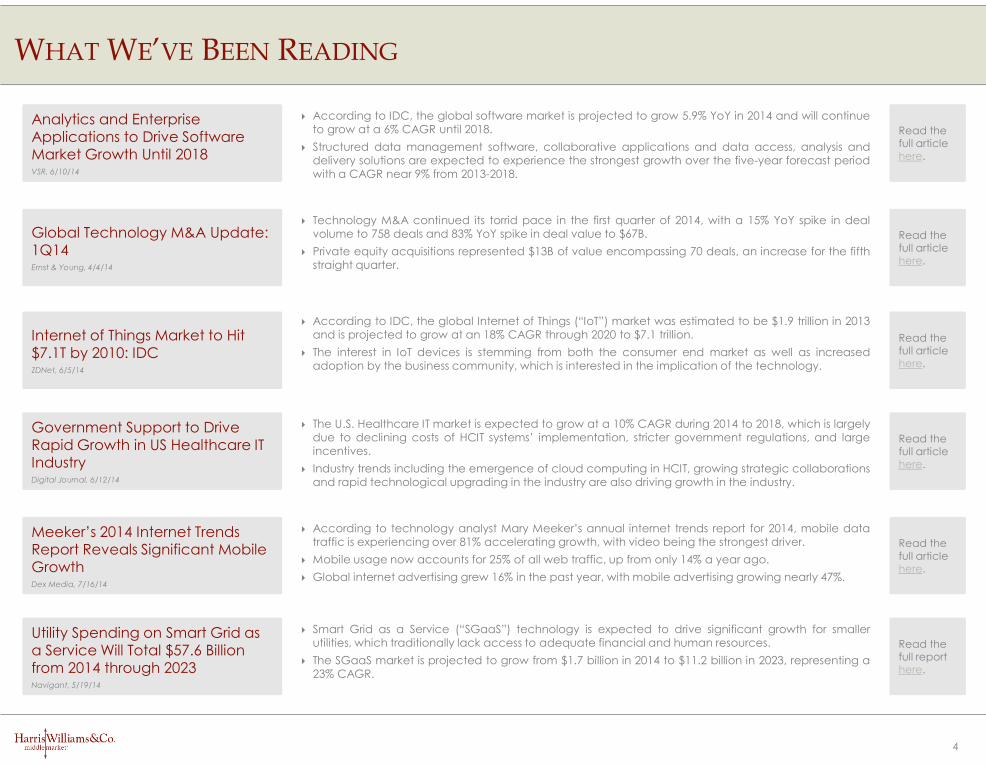
Internet of Things Market to Hit $7.1T by 2010: IDCZDNet, 6/5/14
According to IDC, the global Internet of Things (“IoT”) market was estimated to be $1.9 trillion in 2013and is projected to grow at an 18% CAGR through 2020 to $7.1 trillion.
The interest in IoT devices is stemming from both the consumer end market as well as increasedadoption by the business community, which is interested in the implication of the technology.
Read the full article here.
Government Support to Drive Rapid Growth in US Healthcare IT IndustryDigital Journal, 6/12/14
The U.S. Healthcare IT market is expected to grow at a 10% CAGR during 2014 to 2018, which is largelydue to declining costs of HCIT systems’ implementation, stricter government regulations, and largeincentives.
Industry trends including the emergence of cloud computing in HCIT, growing strategic collaborationsand rapid technological upgrading in the industry are also driving growth in the industry.
Read the full article here.
Analytics and Enterprise Applications to Drive Software Market Growth Until 2018VSR, 6/10/14
According to IDC, the global software market is projected to grow 5.9% YoY in 2014 and will continueto grow at a 6% CAGR until 2018.
Structured data management software, collaborative applications and data access, analysis anddelivery solutions are expected to experience the strongest growth over the five-year forecast periodwith a CAGR near 9% from 2013-2018.
Read the full articlehere.
Global Technology M&A Update: 1Q14Ernst & Young, 4/4/14
Technology M&A continued its torrid pace in the first quarter of 2014, with a 15% YoY spike in dealvolume to 758 deals and 83% YoY spike in deal value to $67B.
Private equity acquisitions represented $13B of value encompassing 70 deals, an increase for the fifthstraight quarter.
Read the full article here.
Utility Spending on Smart Grid as a Service Will Total $57.6 Billion from 2014 through 2023Navigant, 5/19/14
Smart Grid as a Service (“SGaaS”) technology is expected to drive significant growth for smallerutilities, which traditionally lack access to adequate financial and human resources.
The SGaaS market is projected to grow from $1.7 billion in 2014 to $11.2 billion in 2023, representing a23% CAGR.
Read the full report here.
Meeker’s 2014 Internet Trends Report Reveals Significant Mobile GrowthDex Media, 7/16/14
According to technology analyst Mary Meeker’s annual internet trends report for 2014, mobile datatraffic is experiencing over 81% accelerating growth, with video being the strongest driver.
Mobile usage now accounts for 25% of all web traffic, up from only 14% a year ago.
Global internet advertising grew 16% in the past year, with mobile advertising growing nearly 47%.
Read the full article here.
WHAT WE’VE BEEN READING
4
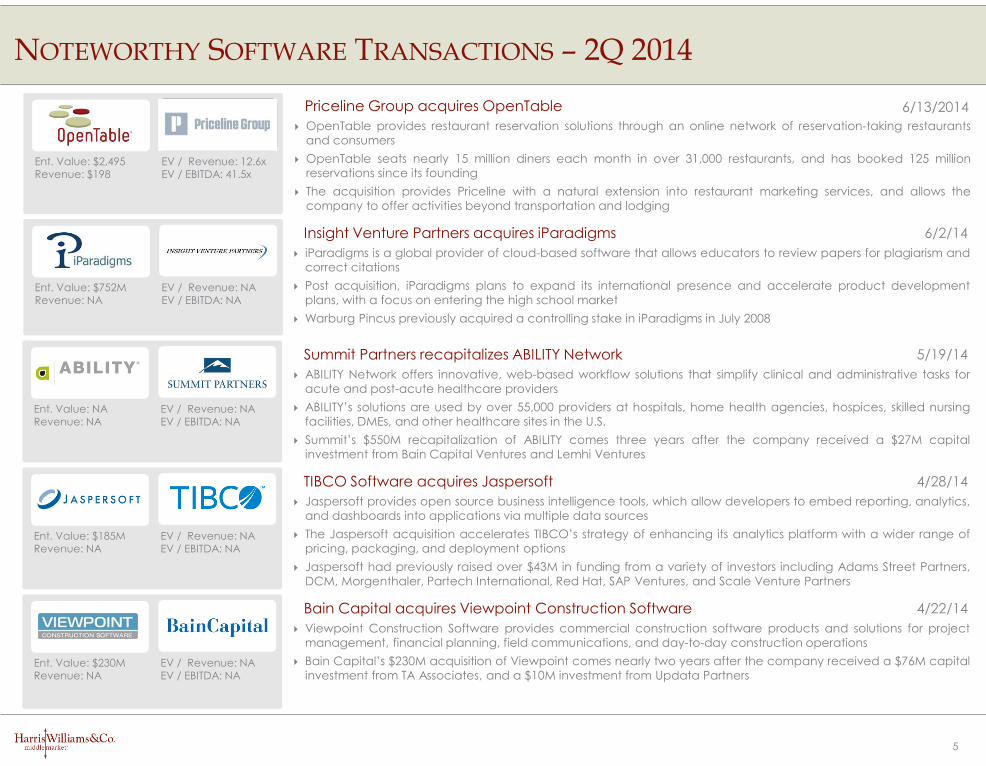
NOTEWORTHY SOFTWARE TRANSACTIONS – 2Q 2014
5
4/28/14
Ent. Value: $185MRevenue: NA
EV / Revenue: NAEV / EBITDA: NA
Jaspersoft provides open source business intelligence tools, which allow developers to embed reporting, analytics,
and dashboards into applications via multiple data sources
The Jaspersoft acquisition accelerates TIBCO’s strategy of enhancing its analytics platform with a wider range of
pricing, packaging, and deployment options
Jaspersoft had previously raised over $43M in funding from a variety of investors including Adams Street Partners,
DCM, Morgenthaler, Partech International, Red Hat, SAP Ventures, and Scale Venture Partners
TIBCO Software acquires Jaspersoft
iParadigms is a global provider of cloud-based software that allows educators to review papers for plagiarism and
correct citations
Post acquisition, iParadigms plans to expand its international presence and accelerate product development
plans, with a focus on entering the high school market
Warburg Pincus previously acquired a controlling stake in iParadigms in July 2008
Insight Venture Partners acquires iParadigms 6/2/14
Ent. Value: $752MRevenue: NA
EV / Revenue: NAEV / EBITDA: NA
5/19/14
Ent. Value: NARevenue: NA
EV / Revenue: NAEV / EBITDA: NA
ABILITY Network offers innovative, web-based workflow solutions that simplify clinical and administrative tasks for
acute and post-acute healthcare providers
ABILITY’s solutions are used by over 55,000 providers at hospitals, home health agencies, hospices, skilled nursing
facilities, DMEs, and other healthcare sites in the U.S.
Summit’s $550M recapitalization of ABILITY comes three years after the company received a $27M capital
investment from Bain Capital Ventures and Lemhi Ventures
Summit Partners recapitalizes ABILITY Network
4/22/14
Ent. Value: $230MRevenue: NA
EV / Revenue: NAEV / EBITDA: NA
Viewpoint Construction Software provides commercial construction software products and solutions for project
management, financial planning, field communications, and day-to-day construction operations
Bain Capital’s $230M acquisition of Viewpoint comes nearly two years after the company received a $76M capital
investment from TA Associates, and a $10M investment from Updata Partners
Bain Capital acquires Viewpoint Construction Software
6/13/2014
Ent. Value: $2,495Revenue: $198
EV / Revenue: 12.6xEV / EBITDA: 41.5x
OpenTable provides restaurant reservation solutions through an online network of reservation-taking restaurants
and consumers
OpenTable seats nearly 15 million diners each month in over 31,000 restaurants, and has booked 125 million
reservations since its founding
The acquisition provides Priceline with a natural extension into restaurant marketing services, and allows the
company to offer activities beyond transportation and lodging
Priceline Group acquires OpenTable
6
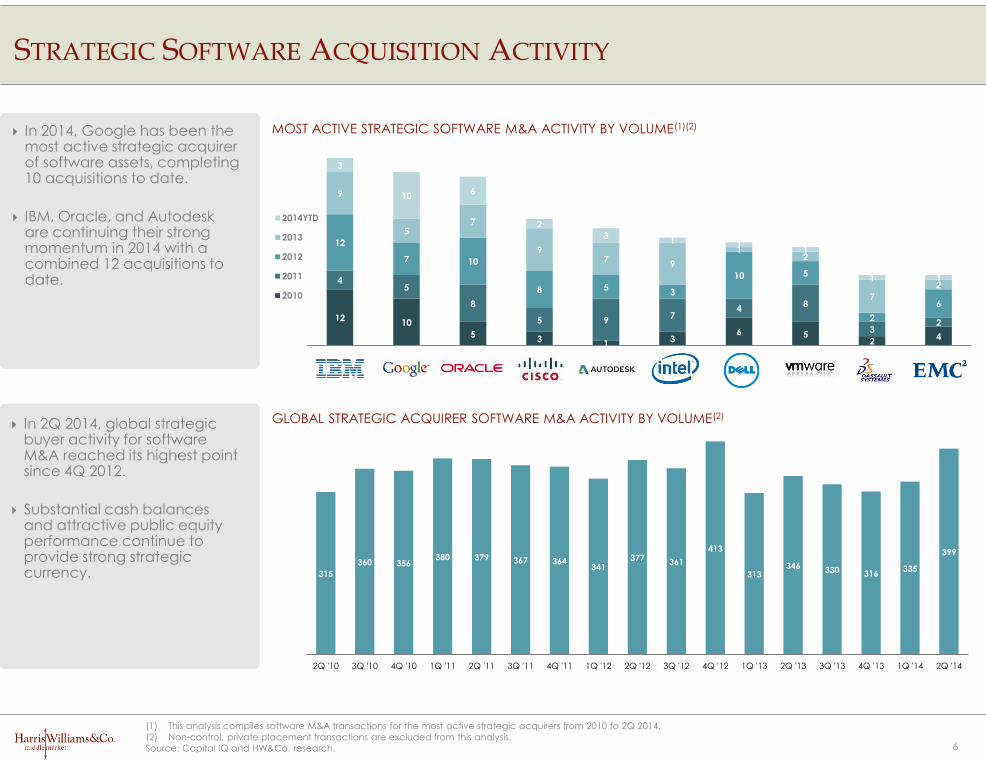
In 2014, Google has been the most active strategic acquirer of software assets, completing 10 acquisitions to date.
IBM, Oracle, and Autodesk are continuing their strong momentum in 2014 with a combined 12 acquisitions to date.
In 2Q 2014, global strategic buyer activity for software M&A reached its highest point since 4Q 2012.
Substantial cash balances and attractive public equity performance continue to provide strong strategic currency.
STRATEGIC SOFTWARE ACQUISITION ACTIVITY
(1) This analysis compiles software M&A transactions for the most active strategic acquirers from 2010 to 2Q 2014.
(2) Non-control, private placement transactions are excluded from this analysis.
Source: Capital IQ and HW&Co. research.
MOST ACTIVE STRATEGIC SOFTWARE M&A ACTIVITY BY VOLUME(1)(2)
GLOBAL STRATEGIC ACQUIRER SOFTWARE M&A ACTIVITY BY VOLUME(2)
1210
53
13
6 52
4
45
8
5 97
48
32
12
7 10
8 53
10 5
2
6
9
57
97
9
12
7
2
3
106
2
31
11
1 1
2014YTD
2013
2012
2011
2010
315
360 356380 379 367 364
341377
361
413
313346 330 316
335
399
2Q '10 3Q '10 4Q '10 1Q '11 2Q '11 3Q '11 4Q '11 1Q '12 2Q '12 3Q '12 4Q '12 1Q '13 2Q '13 3Q '13 4Q '13 1Q '14 2Q '14
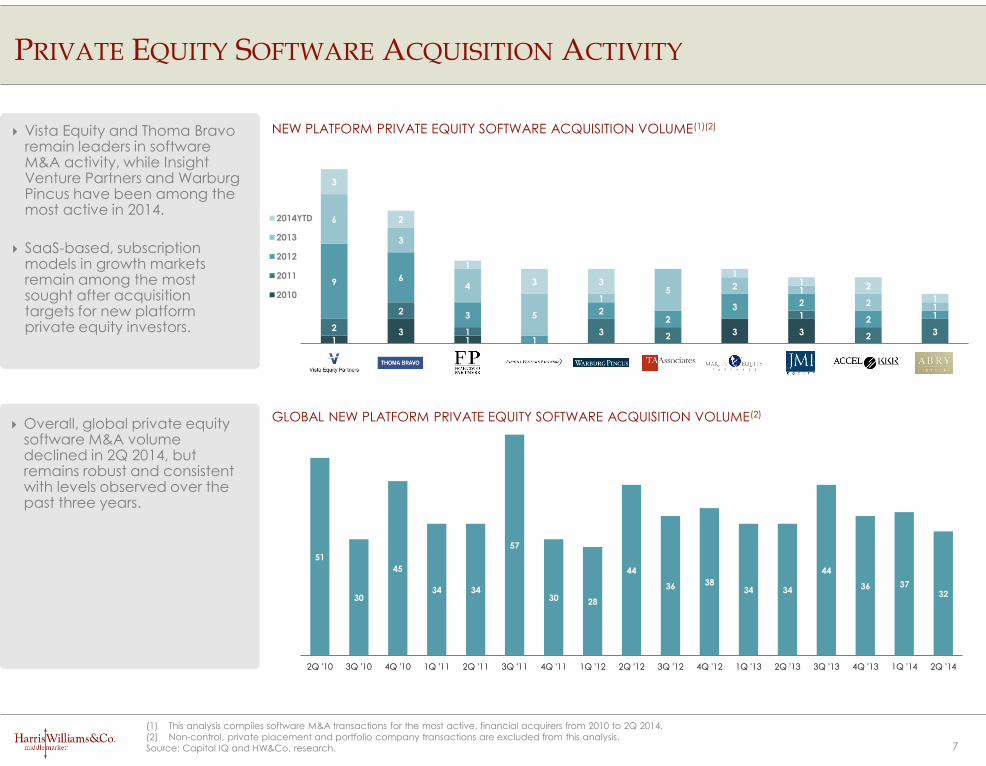
NEW PLATFORM PRIVATE EQUITY SOFTWARE ACQUISITION VOLUME(1)(2)
13
13 32
2
1 3 2
1
2 3
9 6
3
1
22
3 2
2 1
6
3
4
5
15 2 1
2 1
3
2
1
3 31
1 2
1
2014YTD
2013
2012
2011
2010
7
Vista Equity and Thoma Bravo remain leaders in software M&A activity, while Insight Venture Partners and Warburg Pincus have been among the most active in 2014.
SaaS-based, subscription models in growth markets remain among the most sought after acquisition targets for new platform private equity investors.
Overall, global private equity software M&A volume declined in 2Q 2014, but remains robust and consistent with levels observed over the past three years.
PRIVATE EQUITY SOFTWARE ACQUISITION ACTIVITY
GLOBAL NEW PLATFORM PRIVATE EQUITY SOFTWARE ACQUISITION VOLUME(2)
(1) This analysis compiles software M&A transactions for the most active, financial acquirers from 2010 to 2Q 2014.
(2) Non-control, private placement and portfolio company transactions are excluded from this analysis.
Source: Capital IQ and HW&Co. research.
51
30
45
34 34
57
30 28
44
36 3834 34
44
36 3732
2Q '10 3Q '10 4Q '10 1Q '11 2Q '11 3Q '11 4Q '11 1Q '12 2Q '12 3Q '12 4Q '12 1Q '13 2Q '13 3Q '13 4Q '13 1Q '14 2Q '14
Date
Closed Acquirer Target Description
Enterprise
Value ($mm)
Revenue
Multiple
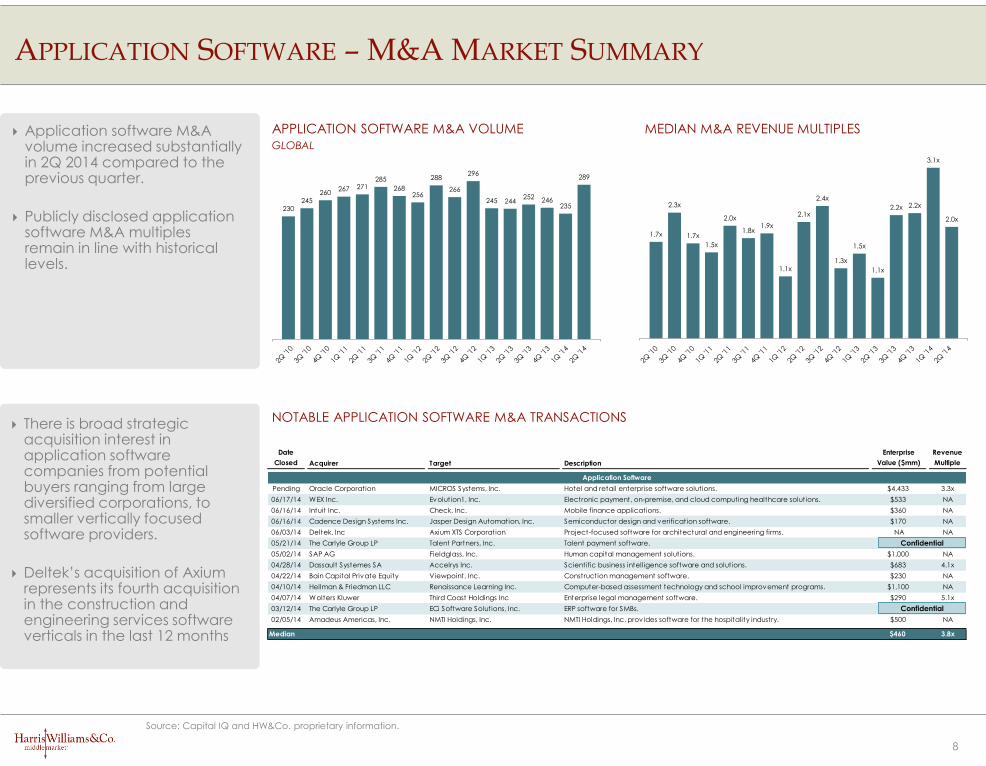
Application Software
Pending Oracle Corporation MICROS Systems, Inc. Hotel and retail enterprise software solutions. $4,433 3.3x
06/17/14 WEX Inc. Evolution1, Inc. Electronic payment, on-premise, and cloud computing healthcare solutions. $533 NA
06/16/14 Intuit Inc. Check, Inc. Mobile finance applications. $360 NA
06/16/14 Cadence Design Systems Inc. Jasper Design Automation, Inc. Semiconductor design and verification software. $170 NA
06/03/14 Deltek, Inc Axium XTS Corporation Project-focused software for architectural and engineering firms. NA NA
05/21/14 The Carlyle Group LP Talent Partners, Inc. Talent payment software. $114 2.2x
05/02/14 SAP AG Fieldglass, Inc. Human capital management solutions. $1,000 NA
04/28/14 Dassault Systemes SA Accelrys Inc. Scientific business intelligence software and solutions. $683 4.1x
04/22/14 Bain Capital Private Equity Viewpoint, Inc. Construction management software. $230 NA
04/10/14 Hellman & Friedman LLC Renaissance Learning Inc. Computer-based assessment technology and school improvement programs. $1,100 NA
04/07/14 Wolters Kluwer Third Coast Holdings Inc Enterprise legal management software. $290 5.1x
03/12/14 The Carlyle Group LP ECi Software Solutions, Inc. ERP software for SMBs. $420 3.8x
02/05/14 Amadeus Americas, Inc. NMTI Holdings, Inc. NMTI Holdings, Inc. provides software for the hospitality industry. $500 NA
Median $460 3.8x
APPLICATION SOFTWARE M&A VOLUMEGLOBAL
8
Application software M&A volume increased substantially in 2Q 2014 compared to the previous quarter.
Publicly disclosed application software M&A multiples remain in line with historical levels.
There is broad strategic acquisition interest in application software companies from potential buyers ranging from large diversified corporations, to smaller vertically focused software providers.
Deltek’s acquisition of Axiumrepresents its fourth acquisition in the construction and engineering services software verticals in the last 12 months
APPLICATION SOFTWARE – M&A MARKET SUMMARY
Source: Capital IQ and HW&Co. proprietary information.
Confidential
NOTABLE APPLICATION SOFTWARE M&A TRANSACTIONS
MEDIAN M&A REVENUE MULTIPLES
2Q '1
0
3Q '1
0
4Q '1
0
1Q '1
1
2Q '1
1
3Q '1
1
4Q '1
1
1Q '1
2
2Q '1
2
3Q '1
2
4Q '1
2
1Q '1
3
2Q '1
3
3Q '1
3
4Q '1
3
1Q '1
4
2Q '1
4
2Q '1
0
3Q '1
0
4Q '1
0
1Q '1
1
2Q '1
1
3Q '1
1
4Q '1
1
1Q '1
2
2Q '1
2
3Q '1
2
4Q '1
2
1Q '1
3
2Q '1
3
3Q '1
3
4Q '1
3
1Q '1
4
2Q '1
4
Confidential
230245
260267 271
285
268256
288
266
296
245 244252 246
235
289
1.7x
2.3x
1.7x
1.5x
2.0x
1.8x1.9x
1.1x
2.1x
2.4x
1.3x
1.5x
1.1x
2.2x 2.2x
3.1x
2.0x
9
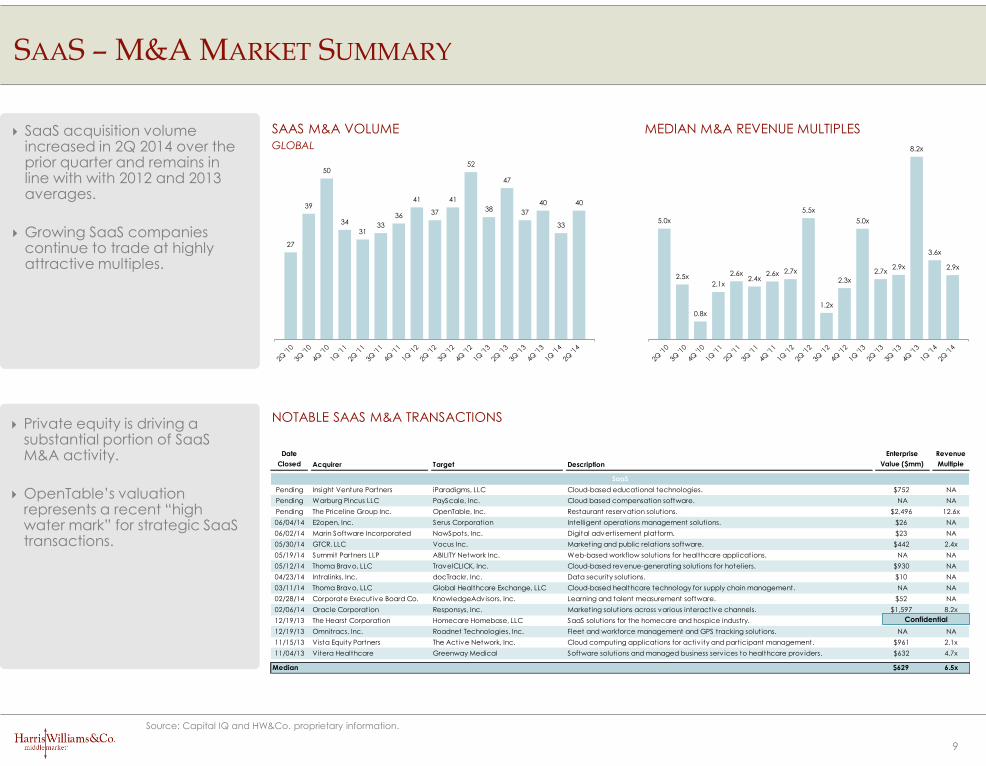
SaaS acquisition volume increased in 2Q 2014 over the prior quarter and remains in line with with 2012 and 2013 averages.
Growing SaaS companies continue to trade at highly attractive multiples.
Private equity is driving a substantial portion of SaaS M&A activity.
OpenTable’s valuation represents a recent “high water mark” for strategic SaaS transactions.
SAAS – M&A MARKET SUMMARY
Source: Capital IQ and HW&Co. proprietary information.
NOTABLE SAAS M&A TRANSACTIONS
SAAS M&A VOLUMEGLOBAL
MEDIAN M&A REVENUE MULTIPLES
2Q '1
0
3Q '1
0
4Q '1
0
1Q '1
1
2Q '1
1
3Q '1
1
4Q '1
1
1Q '1
2
2Q '1
2
3Q '1
2
4Q '1
2
1Q '1
3
2Q '1
3
3Q '1
3
4Q '1
3
1Q '1
4
2Q '1
4
2Q '1
0
3Q '1
0
4Q '1
0
1Q '1
1
2Q '1
1
3Q '1
1
4Q '1
1
1Q '1
2
2Q '1
2
3Q '1
2
4Q '1
2
1Q '1
3
2Q '1
3
3Q '1
3
4Q '1
3
1Q '1
4
2Q '1
4
Date
Closed Acquirer Target Description
Enterprise
Value ($mm)
Revenue
Multiple
SaaS
Pending Insight Venture Partners iParadigms, LLC Cloud-based educational technologies. $752 NA
Pending Warburg Pincus LLC PayScale, Inc. Cloud based compensation software. NA NA
Pending The Priceline Group Inc. OpenTable, Inc. Restaurant reservation solutions. $2,496 12.6x
06/04/14 E2open, Inc. Serus Corporation Intelligent operations management solutions. $26 NA
06/02/14 Marin Software Incorporated NowSpots, Inc. Digital advertisement platform. $23 NA
05/30/14 GTCR, LLC Vocus Inc. Marketing and public relations software. $442 2.4x
05/19/14 Summit Partners LLP ABILITY Network Inc. Web-based workflow solutions for healthcare applications. NA NA
05/12/14 Thoma Bravo, LLC TravelCLICK, Inc. Cloud-based revenue-generating solutions for hoteliers. $930 NA
04/23/14 Intralinks, Inc. docTrackr, Inc. Data security solutions. $10 NA
03/11/14 Thoma Bravo, LLC Global Healthcare Exchange, LLC Cloud-based healthcare technology for supply chain management. NA NA
02/28/14 Corporate Executive Board Co. KnowledgeAdvisors, Inc. Learning and talent measurement software. $52 NA
02/06/14 Oracle Corporation Responsys, Inc. Marketing solutions across various interactive channels. $1,597 8.2x
12/19/13 The Hearst Corporation Homecare Homebase, LLC SaaS solutions for the homecare and hospice industry. $625 8.9x
12/19/13 Omnitracs, Inc. Roadnet Technologies, Inc. Fleet and workforce management and GPS tracking solutions. NA NA
11/15/13 Vista Equity Partners The Active Network, Inc. Cloud computing applications for activ ity and participant management. $961 2.1x
11/04/13 Vitera Healthcare Greenway Medical Software solutions and managed business serv ices to healthcare providers. $632 4.7x
Median $629 6.5x
Confidential
27
39
50
34
3133
36
41
37
41
52
38
47
37
40
33
40
5.0x
2.5x
0.8x
2.1x
2.6x2.4x
2.6x 2.7x
5.5x
1.2x
2.3x
5.0x
2.7x2.9x
8.2x
3.6x
2.9x
10
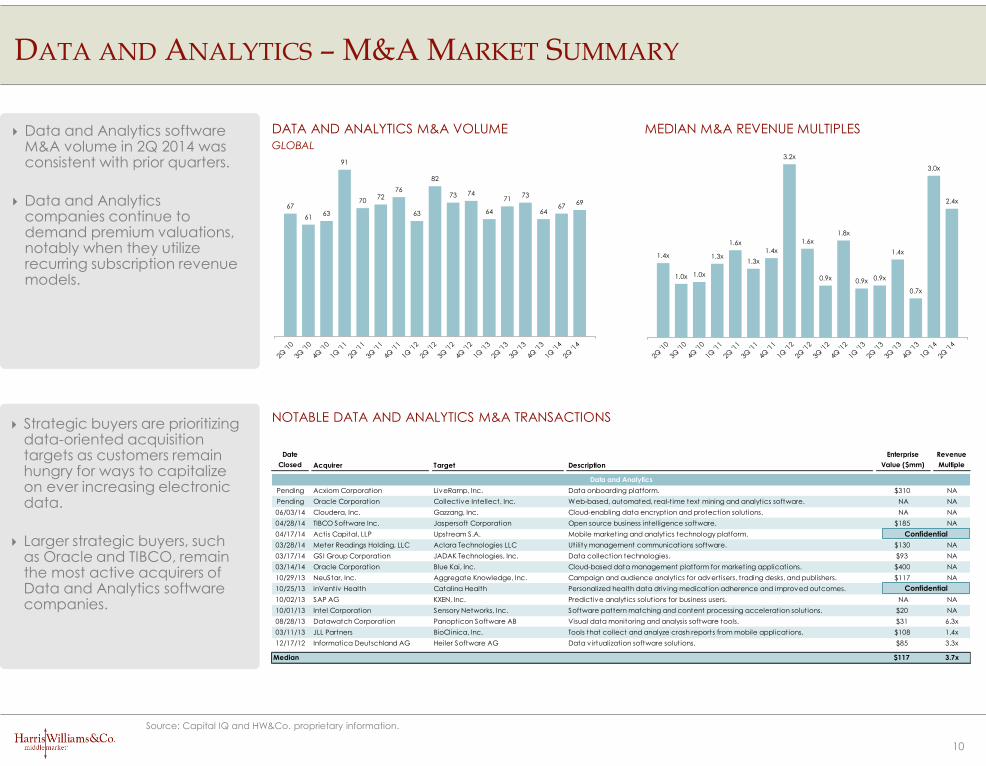
Data and Analytics software M&A volume in 2Q 2014 was consistent with prior quarters.
Data and Analytics companies continue to demand premium valuations, notably when they utilize recurring subscription revenue models.
Strategic buyers are prioritizing data-oriented acquisition targets as customers remain hungry for ways to capitalize on ever increasing electronic data.
Larger strategic buyers, such as Oracle and TIBCO, remain the most active acquirers of Data and Analytics software companies.
DATA AND ANALYTICS – M&A MARKET SUMMARY
Source: Capital IQ and HW&Co. proprietary information.
NOTABLE DATA AND ANALYTICS M&A TRANSACTIONS
DATA AND ANALYTICS M&A VOLUMEGLOBAL
MEDIAN M&A REVENUE MULTIPLES
2Q '1
0
3Q '1
0
4Q '1
0
1Q '1
1
2Q '1
1
3Q '1
1
4Q '1
1
1Q '1
2
2Q '1
2
3Q '1
2
4Q '1
2
1Q '1
3
2Q '1
3
3Q '1
3
4Q '1
3
1Q '1
4
2Q '1
4
2Q '1
0
3Q '1
0
4Q '1
0
1Q '1
1
2Q '1
1
3Q '1
1
4Q '1
1
1Q '1
2
2Q '1
2
3Q '1
2
4Q '1
2
1Q '1
3
2Q '1
3
3Q '1
3
4Q '1
3
1Q '1
4
2Q '1
4
Date
Closed Acquirer Target Description
Enterprise
Value ($mm)
Revenue
Multiple
Data and Analytics
Pending Acxiom Corporation LiveRamp, Inc. Data onboarding platform. $310 NA
Pending Oracle Corporation Collective Intellect, Inc. Web-based, automated, real-time text mining and analytics software. NA NA
06/03/14 Cloudera, Inc. Gazzang, Inc. Cloud-enabling data encryption and protection solutions. NA NA
04/28/14 TIBCO Software Inc. Jaspersoft Corporation Open source business intelligence software. $185 NA
04/17/14 Actis Capital, LLP Upstream S.A. Mobile marketing and analytics technology platform. $161 4.2x
03/28/14 Meter Readings Holding, LLC Aclara Technologies LLC Utility management communications software. $130 NA
03/17/14 GSI Group Corporation JADAK Technologies, Inc. Data collection technologies. $93 NA
03/14/14 Oracle Corporation Blue Kai, Inc. Cloud-based data management platform for marketing applications. $400 NA
10/29/13 NeuStar, Inc. Aggregate Knowledge, Inc. Campaign and audience analytics for advertisers, trading desks, and publishers. $117 NA
10/25/13 inVentiv Health Catalina Health Personalized health data driv ing medication adherence and improved outcomes. NA NA
10/02/13 SAP AG KXEN, Inc. Predictive analytics solutions for business users. NA NA
10/01/13 Intel Corporation Sensory Networks, Inc. Software pattern matching and content processing acceleration solutions. $20 NA
08/28/13 Datawatch Corporation Panopticon Software AB Visual data monitoring and analysis software tools. $31 6.3x
03/11/13 JLL Partners BioClinica, Inc. Tools that collect and analyze crash reports from mobile applications. $108 1.4x
12/17/12 Informatica Deutschland AG Heiler Software AG Data v irtualization software solutions. $85 3.3x
Median $117 3.7x
Confidential
Confidential
67
6163
91
7072
76
63
82
73 74
64
7173
6467
69
1.4x
1.0x 1.0x
1.3x
1.6x
1.3x
1.4x
3.2x
1.6x
0.9x
1.8x
0.9x 0.9x
1.4x
0.7x
3.0x
2.4x
4.3x
3.4x
1.3x
0.7x
2.3x
3.1x
4.8x 4.8x
1.8x
2.3x
2.8x
0.5x
1.8x
1.3x
4.0x
3.0x
2.5x
Date
Closed Acquirer Target Description
Enterprise
Value ($mm)
Revenue
Multiple
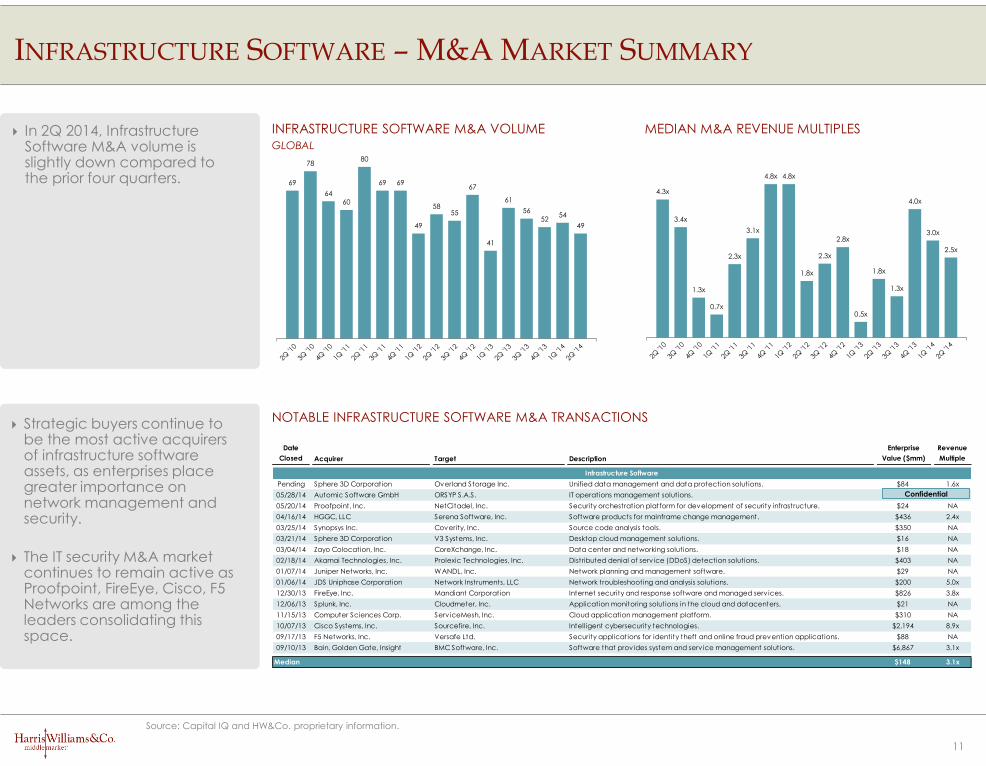
Infrastructure Software
Pending Sphere 3D Corporation Overland Storage Inc. Unified data management and data protection solutions. $84 1.6x
05/28/14 Automic Software GmbH ORSYP S.A.S. IT operations management solutions. $95 1.8x
05/20/14 Proofpoint, Inc. NetCitadel, Inc. Security orchestration platform for development of security infrastructure. $24 NA
04/16/14 HGGC, LLC Serena Software, Inc. Software products for mainframe change management. $436 2.4x
03/25/14 Synopsys Inc. Coverity, Inc. Source code analysis tools. $350 NA
03/21/14 Sphere 3D Corporation V3 Systems, Inc. Desktop cloud management solutions. $16 NA
03/04/14 Zayo Colocation, Inc. CoreXchange, Inc. Data center and networking solutions. $18 NA
02/18/14 Akamai Technologies, Inc. Prolexic Technologies, Inc. Distributed denial of serv ice (DDoS) detection solutions. $403 NA
01/07/14 Juniper Networks, Inc. WANDL, Inc. Network planning and management software. $29 NA
01/06/14 JDS Uniphase Corporation Network Instruments, LLC Network troubleshooting and analysis solutions. $200 5.0x
12/30/13 FireEye, Inc. Mandiant Corporation Internet security and response software and managed serv ices. $826 3.8x
12/06/13 Splunk, Inc. Cloudmeter, Inc. Application monitoring solutions in the cloud and datacenters. $21 NA
11/15/13 Computer Sciences Corp. Serv iceMesh, Inc. Cloud application management platform. $310 NA
10/07/13 Cisco Systems, Inc. Sourcefire, Inc. Intelligent cybersecurity technologies. $2,194 8.9x
09/17/13 F5 Networks, Inc. Versafe Ltd. Security applications for identity theft and online fraud prevention applications. $88 NA
09/10/13 Bain, Golden Gate, Insight BMC Software, Inc. Software that provides system and serv ice management solutions. $6,867 3.1x
Median $148 3.1x
11
In 2Q 2014, Infrastructure Software M&A volume is slightly down compared to the prior four quarters.
Strategic buyers continue to be the most active acquirers of infrastructure software assets, as enterprises place greater importance on network management and security.
The IT security M&A market continues to remain active as Proofpoint, FireEye, Cisco, F5 Networks are among the leaders consolidating this space.
INFRASTRUCTURE SOFTWARE – M&A MARKET SUMMARY
Source: Capital IQ and HW&Co. proprietary information.
INFRASTRUCTURE SOFTWARE M&A VOLUMEGLOBAL
NOTABLE INFRASTRUCTURE SOFTWARE M&A TRANSACTIONS
MEDIAN M&A REVENUE MULTIPLES
2Q '1
0
3Q '1
0
4Q '1
0
1Q '1
1
2Q '1
1
3Q '1
1
4Q '1
1
1Q '1
2
2Q '1
2
3Q '1
2
4Q '1
2
1Q '1
3
2Q '1
3
3Q '1
3
4Q '1
3
1Q '1
4
2Q '1
4
2Q '1
0
3Q '1
0
4Q '1
0
1Q '1
1
2Q '1
1
3Q '1
1
4Q '1
1
1Q '1
2
2Q '1
2
3Q '1
2
4Q '1
2
1Q '1
3
2Q '1
3
3Q '1
3
4Q '1
3
1Q '1
4
2Q '1
4
Confidential
69
78
64
60
80
69 69
49
5855
67
41
61
56
5254
49
12
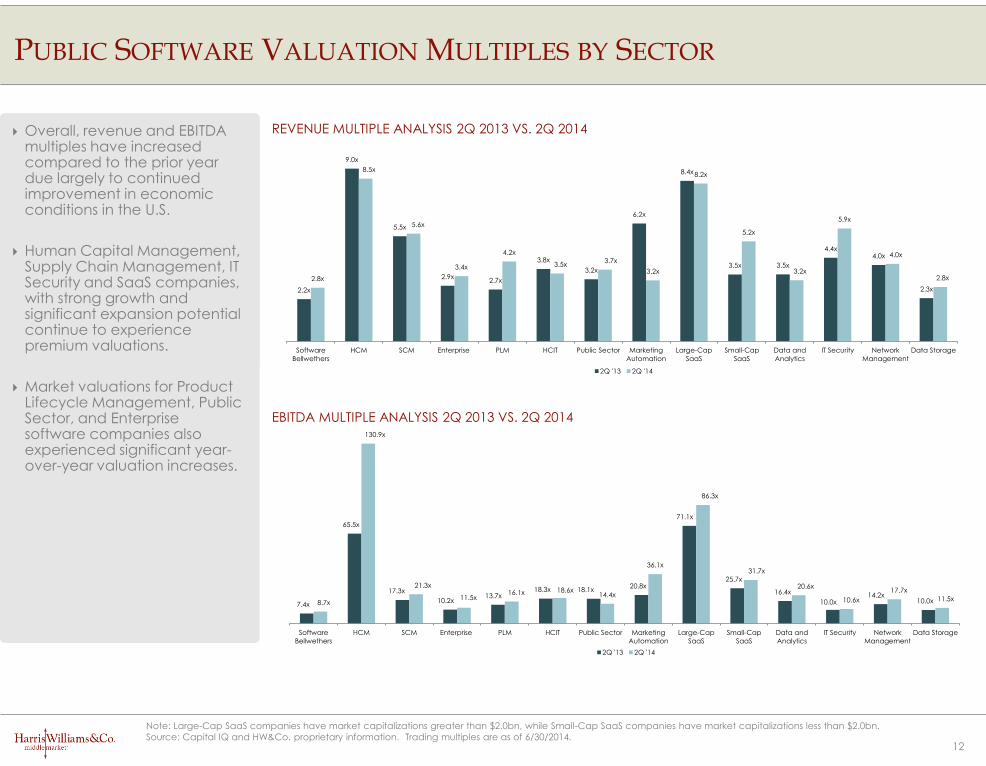
Overall, revenue and EBITDA multiples have increased compared to the prior year due largely to continued improvement in economic conditions in the U.S.
Human Capital Management, Supply Chain Management, IT Security and SaaS companies, with strong growth and significant expansion potential continue to experience premium valuations.
Market valuations for Product Lifecycle Management, Public Sector, and Enterprise software companies also experienced significant year-over-year valuation increases.
PUBLIC SOFTWARE VALUATION MULTIPLES BY SECTOR
2.2x
9.0x
5.5x
2.9x2.7x
3.8x
3.2x
6.2x
8.4x
3.5x 3.5x
4.4x4.0x
2.3x
2.8x
8.5x
5.6x
3.4x
4.2x
3.5x3.7x
3.2x
8.2x
5.2x
3.2x
5.9x
4.0x
2.8x
Software
Bellwethers
HCM SCM Enterprise PLM HCIT Public Sector Marketing
Automation
Large-Cap
SaaS
Small-Cap
SaaS
Data and
Analytics
IT Security Network
Management
Data Storage
2Q '13 2Q '14
7.4x
65.5x
17.3x
10.2x13.7x
18.3x 18.1x20.8x
71.1x
25.7x
16.4x
10.0x14.2x
10.0x8.7x
130.9x
21.3x
11.5x16.1x 18.6x
14.4x
36.1x
86.3x
31.7x
20.6x
10.6x
17.7x
11.5x
Software
Bellwethers
HCM SCM Enterprise PLM HCIT Public Sector Marketing
Automation
Large-Cap
SaaS
Small-Cap
SaaS
Data and
Analytics
IT Security Network
Management
Data Storage
2Q '13 2Q '14
Note: Large-Cap SaaS companies have market capitalizations greater than $2.0bn, while Small-Cap SaaS companies have market capitalizations less than $2.0bn.
Source: Capital IQ and HW&Co. proprietary information. Trading multiples are as of 6/30/2014.
EBITDA MULTIPLE ANALYSIS 2Q 2013 VS. 2Q 2014
REVENUE MULTIPLE ANALYSIS 2Q 2013 VS. 2Q 2014
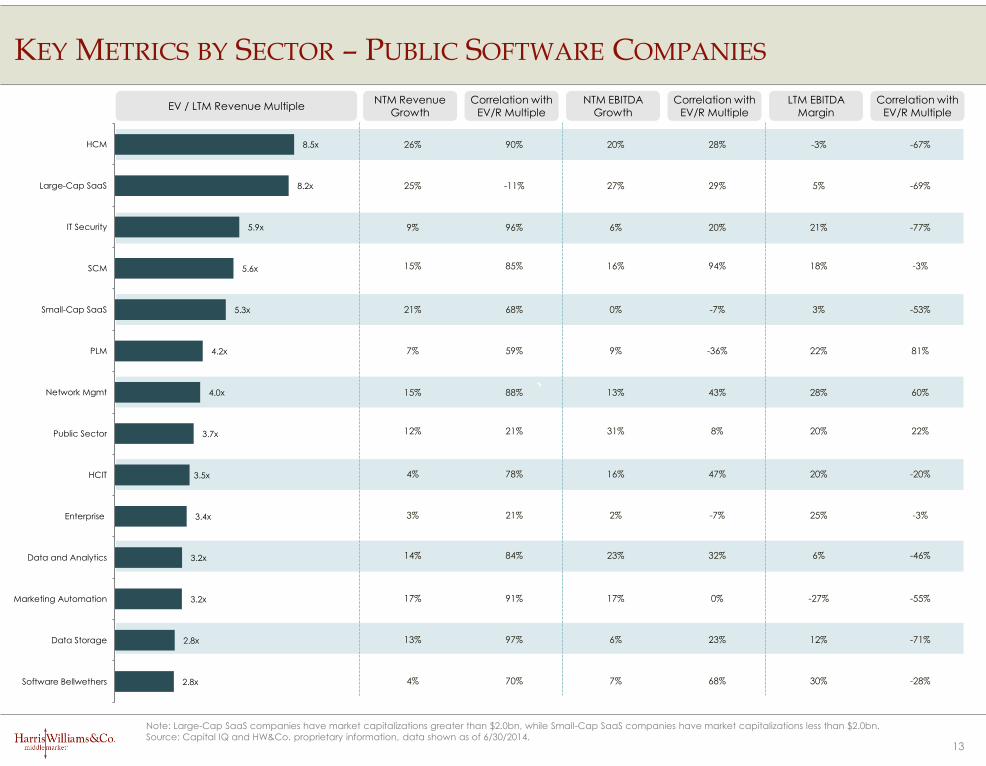
KEY METRICS BY SECTOR – PUBLIC SOFTWARE COMPANIES
13
`
EV / LTM Revenue MultipleNTM Revenue
Growth
90%
84%
21%
28%
32%
-7%
NTM EBITDA Growth
LTM EBITDA Margin
-67%
-46%
-3%
Correlation with EV/R Multiple
Correlation with EV/R Multiple
Correlation with EV/R Multiple
26%
14%
3%
20%
23%
2%
68% -7% -53%21% 0% 3%
-3%
96% 20% -77%9% 6% 21%
88% 43% 60%15% 13% 28%
59% -36% 81%7% 9% 22%
21% 8% 22%12% 31% 20%
85% 94% -3%15% 16% 18%
6%
25%
70% 68% -28%4% 7% 30%
17% 17% -27%
97% 23% -71%13% 6% 12%
-11% 29% -69%25% 27% 5%
91% 0% -55%
Note: Large-Cap SaaS companies have market capitalizations greater than $2.0bn, while Small-Cap SaaS companies have market capitalizations less than $2.0bn.
Source: Capital IQ and HW&Co. proprietary information, data shown as of 6/30/2014.
2.8x
2.8x
3.2x
3.2x
3.4x
3.5x
3.7x
4.0x
4.2x
5.3x
5.6x
5.9x
8.2x
8.5x
Software Bellwethers
Data Storage
Marketing Automation
Data and Analytics
Enterprise
HCIT
Public Sector
Network Mgmt
PLM
Small-Cap SaaS
SCM
IT Security
Large-Cap SaaS
HCM
78% 47% -20%4% 16% 20%
14
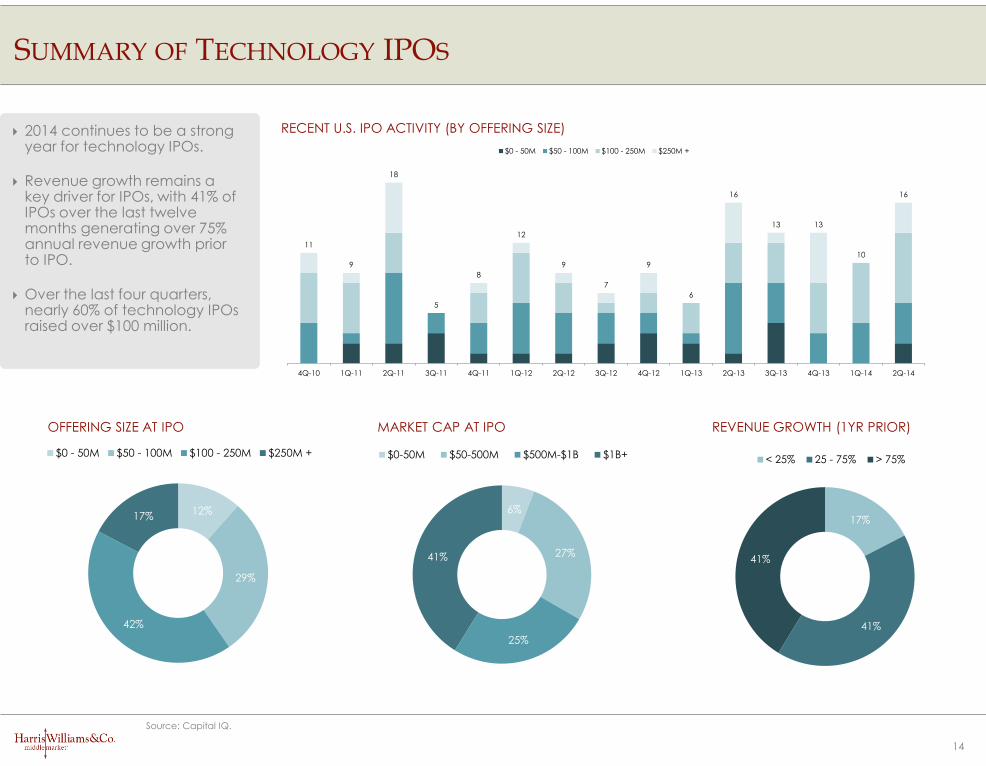
2014 continues to be a strong year for technology IPOs.
Revenue growth remains a key driver for IPOs, with 41% of IPOs over the last twelve months generating over 75% annual revenue growth prior to IPO.
Over the last four quarters, nearly 60% of technology IPOs raised over $100 million.
SUMMARY OF TECHNOLOGY IPOS
RECENT U.S. IPO ACTIVITY (BY OFFERING SIZE)
OFFERING SIZE AT IPO MARKET CAP AT IPO REVENUE GROWTH (1YR PRIOR)
Source: Capital IQ.
11
9
18
5
8
12
9
7
9
6
16
13 13
10
16
4Q-10 1Q-11 2Q-11 3Q-11 4Q-11 1Q-12 2Q-12 3Q-12 4Q-12 1Q-13 2Q-13 3Q-13 4Q-13 1Q-14 2Q-14
$0 - 50M $50 - 100M $100 - 250M $250M +
12%
29%
42%
17%
$0 - 50M $50 - 100M $100 - 250M $250M +
17%
41%
41%
< 25% 25 - 75% > 75%
6%
27%
25%
41%
$0-50M $50-500M $500M-$1B $1B+
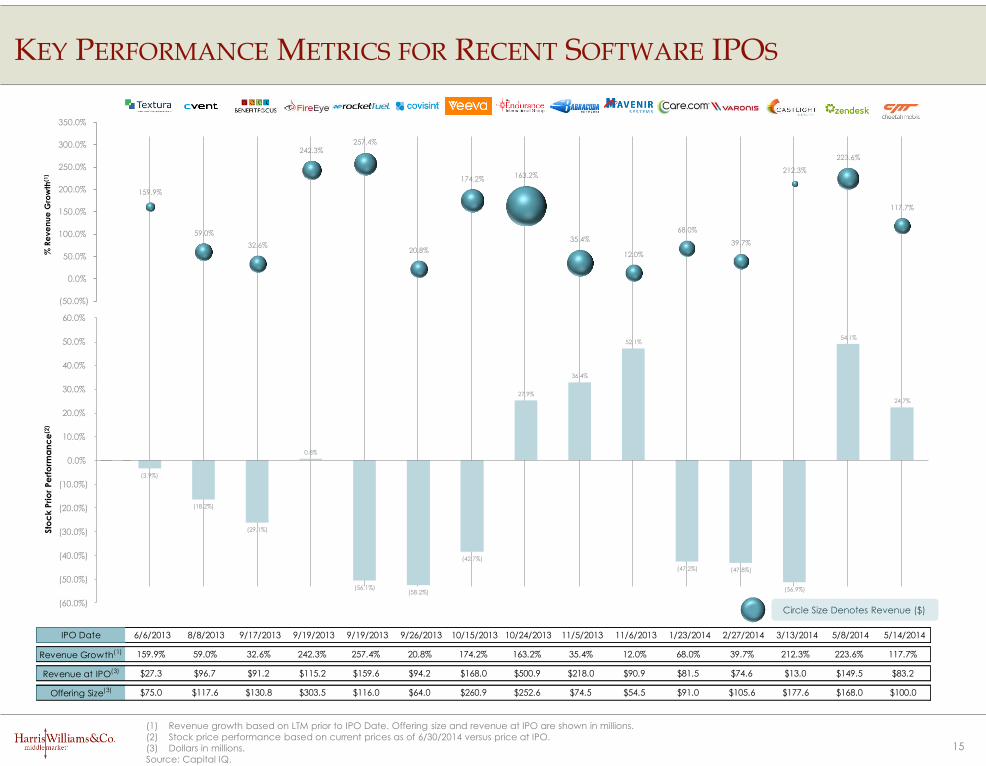
(1) Revenue growth based on LTM prior to IPO Date. Offering size and revenue at IPO are shown in millions.
(2) Stock price performance based on current prices as of 6/30/2014 versus price at IPO.
(3) Dollars in millions.
Source: Capital IQ.
Circle Size Denotes Revenue ($)
% R
eve
nu
e G
row
th(1
)
KEY PERFORMANCE METRICS FOR RECENT SOFTWARE IPOS
15
IPO Date 6/6/2013 8/8/2013 9/17/2013 9/19/2013 9/19/2013 9/26/2013 10/15/2013 10/24/2013 11/5/2013 11/6/2013 1/23/2014 2/27/2014 3/13/2014 5/8/2014 5/14/2014
Revenue Growth(1) 159.9% 59.0% 32.6% 242.3% 257.4% 20.8% 174.2% 163.2% 35.4% 12.0% 68.0% 39.7% 212.3% 223.6% 117.7%
Revenue at IPO(3) $27.3 $96.7 $91.2 $115.2 $159.6 $94.2 $168.0 $500.9 $218.0 $90.9 $81.5 $74.6 $13.0 $149.5 $83.2
Offering Size(3) $75.0 $117.6 $130.8 $303.5 $116.0 $64.0 $260.9 $252.6 $74.5 $54.5 $91.0 $105.6 $177.6 $168.0 $100.0
(3.9%)
(18.2%)
(29.1%)
0.8%
(56.1%)(58.2%)
(42.7%)
27.9%
36.4%
52.1%
(47.2%) (47.8%)
(56.9%)
54.1%
24.7%
159.9%
59.0%
32.6%
242.3% 257.4%
20.8%
174.2% 163.2%
35.4%
12.0%
68.0%
39.7%
212.3%
223.6%
117.7%
(50.0%)
0.0%
50.0%
100.0%
150.0%
200.0%
250.0%
300.0%
350.0%
33.9%
20.1%
4.5%
93.5%
(16.0%)
(44.7%)
(27.6%)
21.5%
75.3%
94.8%
11.9%
(29.4%)
(9.4%)(12.8%)
(26.3%)
Sto
ck
Prio
r Pe
rfo
rma
nc
e(2
)
(3.9%)
(18.2%)
(29.1%)
0.8%
(56.1%)(58.2%)
(42.7%)
27.9%
36.4%
52.1%
(47.2%) (47.8%)
(56.9%)
54.1%
24.7%
(60.0%)
(50.0%)
(40.0%)
(30.0%)
(20.0%)
(10.0%)
0.0%
10.0%
20.0%
30.0%
40.0%
50.0%
60.0%
4.9x4.8x
4.1x4.0x
3.4x
3.8x 3.8x
4.3x
4.7x 4.7x
5.6x
4.5x
3.3x
4.2x 4.3x
4.5x
4.8x4.9x
1997 1998 1999 2000 2001 2002 2003 2004 2005 2006 2007 2008 2009 2010 2011 2012 2013 1Q14
FLD/EBITDA SLD/EBITDA Other Sr Debt/EBITDA Sub Debt/EBITDA
16
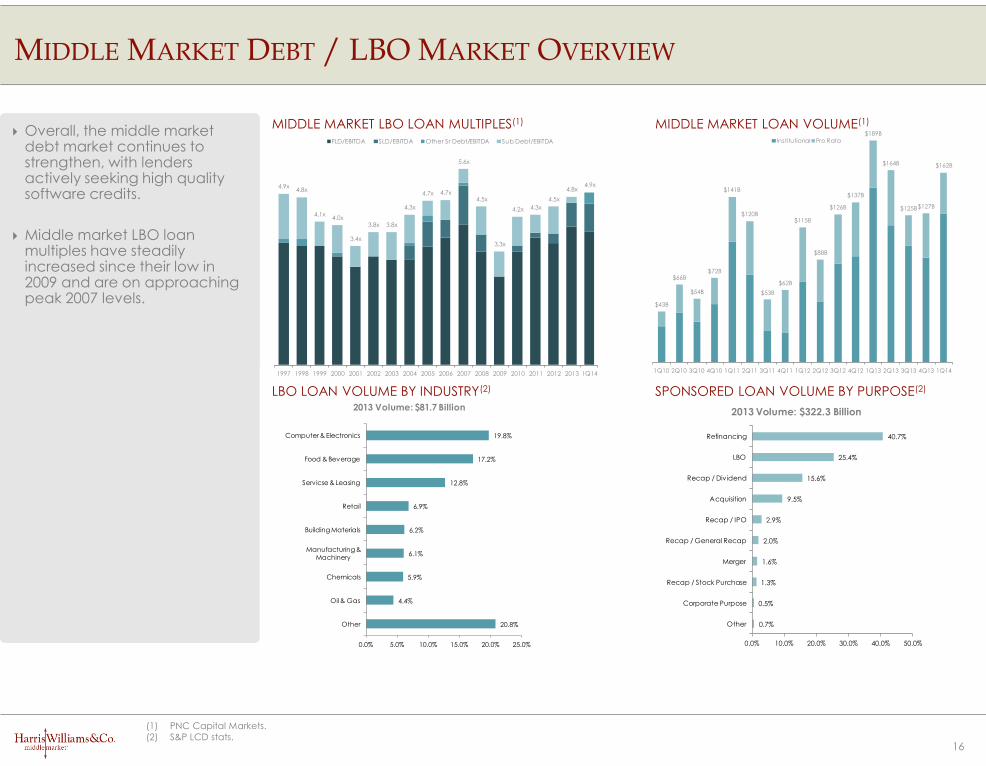
Overall, the middle market debt market continues to strengthen, with lenders actively seeking high quality software credits.
Middle market LBO loan multiples have steadily increased since their low in 2009 and are on approaching peak 2007 levels.
MIDDLE MARKET DEBT / LBO MARKET OVERVIEW
LBO LOAN VOLUME BY INDUSTRY(2) SPONSORED LOAN VOLUME BY PURPOSE(2)
MIDDLE MARKET LOAN VOLUME(1)
(1) PNC Capital Markets.
(2) S&P LCD stats.
MIDDLE MARKET LBO LOAN MULTIPLES(1)
0.7%
0.5%
1.3%
1.6%
2.0%
2.9%
9.5%
15.6%
25.4%
40.7%
0.0% 10.0% 20.0% 30.0% 40.0% 50.0%
Other
Corporate Purpose
Recap / Stock Purchase
Merger
Recap / General Recap
Recap / IPO
Acquisition
Recap / Dividend
LBO
Refinancing
2013 Volume: $322.3 Billion
20.8%
4.4%
5.9%
6.1%
6.2%
6.9%
12.8%
17.2%
19.8%
0.0% 5.0% 10.0% 15.0% 20.0% 25.0%
Other
Oil & Gas
Chemicals
Manufacturing & Machinery
Building Materials
Retail
Servicse & Leasing
Food & Beverage
Computer & Electronics
2013 Volume: $81.7 Billion
$43B
$66B
$54B
$72B
$141B
$120B
$53B
$62B
$115B
$88B
$126B
$137B
$189B
$164B
$125B$127B
$162B
1Q10 2Q10 3Q10 4Q10 1Q11 2Q11 3Q11 4Q11 1Q12 2Q12 3Q12 4Q12 1Q13 2Q13 3Q13 4Q13 1Q14
Institutional Pro Rata
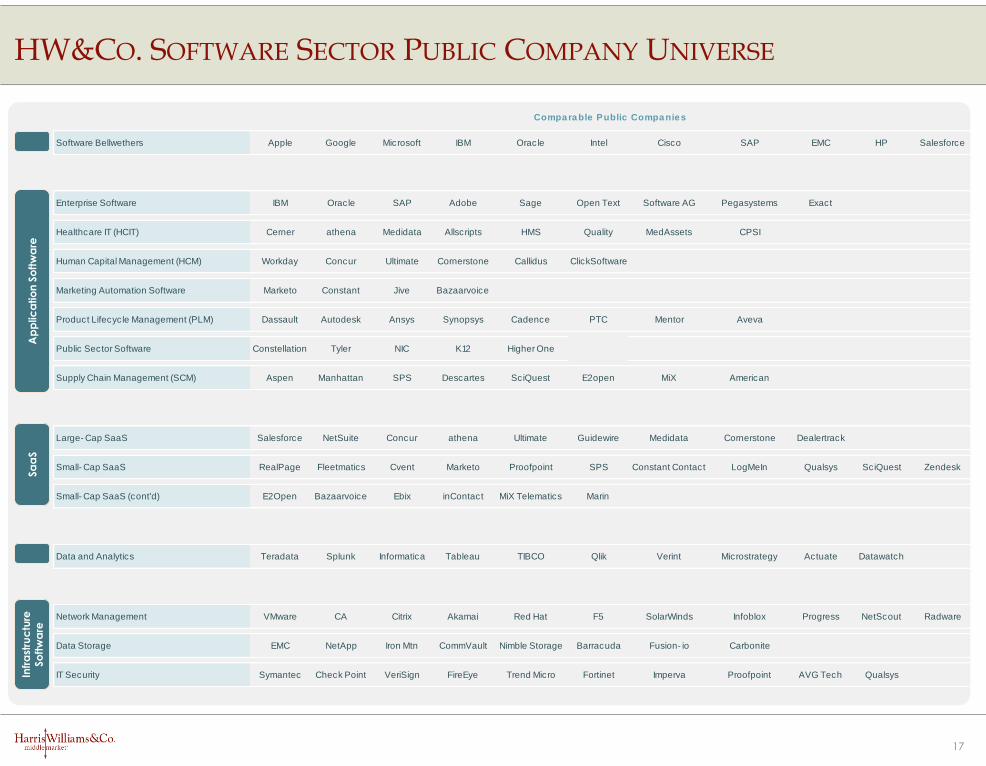
Software Bellwethers Apple Google Microsoft IBM Oracle Intel Cisco SAP EMC HP Salesforce
Enterprise Software IBM Oracle SAP Adobe Sage Open Text Software AG Pegasystems Exact
Healthcare IT (HCIT) Cerner athena Medidata Allscripts HMS Quality MedAssets CPSI
Human Capital Management (HCM) Workday Concur Ultimate Cornerstone Callidus ClickSoftware
Marketing Automation Software Marketo Constant Jive Bazaarvoice
Product Lifecycle Management (PLM) Dassault Autodesk Ansys Synopsys Cadence PTC Mentor Aveva
Public Sector Software Constellation Tyler NIC K12 Higher One
Supply Chain Management (SCM) Aspen Manhattan SPS Descartes SciQuest E2open MiX American
Large- Cap SaaS Salesforce NetSuite Concur athena Ultimate Guidewire Medidata Cornerstone Dealertrack
Small- Cap SaaS RealPage Fleetmatics Cvent Marketo Proofpoint SPS Constant Contact LogMeIn Qualsys SciQuest Zendesk
Small- Cap SaaS (cont'd) E2Open Bazaarvoice Ebix inContact MiX Telematics Marin
Data and Analytics Teradata Splunk Informatica Tableau TIBCO Qlik Verint Microstrategy Actuate Datawatch
Network Management VMware CA Citrix Akamai Red Hat F5 SolarWinds Infoblox Progress NetScout Radware
Data Storage EMC NetApp Iron Mtn CommVault Nimble Storage Barracuda Fusion- io Carbonite
IT Security Symantec Check Point VeriSign FireEye Trend Micro Fortinet Imperva Proofpoint AVG Tech Qualsys
Compa ra ble Public Compa nie s
Sa
aS
Ap
plic
atio
n S
oft
wa
reIn
fra
stru
ctu
re
So
ftw
are
HW&CO. SOFTWARE SECTOR PUBLIC COMPANY UNIVERSE
17
Harris Williams & Co. (www.harriswilliams.com) is a preeminent middle market investment bank focused on the advisory needs of clientsworldwide. The firm has deep industry knowledge, global transaction expertise, and an unwavering commitment to excellence. HarrisWilliams & Co. provides sell-side and acquisition advisory, restructuring advisory, board advisory, private placements, and capital marketsadvisory services.
Investment banking services are provided by Harris Williams LLC, a registered broker-dealer and member of FINRA and SIPC, and HarrisWilliams & Co. Ltd, which is authorized and regulated by the Financial Conduct Authority. Harris Williams & Co. is a trade name under whichHarris Williams LLC and Harris Williams & Co. Ltd conduct business.
THIS REPORT MAY CONTAIN REFERENCES TO REGISTERED TRADEMARKS, SERVICE MARKS AND COPYRIGHTS OWNED BY THIRD-PARTYINFORMATION PROVIDERS. NONE OF THE THIRD-PARTY INFORMATION PROVIDERS IS ENDORSING THE OFFERING OF, AND SHALL NOT IN ANYWAY BE DEEMED AN ISSUER OR UNDERWRITER OF, THE SECURITIES, FINANCIAL INSTRUMENTS OR OTHER INVESTMENTS DISCUSSED IN THIS REPORT,AND SHALL NOT HAVE ANY LIABILITY OR RESPONSIBILITY FOR ANY STATEMENTS MADE IN THE REPORT OR FOR ANY FINANCIAL STATEMENTS,FINANCIAL PROJECTIONS OR OTHER FINANCIAL INFORMATION CONTAINED OR ATTACHED AS AN EXHIBIT TO THE REPORT. FOR MOREINFORMATION ABOUT THE MATERIALS PROVIDED BY SUCH THIRD PARTIES, PLEASE CONTACT US AT +1-804-648-0072.
The information and views contained in this report were prepared by Harris Williams & Co. (“Harris Williams”). It is not a research report, assuch term is defined by applicable law and regulations, and is provided for informational purposes only. It is not to be construed as an offerto buy or sell or a solicitation of an offer to buy or sell any financial instruments or to participate in any particular trading strategy. Theinformation contained herein is believed by Harris Williams to be reliable, but Harris Williams makes no representation as to the accuracy orcompleteness of such information. Harris Williams and/or its affiliates may be market makers or specialists in, act as advisers or lenders to,have positions in and effect transactions in securities of companies mentioned herein and also may provide, may have provided, or mayseek to provide investment banking services for those companies. In addition, Harris Williams and/or its affiliates or their respective officers,directors and employees may hold long or short positions in the securities, options thereon or other related financial products of companiesdiscussed herein. Opinions, estimates and projections in this report constitute Harris Williams’ judgment and are subject to change withoutnotice. The financial instruments discussed in this report may not be suitable for all investors, and investors must make their own investmentdecisions using their own independent advisors as they believe necessary and based upon their specific financial situations and investmentobjectives. Also, past performance is not necessarily indicative of future results. No part of this material may be copied or duplicated in anyform or by any means, or redistributed, without Harris Williams’ prior written consent.
Copyright © 2014 Harris Williams & Co., all rights reserved.
HW&CO. CONTACT INFORMATION AND DISCLAIMER
18