Embed Size (px)
Citation preview
TM
Second Quarter 2011 Financial Results and Business Outlook
June 30 2011June 30, 2011
McCormick Brings Passion to FlavorThe following slides accompany a June 30, 2011 presentation to investment analysts. This information should be read in conjunction with the press release issued on that date. Reconciliations of any GAAP to non-GAAP financial information are included in these slides.

F d l ki I f tiForward-looking Information
Certain information contained in these materials and our remarks are “forward-looking statements” within the meaning of Section 21E of the Securities Exchange Act of 1934statements within the meaning of Section 21E of the Securities Exchange Act of 1934 , including those related to: expected results of operations of businesses acquired by us, the expected impact of the prices of raw materials on our results of operations and gross margins, the expected impact of raw material costs and our pricing actions on our results of operations and gross margins, the expected productivity and working capital improvements, expected trends in net sales and earnings performance and other financial measures, the expectations of pension and postretirement plan contributions the holding period and market risks associatedpension and postretirement plan contributions, the holding period and market risks associated with financial instruments, the impact of foreign exchange fluctuations, the adequacy of internally generated funds and existing sources of liquidity, such as the availability of bank financing, our ability to issue additional debt or equity securities, and our expectations regarding purchasing shares of our common stock under the existing authorization.
Forward-looking statements are based on management’s current views and assumptions and g g pinvolve risks and uncertainties that could significantly affect expected results. Results may be materially affected by external factor such as: damage to our reputation or brand name, business interruptions due to natural disasters or similar unexpected events, actions of competitors, customer relationships and financial condition, the ability to achieve expected cost savings and margin improvements, the successful acquisition and integration of new businesses, fluctuations in the cost and availability of raw and packaging materials, changes in regulatory y p g g , g g yrequirements, and global economic conditions generally which would include the availability of financing, interest and inflation rates as well as foreign currency fluctuations, fluctuations in the market value of pension plan assets and other risks described in our Form 10-K for the fiscal year ended November 30, 2010.
Actual results could differ materially from those projected in the forward-looking statements. We d t k bli ti t d t i bli l f d l ki t t t h th
McCormick Brings Passion to Flavor
undertake no obligation to update or revise publicly any forward-looking statements, whether as a result of new information, future events or otherwise.
22

B i R i d R t A tBusiness Review and Recent Agreements
Alan Wilson Chairman, President & CEO
McCormick Brings Passion to Flavor3

S d Q t NSecond Quarter News
► Strong financial resultsg
• Double-digit increase in sales and profit in the second quarter of fiscal year 2011
• Both consumer and industrial results were strong• Both consumer and industrial results were strong
• Driven by new products, increased distribution, brand marketing
• Raising estimated cost savings from Comprehensive Continuous Improvement program...CCI…to at least $45 million
► Announced agreement with Kohinoor Foods Ltd. to form joint venture in India
► Announced agreement to acquire Kamis S.A. in Poland
McCormick Brings Passion to Flavor4

D li i Hi h P fDelivering High Performance
► New products
Z t i ’ 16% 2Q G ill M t 5% 1HRecipe Inspirations
Zatarain’s +16% 2Q Grill Mates +5% 1Hnearly +20% 1H
McCormick Brings Passion to Flavor5
16 new Ducros items 21 new Vahiné items One pot meals
D li i Hi h P fDelivering High Performance
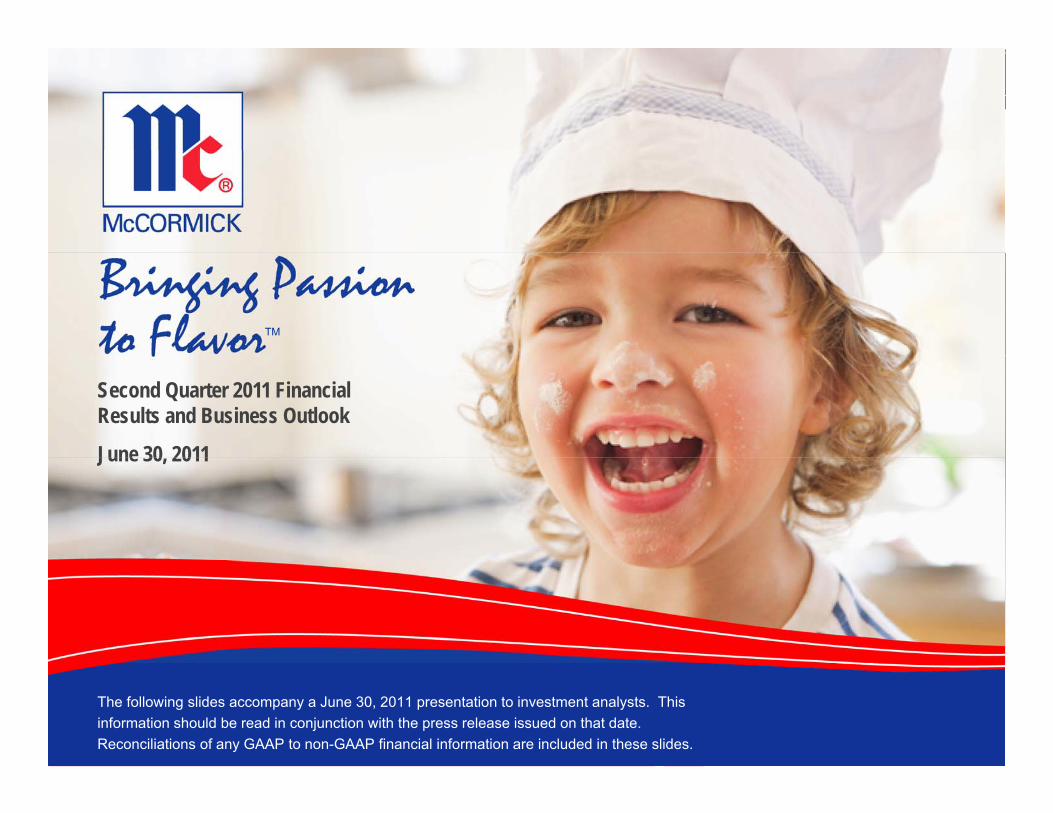
► Increased distribution
• Sam’s Club regional test market; national distribution of 2 Grill Mates items
Private label distribution into U S grocery retailer and leading drug store chain• Private label distribution into U.S. grocery retailer and leading drug store chain
• Recent win of private label for leading U.S. dollar store
• Recent win of Ducros brand for grocery retailer in France and Margão brand into leading discount retailer in Portugal
• Further gains in China for consumer business
• Expanded distribution of industrial products with quick service restaurant customer in U S• Expanded distribution of industrial products with quick service restaurant customer in U.S.
• Industrial customer distribution growth driving sales in Turkey and South Africa
• Supplying industrial products to support quick service restaurant customer’s expansion into India
McCormick Brings Passion to Flavor6

To help protect your privacy, PowerPoint prevented this external picture from being automatically downloaded. To download and display this picture, click Options in the Message Bar, and then click Enable external content.
D li i Hi h P f
► Brand marketing
Delivering High Performance
g
Schwartz cooking videos
Double-digit increase in gsales of Hispanic items Grill Mates Facebook fans
+100k in 2 weeksLaunch of Flavor forecast
McCormick Brings Passion to Flavor7
in China

D li i Hi h P f
► On-track to achieve at least $45 million in cost savings from CCI program
Delivering High Performance
► On track to achieve at least $45 million in cost savings from CCI program
U S IndustrialP j t d 2011 CCI U.S. Industrial
U.S. Consumer
Canada
Projected 2011 CCI savings by region
EMEA
Asia/Pacific
McCormick Brings Passion to Flavor8
E di B i i I di
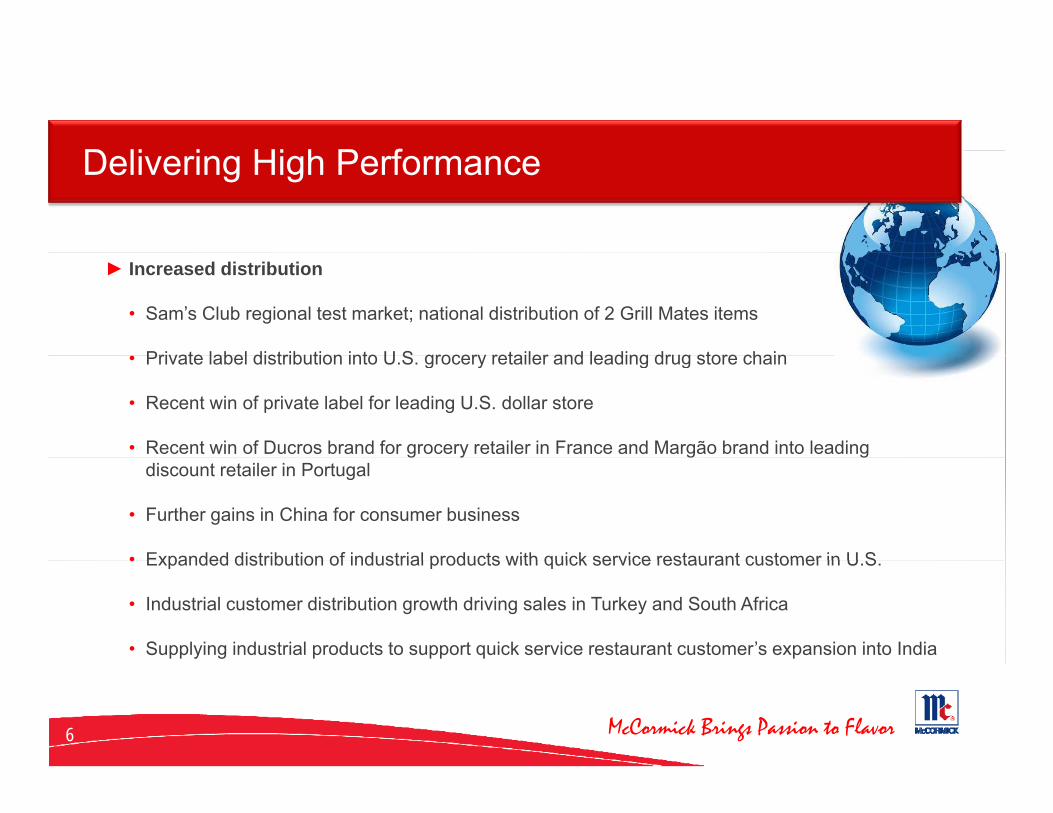
► Agreement to form joint venture: Kohinoor Speciality Foods India Private Limited
Expanding Business in India
► Agreement to form joint venture: Kohinoor Speciality Foods India Private Limited
L di ti l b d f t ll fl d Leading national brand of naturally flavored basmati rice in India; category share >15%
Approximately $85 million in sales
S l i t d bl di it t ith Sales growing at double-digit rate, with distribution network to 350,000 retailers
$115 million for 85% interest in joint venture
EPS ti b i i i 2012 EPS accretive beginning in 2012
Builds upon McCormick’s other investments in India
McCormick Brings Passion to Flavor9

St F th ld i P l dStrong Foothold in Poland
► Agreement to acquire Kamis
Leading brand in Poland with approximate shares
► Agreement to acquire Kamis
Leading brand in Poland with approximate shares of 45% spices and seasonings and 30% mustards
Approximately $ 105 million in sales
Sales growing at mid single-digit rateSales growing at mid single digit rate
Approximately $291 million for 100% shares of privately owned business
Expected to add $0 06 to EPS in 2012Expected to add $0.06 to EPS in 2012
Complements McCormick’s position in Western Europe
McCormick Brings Passion to Flavor10

E i M k t t d 12% S l
► With two latest agreements, consolidated sales in emerging markets
Emerging Markets to exceed 12% Sales
g , g gare expected to exceed 12% in 2012
Emerging markets
Emerging markets
Emerging markets
2006: 6% 2010: 9% 2012: exceed 12%
McCormick Brings Passion to Flavor11

R i f S d Q t R ltReview of Second Quarter Results
Gordon Stetz Executive Vice President, CFO & Treasurer
McCormick Brings Passion to Flavor12
S l G th b S tSales Growth by Segment
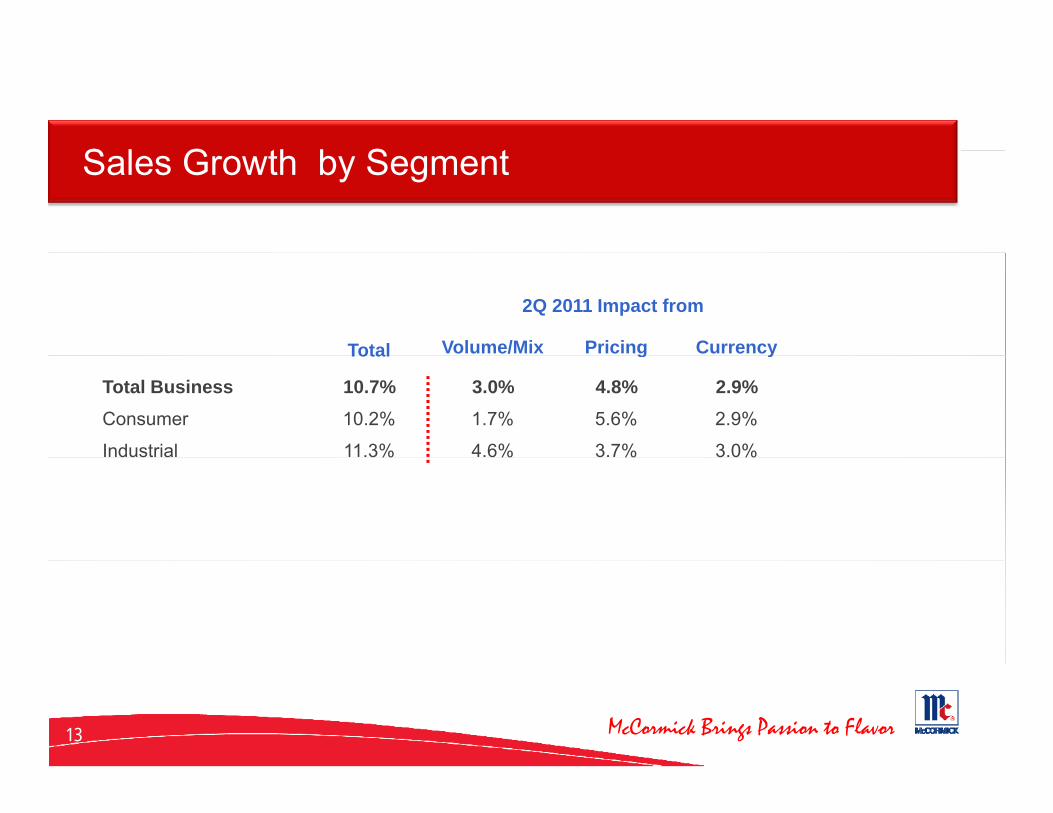
2Q 2011 Impact from
Total Volume/Mix Pricing CurrencyTotal g y
Total Business 10.7% 3.0% 4.8% 2.9%Consumer 10.2% 1.7% 5.6% 2.9%
Industrial 11.3% 4.6% 3.7% 3.0%
McCormick Brings Passion to Flavor13

S l G th C B i
2Q 2011 Impact from
Sales Growth: Consumer Business
Total Volume/Mix Pricing Currency
Consumer Business 10.2% 1.7% 5.6% 2.9%Americas 9.4% 2.0% 6.6% 0.8%
EMEA 10.3% (1.6%) 3.7% 8.2%
Asia/Pacific 22.5% 12.3% 0.4% 9.8%
► In Americas, unit growth led by authentic regional cuisine in U.S., dry seasoning mixes and Billy Bee honey in Canada
► EMEA results were mixed with growth in France and developing markets, declines in U.K. and The Netherlands
► A i /P ifi lt l d b i i Chi► Asia/Pacific results led by increase in China
► Operating income rose 13% to $77 million
• Higher sales, CCI cost savings
• Brand marketing down slightly from 18% increase in 2Q 2010
McCormick Brings Passion to Flavor14
S l G th I d t i l B iSales Growth: Industrial Business
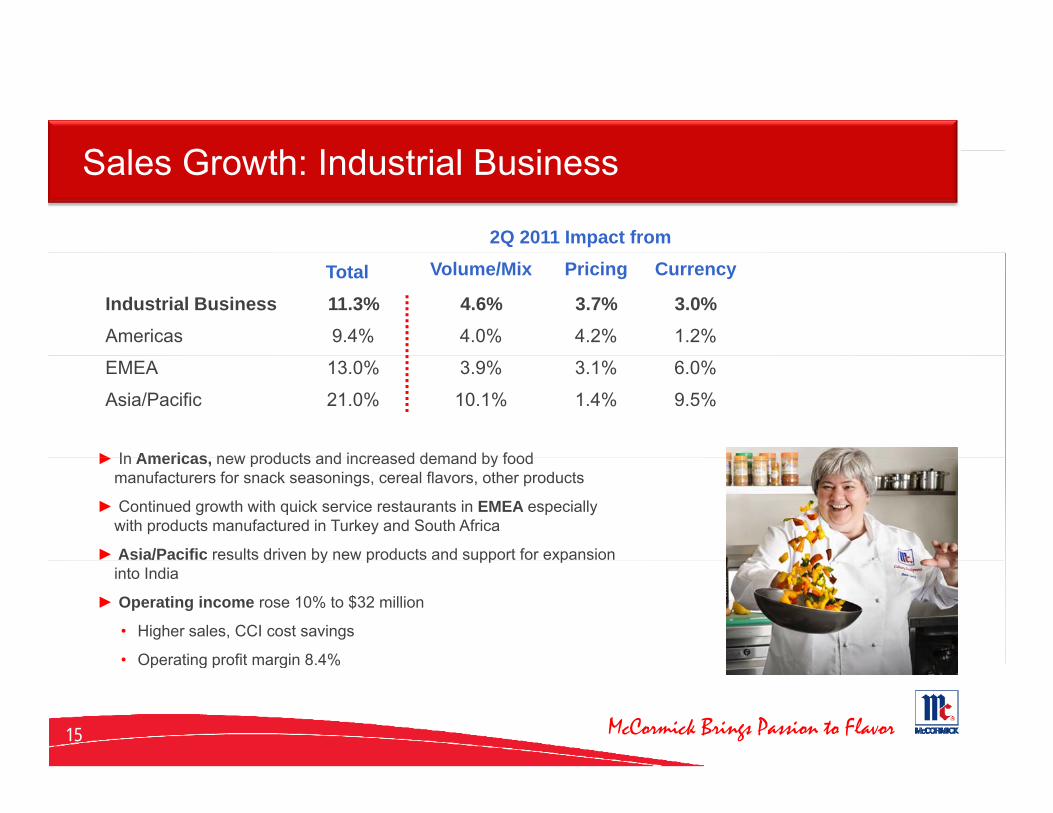
2Q 2011 Impact from
Total Volume/Mix Pricing Currency
Industrial Business 11.3% 4.6% 3.7% 3.0%Americas 9.4% 4.0% 4.2% 1.2%
► In Americas new products and increased demand by food
EMEA 13.0% 3.9% 3.1% 6.0%
Asia/Pacific 21.0% 10.1% 1.4% 9.5%
► In Americas, new products and increased demand by food manufacturers for snack seasonings, cereal flavors, other products
► Continued growth with quick service restaurants in EMEA especially with products manufactured in Turkey and South Africa
► Asia/Pacific results driven by new products and support for expansion y p pp pinto India
► Operating income rose 10% to $32 million
• Higher sales, CCI cost savings
• Operating profit margin 8 4%
McCormick Brings Passion to Flavor
Operating profit margin 8.4%
15

G P fit M i SG&AGross Profit Margin, SG&A
2Q 2011 2Q 2010 Change
Gross profit Margin 39.7% 40.9% (120 bps)
Selling, General & Administrative, 27 3% 28 7% (140 b )
► Off tti hi h t i l t ith i i ti d CCI t i H
Selling, General & Administrative, as percent of net sales 27.3% 28.7% (140 bps)
► Offsetting higher material costs with pricing actions and CCI cost savings. However, gross profit margin declined due to impact of increased pricing on net sales.
► As percent of net sales, Selling, General & Administrative expenses declined as pricing actions drove sales up at faster rate of increase; brand marketing support down $2 million in 2Q 20112Q 2011.
McCormick Brings Passion to Flavor16
E i Sh U 12%Earning per Share Up 12%
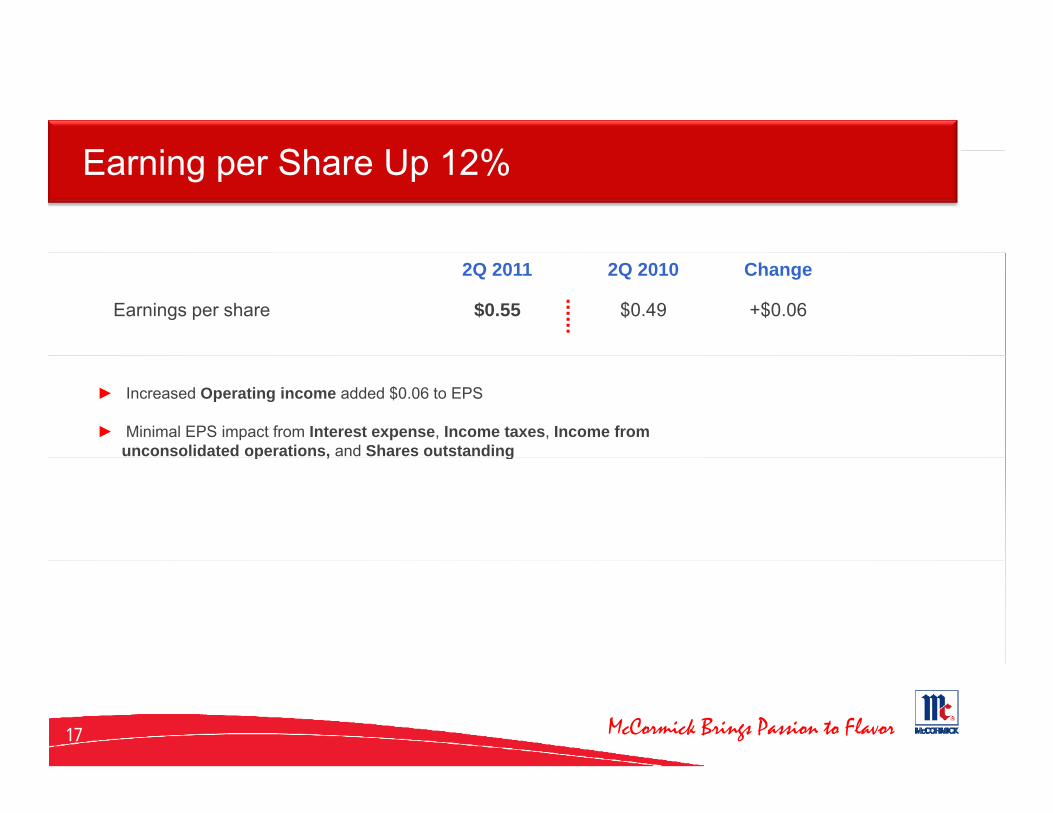
2Q 2011 2Q 2010 Change
Earnings per share $0.55 $0.49 +$0.06
► Increased Operating income added $0.06 to EPS
► Minimal EPS impact from Interest expense, Income taxes, Income from unconsolidated operations, and Shares outstandingp , g
McCormick Brings Passion to Flavor17
B l Sh t d C h Fl
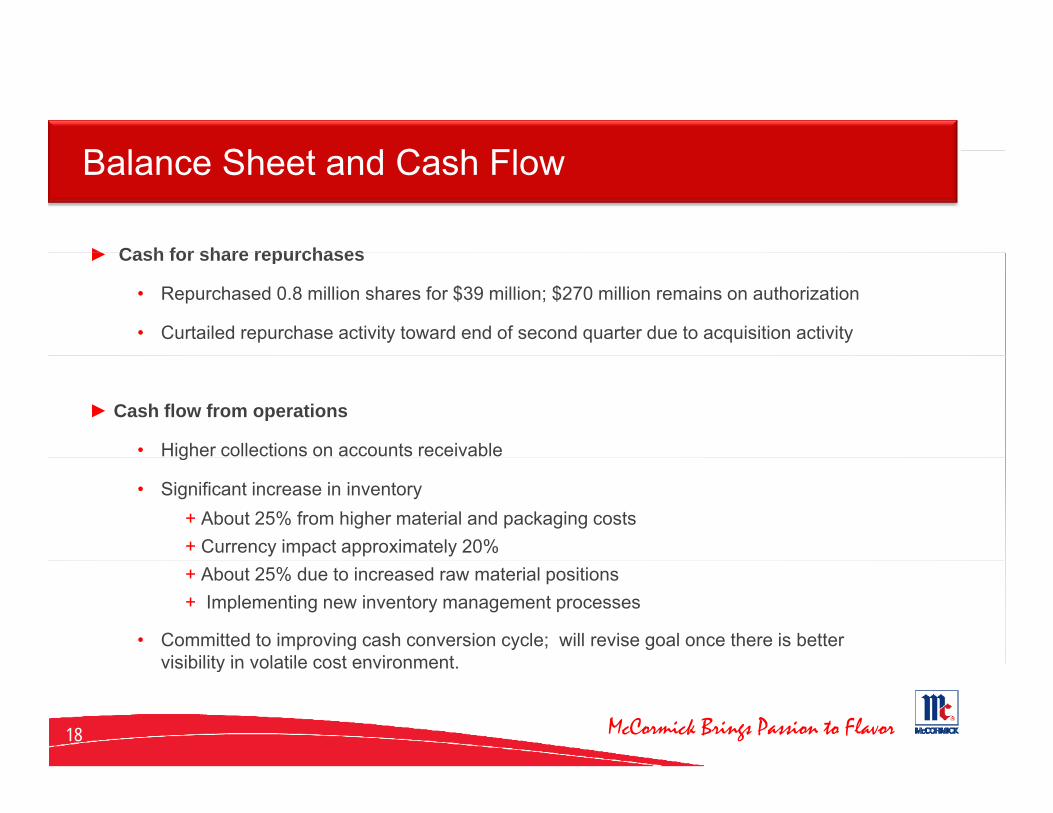
► Cash for share repurchases
Balance Sheet and Cash Flow
► Cash for share repurchases
• Repurchased 0.8 million shares for $39 million; $270 million remains on authorization
• Curtailed repurchase activity toward end of second quarter due to acquisition activity
► Cash flow from operations
• Higher collections on accounts receivableg
• Significant increase in inventory+ About 25% from higher material and packaging costs+ Currency impact approximately 20%+ About 25% due to increased raw material positions + Implementing new inventory management processes
• Committed to improving cash conversion cycle; will revise goal once there is better visibility in volatile cost environment
McCormick Brings Passion to Flavor
visibility in volatile cost environment.
18
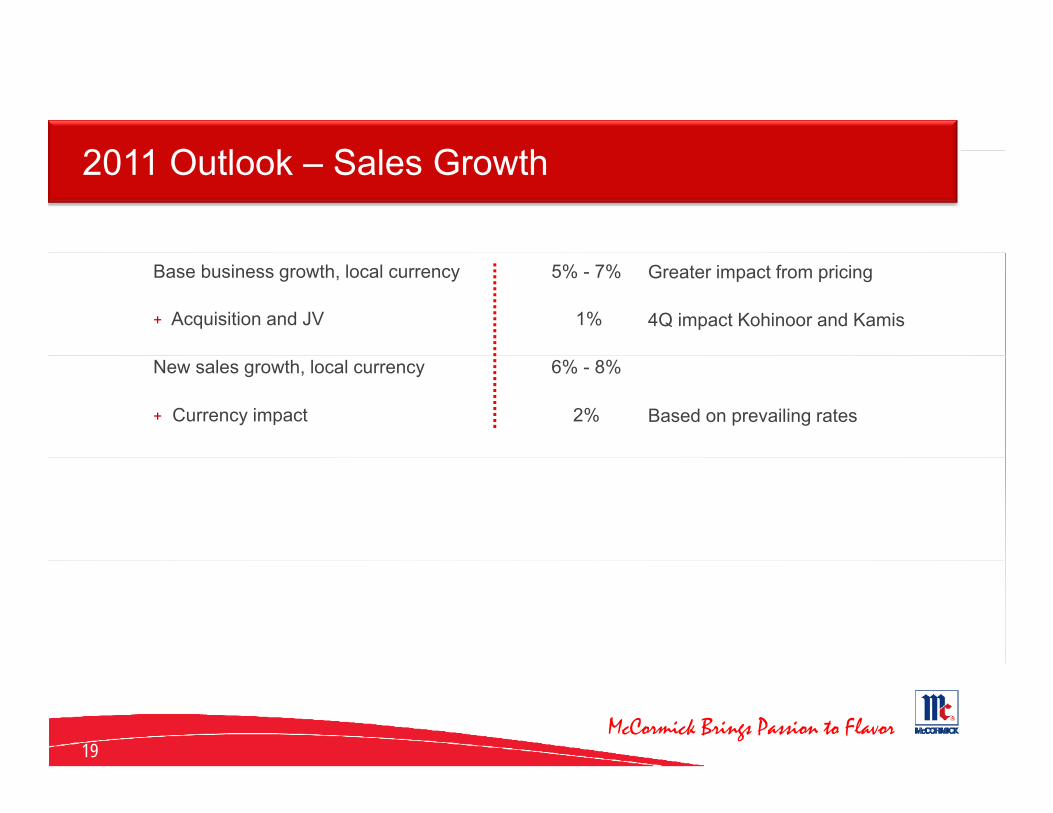
2011 O tl k S l G th2011 Outlook – Sales Growth
Base business growth, local currency 5% - 7%
+ Acquisition and JV 1%
Greater impact from pricing
4Q impact Kohinoor and Kamis
New sales growth, local currency 6% - 8%
+ Currency impact 2% Based on prevailing rates
McCormick Brings Passion to Flavor19
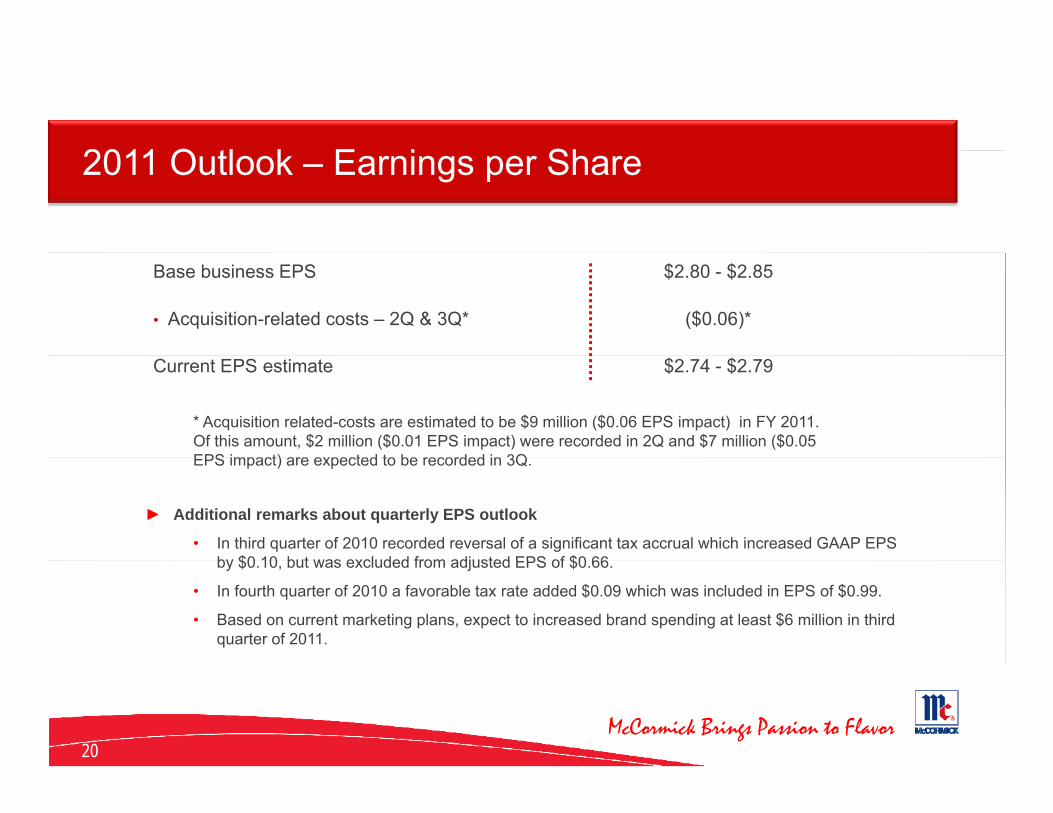
2011 O tl k E i Sh2011 Outlook – Earnings per Share
Base business EPS $2.80 - $2.85
• Acquisition-related costs – 2Q & 3Q* ($0.06)*
Current EPS estimate $2.74 - $2.79
* Acquisition related-costs are estimated to be $9 million ($0.06 EPS impact) in FY 2011. Of this amount, $2 million ($0.01 EPS impact) were recorded in 2Q and $7 million ($0.05 EPS impact) are expected to be recorded in 3QEPS impact) are expected to be recorded in 3Q.
► Additional remarks about quarterly EPS outlook
• In third quarter of 2010 recorded reversal of a significant tax accrual which increased GAAP EPS by $0 10 but was excluded from adjusted EPS of $0 66by $0.10, but was excluded from adjusted EPS of $0.66.
• In fourth quarter of 2010 a favorable tax rate added $0.09 which was included in EPS of $0.99.
• Based on current marketing plans, expect to increased brand spending at least $6 million in third quarter of 2011.
McCormick Brings Passion to Flavor20

2011 O tl k2011 Outlook
EPS $2.74 - $2.79
Sales growth, in local currency 6% - 8%
Gross profit margin Do n from prior earGross profit margin Down from prior year
CCI-led cost savings At least $45 million
Incremental brand marketing In line with sales increaseIncremental brand marketing In line with sales increase
Tax rate 31%
Outstanding shares About even with 2010g
Capital Expenditures $90 - $100 million
McCormick Brings Passion to Flavor21

TM
McCormick Brings Passion to Flavor
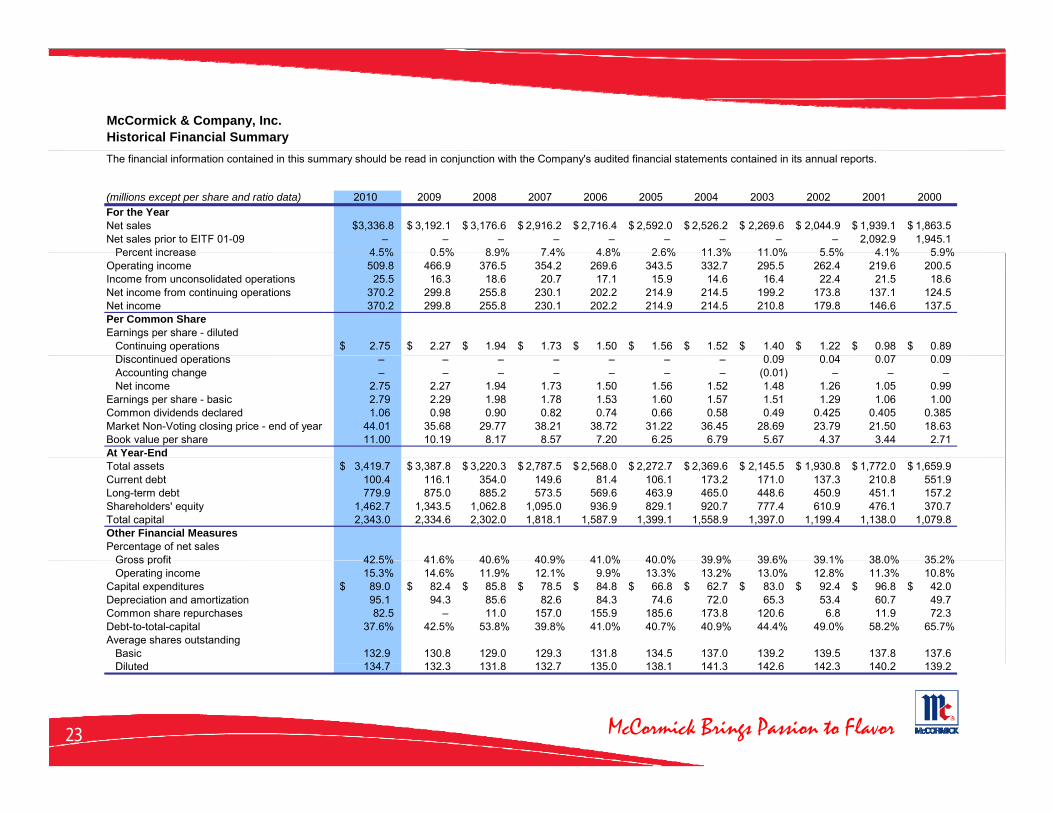
McCormick & Company, Inc.Historical Financial SummaryThe financial information contained in this summary should be read in conjunction with the Company's audited financial statements contained in its annual reports.
(millions except per share and ratio data) 2010 2009 2008 2007 2006 2005 2004 2003 2002 2001 2000For the YearNet sales $3,336.8 3,192.1$ 3,176.6$ 2,916.2$ 2,716.4$ 2,592.0$ 2,526.2$ 2,269.6$ 2,044.9$ 1,939.1$ 1,863.5$ Net sales prior to EITF 01-09 – – – – – – – – – 2,092.9 1,945.1
Percent increase 4 5% 0 5% 8 9% 7 4% 4 8% 2 6% 11 3% 11 0% 5 5% 4 1% 5 9% Percent increase 4.5% 0.5% 8.9% 7.4% 4.8% 2.6% 11.3% 11.0% 5.5% 4.1% 5.9%Operating income 509.8 466.9 376.5 354.2 269.6 343.5 332.7 295.5 262.4 219.6 200.5 Income from unconsolidated operations 25.5 16.3 18.6 20.7 17.1 15.9 14.6 16.4 22.4 21.5 18.6 Net income from continuing operations 370.2 299.8 255.8 230.1 202.2 214.9 214.5 199.2 173.8 137.1 124.5 Net income 370.2 299.8 255.8 230.1 202.2 214.9 214.5 210.8 179.8 146.6 137.5 Per Common ShareEarnings per share - diluted Continuing operations 2.75$ 2.27$ 1.94$ 1.73$ 1.50$ 1.56$ 1.52$ 1.40$ 1.22$ 0.98$ 0.89$
Di ti d ti 0 09 0 04 0 07 0 09 Discontinued operations – – – – – – – 0.09 0.04 0.07 0.09 Accounting change – – – – – – – (0.01) – – – Net income 2.75 2.27 1.94 1.73 1.50 1.56 1.52 1.48 1.26 1.05 0.99 Earnings per share - basic 2.79 2.29 1.98 1.78 1.53 1.60 1.57 1.51 1.29 1.06 1.00 Common dividends declared 1.06 0.98 0.90 0.82 0.74 0.66 0.58 0.49 0.425 0.405 0.385 Market Non-Voting closing price - end of year 44.01 35.68 29.77 38.21 38.72 31.22 36.45 28.69 23.79 21.50 18.63 Book value per share 11.00 10.19 8.17 8.57 7.20 6.25 6.79 5.67 4.37 3.44 2.71 At Year-EndTotal assets 3,419.7$ 3,387.8$ 3,220.3$ 2,787.5$ 2,568.0$ 2,272.7$ 2,369.6$ 2,145.5$ 1,930.8$ 1,772.0$ 1,659.9$ Current debt 100.4 116.1 354.0 149.6 81.4 106.1 173.2 171.0 137.3 210.8 551.9 Long-term debt 779.9 875.0 885.2 573.5 569.6 463.9 465.0 448.6 450.9 451.1 157.2 Shareholders' equity 1,462.7 1,343.5 1,062.8 1,095.0 936.9 829.1 920.7 777.4 610.9 476.1 370.7 Total capital 2,343.0 2,334.6 2,302.0 1,818.1 1,587.9 1,399.1 1,558.9 1,397.0 1,199.4 1,138.0 1,079.8 Other Financial MeasuresPercentage of net sales
Gross profit 42 5% 41 6% 40 6% 40 9% 41 0% 40 0% 39 9% 39 6% 39 1% 38 0% 35 2% Gross profit 42.5% 41.6% 40.6% 40.9% 41.0% 40.0% 39.9% 39.6% 39.1% 38.0% 35.2% Operating income 15.3% 14.6% 11.9% 12.1% 9.9% 13.3% 13.2% 13.0% 12.8% 11.3% 10.8%Capital expenditures 89.0$ 82.4$ 85.8$ 78.5$ 84.8$ 66.8$ 62.7$ 83.0$ 92.4$ 96.8$ 42.0$ Depreciation and amortization 95.1 94.3 85.6 82.6 84.3 74.6 72.0 65.3 53.4 60.7 49.7 Common share repurchases 82.5 – 11.0 157.0 155.9 185.6 173.8 120.6 6.8 11.9 72.3 Debt-to-total-capital 37.6% 42.5% 53.8% 39.8% 41.0% 40.7% 40.9% 44.4% 49.0% 58.2% 65.7%Average shares outstanding Basic 132.9 130.8 129.0 129.3 131.8 134.5 137.0 139.2 139.5 137.8 137.6
Dil t d 134 7 132 3 131 8 132 7 135 0 138 1 141 3 142 6 142 3 140 2 139 2
McCormick Brings Passion to Flavor23
Diluted 134.7 132.3 131.8 132.7 135.0 138.1 141.3 142.6 142.3 140.2 139.2

Notes to Historical Financial Summary
The historical financial summary includes the impact of certain items that affect the comparability of financial results year to year. In 2010, the Company had the benefit of the reversal of a significant tax accrual. From 2006 to 2009, restructuring charges were recorded and are included in the table below. Also, in 2008 an impairment charge of $29.0 million was recorded to reduce the value of the Silvo brand. Related to the acquisition of Lawry's in 2008, the Company recorded a net gain of $7.9 million. In 2004, the net gain from a special credit was recorded. The net impact of these items is reflected in the following table:
(millions except per share data) 2010 2009 2008 2007 2006 2005 2004 2003 2002 2001 2000Operating income – (16.2)$ (45.6)$ (34.0)$ (84.1)$ (11.2)$ 2.5$ (5.5)$ (7.5)$ (11.2)$ (1.1)$ Net income 13.9$ (10.9) (26.2) (24.2) (30.3) (7.5) 1.2 (3.6) (5.5) (7.4) (0.7) Earnings per share - diluted 0.10 (0.08) (0.20) (0.18) (0.22) (0.05) 0.01 (0.03) (0.04) (0.05) (0.01) g p ( ) ( ) ( ) ( ) ( ) ( ) ( ) ( ) ( )
The reconciliation below shows earnings per share excluding the items in the above table:
Non-GAAP reconciliation(per share data)Earnings per share - diluted 2010 2009 2008 2007 2006 2005 2004 2003 2002 2001 2000 Continuing operations 2.75$ 2.27$ 1.94$ 1.73$ 1.50$ 1.56$ 1.52$ 1.40$ 1.22$ 0.98$ 0.89$
It ff ti bilit 0 10 (0 08) (0 20) (0 18) (0 22) (0 05) 0 01 (0 03) (0 04) (0 05) (0 01) Items affecting comparability 0.10 (0.08) (0.20) (0.18) (0.22) (0.05) 0.01 (0.03) (0.04) (0.05) (0.01) Adjusted earnings per share from from continuing operations - diluted 2.65$ 2.35$ 2.14$ 1.91$ 1.72$ 1.61$ 1.51$ 1.43$ 1.26$ 1.03$ 0.90$
Other items that varied by year are noted below
In 2006, Mccormick began to record stock-based compensation expense and prior years' results have not been adjusted. Stock-based compensation impacted operating income net income and earnings per share as indicated in the table below:
(millions except per share data) 2010 2009 2008 2007 2006Operating income (11.9)$ (12.7)$ (17.9)$ (21.2)$ (22.0)$ Net income (8.9) (8.7) (12.4) (14.7) (15.1) Earnings per share - diluted (0.07) (0.07) (0.10) (0.11) (0.11)
Also in 2006 McCormick reclassified the net book value of in-store displays from property, plant and equipment to other assets. Capital expenditures through 2002 have
income, net income and earnings per share as indicated in the table below:
p y p p y p q p p p gbeen adjusted to reflect this reclassification. In 2003, McCormick sold its packaging segment and Jenks Sales Brokers in the U.K. and 2001 and 2002 were restated for these discontinued operations. Also in 2003, McCormick consolidated the lessor of a leased distribution center which was recorded as an accounting change. In 2002, all share data was adjusted for a 2-for-1 stock split. In addition, McCormick adopted SFAS No. 142, "Goodwill and Other Intangible Assets." Prior year resultshave not been adjusted. Also in 2002, McCormick implemented EITF 01-09. Results were reclassified for 2001 and 2000. Common dividends declared includes fourth quarter dividends which, in some years, were declared in December following the close of the fiscal year. Total capital includes debt and shareholders' equity.
McCormick Brings Passion to Flavor24