Embed Size (px)
Citation preview
2Q 17 QUARTERLY REPORT OPERA SOFTWARE ASA
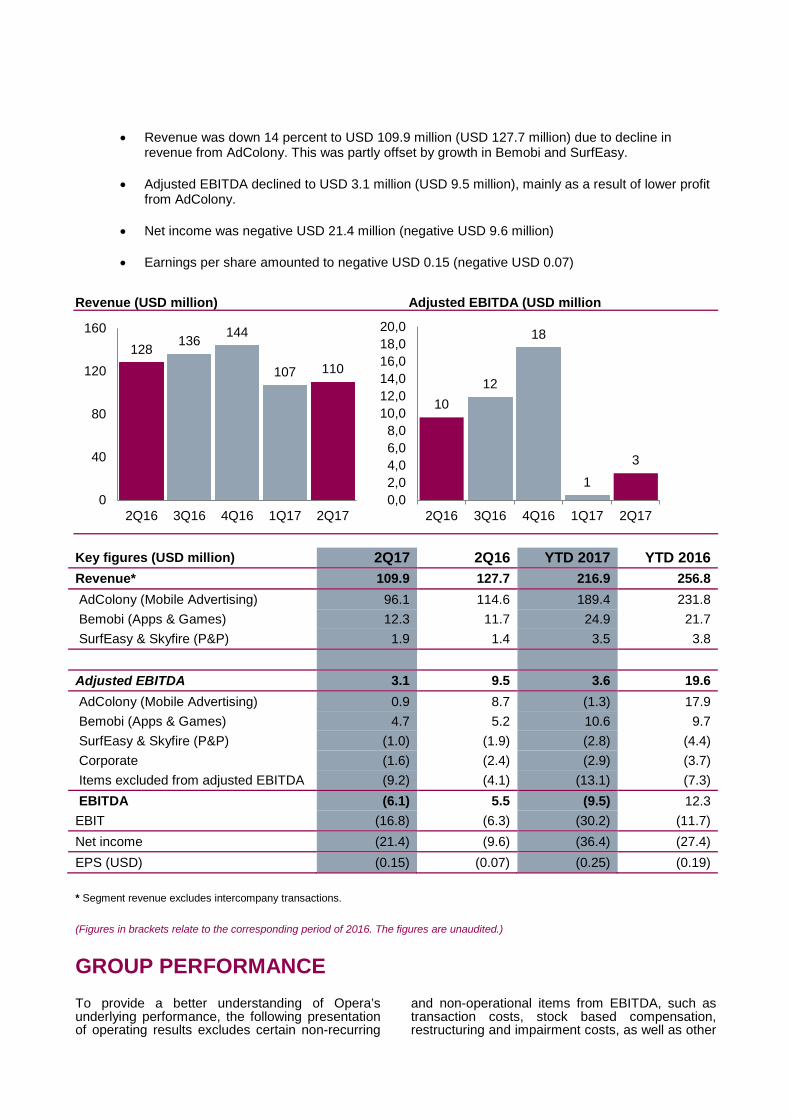
• Revenue was down 14 percent to USD 109.9 million (USD 127.7 million) due to decline in
revenue from AdColony. This was partly offset by growth in Bemobi and SurfEasy. • Adjusted EBITDA declined to USD 3.1 million (USD 9.5 million), mainly as a result of lower profit
from AdColony.
• Net income was negative USD 21.4 million (negative USD 9.6 million)
• Earnings per share amounted to negative USD 0.15 (negative USD 0.07) Revenue (USD million) Adjusted EBITDA (USD million
Key figures (USD million) 2Q17 2Q16 YTD 2017 YTD 2016 Revenue* 109.9 127.7 216.9 256.8 AdColony (Mobile Advertising) 96.1 114.6 189.4 231.8 Bemobi (Apps & Games) 12.3 11.7 24.9 21.7 SurfEasy & Skyfire (P&P) 1.9 1.4 3.5 3.8 Adjusted EBITDA 3.1 9.5 3.6 19.6 AdColony (Mobile Advertising) 0.9 8.7 (1.3) 17.9 Bemobi (Apps & Games) 4.7 5.2 10.6 9.7 SurfEasy & Skyfire (P&P) (1.0) (1.9) (2.8) (4.4) Corporate (1.6) (2.4) (2.9) (3.7) Items excluded from adjusted EBITDA (9.2) (4.1) (13.1) (7.3) EBITDA (6.1) 5.5 (9.5) 12.3 EBIT (16.8) (6.3) (30.2) (11.7) Net income (21.4) (9.6) (36.4) (27.4) EPS (USD) (0.15) (0.07) (0.25) (0.19)
* Segment revenue excludes intercompany transactions.
(Figures in brackets relate to the corresponding period of 2016. The figures are unaudited.)
GROUP PERFORMANCETo provide a better understanding of Opera’s underlying performance, the following presentation of operating results excludes certain non-recurring
and non-operational items from EBITDA, such as transaction costs, stock based compensation, restructuring and impairment costs, as well as other
128 136 144
107 110
0
40
80
120
160
2Q16 3Q16 4Q16 1Q17 2Q17
10 12
18
1
3
0,02,04,06,08,0
10,012,014,016,018,020,0
2Q16 3Q16 4Q16 1Q17 2Q17
items that are of a special nature or are not expected to be incurred on an ongoing basis.
Development during the quarter Revenue was down 14 percent in second quarter 2017 compared to the same period last year, driven by a decline in AdColony, partly offset by growth in Bemobi and SurfEasy. The decrease in revenue in AdColony is mainly due to slower product launch and ramp of new products.
Total operating costs (including depreciation and stock based compensation costs, but excluding restructuring and impairment costs) were down 9 percent from the corresponding period last year, mainly due to lower publisher cost as well as lower payroll and depreciation and amortization expenses.
Publisher and revenue share cost was USD 63.8 million in the quarter (USD 74.8 million), down 15 percent from the corresponding period last year as a result of lower revenue.
Payroll and related expenses, excluding stock-based compensation expenses, were USD 25.1 million in the quarter (USD 26.4 million), down 5 percent from the corresponding period last year as a result of strict cost control and a reduction in overall headcount.
Stock-based compensation expenses were USD 2.2 million in the quarter (USD 2.0 million), up 14 percent from the corresponding period last year as a result of new grants of options and RSU’s.
Depreciation and amortization expenses were USD 10.7 million in the quarter (USD 11.8 million), down 9 percent from the corresponding period last year as intangible assets from prior acquisitions are gradually amortized.
Other operating expenses were USD 17.9 million in the quarter (USD 17.0 million), up 5 percent from the corresponding period last year, due primarily to increased cost in Bemobi and higher bad debt reserves in AdColony.
Opera recognized a restructuring charge of USD 6.9 million in the quarter primarily linked to salary, offices and legal cost associated with reorganizing and streamlining the AdColony and Skyfire businesses.
Adjusted EBITDA and EBITDA Adjusted EBITDA Adjusted EBITDA was USD 3.1 million in second quarter 2017, down from USD 9.6 million in the corresponding period in 2016, due in particular to weaker performance from AdColony. . A total of USD 9.2 million was excluded from adjusted EBITDA, related to restructuring costs and stock-based compensation expenses.
EBITDA EBITDA was negative USD 6.1 million in the second quarter 2017, down from USD 5.5 million in the corresponding period in 2016, due in particular to weaker performance from AdColony and a USD 6.9 million restructuring charge
Net financial items Opera recognized a net loss from net financial items in the quarter of USD 12.0 million, compared to a loss of USD 1.8 million in corresponding period last year. The net loss is predominantly related to interest expense related to contingent considerations and FX losses.
Net income Second quarter 2017 net income was negative USD 21.4 million compared to negative USD 9.6 million in the corresponding period last year.
EPS and fully diluted EPS were negative USD 0.15 and USD 0.15, respectively, in second quarter 2017, compared to negative USD 0.07 and USD 0.07, respectively, in second quarter 2016.
Financial position and cash flow Opera’s net cash flow from operating activities was negative USD 1.0 million in second quarter 2017 up from negative USD 9.2 million in second quarter 2016.
Cash flow from investment activities amounted to negative USD 16.9 million, vs negative USD 10.2 million from the corresponding quarter last year. Cash outlays from PP&E and capitalized R&D were USD 9.5 million and USD 7.4 million in earn out payments made in the quarter.
Cash flow from financing activities amounted to negative USD 5.7 million of which the vast majority is related to repurchase of own shares.
Cash and cash equivalents at the end of the second quarter 2017 were USD 174.7 million compared to USD 117.3 million in the second quarter 2016.
Opera has a credit facility of USD 150 million and at the end of the second quarter 2017, USD 100 million of this credit facility has been drawn. Net cash was USD 74.7 million at the end of the quarter.
The company’s equity was USD 482.8 million at the end of the quarter, corresponding to an equity ratio of 63.8%.
Organization At the end of second quarter 2017 Opera had 851 full-time employees and equivalents.
-BUSINESS OVERVIEW
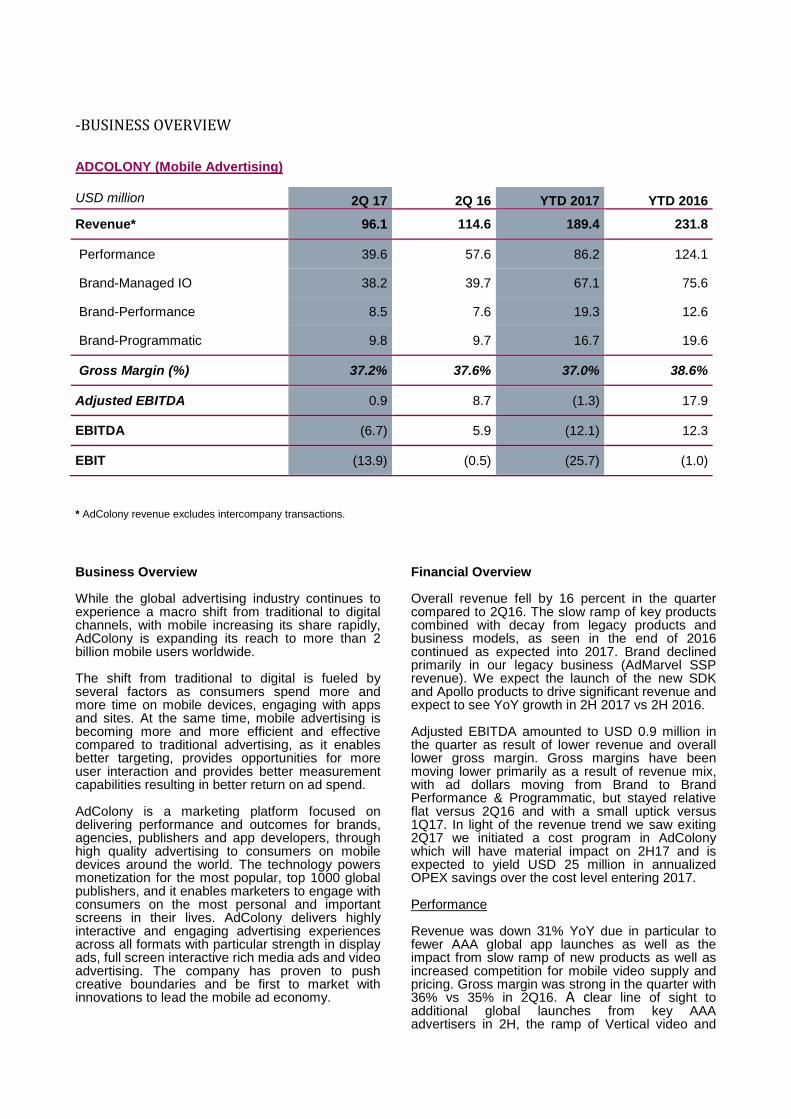
ADCOLONY (Mobile Advertising) USD million 2Q 17 2Q 16 YTD 2017 YTD 2016
Revenue* 96.1 114.6 189.4 231.8
Performance 39.6 57.6 86.2 124.1
Brand-Managed IO 38.2 39.7 67.1 75.6
Brand-Performance 8.5 7.6 19.3 12.6
Brand-Programmatic 9.8 9.7 16.7 19.6
Gross Margin (%) 37.2% 37.6% 37.0% 38.6%
Adjusted EBITDA 0.9 8.7 (1.3) 17.9
EBITDA (6.7) 5.9 (12.1) 12.3
EBIT (13.9) (0.5) (25.7) (1.0)
* AdColony revenue excludes intercompany transactions.
Business Overview While the global advertising industry continues to experience a macro shift from traditional to digital channels, with mobile increasing its share rapidly, AdColony is expanding its reach to more than 2 billion mobile users worldwide. The shift from traditional to digital is fueled by several factors as consumers spend more and more time on mobile devices, engaging with apps and sites. At the same time, mobile advertising is becoming more and more efficient and effective compared to traditional advertising, as it enables better targeting, provides opportunities for more user interaction and provides better measurement capabilities resulting in better return on ad spend. AdColony is a marketing platform focused on delivering performance and outcomes for brands, agencies, publishers and app developers, through high quality advertising to consumers on mobile devices around the world. The technology powers monetization for the most popular, top 1000 global publishers, and it enables marketers to engage with consumers on the most personal and important screens in their lives. AdColony delivers highly interactive and engaging advertising experiences across all formats with particular strength in display ads, full screen interactive rich media ads and video advertising. The company has proven to push creative boundaries and be first to market with innovations to lead the mobile ad economy.
Financial Overview Overall revenue fell by 16 percent in the quarter compared to 2Q16. The slow ramp of key products combined with decay from legacy products and business models, as seen in the end of 2016 continued as expected into 2017. Brand declined primarily in our legacy business (AdMarvel SSP revenue). We expect the launch of the new SDK and Apollo products to drive significant revenue and expect to see YoY growth in 2H 2017 vs 2H 2016. Adjusted EBITDA amounted to USD 0.9 million in the quarter as result of lower revenue and overall lower gross margin. Gross margins have been moving lower primarily as a result of revenue mix, with ad dollars moving from Brand to Brand Performance & Programmatic, but stayed relative flat versus 2Q16 and with a small uptick versus 1Q17. In light of the revenue trend we saw exiting 2Q17 we initiated a cost program in AdColony which will have material impact on 2H17 and is expected to yield USD 25 million in annualized OPEX savings over the cost level entering 2017. Performance Revenue was down 31% YoY due in particular to fewer AAA global app launches as well as the impact from slow ramp of new products as well as increased competition for mobile video supply and pricing. Gross margin was strong in the quarter with 36% vs 35% in 2Q16. A clear line of sight to additional global launches from key AAA advertisers in 2H, the ramp of Vertical video and
overall SDK penetration are all catalysts to growth in 2H vs 1H 2017. The Performance business had a weak quarter through May with a significant uptick in revenue in June. Brand-Managed IO Revenue was down 4% YoY due in particular to shift in spending from our brand partners from Brand Managed IO over to Brand Performance and Programmatic. Gross margin was down from a very elevated 46% to 42% due to AdColony moving to more transparent, automated and scalable products. Brand-Performance Revenue was up by 12% as we successfully moved part of spend from our brand partners from Brand IO over to Brand Performance. However, gross margin was down somewhat to 28% from 31% in 2Q16. Brand-Programmatic Revenue was flat compared to 2Q16 as a decrease in revenue from our legacy offering (AdMarvel), offset solid growth in our programmatic offering. Gross margins were up somewhat from 26% to 29%. Product update Key to the success in 2017 is the successful launch and ramp of several products, many of which are part of the bigger Apollo initiative. SDK The new SDK enables richer ad units which again fuels higher CPM’s as well as being a key differentiator in the market. SDK 3.x is now stable and is in ramping across our key publishers. As of
end 2Q17 penetration was at close to 40%. LTV User Score Additional data on quality users is increasing eCPI/eCPM. Targets quality users who are most likely to make in-app purchases. Entering 2nd stage of private beta, with initial results very promising. Post Install-Event and Granular Pricing Performance business seeing increased CPI, and increased advertiser buying and optimization capabilities to maximize spend. It also maximizes our ability to drive ROAS by aligning campaign set-up with PIE performance. Playables Playables are driving significantly higher engagement rates, which will positively impact the Performance business. Continue private beta testing across a wider range of advertisers. Core improvements Updates drove increased publisher eCPMs, higher advertiser campaign install rates and increased consumer click through rates. We are dedicating increased time and resources to improving Core to increase the efficiency of the Performance business, and minimize impact of fraud. Zone Price Controls Increased waterfall position delivers better impressions, which will increase revenue in the Performance business. Roll out waterfall configuration advancements to increase waterfall priority and deepen publisher relationships.
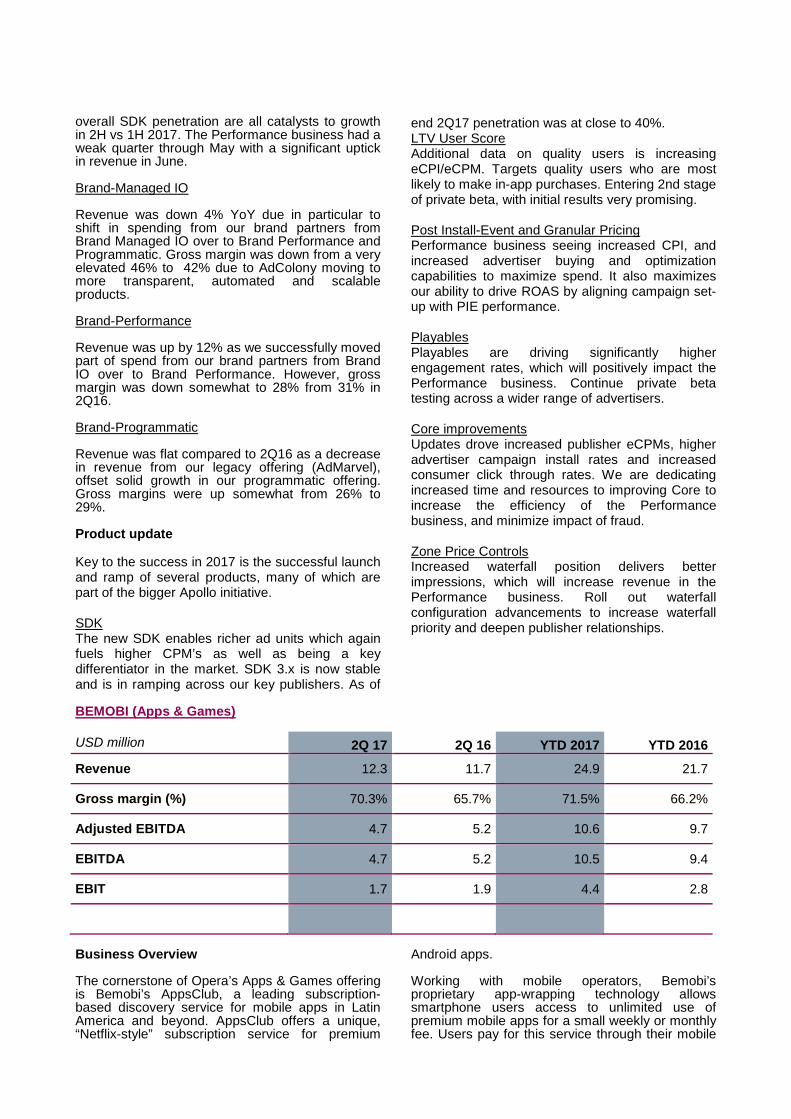
BEMOBI (Apps & Games) USD million 2Q 17 2Q 16 YTD 2017 YTD 2016
Revenue 12.3 11.7 24.9 21.7
Gross margin (%) 70.3% 65.7% 71.5% 66.2%
Adjusted EBITDA 4.7 5.2 10.6 9.7
EBITDA 4.7 5.2 10.5 9.4
EBIT 1.7 1.9 4.4 2.8
Business Overview The cornerstone of Opera’s Apps & Games offering is Bemobi’s AppsClub, a leading subscription-based discovery service for mobile apps in Latin America and beyond. AppsClub offers a unique, “Netflix-style” subscription service for premium
Android apps. Working with mobile operators, Bemobi’s proprietary app-wrapping technology allows smartphone users access to unlimited use of premium mobile apps for a small weekly or monthly fee. Users pay for this service through their mobile
operator billing systems, making the service highly effective in emerging markets, where credit-card and debit-card penetration is low. In 2016 and into 2017, Bemobi has enforced its leading position in the subscription-based premium application distribution space within Brazil and across LATAM and Mexico, while expanding into key markets in other parts of the world. Bemobi is a so-called B2B2C company. Instead of selling directly to a consumer, so-called traditional B2C, Bemobi typically partners with large companies, mostly mobile carriers or in some cases smartphone OEMs. Through partnerships with these companies, Bemobi is able to offer its service to the consumers. Bemobi is ending 2Q17 with close to 50 partnerships with various carriers spread across the world, making it possible to offer subscription-based services providing access to apps and games to 2 billion consumers. Financial Overview Revenue grew by 5 percent YoY fueled in particular by strength in the LATAM market for the Apps Club offering. Of the revenue in 2Q17 82 percent came from LATAM while 18 percent came from international markets. Gross margin for Bemobi is very strong and close to an all-time high in 2Q17 with 70.3%, up from 65.7% in 2Q16. LATAM subscribers were down from 14.3 million in 2Q16 to 13.9 million in 2Q17, with numbers of operators growing from 18 to 22. International subscribers were up from 2.3 million in 2Q16 to 4.0 million in 2Q17, with the number of operators up from 17 to 31. Revenue from LATAM was 10.1 million in 2Q17
compared to 9.6 million in 2Q16, while revenue in International was 2.2 million in 2Q17 compared to 2.1 million in 2Q16 Adjusted EBITDA decreased by 10 percent in the quarter to USD 4.7 million as revenue growth and expanding margin was more than offset by growth in Opex, which is primarily related to our global growth. Substantially all the profit was earned in LATAM in 2Q17. In 2Q17 Bemobi launched of Airtel India Apps Club giving Apps Club close to a 100% coverage in the Indian market. The first NDNC portal was launched in India with Tata Docom. User growth continued in 2Q17 due to improvements and optimizations of conversion through multiple channels such as the NDNC portals, and investments into Digital acquisitions. Product update In 2Q17, development for Kids Club was completed. Kids Club is another subscription vertical that will be pilot launched in CIS and India. This is a subscription product with the games & apps catalog filtered for kids.
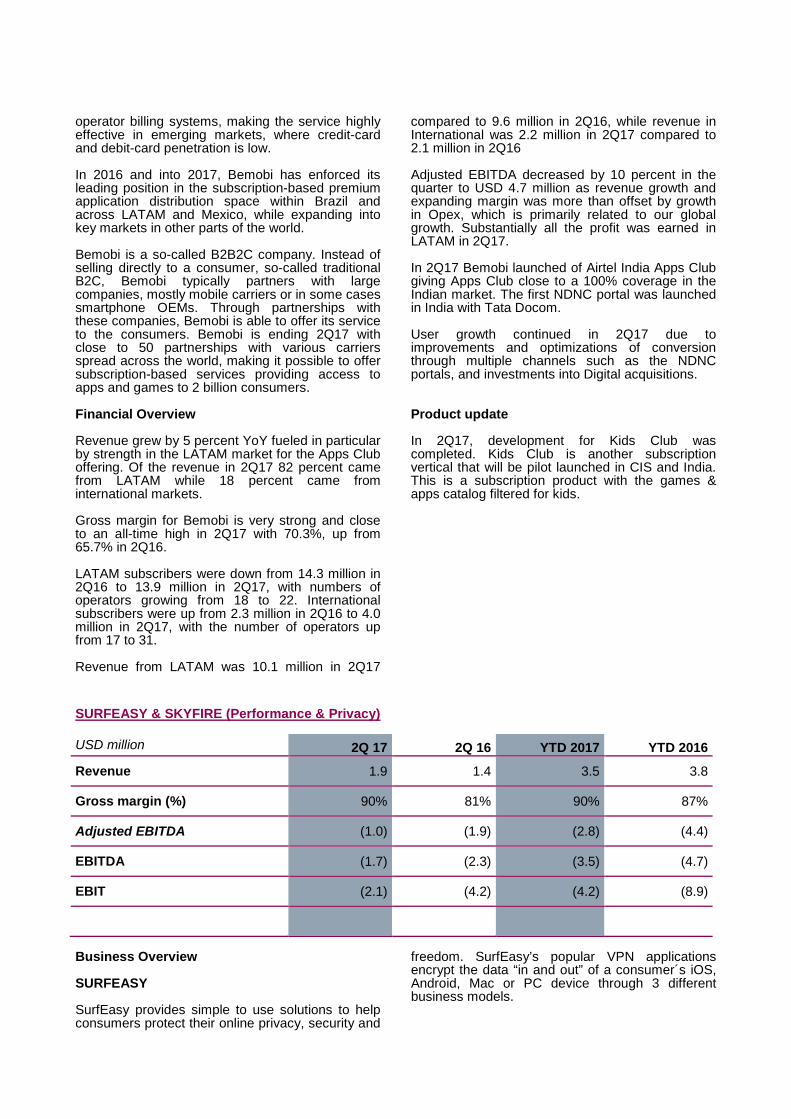
SURFEASY & SKYFIRE (Performance & Privacy) USD million 2Q 17 2Q 16 YTD 2017 YTD 2016
Revenue 1.9 1.4 3.5 3.8
Gross margin (%) 90% 81% 90% 87%
Adjusted EBITDA (1.0) (1.9) (2.8) (4.4)
EBITDA (1.7) (2.3) (3.5) (4.7)
EBIT (2.1) (4.2) (4.2) (8.9)
Business Overview SURFEASY SurfEasy provides simple to use solutions to help consumers protect their online privacy, security and
freedom. SurfEasy’s popular VPN applications encrypt the data “in and out” of a consumer´s iOS, Android, Mac or PC device through 3 different business models.
(i)SurfEasy Direct Direct to consumer product leveraging a freemium subscription model that encourages the customers to help promote the product while at the same time deepening their engagement. (ii)Partners and third-party brands Third party product integrated with antivirus providers, OEMs and credit protection companies. SurfEasy’s partner product provides additional customer reach without investing heavily in marketing and sales making it possible to reach additional market segments. (iii)Opera VPN products In 2016, in partnership with Opera’s consumer division, SurfEasy launched Opera VPN products. This new and exciting partnership has seen a lot of success, creating interesting opportunities going forward. Opera VPN is a mobile product, for iOS and Android, as well as a desktop product. This is a unique mobile product which is not based on a paid-subscription model. SKYFIRE Today, typically 60 percent or more of total mobile data consumption is video content, putting pressure on the operator’s existing network capacity. Skyfire enables mobile operators to optimize its network performance and quality as data traffic and the consumption of mobile video is exploding among mobile users. The unique technology also enables operators to pursue new business models and revenue streams while benefiting from increased technological flexibility as customer data is optimized. Rocket Optimizer is Skyfire´s flagship product for managing the explosion of mobile video data traffic in mobile operator networks. It is designed for operator deployment and it provides operators with an instant 60 percent boost in bandwidth capacity across smartphones, tablets and laptops. Skyfire has signed distribution partnerships with Huawei and Nokia. In particular, Huawei has become a very important partner, and during 2017 a new joint solution with Huawei will be made generally available. Financial Overview (SURFEASY & SKYFIRE) Revenue increased by 39% in the quarter with a fall in revenue from Skyfire more than offset by strong growth from SurfEasy. Revenue from Skyfire is driven almost entirely by new wins and long sales
cycles makes revenue lumpy in nature. For SurfEasy, one their larger partners began making significant gains in new customer acquisitions during 1Q17 and this continued into 2Q17. SurfEasy is ahead of plan for the year and was profitable in 2Q17. At the end of 2Q17, and in light of the current revenue trend, we initiated a substantial cost cutting program in Skyfire which will reduce the annual OPEX to around USD 1.5 million once completed. Based on this we expect 2H17 to be profitable for Skyfire. Gross margin was stable at around 90% in the quarter and both Skyfire and Surfeasy have products with very high gross margins. Adjusted EBITDA improved in the quarter compared to 2Q16 with cost cutting in Skyfire and revenue growth in SurfEasy. Product update (SURFEASY & SKYFIRE) In 2Q17 Skyfire increased the number of encrypted services that we can optimize, thereby increasing the QoE benefits and savings that can be achieved. In addition, Skyfire has significantly enhanced its ability to precisely identify device types (mobile phone vs. tablet vs. dongle, etc.) for encrypted services. In Q217 SurfEasy launched an expanded Partners program and increased related business development activities. Since then we have entered into discussions with half a dozen new mid-sized partners and have several contracts with revenue. We see strong growth opportunities through leveraging the scale and quality of our network for multiple partners. In addition to several iterative improvements on SurfEasy and Partners branded products, in 2Q17 our Product and Engineering team focused their efforts on improving the overall customer experience – with the primary focus on VPN Speed. During that time we implemented new methods for monitoring performance of our VPN network and made improvements which increased average VPN speeds by 2.75x. These benefits improve the performance for all Direct and Partner customers.
OUTLOOK
Opera remains positive about the Group’s overall growth prospects, with the following perspective on the Group as a whole: AdColony operates in a global advertising industry which continues to experience a macro shift in advertising spend from traditional channels to digital online channels. AdColony is well positioned to take advantage of the macro trends and become the highest quality mobile advertising platform in the world. Opera expects AdColony to generate revenue growth in 2H17 vs 1H17, driven in particular by new technology which enables additional ad formats and provides the possibility to tap into new markets. Bemobi operates in a rapid growing market of app subscriptions. It takes advantage of the increased use of mobile phones in emerging markets and the low penetration of credit cards. Opera expects to see revenue growth in Bemobi in 2017 versus 2016, as Bemobi takes the success in Brazil to a global arena. SurfEasy provides online privacy and anti-firewall consumer software (VPN), both premium and free, with the latter generating revenue from anonymized user information which can provide unique market intelligence. SurfEasy is well positioned to take advantage of this growing market and Opera expects to see strong growth in SurfEasy in 2017 versus 2016. Skyfire delivers bandwidth optimization to mobile operators which improve network quality and performance. Skyfire reorganized in 2016 and is positioned to profit from consumers growing demand for high network quality everywhere. Opera aims to make Skyfire profitable in 2017. Opera’s strategic focus is to develop unique and relevant products, and scalable business models which combined should generate revenue growth and margin expansion. With AdColony, Bemobi, SurfEasy and Skyfire, Opera has four scalable businesses for the digital future.
Oslo, August 23, 2017 The Board of Directors Opera Software ASA
Audun Iversen
Chairman (sign.)
Lars Boilesen CEO
(sign.)
This report and the description of Opera's business and financials should be read in conjunction with the
presentation given by the Company of its quarterly numbers, a Webcast of which can be found at www.opera.com.
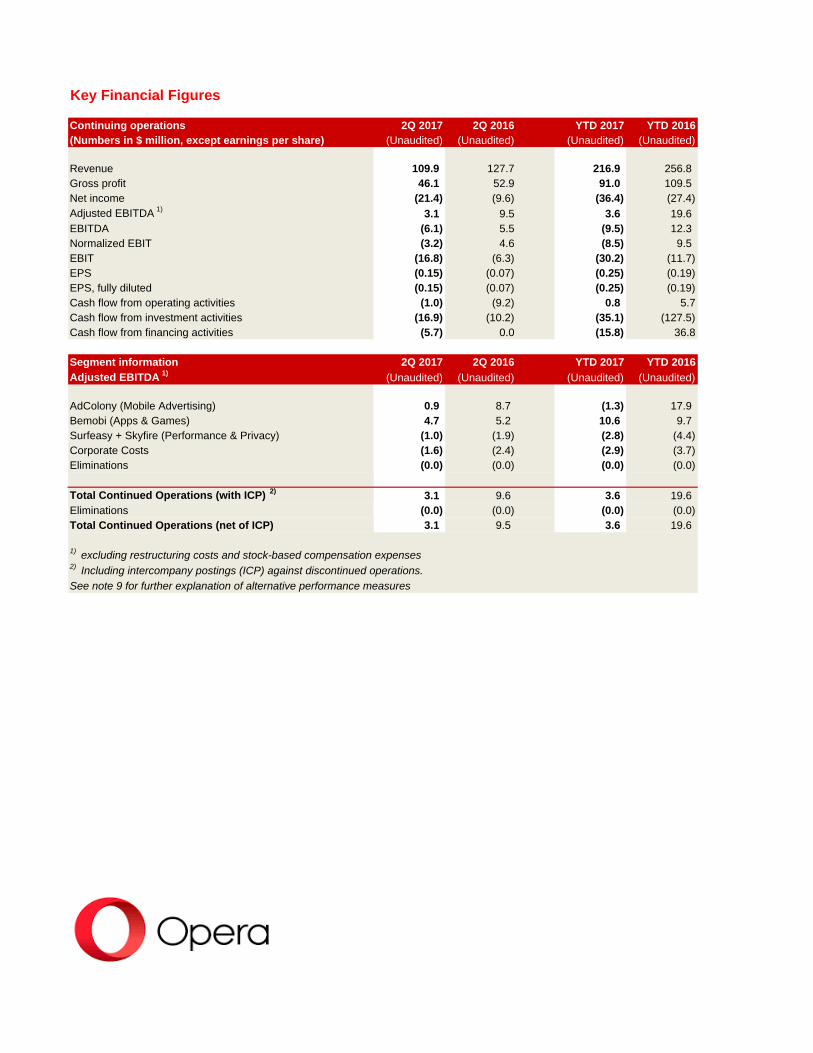
Key Financial Figures
Continuing operations 2Q 2017 2Q 2016 YTD 2017 YTD 2016(Numbers in $ million, except earnings per share) (Unaudited) (Unaudited) (Unaudited) (Unaudited)
Revenue 109.9 127.7 216.9 256.8Gross profit 46.1 52.9 91.0 109.5Net income (21.4) (9.6) (36.4) (27.4)Adjusted EBITDA 1) 3.1 9.5 3.6 19.6EBITDA (6.1) 5.5 (9.5) 12.3Normalized EBIT (3.2) 4.6 (8.5) 9.5EBIT (16.8) (6.3) (30.2) (11.7)EPS (0.15) (0.07) (0.25) (0.19)EPS, fully diluted (0.15) (0.07) (0.25) (0.19)Cash flow from operating activities (1.0) (9.2) 0.8 5.7Cash flow from investment activities (16.9) (10.2) (35.1) (127.5)Cash flow from financing activities (5.7) 0.0 (15.8) 36.8
Segment information 2Q 2017 2Q 2016 YTD 2017 YTD 2016Adjusted EBITDA 1) (Unaudited) (Unaudited) (Unaudited) (Unaudited)
AdColony (Mobile Advertising) 0.9 8.7 (1.3) 17.9Bemobi (Apps & Games) 4.7 5.2 10.6 9.7Surfeasy + Skyfire (Performance & Privacy) (1.0) (1.9) (2.8) (4.4)Corporate Costs (1.6) (2.4) (2.9) (3.7)Eliminations (0.0) (0.0) (0.0) (0.0)
Total Continued Operations (with ICP) 2) 3.1 9.6 3.6 19.6Eliminations (0.0) (0.0) (0.0) (0.0)Total Continued Operations (net of ICP) 3.1 9.5 3.6 19.6
1) excluding restructuring costs and stock-based compensation expenses2) Including intercompany postings (ICP) against discontinued operations.
See note 9 for further explanation of alternative performance measures
Interim condensed financial statements
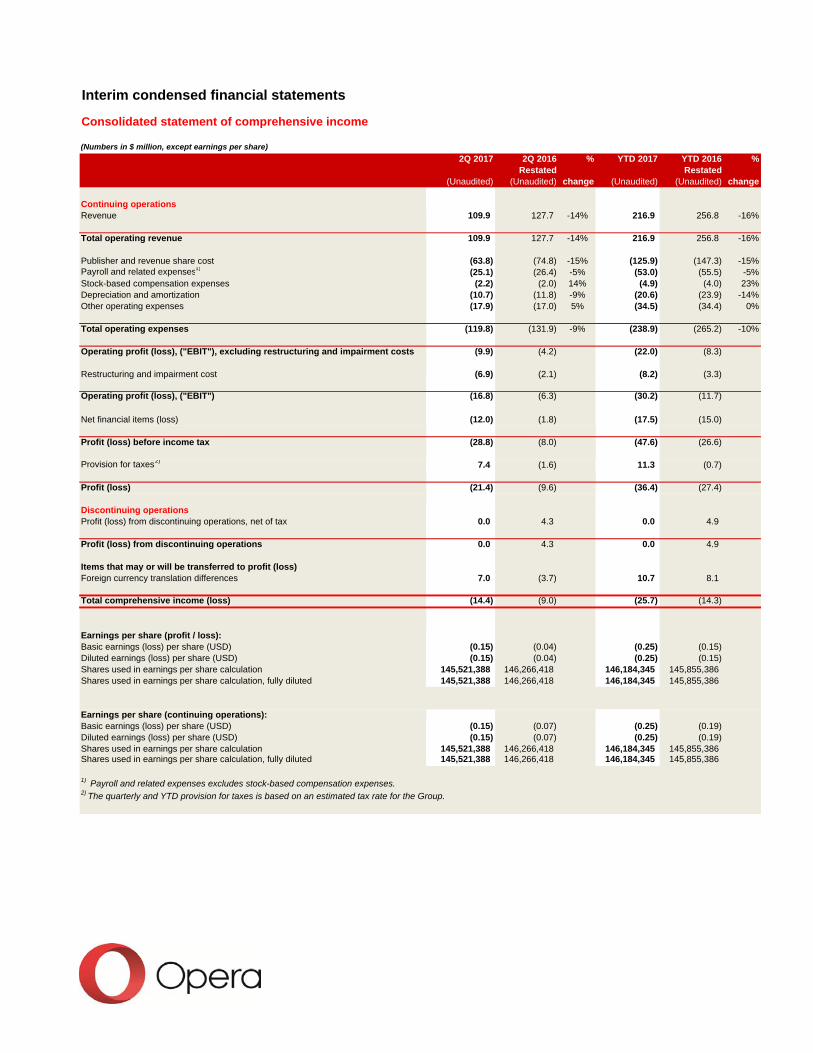
Consolidated statement of comprehensive income
(Numbers in $ million, except earnings per share)
2Q 2017 2Q 2016 % YTD 2017 YTD 2016 %Restated Restated
(Unaudited) (Unaudited) change (Unaudited) (Unaudited) change
Continuing operationsRevenue 109.9 127.7 -14% 216.9 256.8 -16%
Total operating revenue 109.9 127.7 -14% 216.9 256.8 -16%
Publisher and revenue share cost (63.8) (74.8) -15% (125.9) (147.3) -15%Payroll and related expenses1) (25.1) (26.4) -5% (53.0) (55.5) -5%Stock-based compensation expenses (2.2) (2.0) 14% (4.9) (4.0) 23%Depreciation and amortization (10.7) (11.8) -9% (20.6) (23.9) -14%Other operating expenses (17.9) (17.0) 5% (34.5) (34.4) 0%
Total operating expenses (119.8) (131.9) -9% (238.9) (265.2) -10%
Operating profit (loss), ("EBIT"), excluding restructuring and impairment costs (9.9) (4.2) (22.0) (8.3)
Restructuring and impairment cost (6.9) (2.1) (8.2) (3.3)
Operating profit (loss), ("EBIT") (16.8) (6.3) (30.2) (11.7)
Net financial items (loss) (12.0) (1.8) (17.5) (15.0)
Profit (loss) before income tax (28.8) (8.0) (47.6) (26.6)
Provision for taxes2) 7.4 (1.6) 11.3 (0.7)
Profit (loss) (21.4) (9.6) (36.4) (27.4)
Discontinuing operationsProfit (loss) from discontinuing operations, net of tax 0.0 4.3 0.0 4.9
Profit (loss) from discontinuing operations 0.0 4.3 0.0 4.9
Items that may or will be transferred to profit (loss)Foreign currency translation differences 7.0 (3.7) 10.7 8.1
Total comprehensive income (loss) (14.4) (9.0) (25.7) (14.3)
Earnings per share (profit / loss):Basic earnings (loss) per share (USD) (0.15) (0.04) (0.25) (0.15)Diluted earnings (loss) per share (USD) (0.15) (0.04) (0.25) (0.15)Shares used in earnings per share calculation 145,521,388 146,266,418 146,184,345 145,855,386Shares used in earnings per share calculation, fully diluted 145,521,388 146,266,418 146,184,345 145,855,386
Earnings per share (continuing operations):Basic earnings (loss) per share (USD) (0.15) (0.07) (0.25) (0.19)Diluted earnings (loss) per share (USD) (0.15) (0.07) (0.25) (0.19)Shares used in earnings per share calculation 145,521,388 146,266,418 146,184,345 145,855,386Shares used in earnings per share calculation, fully diluted 145,521,388 146,266,418 146,184,345 145,855,386
1) Payroll and related expenses excludes stock-based compensation expenses.2) The quarterly and YTD provision for taxes is based on an estimated tax rate for the Group.
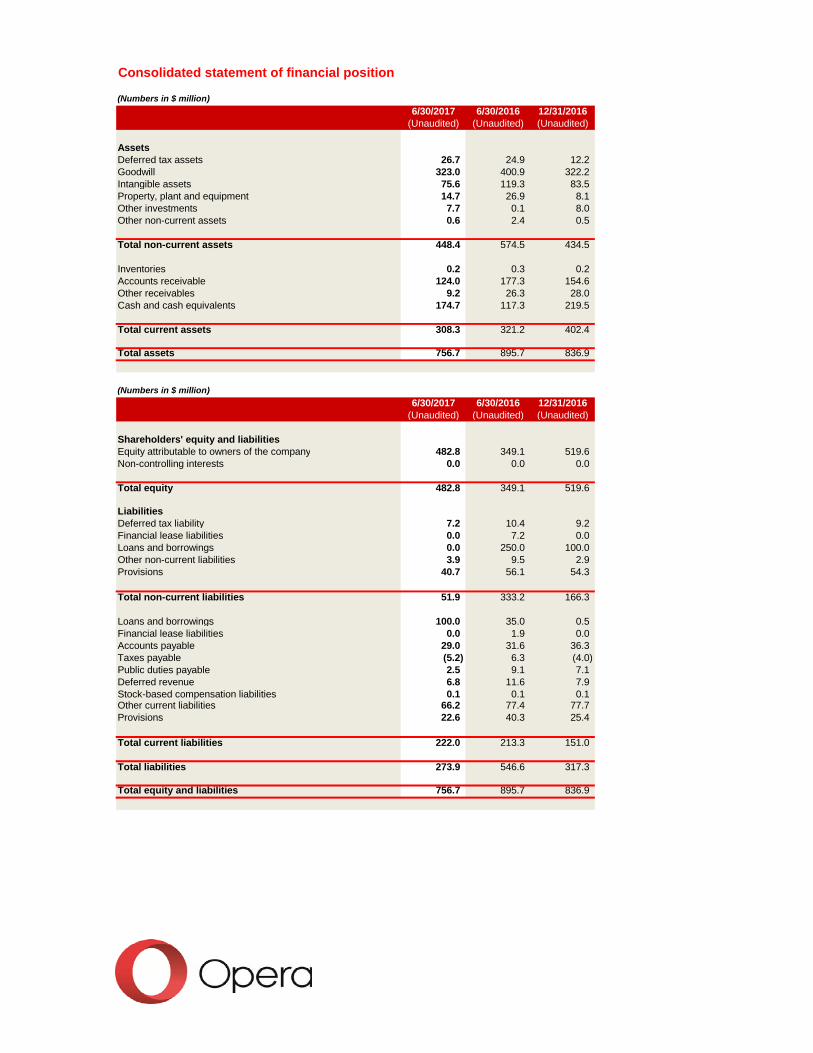
Consolidated statement of financial position
(Numbers in $ million)
6/30/2017 6/30/2016 12/31/2016(Unaudited) (Unaudited) (Unaudited)
AssetsDeferred tax assets 26.7 24.9 12.2Goodwill 323.0 400.9 322.2Intangible assets 75.6 119.3 83.5Property, plant and equipment 14.7 26.9 8.1Other investments 7.7 0.1 8.0Other non-current assets 0.6 2.4 0.5
Total non-current assets 448.4 574.5 434.5
Inventories 0.2 0.3 0.2Accounts receivable 124.0 177.3 154.6Other receivables 9.2 26.3 28.0Cash and cash equivalents 174.7 117.3 219.5
Total current assets 308.3 321.2 402.4
Total assets 756.7 895.7 836.9
(Numbers in $ million)
6/30/2017 6/30/2016 12/31/2016(Unaudited) (Unaudited) (Unaudited)
Shareholders' equity and liabilitiesEquity attributable to owners of the company 482.8 349.1 519.6Non-controlling interests 0.0 0.0 0.0
Total equity 482.8 349.1 519.6
LiabilitiesDeferred tax liability 7.2 10.4 9.2Financial lease liabilities 0.0 7.2 0.0Loans and borrowings 0.0 250.0 100.0Other non-current liabilities 3.9 9.5 2.9Provisions 40.7 56.1 54.3
Total non-current liabilities 51.9 333.2 166.3
Loans and borrowings 100.0 35.0 0.5Financial lease liabilities 0.0 1.9 0.0Accounts payable 29.0 31.6 36.3Taxes payable (5.2) 6.3 (4.0)Public duties payable 2.5 9.1 7.1Deferred revenue 6.8 11.6 7.9Stock-based compensation liabilities 0.1 0.1 0.1Other current liabilities 66.2 77.4 77.7Provisions 22.6 40.3 25.4
Total current liabilities 222.0 213.3 151.0
Total liabilities 273.9 546.6 317.3
Total equity and liabilities 756.7 895.7 836.9
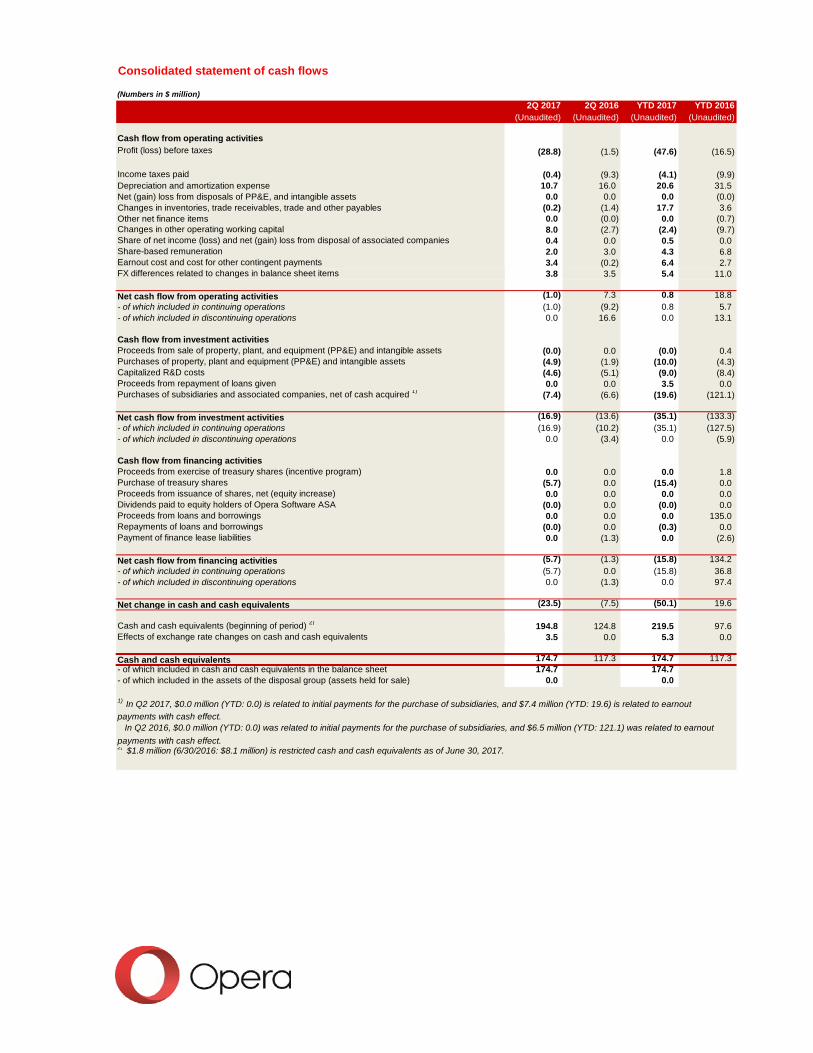
Consolidated statement of cash flows
(Numbers in $ million)
2Q 2017 2Q 2016 YTD 2017 YTD 2016(Unaudited) (Unaudited) (Unaudited) (Unaudited)
Cash flow from operating activitiesProfit (loss) before taxes (28.8) (1.5) (47.6) (16.5)
Income taxes paid (0.4) (9.3) (4.1) (9.9)Depreciation and amortization expense 10.7 16.0 20.6 31.5Net (gain) loss from disposals of PP&E, and intangible assets 0.0 0.0 0.0 (0.0)Changes in inventories, trade receivables, trade and other payables (0.2) (1.4) 17.7 3.6Other net finance items 0.0 (0.0) 0.0 (0.7)Changes in other operating working capital 8.0 (2.7) (2.4) (9.7)Share of net income (loss) and net (gain) loss from disposal of associated companies 0.4 0.0 0.5 0.0Share-based remuneration 2.0 3.0 4.3 6.8Earnout cost and cost for other contingent payments 3.4 (0.2) 6.4 2.7FX differences related to changes in balance sheet items 3.8 3.5 5.4 11.0
Net cash flow from operating activities (1.0) 7.3 0.8 18.8- of which included in continuing operations (1.0) (9.2) 0.8 5.7- of which included in discontinuing operations 0.0 16.6 0.0 13.1
Cash flow from investment activitiesProceeds from sale of property, plant, and equipment (PP&E) and intangible assets (0.0) 0.0 (0.0) 0.4Purchases of property, plant and equipment (PP&E) and intangible assets (4.9) (1.9) (10.0) (4.3)Capitalized R&D costs (4.6) (5.1) (9.0) (8.4)Proceeds from repayment of loans given 0.0 0.0 3.5 0.0Purchases of subsidiaries and associated companies, net of cash acquired 1) (7.4) (6.6) (19.6) (121.1)
Net cash flow from investment activities (16.9) (13.6) (35.1) (133.3)- of which included in continuing operations (16.9) (10.2) (35.1) (127.5)- of which included in discontinuing operations 0.0 (3.4) 0.0 (5.9)
Cash flow from financing activitiesProceeds from exercise of treasury shares (incentive program) 0.0 0.0 0.0 1.8Purchase of treasury shares (5.7) 0.0 (15.4) 0.0Proceeds from issuance of shares, net (equity increase) 0.0 0.0 0.0 0.0Dividends paid to equity holders of Opera Software ASA (0.0) 0.0 (0.0) 0.0Proceeds from loans and borrowings 0.0 0.0 0.0 135.0Repayments of loans and borrowings (0.0) 0.0 (0.3) 0.0Payment of finance lease liabilities 0.0 (1.3) 0.0 (2.6)
Net cash flow from financing activities (5.7) (1.3) (15.8) 134.2- of which included in continuing operations (5.7) 0.0 (15.8) 36.8- of which included in discontinuing operations 0.0 (1.3) 0.0 97.4
Net change in cash and cash equivalents (23.5) (7.5) (50.1) 19.6
Cash and cash equivalents (beginning of period) 2) 194.8 124.8 219.5 97.6Effects of exchange rate changes on cash and cash equivalents 3.5 0.0 5.3 0.0
Cash and cash equivalents 174.7 117.3 174.7 117.3- of which included in cash and cash equivalents in the balance sheet 174.7 174.7- of which included in the assets of the disposal group (assets held for sale) 0.0 0.0
1) In Q2 2017, $0.0 million (YTD: 0.0) is related to initial payments for the purchase of subsidiaries, and $7.4 million (YTD: 19.6) is related to earnout
payments with cash effect. In Q2 2016, $0.0 million (YTD: 0.0) was related to initial payments for the purchase of subsidiaries, and $6.5 million (YTD: 121.1) was related to earnout
payments with cash effect.2) $1.8 million (6/30/2016: $8.1 million) is restricted cash and cash equivalents as of June 30, 2017.
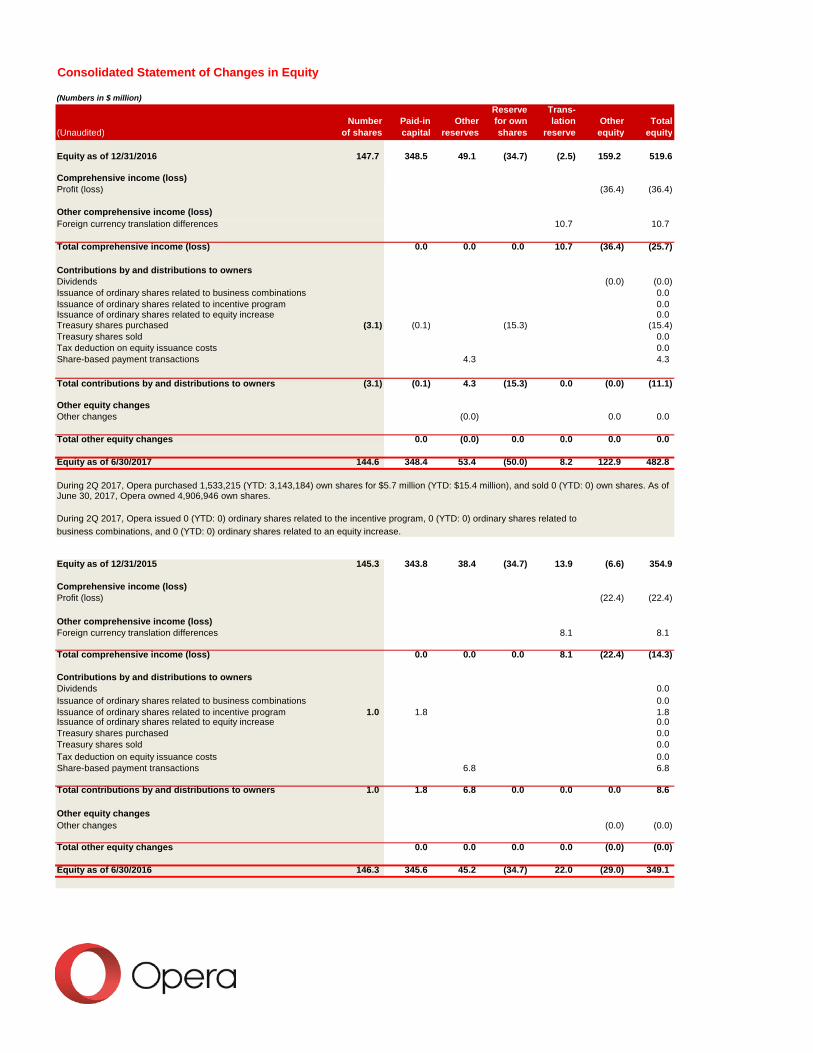
Consolidated Statement of Changes in Equity
(Numbers in $ million)
Reserve Trans-Number Paid-in Other for own lation Other Total
(Unaudited) of shares capital reserves shares reserve equity equity
Equity as of 12/31/2016 147.7 348.5 49.1 (34.7) (2.5) 159.2 519.6
Comprehensive income (loss)Profit (loss) (36.4) (36.4)
Other comprehensive income (loss)Foreign currency translation differences 10.7 10.7
Total comprehensive income (loss) 0.0 0.0 0.0 10.7 (36.4) (25.7)
Contributions by and distributions to ownersDividends (0.0) (0.0)Issuance of ordinary shares related to business combinations 0.0Issuance of ordinary shares related to incentive program 0.0Issuance of ordinary shares related to equity increase 0.0Treasury shares purchased (3.1) (0.1) (15.3) (15.4)Treasury shares sold 0.0Tax deduction on equity issuance costs 0.0Share-based payment transactions 4.3 4.3
Total contributions by and distributions to owners (3.1) (0.1) 4.3 (15.3) 0.0 (0.0) (11.1)
Other equity changesOther changes (0.0) 0.0 0.0
Total other equity changes 0.0 (0.0) 0.0 0.0 0.0 0.0
Equity as of 6/30/2017 144.6 348.4 53.4 (50.0) 8.2 122.9 482.8
During 2Q 2017, Opera purchased 1,533,215 (YTD: 3,143,184) own shares for $5.7 million (YTD: $15.4 million), and sold 0 (YTD: 0) own shares. As of June 30, 2017, Opera owned 4,906,946 own shares.
During 2Q 2017, Opera issued 0 (YTD: 0) ordinary shares related to the incentive program, 0 (YTD: 0) ordinary shares related tobusiness combinations, and 0 (YTD: 0) ordinary shares related to an equity increase.
Equity as of 12/31/2015 145.3 343.8 38.4 (34.7) 13.9 (6.6) 354.9
Comprehensive income (loss)Profit (loss) (22.4) (22.4)
Other comprehensive income (loss)Foreign currency translation differences 8.1 8.1
Total comprehensive income (loss) 0.0 0.0 0.0 8.1 (22.4) (14.3)
Contributions by and distributions to ownersDividends 0.0Issuance of ordinary shares related to business combinations 0.0Issuance of ordinary shares related to incentive program 1.0 1.8 1.8Issuance of ordinary shares related to equity increase 0.0Treasury shares purchased 0.0Treasury shares sold 0.0Tax deduction on equity issuance costs 0.0Share-based payment transactions 6.8 6.8
Total contributions by and distributions to owners 1.0 1.8 6.8 0.0 0.0 0.0 8.6
Other equity changesOther changes (0.0) (0.0)
Total other equity changes 0.0 0.0 0.0 0.0 (0.0) (0.0)
Equity as of 6/30/2016 146.3 345.6 45.2 (34.7) 22.0 (29.0) 349.1
Note 1 - Corporate Information
Note 2 - Statement of Compliance
Note 3 - Basis of Accounting
Notes to the condensed consolidated interim financial statements
Opera ("the Group") consists of Opera Software ASA ("the company") and its subsidiaries. Opera Software ASA is a public limited liability company domiciled in Norway. The condensed consolidated interim financial statements ("interim financial statements") comprise Opera Software ASA and its subsidiaries (together referred to as the "Group"), and the Group's interests in associates.
These interim financial statements have been prepared in accordance with IAS 34 Interim Financial Reporting as adopted by theEU. The interim financial statements do not include all of the information and disclosures required for a complete set of financial statements, and should be read in conjunction with the consolidated financial statements of the Group for the year ended December 31, 2016. The interim financial statements have not been subject to audit or review.
The accounting policies adopted in the preparation of the interim financial statements are consistent with those followed in thepreparation of the Group’s consolidated financial statements for the year ended December 31, 2016.
The interim financial statements are presented in US dollars (USD), unless otherwise stated. As a result of rounding differences, amounts and percentages may not add up to the total.
There were no new standards, interpretations or amendments to published standards that were effective from January 1, 2017 that have significantly affected the interim financial statements for the first half of 2017.
In the interim financial statements for 2017, judgements, estimates and assumptions have been applied that may affect the use ofaccounting principles, carrying values of assets and liabilities, revenues and expenses. Actual values may differ from these estimates. The major assumptions applied in the interim financial statements for 2017 and the major sources of uncertainty in the statements are similar to those found in the Group’s consolidated financial statements for 2016.
The sale of substantially all of the Group's Consumer business was completed as of November 3, 2016. Further, the Group sold a majority stake in its TV business on December 19, 2016. Because these components of the Group represented a major line of business, historical results have been restated to reflect the results of operations of the assets that have been disposed asdiscontinued operations.
Opera is in the process of evaluating any potential impact of IFRS 15 Revenue from Contracts with Customers (effective from January 1, 2018), on its revenue recognition policies. In particular, the assessment of whether Opera is acting as the principle or agent in our transactions with advertisers in determining whether revenues are recognized on gross or net basis. For the vastmajority of revenue streams, Opera expects it will continue to recognize revenue on a gross basis due to the Company having primary responsibility to provide specified goods or services, assuming inventory risk, and having discretion to establish prices, however this assessment is not finalized. Opera expects to complete its analysis in the second half of 2017.
IFRS 9 Financial Instruments - Classification and Measurement is effective from January 1, 2018. The adoption of IFRS 9 is not expected to have a significant impact on the classification and measurement of the Group’s financial assets and liabilities.
IFRS 16 Leasing is effective from 2019. The new standard for leasing will significantly change how the group accounts for its lease contracts for offices and other assets currently accounted for as operating leases. Under IFRS 16, an on-balance sheet model that is similar to current financial leases accounting will be applied to all lease contracts, only leases for small items such as PC’s and office equipment will be exempt. Opera has started an initial assessment of the potential impact on its consolidated financial statements. So far, the most significant impact identified is that the Group will recognize new assets and liabilities for its operating
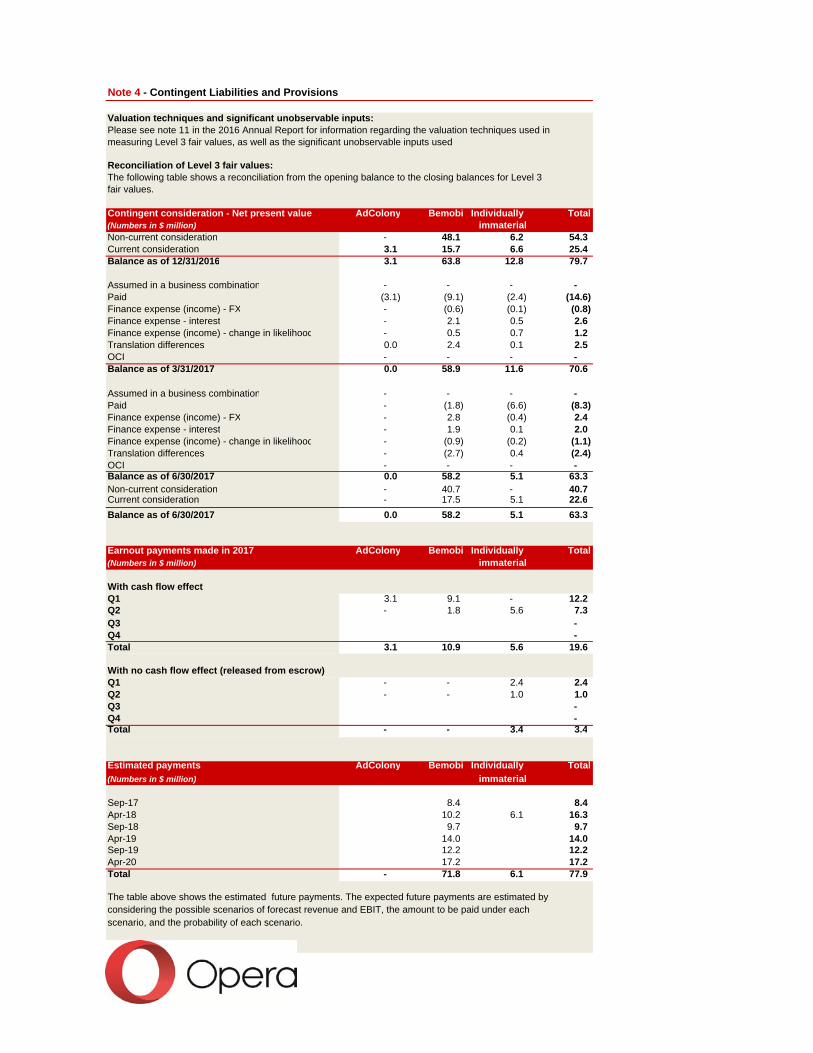
Note 4 - Contingent Liabilities and Provisions
Valuation techniques and significant unobservable inputs:Please see note 11 in the 2016 Annual Report for information regarding the valuation techniques used in measuring Level 3 fair values, as well as the significant unobservable inputs used.
Reconciliation of Level 3 fair values:The following table shows a reconciliation from the opening balance to the closing balances for Level 3 fair values.
Contingent consideration - Net present value AdColony Bemobi Individually Total(Numbers in $ million) immaterialNon-current consideration - 48.1 6.2 54.3 Current consideration 3.1 15.7 6.6 25.4 Balance as of 12/31/2016 3.1 63.8 12.8 79.7
Assumed in a business combination - - - - Paid (3.1) (9.1) (2.4) (14.6) Finance expense (income) - FX - (0.6) (0.1) (0.8) Finance expense - interest - 2.1 0.5 2.6 Finance expense (income) - change in likelihood - 0.5 0.7 1.2 Translation differences 0.0 2.4 0.1 2.5 OCI - - - - Balance as of 3/31/2017 0.0 58.9 11.6 70.6
Assumed in a business combination - - - - Paid - (1.8) (6.6) (8.3) Finance expense (income) - FX - 2.8 (0.4) 2.4 Finance expense - interest - 1.9 0.1 2.0 Finance expense (income) - change in likelihood - (0.9) (0.2) (1.1) Translation differences - (2.7) 0.4 (2.4) OCI - - - - Balance as of 6/30/2017 0.0 58.2 5.1 63.3 Non-current consideration - 40.7 - 40.7 Current consideration - 17.5 5.1 22.6 Balance as of 6/30/2017 0.0 58.2 5.1 63.3
Earnout payments made in 2017 AdColony Bemobi Individually Total(Numbers in $ million) immaterial
With cash flow effectQ1 3.1 9.1 - 12.2 Q2 - 1.8 5.6 7.3 Q3 - Q4 - Total 3.1 10.9 5.6 19.6
With no cash flow effect (released from escrow)Q1 - - 2.4 2.4 Q2 - - 1.0 1.0 Q3 - Q4 - Total - - 3.4 3.4
Estimated payments AdColony Bemobi Individually Total(Numbers in $ million) immaterial
Sep-17 8.4 8.4 Apr-18 10.2 6.1 16.3 Sep-18 9.7 9.7 Apr-19 14.0 14.0 Sep-19 12.2 12.2 Apr-20 17.2 17.2 Total - 71.8 6.1 77.9
The table above shows the estimated future payments. The expected future payments are estimated by considering the possible scenarios of forecast revenue and EBIT, the amount to be paid under each scenario, and the probability of each scenario.
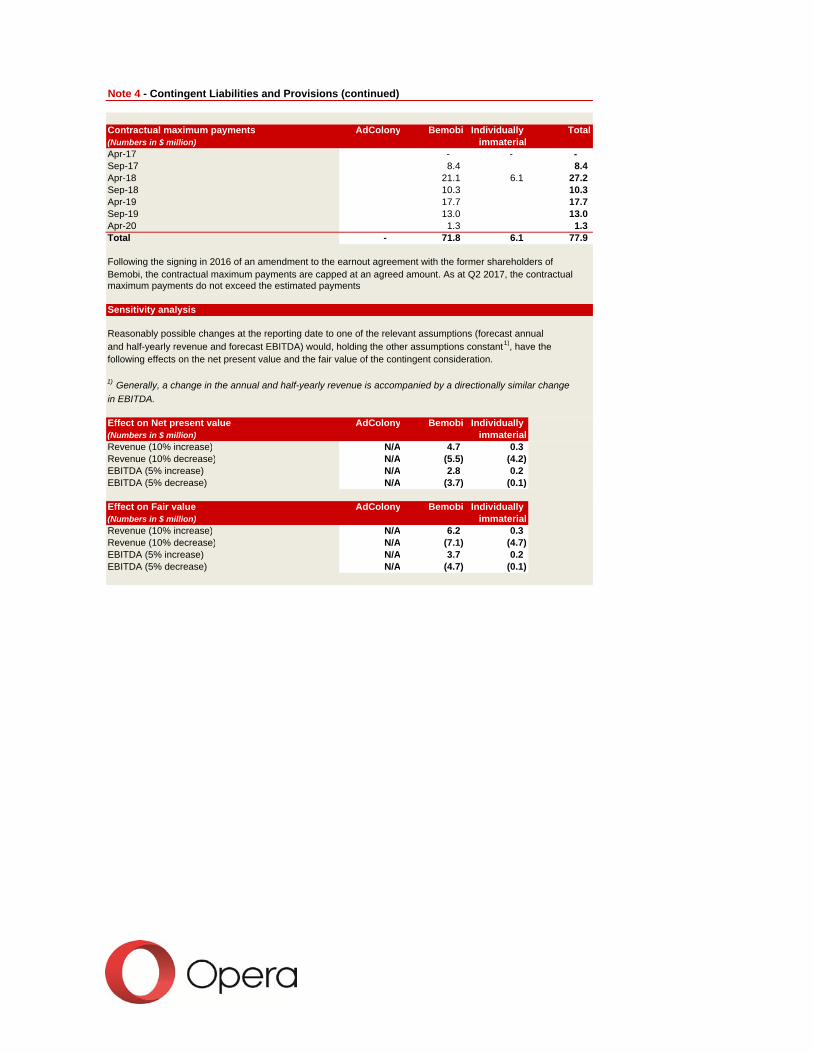
Note 4 - Contingent Liabilities and Provisions (continued)
Contractual maximum payments AdColony Bemobi Individually Total(Numbers in $ million) immaterialApr-17 - - - Sep-17 8.4 8.4 Apr-18 21.1 6.1 27.2 Sep-18 10.3 10.3 Apr-19 17.7 17.7 Sep-19 13.0 13.0 Apr-20 1.3 1.3 Total - 71.8 6.1 77.9
Following the signing in 2016 of an amendment to the earnout agreement with the former shareholders of Bemobi, the contractual maximum payments are capped at an agreed amount. As at Q2 2017, the contractual maximum payments do not exceed the estimated payments
Sensitivity analysis
Reasonably possible changes at the reporting date to one of the relevant assumptions (forecast annual and half-yearly revenue and forecast EBITDA) would, holding the other assumptions constant 1), have thefollowing effects on the net present value and the fair value of the contingent consideration.
1) Generally, a change in the annual and half-yearly revenue is accompanied by a directionally similar change
in EBITDA.
Effect on Net present value AdColony Bemobi Individually (Numbers in $ million) immaterialRevenue (10% increase) N/A 4.7 0.3Revenue (10% decrease) N/A (5.5) (4.2)EBITDA (5% increase) N/A 2.8 0.2EBITDA (5% decrease) N/A (3.7) (0.1)
Effect on Fair value AdColony Bemobi Individually (Numbers in $ million) immaterialRevenue (10% increase) N/A 6.2 0.3Revenue (10% decrease) N/A (7.1) (4.7)EBITDA (5% increase) N/A 3.7 0.2EBITDA (5% decrease) N/A (4.7) (0.1)
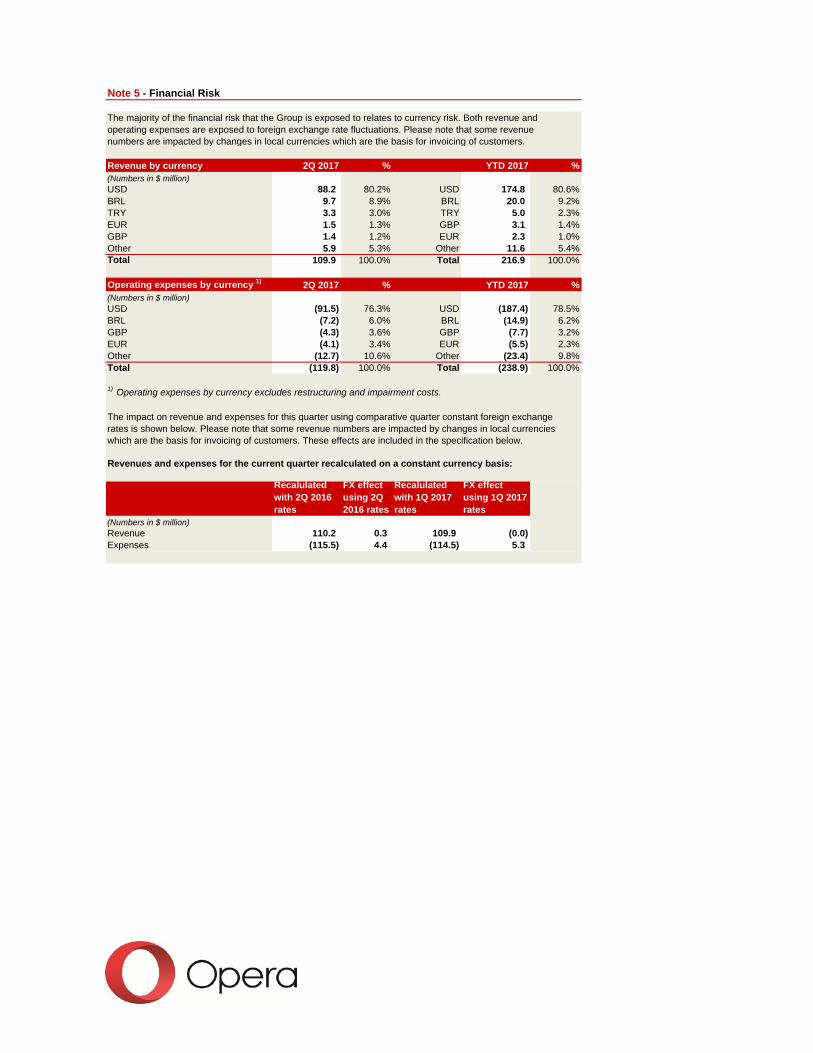
Note 5 - Financial Risk
The majority of the financial risk that the Group is exposed to relates to currency risk. Both revenue andoperating expenses are exposed to foreign exchange rate fluctuations. Please note that some revenue numbers are impacted by changes in local currencies which are the basis for invoicing of customers.
Revenue by currency 2Q 2017 % YTD 2017 %(Numbers in $ million)USD 88.2 80.2% USD 174.8 80.6%BRL 9.7 8.9% BRL 20.0 9.2%TRY 3.3 3.0% TRY 5.0 2.3%EUR 1.5 1.3% GBP 3.1 1.4%GBP 1.4 1.2% EUR 2.3 1.0%Other 5.9 5.3% Other 11.6 5.4%Total 109.9 100.0% Total 216.9 100.0%
Operating expenses by currency 1) 2Q 2017 % YTD 2017 %(Numbers in $ million)USD (91.5) 76.3% USD (187.4) 78.5%BRL (7.2) 6.0% BRL (14.9) 6.2%GBP (4.3) 3.6% GBP (7.7) 3.2%EUR (4.1) 3.4% EUR (5.5) 2.3%Other (12.7) 10.6% Other (23.4) 9.8%Total (119.8) 100.0% Total (238.9) 100.0%
1) Operating expenses by currency excludes restructuring and impairment costs.
The impact on revenue and expenses for this quarter using comparative quarter constant foreign exchange rates is shown below. Please note that some revenue numbers are impacted by changes in local currencies which are the basis for invoicing of customers. These effects are included in the specification below.
Revenues and expenses for the current quarter recalculated on a constant currency basis:
(Numbers in $ million)Revenue 110.2 0.3 109.9 (0.0)Expenses (115.5) 4.4 (114.5) 5.3
Recalulated with 2Q 2016 rates
FX effect using 2Q 2016 rates
Recalulated with 1Q 2017 rates
FX effect using 1Q 2017 rates
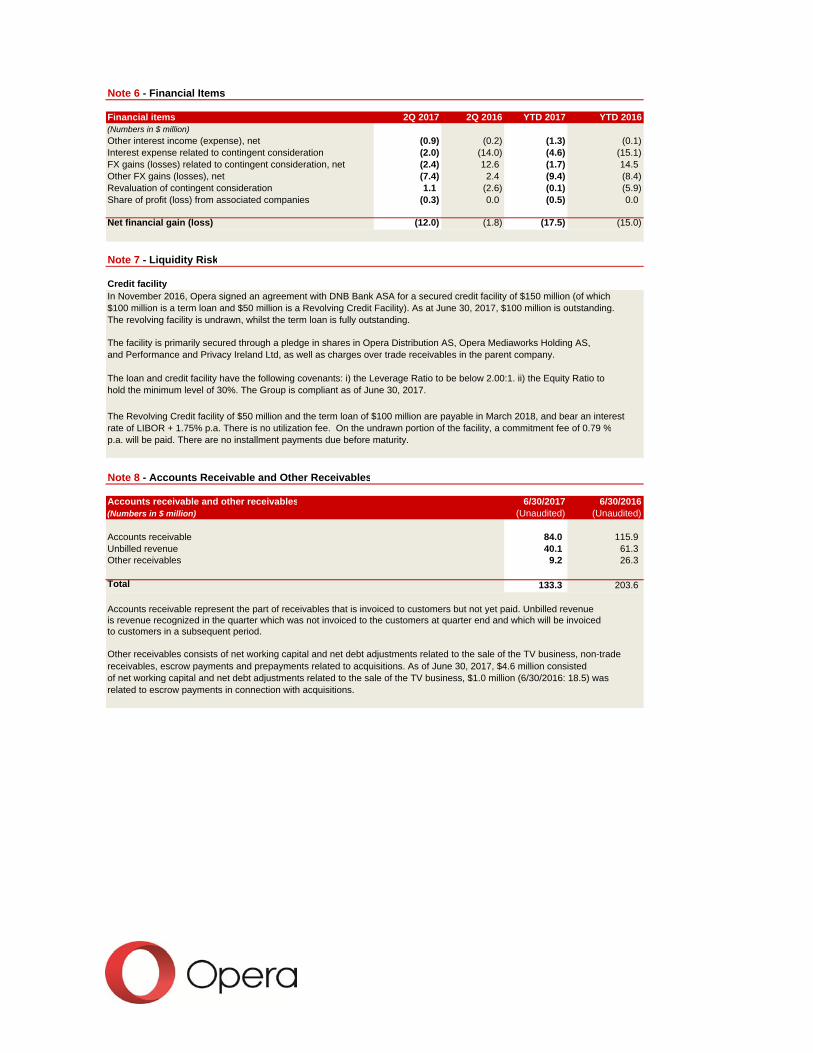
Note 6 - Financial Items
Financial items 2Q 2017 2Q 2016 YTD 2017 YTD 2016(Numbers in $ million)
Other interest income (expense), net (0.9) (0.2) (1.3) (0.1)Interest expense related to contingent consideration (2.0) (14.0) (4.6) (15.1)FX gains (losses) related to contingent consideration, net (2.4) 12.6 (1.7) 14.5Other FX gains (losses), net (7.4) 2.4 (9.4) (8.4)Revaluation of contingent consideration 1.1 (2.6) (0.1) (5.9)Share of profit (loss) from associated companies (0.3) 0.0 (0.5) 0.0
Net financial gain (loss) (12.0) (1.8) (17.5) (15.0)
Note 7 - Liquidity Risk
Credit facilityIn November 2016, Opera signed an agreement with DNB Bank ASA for a secured credit facility of $150 million (of which $100 million is a term loan and $50 million is a Revolving Credit Facility). As at June 30, 2017, $100 million is outstanding. The revolving facility is undrawn, whilst the term loan is fully outstanding.
The facility is primarily secured through a pledge in shares in Opera Distribution AS, Opera Mediaworks Holding AS, and Performance and Privacy Ireland Ltd, as well as charges over trade receivables in the parent company.
The loan and credit facility have the following covenants: i) the Leverage Ratio to be below 2.00:1. ii) the Equity Ratio to hold the minimum level of 30%. The Group is compliant as of June 30, 2017.
The Revolving Credit facility of $50 million and the term loan of $100 million are payable in March 2018, and bear an interest rate of LIBOR + 1.75% p.a. There is no utilization fee. On the undrawn portion of the facility, a commitment fee of 0.79 %p.a. will be paid. There are no installment payments due before maturity.
Note 8 - Accounts Receivable and Other Receivables
Accounts receivable and other receivables 6/30/2017 6/30/2016(Numbers in $ million) (Unaudited) (Unaudited)
Accounts receivable 84.0 115.9Unbilled revenue 40.1 61.3Other receivables 9.2 26.3
Total 133.3 203.6
Accounts receivable represent the part of receivables that is invoiced to customers but not yet paid. Unbilled revenue is revenue recognized in the quarter which was not invoiced to the customers at quarter end and which will be invoiced to customers in a subsequent period.
Other receivables consists of net working capital and net debt adjustments related to the sale of the TV business, non-trade receivables, escrow payments and prepayments related to acquisitions. As of June 30, 2017, $4.6 million consisted of net working capital and net debt adjustments related to the sale of the TV business, $1.0 million (6/30/2016: 18.5) was related to escrow payments in connection with acquisitions.
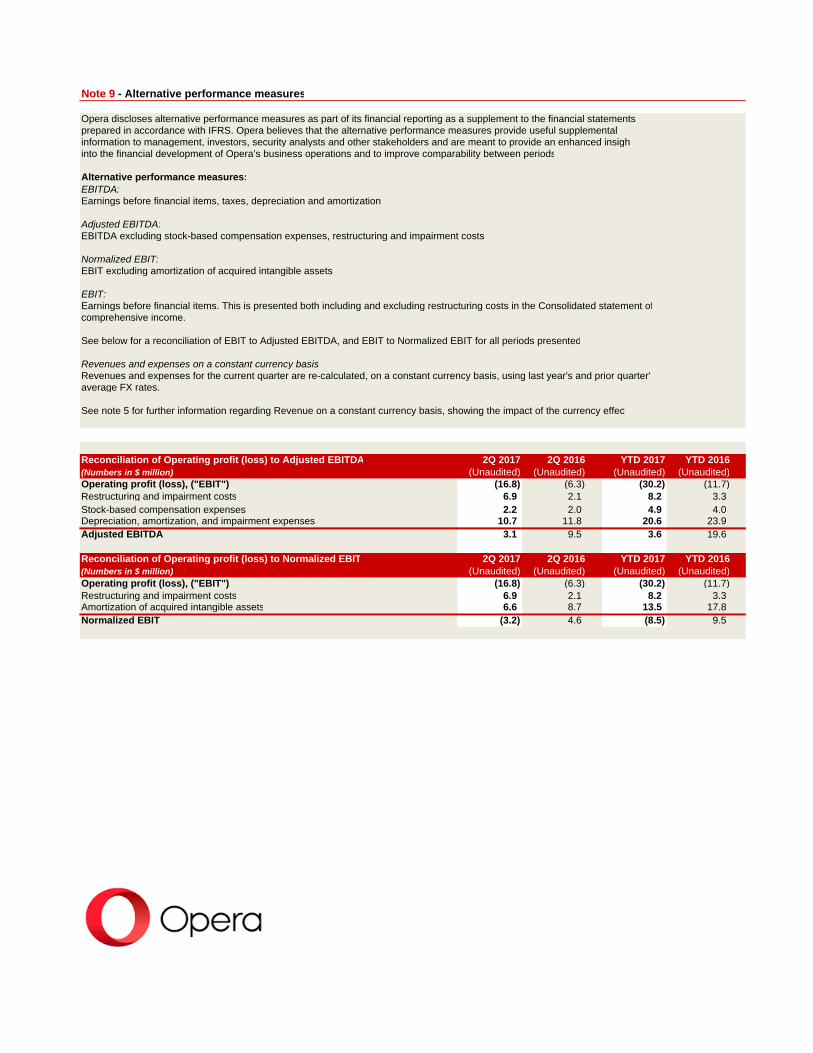
Note 9 - Alternative performance measures
Opera discloses alternative performance measures as part of its financial reporting as a supplement to the financial statements prepared in accordance with IFRS. Opera believes that the alternative performance measures provide useful supplemental information to management, investors, security analysts and other stakeholders and are meant to provide an enhanced insightinto the financial development of Opera’s business operations and to improve comparability between periods
Alternative performance measures:EBITDA:Earnings before financial items, taxes, depreciation and amortization
Adjusted EBITDA:EBITDA excluding stock-based compensation expenses, restructuring and impairment costs
Normalized EBIT:EBIT excluding amortization of acquired intangible assets
EBIT:Earnings before financial items. This is presented both including and excluding restructuring costs in the Consolidated statement ofcomprehensive income.
See below for a reconciliation of EBIT to Adjusted EBITDA, and EBIT to Normalized EBIT for all periods presented
Revenues and expenses on a constant currency basis:Revenues and expenses for the current quarter are re-calculated, on a constant currency basis, using last year's and prior quarter'average FX rates.
See note 5 for further information regarding Revenue on a constant currency basis, showing the impact of the currency effect
Reconciliation of Operating profit (loss) to Adjusted EBITDA 2Q 2017 2Q 2016 YTD 2017 YTD 2016(Numbers in $ million) (Unaudited) (Unaudited) (Unaudited) (Unaudited)Operating profit (loss), ("EBIT") (16.8) (6.3) (30.2) (11.7)Restructuring and impairment costs 6.9 2.1 8.2 3.3Stock-based compensation expenses 2.2 2.0 4.9 4.0Depreciation, amortization, and impairment expenses 10.7 11.8 20.6 23.9Adjusted EBITDA 3.1 9.5 3.6 19.6
Reconciliation of Operating profit (loss) to Normalized EBIT 2Q 2017 2Q 2016 YTD 2017 YTD 2016(Numbers in $ million) (Unaudited) (Unaudited) (Unaudited) (Unaudited)Operating profit (loss), ("EBIT") (16.8) (6.3) (30.2) (11.7)Restructuring and impairment costs 6.9 2.1 8.2 3.3Amortization of acquired intangible assets 6.6 8.7 13.5 17.8Normalized EBIT (3.2) 4.6 (8.5) 9.5
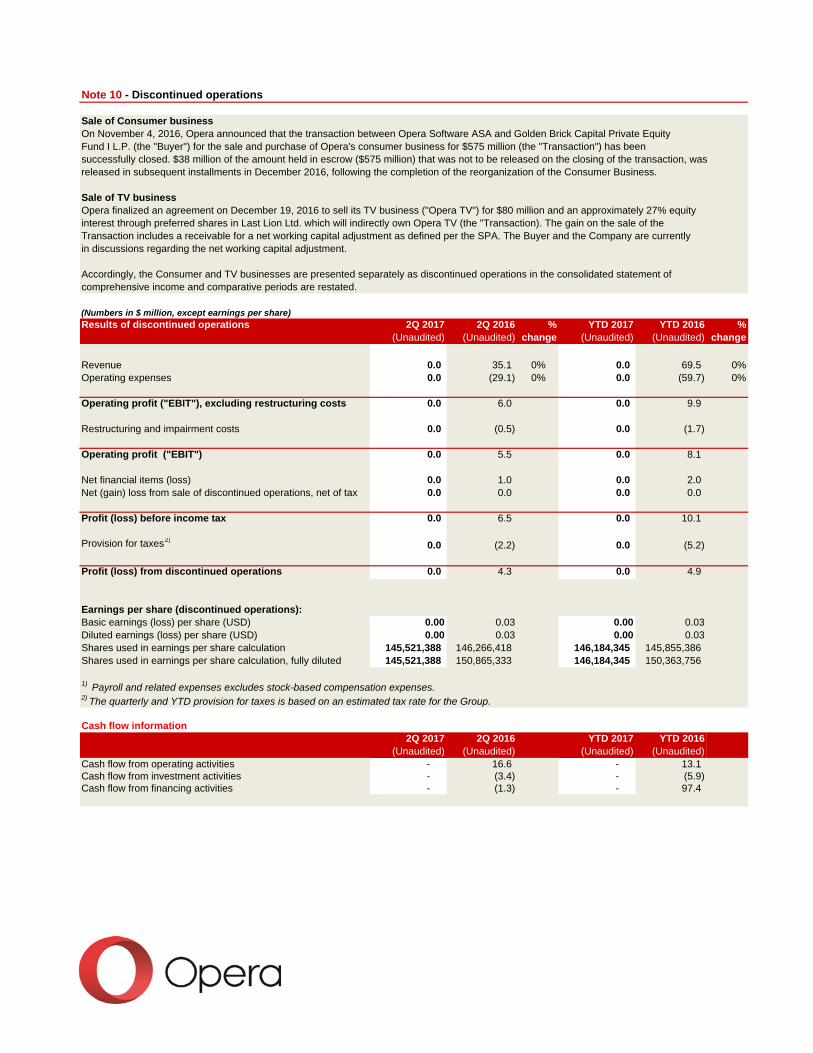
Note 10 - Discontinued operations
Sale of Consumer businessOn November 4, 2016, Opera announced that the transaction between Opera Software ASA and Golden Brick Capital Private Equity Fund I L.P. (the "Buyer") for the sale and purchase of Opera's consumer business for $575 million (the "Transaction") has been successfully closed. $38 million of the amount held in escrow ($575 million) that was not to be released on the closing of the transaction, was released in subsequent installments in December 2016, following the completion of the reorganization of the Consumer Business.
Sale of TV businessOpera finalized an agreement on December 19, 2016 to sell its TV business ("Opera TV") for $80 million and an approximately 27% equityinterest through preferred shares in Last Lion Ltd. which will indirectly own Opera TV (the "Transaction). The gain on the sale of the Transaction includes a receivable for a net working capital adjustment as defined per the SPA. The Buyer and the Company are currently in discussions regarding the net working capital adjustment.
Accordingly, the Consumer and TV businesses are presented separately as discontinued operations in the consolidated statement of comprehensive income and comparative periods are restated.
(Numbers in $ million, except earnings per share)Results of discontinued operations 2Q 2017 2Q 2016 % YTD 2017 YTD 2016 %
(Unaudited) (Unaudited) change (Unaudited) (Unaudited) change
Revenue 0.0 35.1 0% 0.0 69.5 0%Operating expenses 0.0 (29.1) 0% 0.0 (59.7) 0%
Operating profit ("EBIT"), excluding restructuring costs 0.0 6.0 0.0 9.9
Restructuring and impairment costs 0.0 (0.5) 0.0 (1.7)
Operating profit ("EBIT") 0.0 5.5 0.0 8.1
Net financial items (loss) 0.0 1.0 0.0 2.0Net (gain) loss from sale of discontinued operations, net of tax 0.0 0.0 0.0 0.0
Profit (loss) before income tax 0.0 6.5 0.0 10.1
Provision for taxes2) 0.0 (2.2) 0.0 (5.2)
Profit (loss) from discontinued operations 0.0 4.3 0.0 4.9
Earnings per share (discontinued operations):Basic earnings (loss) per share (USD) 0.00 0.03 0.00 0.03Diluted earnings (loss) per share (USD) 0.00 0.03 0.00 0.03Shares used in earnings per share calculation 145,521,388 146,266,418 146,184,345 145,855,386Shares used in earnings per share calculation, fully diluted 145,521,388 150,865,333 146,184,345 150,363,756
1) Payroll and related expenses excludes stock-based compensation expenses.2) The quarterly and YTD provision for taxes is based on an estimated tax rate for the Group.
Cash flow information2Q 2017 2Q 2016 YTD 2017 YTD 2016
(Unaudited) (Unaudited) (Unaudited) (Unaudited)Cash flow from operating activities - 16.6 - 13.1 Cash flow from investment activities - (3.4) - (5.9) Cash flow from financing activities - (1.3) - 97.4
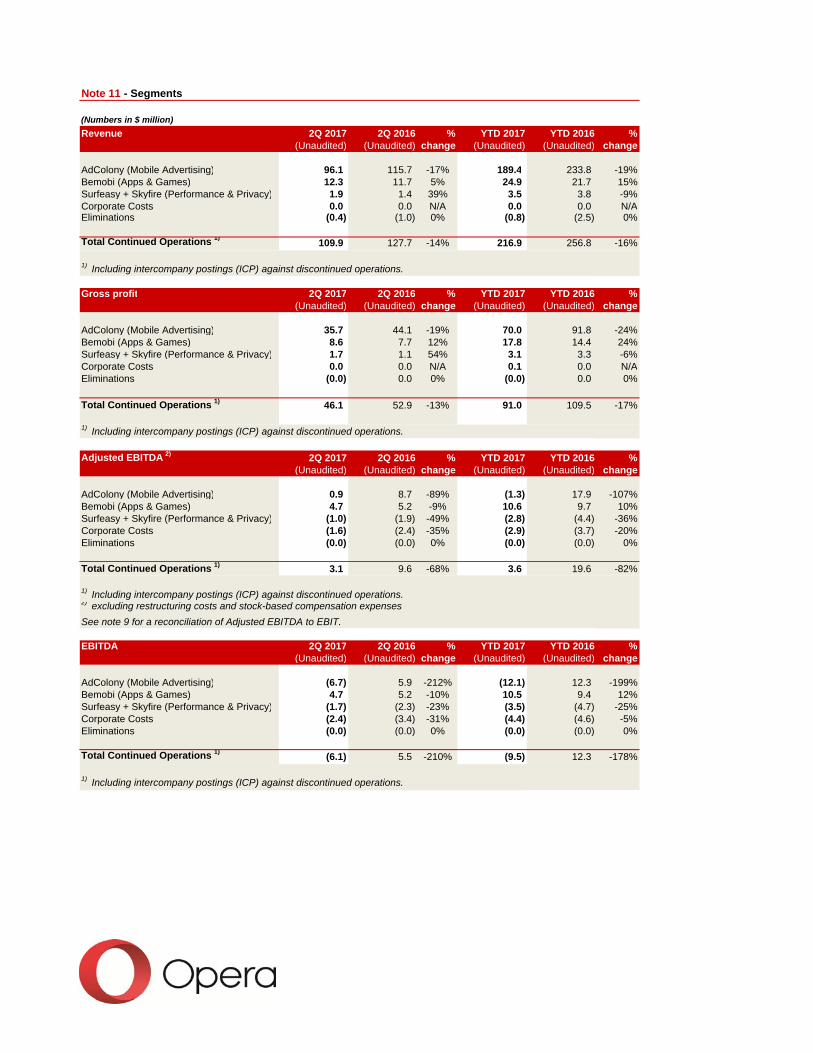
Note 11 - Segments
(Numbers in $ million)
Revenue 2Q 2017 2Q 2016 % YTD 2017 YTD 2016 %(Unaudited) (Unaudited) change (Unaudited) (Unaudited) change
AdColony (Mobile Advertising) 96.1 115.7 -17% 189.4 233.8 -19%Bemobi (Apps & Games) 12.3 11.7 5% 24.9 21.7 15%Surfeasy + Skyfire (Performance & Privacy) 1.9 1.4 39% 3.5 3.8 -9%Corporate Costs 0.0 0.0 N/A 0.0 0.0 N/AEliminations (0.4) (1.0) 0% (0.8) (2.5) 0%
Total Continued Operations 1) 109.9 127.7 -14% 216.9 256.8 -16%
1) Including intercompany postings (ICP) against discontinued operations.
Gross profit 2Q 2017 2Q 2016 % YTD 2017 YTD 2016 %(Unaudited) (Unaudited) change (Unaudited) (Unaudited) change
AdColony (Mobile Advertising) 35.7 44.1 -19% 70.0 91.8 -24%Bemobi (Apps & Games) 8.6 7.7 12% 17.8 14.4 24%Surfeasy + Skyfire (Performance & Privacy) 1.7 1.1 54% 3.1 3.3 -6%Corporate Costs 0.0 0.0 N/A 0.1 0.0 N/AEliminations (0.0) 0.0 0% (0.0) 0.0 0%
Total Continued Operations 1) 46.1 52.9 -13% 91.0 109.5 -17%
1) Including intercompany postings (ICP) against discontinued operations.
Adjusted EBITDA 2) 2Q 2017 2Q 2016 % YTD 2017 YTD 2016 %(Unaudited) (Unaudited) change (Unaudited) (Unaudited) change
AdColony (Mobile Advertising) 0.9 8.7 -89% (1.3) 17.9 -107%Bemobi (Apps & Games) 4.7 5.2 -9% 10.6 9.7 10%Surfeasy + Skyfire (Performance & Privacy) (1.0) (1.9) -49% (2.8) (4.4) -36%Corporate Costs (1.6) (2.4) -35% (2.9) (3.7) -20%Eliminations (0.0) (0.0) 0% (0.0) (0.0) 0%
Total Continued Operations 1) 3.1 9.6 -68% 3.6 19.6 -82%
1) Including intercompany postings (ICP) against discontinued operations.2) excluding restructuring costs and stock-based compensation expenses
See note 9 for a reconciliation of Adjusted EBITDA to EBIT.
EBITDA 2Q 2017 2Q 2016 % YTD 2017 YTD 2016 %(Unaudited) (Unaudited) change (Unaudited) (Unaudited) change
AdColony (Mobile Advertising) (6.7) 5.9 -212% (12.1) 12.3 -199%Bemobi (Apps & Games) 4.7 5.2 -10% 10.5 9.4 12%Surfeasy + Skyfire (Performance & Privacy) (1.7) (2.3) -23% (3.5) (4.7) -25%Corporate Costs (2.4) (3.4) -31% (4.4) (4.6) -5%Eliminations (0.0) (0.0) 0% (0.0) (0.0) 0%
Total Continued Operations 1) (6.1) 5.5 -210% (9.5) 12.3 -178%
1) Including intercompany postings (ICP) against discontinued operations.
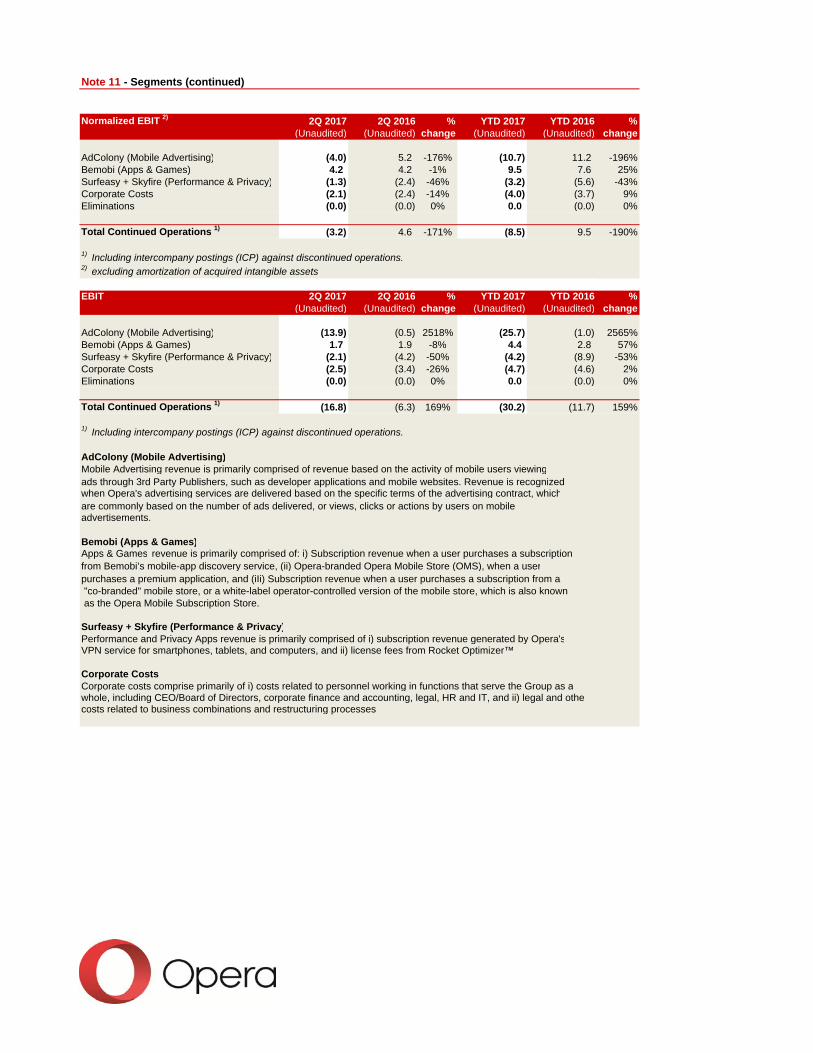
Note 11 - Segments (continued)
Normalized EBIT 2) 2Q 2017 2Q 2016 % YTD 2017 YTD 2016 %(Unaudited) (Unaudited) change (Unaudited) (Unaudited) change
AdColony (Mobile Advertising) (4.0) 5.2 -176% (10.7) 11.2 -196%Bemobi (Apps & Games) 4.2 4.2 -1% 9.5 7.6 25%Surfeasy + Skyfire (Performance & Privacy) (1.3) (2.4) -46% (3.2) (5.6) -43%Corporate Costs (2.1) (2.4) -14% (4.0) (3.7) 9%Eliminations (0.0) (0.0) 0% 0.0 (0.0) 0%
Total Continued Operations 1) (3.2) 4.6 -171% (8.5) 9.5 -190%
1) Including intercompany postings (ICP) against discontinued operations.2) excluding amortization of acquired intangible assets
EBIT 2Q 2017 2Q 2016 % YTD 2017 YTD 2016 %(Unaudited) (Unaudited) change (Unaudited) (Unaudited) change
AdColony (Mobile Advertising) (13.9) (0.5) 2518% (25.7) (1.0) 2565%Bemobi (Apps & Games) 1.7 1.9 -8% 4.4 2.8 57%Surfeasy + Skyfire (Performance & Privacy) (2.1) (4.2) -50% (4.2) (8.9) -53%Corporate Costs (2.5) (3.4) -26% (4.7) (4.6) 2%Eliminations (0.0) (0.0) 0% 0.0 (0.0) 0%
Total Continued Operations 1) (16.8) (6.3) 169% (30.2) (11.7) 159%
1) Including intercompany postings (ICP) against discontinued operations.
AdColony (Mobile Advertising)Mobile Advertising revenue is primarily comprised of revenue based on the activity of mobile users viewingads through 3rd Party Publishers, such as developer applications and mobile websites. Revenue is recognized when Opera's advertising services are delivered based on the specific terms of the advertising contract, whichare commonly based on the number of ads delivered, or views, clicks or actions by users on mobile advertisements.
Bemobi (Apps & Games)Apps & Games revenue is primarily comprised of: i) Subscription revenue when a user purchases a subscriptionfrom Bemobi’s mobile-app discovery service, (ii) Opera-branded Opera Mobile Store (OMS), when a userpurchases a premium application, and (iIi) Subscription revenue when a user purchases a subscription from a "co-branded" mobile store, or a white-label operator-controlled version of the mobile store, which is also known as the Opera Mobile Subscription Store.
Surfeasy + Skyfire (Performance & Privacy)Performance and Privacy Apps revenue is primarily comprised of i) subscription revenue generated by Opera'sVPN service for smartphones, tablets, and computers, and ii) license fees from Rocket Optimizer™
Corporate CostsCorporate costs comprise primarily of i) costs related to personnel working in functions that serve the Group as awhole, including CEO/Board of Directors, corporate finance and accounting, legal, HR and IT, and ii) legal and othecosts related to business combinations and restructuring processes
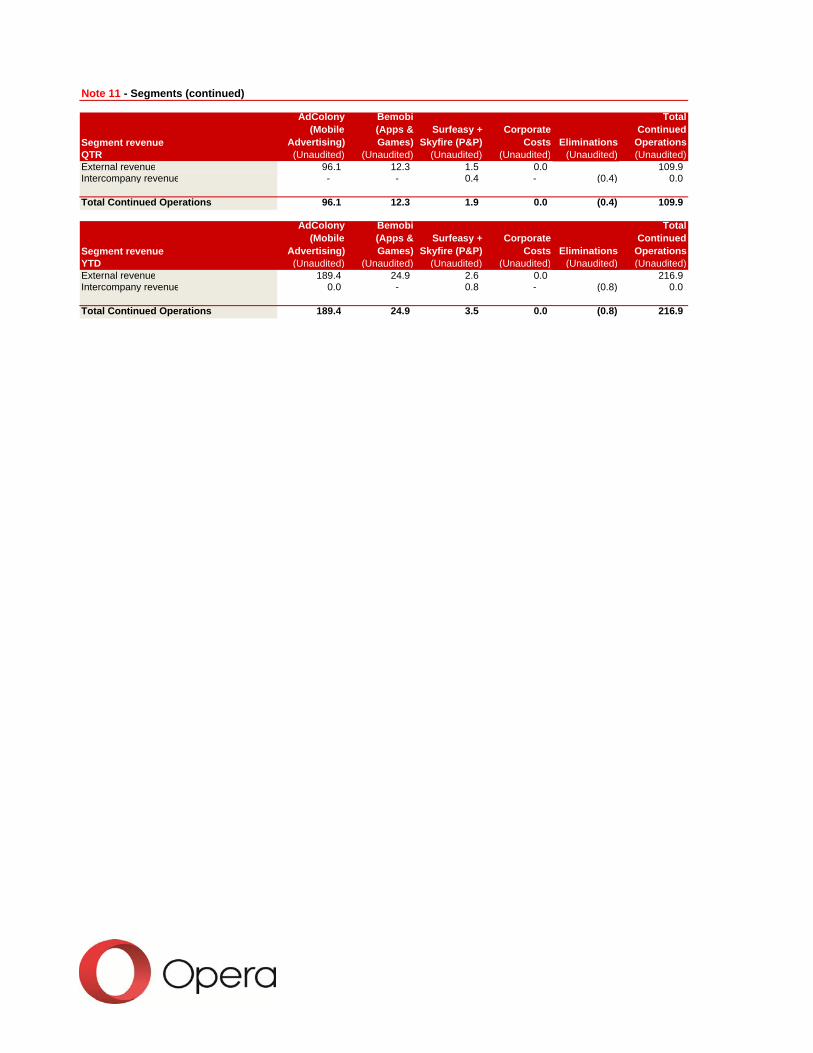
Note 11 - Segments (continued)
Segment revenue
AdColony (Mobile
Advertising)
Bemobi (Apps & Games)
Surfeasy + Skyfire (P&P)
Corporate Costs Eliminations
Total Continued
OperationsQTR (Unaudited) (Unaudited) (Unaudited) (Unaudited) (Unaudited) (Unaudited)External revenue 96.1 12.3 1.5 0.0 109.9 Intercompany revenue - - 0.4 - (0.4) 0.0
Total Continued Operations 96.1 12.3 1.9 0.0 (0.4) 109.9
Segment revenue
AdColony (Mobile
Advertising)
Bemobi (Apps & Games)
Surfeasy + Skyfire (P&P)
Corporate Costs Eliminations
Total Continued
OperationsYTD (Unaudited) (Unaudited) (Unaudited) (Unaudited) (Unaudited) (Unaudited)External revenue 189.4 24.9 2.6 0.0 216.9 Intercompany revenue 0.0 - 0.8 - (0.8) 0.0
Total Continued Operations 189.4 24.9 3.5 0.0 (0.8) 216.9
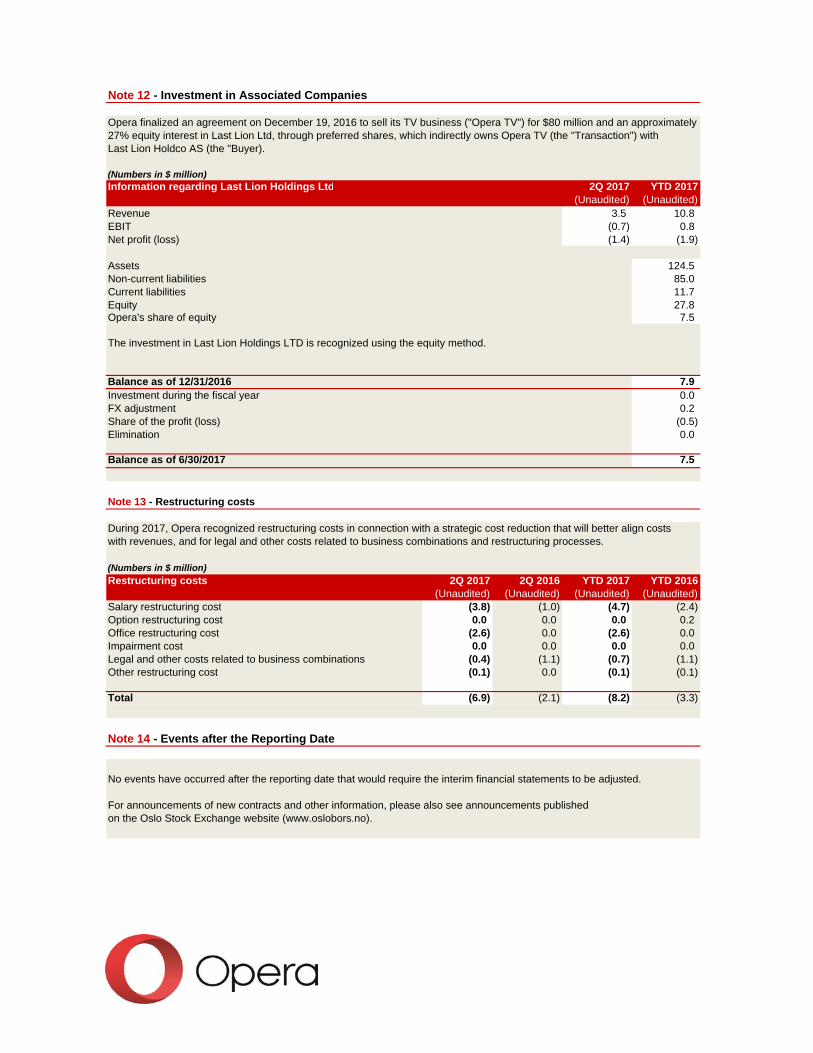
Note 12 - Investment in Associated Companies
Opera finalized an agreement on December 19, 2016 to sell its TV business ("Opera TV") for $80 million and an approximately27% equity interest in Last Lion Ltd, through preferred shares, which indirectly owns Opera TV (the "Transaction") withLast Lion Holdco AS (the "Buyer).
(Numbers in $ million)Information regarding Last Lion Holdings Ltd 2Q 2017 YTD 2017
(Unaudited) (Unaudited)Revenue 3.5 10.8 EBIT (0.7) 0.8 Net profit (loss) (1.4) (1.9)
Assets 124.5 Non-current liabilities 85.0 Current liabilities 11.7 Equity 27.8 Opera's share of equity 7.5
The investment in Last Lion Holdings LTD is recognized using the equity method.
Balance as of 12/31/2016 7.9Investment during the fiscal year 0.0FX adjustment 0.2Share of the profit (loss) (0.5)Elimination 0.0
Balance as of 6/30/2017 7.5
Note 13 - Restructuring costs
During 2017, Opera recognized restructuring costs in connection with a strategic cost reduction that will better align costs with revenues, and for legal and other costs related to business combinations and restructuring processes.
(Numbers in $ million)Restructuring costs 2Q 2017 2Q 2016 YTD 2017 YTD 2016
(Unaudited) (Unaudited) (Unaudited) (Unaudited)Salary restructuring cost (3.8) (1.0) (4.7) (2.4)Option restructuring cost 0.0 0.0 0.0 0.2Office restructuring cost (2.6) 0.0 (2.6) 0.0Impairment cost 0.0 0.0 0.0 0.0Legal and other costs related to business combinations (0.4) (1.1) (0.7) (1.1)Other restructuring cost (0.1) 0.0 (0.1) (0.1)
Total (6.9) (2.1) (8.2) (3.3)
Note 14 - Events after the Reporting Date
No events have occurred after the reporting date that would require the interim financial statements to be adjusted.
For announcements of new contracts and other information, please also see announcements published on the Oslo Stock Exchange website (www.oslobors.no).
OPERA SOFTWARE ASA – SECOND QUARTER 2017
Interim Management Report Review of 1H 2017 Operations Revenue in 1H 2017 was USD 216.9 million, down 15.5% compared to 1H 2016, when revenue was USD 256.8 million. Total operating costs, excluding one-time costs, were USD 238.9 million in 1H 2017 compared to USD 265.2 million in 1H 2016, a decrease of 10%. Adjusted EBITDA* was USD 3.6 million in 1H 2017 compared to USD 19.6 million in 1H 2016. EBIT** was USD (22.0) million in 1H 2017 compared to USD (8.3) million in 1H 2016. Profit for the period was USD (36.4) million in 1H 2017 compared to USD (27.4) million in 1H 2016. Cash flow The Company generated USD 0.8 million in cash flow from operations in 1H 2017, compared to USD 18.8 million in 1H 2016. Cash outflow for investments amounted to USD 35.1 million, including USD 19.6 million related to acquisitions, USD 9.0 million related to research and development and USD 10.0 million related to capital expenditures. Cash outflow from financing activities amounted to USD 15.8 million, with USD 15.4 million in purchase of treasury shares. Financial position Total assets decreased from USD 895.7 million to USD 756.7 million, primarily due to reductions in Goodwill and Intangible assets, as well as Accounts receivables, offset by an increase in cash and cash equivalents. Outlook Opera remains positive about the Group’s overall growth prospects, with the following perspective on the Group as a whole: AdColony operates in a global advertising industry which continues to experience a macro shift in advertising spend from traditional channels to digital online channels. AdColony is well positioned to take advantage of the macro trends and become the highest quality mobile advertising platform in the world. Opera expects AdColony to generate revenue growth in 2H17 vs 1H17, driven in particular by new technology which enables additional ad formats and provides the possibility to tap into new markets. Bemobi operates in a rapid growing market of app subscriptions. It takes advantage of the increased use of mobile phones in emerging markets and the low penetration of credit cards. Opera expects to see revenue growth in Bemobi in 2017 versus 2016, as Bemobi takes the success in Brazil to a global arena. SurfEasy provides online privacy and anti-firewall consumer software (VPN), both premium and free, with the latter generating revenue from anonymized user information which can provide unique market intelligence. SurfEasy is well positioned to take advantage of this growing market and Opera expects to see strong growth in SurfEasy in 2017 versus 2016 Skyfire delivers bandwidth optimization to mobile operators which improve network quality and performance. Skyfire reorganized in 2016 and is positioned to profit from consumers growing demand for high network quality everywhere. Opera aims to make Skyfire profitable in 2017. Opera’s strategic focus is to develop unique and relevant products, and scalable business models which combined should generate revenue growth and margin expansion. With AdColony, Bemobi, SurfEasy and Skyfire, Opera has four scalable businesses for the digital future. Major related party transactions In the past 6 months, there have been no major related party transactions which have had a material impact on the financial statements. Risk factors The majority of the financial risk that the Group is exposed to relates to currency risk. Both revenue and operating expenses are exposed to foreign exchange rate fluctuations. Of the Group’s revenue for 1H 2017, 81 % is generated in USD, 9 % in BRL, 2 % in TRY, and 8 % other currencies. Of the Group’s operating expenses, 79 % is in USD, 6 % in BRL, 3 % in GBP, 2 % in EUR, and 10 % other currencies. Exchange rate fluctuations in these currencies impact Opera's income statement, and can have a significant impact on our operating and financial results. Exchange rate fluctuations may also affect the value of Opera’s capital expenditures as a result of investments made by its subsidiaries.
OPERA SOFTWARE ASA – SECOND QUARTER 2017
Further, each of the risk factors described in FY 2016 Annual Report, under the heading "Risk Factors," can have a significant negative impact on Opera’s business, financial results, operations, cash flow, and the trading price of our common stock. For additional explanations regarding risks and uncertainties, please refer to the FY 2016 Annual Report. Disclaimer Readers are referred to the disclaimer outlined in the 2Q 2017 presentation posted at www.oslobors.no. * Adjusted EBITDA (Non-IFRS EBITDA) excludes stock-based compensation expenses, and one-time costs ** In 1H 2016 and 1H 2017, Opera recognized one-time costs. Including one-time costs, EBIT for 1H 2017 would have been USD (30.2) and EBIT for 1H 2016 would have been USD (11.7).
OPERA SOFTWARE ASA – SECOND QUARTER 2017
Statement by the BOD and the CEO Unaudited – 1H 2017 report of Opera Software ASA The Board of Directors and the CEO have today reviewed and approved the condensed consolidated interim financial statements (“interim report”) for Opera Software ASA for the first half of 2017.
The interim report has been prepared in accordance with IAS 34 “Interim Financial Reporting” as adopted by the EU and additional Norwegian disclosure requirements in accordance with the Norwegian Securities Trading Act.
The Board of Directors and the CEO consider the accounting policies applied to be appropriate. Accordingly, to the best of their knowledge and without the benefit of an audit, the interim report gives a true and fair view of the Group's assets, liabilities and financial position as of June 30, 2017, and of the results of the Group’s operations and cash flows for the first half of 2017.
The Board of Directors and the CEO also consider the interim report to give a true and fair view of the information required by the Norwegian Securities Trading Act section 5–6 paragraph 4.
Oslo, August 23, 2017
The Board of Directors
Opera Software ASA
Audun Wickstrand Iversen, Chairman
Frode Fleten Jacobsen
Sophie Charlotte Moatti
Andrè Alexander Christensen
Birgit Midtbust
Lars Rahbæk Boilesen, CEO