Embed Size (px)
Citation preview

Commit ted to Wip ing Out
In te rnet Scams and F raud
2nd Quarter
2010
April – June 2010
Phishing Activity Trends Report

Phishing Activity Trends Report
2nd Quarter / 2010
w w w . a p w g . o r g ● i n f o @ a p w g . o r g
2
Phishing Activity Trends Report, 2nd Quarter / 2010
2nd Quarter ‘10 Phishing Activity Trends Summary
● Unique phishing reports in Q2 2010 rose to an annual
high of 33,617 in June, down 17 percent from the record
high in August 2009 of 40,621 reports [p. 4]
● The quarterly high of unique phishing websites
detected was 33,253 in April, down 43 percent from the
record high of 56,362 in August 2009 [p. 4]
● The Q2 high of 14,945 brand-domain pairs in April was
down 63 percent from the record of 24,438 in 2009 [p. 5]
● The number of phished brands reached a high of 276 in
May, down 22 percent from the all-time record of 356 in
October, 2009 [p.6]
● Payment Services accounted for nearly 38 percent of
attacks in Q2, up from 37 percent in Q1 [p. 7]
● United States continued its position as the top country
for hosting phishing website during Q2 [p. 7]
● Spain’s proportion of detected crimeware websites rose
to 16 percent in Q2, from less than 4 percent in Q1 [p. 9]
● The percentage of computers infected with banking
trojans and password stealers rose to 17 percent from 15
percent in Q1 [p. 10]
Table of Contents
Statistical Highlights for 2nd Quarter, 2010 3
Phishing Email Reports and Phishing Site Trends 4
Brand-Domain Pairs Measurement 5
Most Used Ports Hosting Phishing Data
Collection Servers in 2nd Quarter 2010 6
Brands & Legitimate Entities Hijacked by
Email Phishing Attacks 6
Most Targeted Industry Sectors 7
Countries Hosting Phishing Sites 7
Measurement of Detected Crimeware 8
Rogue Anti-Malware Programs 9
Phishing-based Trojans & Downloader’s Host
Countries (by IP address) 9
Desktop Crimeware Infections 10
APWG Phishing Trends Report Contributors 11
Phishing Report Scope
The quarterly APWG Phishing Activity Trends Report
analyzes phishing attacks reported to the APWG by its
member companies, its Global Research Partners,
through the organization’s website at
http://www.antiphishing.org and by email submissions
to [email protected]. APWG also
measures the evolution, proliferation and propagation of
crimeware drawing from the research of our member
companies. In the last half of this report you will find
tabulations of crimeware statistics and related analyses
and results of a TLD phishing abuse survey.
Phishing Defined
Phishing is a criminal mechanism employing both social
engineering and technical subterfuge to steal consumers’
personal identity data and financial account credentials.
Social-engineering schemes use spoofed e-mails
purporting to be from legitimate businesses and agencies
to lead consumers to counterfeit websites designed to
trick recipients into divulging financial data such as
usernames and passwords. Technical-subterfuge
schemes plant crimeware onto PCs to steal credentials
directly, often using systems to intercept consumers
online account user names and passwords - and to
corrupt local navigational infrastructures to misdirect
consumers to counterfeit websites (or authentic websites
through phisher-controlled proxies used to monitor and
intercept consumers’ keystrokes).
Classifieds emerged as a major non-traditional phishing vector
accounting for 6.6 percent of phishing attacks detected in Q2
2010, growing 142 percent from Q1. [See Page 7 for details.]
[see page 9]
Classified Ads Sector Breaks Out in Q2
As Rapidly Expanding Phishing Vector

Phishing Activity Trends Report
2nd Quarter / 2010
w w w . a p w g . o r g ● i n f o @ a p w g . o r g
3
Phishing Activity Trends Report, 2nd Quarter / 2010
APWG continues to refine and develop its tracking and reporting methodology and to incorporate new data sources
into our reports. APWG has re-instated the tracking and reporting of unique phishing reports (email campaigns) in
addition to unique phishing sites. An email campaign is a unique email sent out to multiple users, directing them to
a specific phishing web site (multiple campaigns may point to the same web site). APWG counts unique phishing
report emails as those in a given month with the same subject line in the email.
APWG also tracks the number of unique phishing websites. This is now determined by the unique base URLs of the
phishing sites. APWG additionally tracks crimeware instances (unique software applications as determined by MD5
hash of the crimeware sample) as well as unique sites that are distributing crimeware (typically via browser drive-
by exploits).The APWG Phishing Activity Trends Report‘s also includes statistics on rogue anti-virus software, as well
as desktop infection rates.
Methodology note: Starting with this quarter’s report, statistics relating to targeted industry sectors have been
subdivided into additional categories, encompassing Classifieds (e.g. Craigslist), Social Networking (e.g., Facebook),
and Gaming (e.g., Blizzard) that were previously subsumed into the Other category.
April May June
Number of unique phishing email reports received by APWG from
consumers and reporting partners
24,664 26,781 33,617
Number of unique phishing web sites detected 33,253 31,856 32,279
Number of brands hijacked by phishing campaigns 270 276 258
Country hosting the most phishing websites USA USA USA
Contain some form of target name in URL 53.54% 58.75% 40.08%
No hostname; just IP address 4.75% 2.65% 3.97%
Percentage of sites not using port 80 0.08% 0.13% 0.54%
Methodology and Instrumented Data Sets
Statistical Highlights for 2nd Quarter, 2010

Phishing Activity Trends Report
2nd Quarter / 2010
w w w . a p w g . o r g ● i n f o @ a p w g . o r g
4
Phishing Activity Trends Report, 2nd Quarter / 2010
Phishing Email Reports and Phishing Site Trends – 2nd Quarter 2010
The number of unique phishing
reports submitted to APWG in
Q2 2010 described a steady
increase over the quarter, with
the number of reports for June
eclipsing the previous annual
high of 30,577 for 2010 reached
in March. However, the new
Q2 2010 high of 33,617 in June
was still down some 17 percent
from the all-time record high of
40,621 reports in August 2009.
The number of unique phishing
websites detected by APWG
during Q2 2010 remained
relatively consistent month to
month, averaging about 32,000
across the quarter. The quarter
began with 33,253 reported in
April, before dropping to 31,856
in May and rising again to
32,279 in June. The quarterly
high in April was still 43
percent lower than the all-time
high of 56,362 recorded in
August 2009.

Phishing Activity Trends Report
2nd Quarter / 2010
w w w . a p w g . o r g ● i n f o @ a p w g . o r g
5
Phishing Activity Trends Report, 2nd Quarter / 2010
The following chart combines statistics based on brands phished, unique domains, unique domain/brand pairs, and
unique URLs. Brand/domain pairs count the unique instances of a domain being used to target a specific brand.
Example: if several URLs are targeting a brand – but are hosted on the same domain – this brand/domain pair would be
counted as one instead of several. The number of unique brand-domain pairs dropped consistently during the Q2 2010.
The high for the quarter, 14,945 brand-domain pairs in April, was down nearly 63 percent from the record of 24,438
recorded in August, 2009
Forensic utility of this metric: If the number of unique URLs is greater than the number of brand/domain pairs, it
indicates many URLs are being hosted on the same domain to target the same brand. Knowing how many URLs
occur with each domain indicates the approximate number of attacking domains a brand-holding victim needs to
locate and neutralize. Since phishing-prevention technologies (like browser and email blocking) require the full
URL, it is useful to understand the general number of unique URLs that occur per domain.
April May June
Number of Unique Phishing Web Sites Detected 33,253 31,856 32,279
Unique Domains 12,268 12,162 9,199
Unique Brand-Domain Pairs 14,945 14,848 11,470
Unique Brands 270 276 258
URLs Per Brand 123.16 115.40 125.11
Brand-Domain Pairs Measurement – 2nd Quarter 2010
‚Both the number of domain
names and URLs used for
phishing attacks have increased
by more than 8 percent from the
previous quarter,‛ said Ihab
Shraim, MarkMonitor’s chief
security officer and vice
president, network and system
engineering, and Trends Report
contributing analyst. ‚This
indicates that traditional phishing
continues to be a substantial
problem even as scammers are
making greater use of malware
attacks geared toward harvesting
stolen credentials.‛

Phishing Activity Trends Report
2nd Quarter / 2010
w w w . a p w g . o r g ● i n f o @ a p w g . o r g
6
Phishing Activity Trends Report, 2nd Quarter / 2010
The second quarter of 2010 saw a continuation of HTTP port 80 being the most popular port used of all phishing
sites reported, a trend that has been consistent since APWG began tracking and reporting in 2003.
April May June
Port 80 99.924% Port 80 99.876% Port 80 99.462%
Port 443 .057% Port 443 .091% Port 443 .407%
Port 21 .019% Port 21 .033% Port 21 .131%
The second quarter of 2010 saw a high of 276 in May for the three month period, a decrease of 22 percent from the
all-time high of 356 reached in October, 2009.
Most Used Ports Hosting Phishing Data Collection Servers – 2nd Quarter 2010
Brands and Legitimate Entities Hijacked by Email Phishing Attacks – 2nd Quarter 2010

Phishing Activity Trends Report
2nd Quarter / 2010
w w w . a p w g . o r g ● i n f o @ a p w g . o r g
7
Phishing Activity Trends Report, 2nd Quarter / 2010
Payment Services was the most targeted industry sector in Q2, as in Q1, enduring nearly 38 percent of detected
attacks, up slightly from 37 percent in Q1 2010. Financial Services was second at 33 percent followed by Classifieds
at 6.6 percent, though the latter exhibited the most rigorous growth of all sectors in the half.
Research note: Starting with this quarter’s report, statistics relating to targeted industry sectors have been
subdivided into additional categories, encompassing Classifieds (e.g. Craigslist), Social Networking (e.g., Facebook),
and Gaming (e.g., Blizzard) that were previously subsumed into the Other category.
The United States continued its position as the top country hosting phishing sites during Q2 2010 with China, the
United Kingdom and Canada each take a rotation as the second most prevalent phishing website-hosting nation
during the three month period.
April May June
USA 74.88% USA 84.12% USA 68.17%
China 2.97% UK 1.57% Canada 3.94%
UK 2.29% Germany 1.50% UK 3.40%
Rep. Korea 2.05% Canada 1.21% Germany 3.15%
Germany 2.01% France 1.16% France 3.04%
France 1.67% China 1.03% China 1.98%
Netherlands 1.58% Brazil 0.83% Rep. Korea 1.53%
Canada
Gree
1.57% Australia 0.74% Netherlands 1.44%
Hong Kong 0.90% Netherlands 0.72% Brazil 1.39%
Italy 0.76% Rep. Korea 0.66% Hong Kong 1.09%
Countries Hosting Phishing Sites – 2nd Quarter 2010
Most Targeted Industry Sectors – 2nd Quarter 2010
"Online Classifieds emerged as a major,
non-traditional phishing sector with
almost 7 percent of total phish," said Ihab
Shraim, MarkMonitor's Chief Security
Officer and Trends Report contributing
analyst.
"The Classifieds sector grew 142 percent
from the previous quarter and over 91,000
percent from the comparable [Q1] quarter
a year ago. This sudden growth may have
been due to Auction sector phishing
resources shifting over to the Classifieds
sector," Shraim said.
Phishing Activity Trends Report
2nd Quarter / 2010
w w w . a p w g . o r g ● i n f o @ a p w g . o r g
8
Phishing Activity Trends Report, 2nd Quarter / 2010
Measurement of Detected Crimeware – 2nd Quarter 2010
Crimeware Taxonomy and Samples According to Classification
The APWG’s Crimeware statistics categorize crimeware attacks as follows, though the taxonomy will grow as
variations in attack code are spawned. Definition: Crimeware code which is designed with the intent of collecting
information on the end-user in order to steal those users' credentials. Unlike most generic keyloggers, phishing-
based keyloggers have tracking components which attempt to monitor specific actions (and specific organizations,
most importantly financial institutions, online retailers, and e-commerce merchants) in order to target specific
information. The most common types of information are: access to financial-based websites, ecommerce sites, and
web-based mail sites.
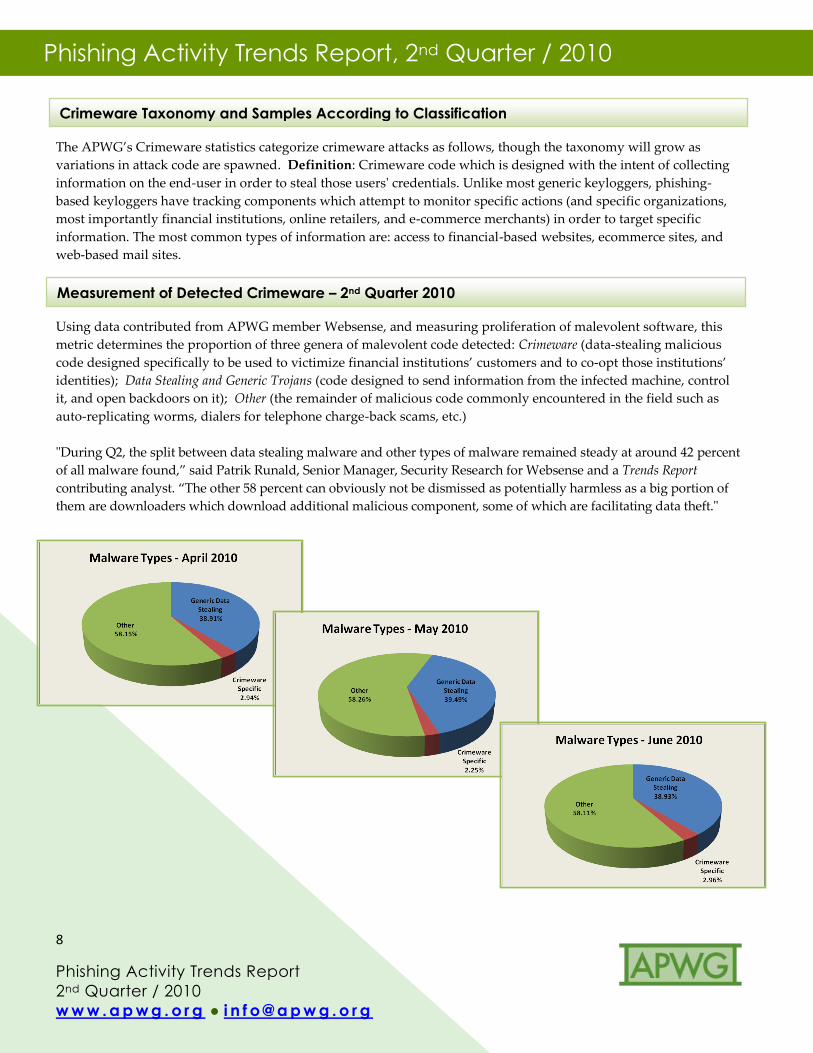
Using data contributed from APWG member Websense, and measuring proliferation of malevolent software, this
metric determines the proportion of three genera of malevolent code detected: Crimeware (data-stealing malicious
code designed specifically to be used to victimize financial institutions’ customers and to co-opt those institutions’
identities); Data Stealing and Generic Trojans (code designed to send information from the infected machine, control
it, and open backdoors on it); Other (the remainder of malicious code commonly encountered in the field such as
auto-replicating worms, dialers for telephone charge-back scams, etc.)
"During Q2, the split between data stealing malware and other types of malware remained steady at around 42 percent
of all malware found,‛ said Patrik Runald, Senior Manager, Security Research for Websense and a Trends Report
contributing analyst. ‚The other 58 percent can obviously not be dismissed as potentially harmless as a big portion of
them are downloaders which download additional malicious component, some of which are facilitating data theft."
Phishing Activity Trends Report
2nd Quarter / 2010
w w w . a p w g . o r g ● i n f o @ a p w g . o r g
9
Phishing Activity Trends Report, 2nd Quarter / 2010
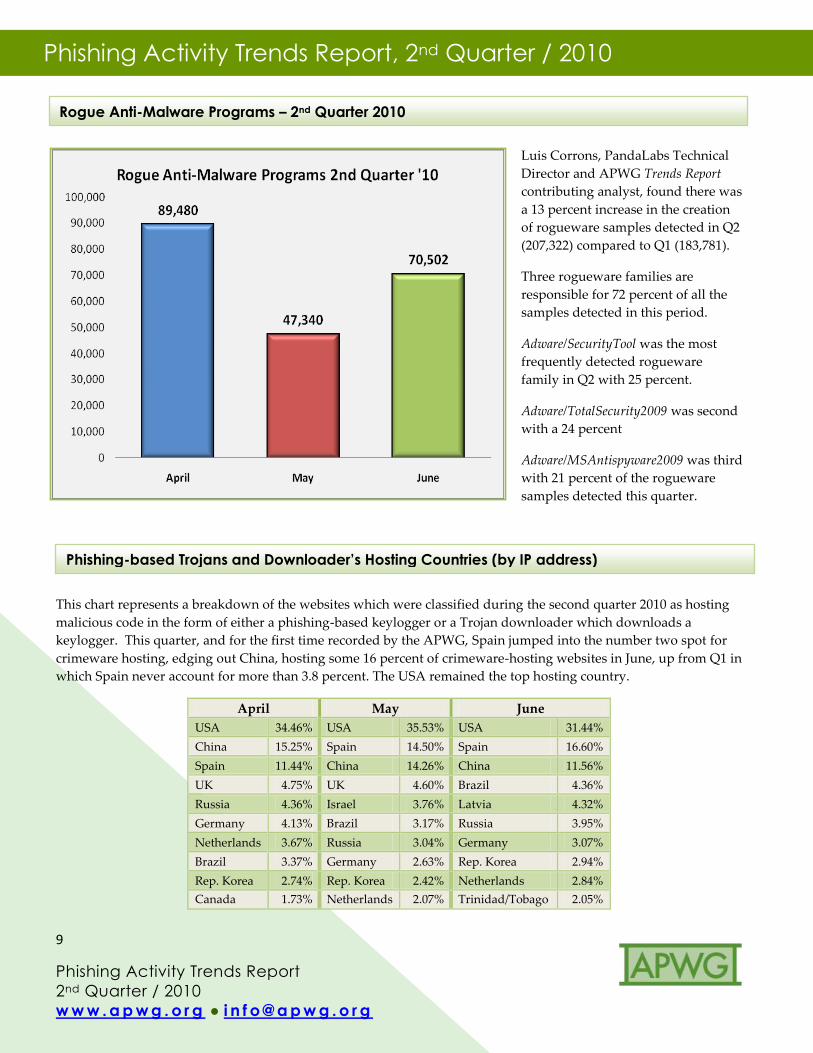
This chart represents a breakdown of the websites which were classified during the second quarter 2010 as hosting
malicious code in the form of either a phishing-based keylogger or a Trojan downloader which downloads a
keylogger. This quarter, and for the first time recorded by the APWG, Spain jumped into the number two spot for
crimeware hosting, edging out China, hosting some 16 percent of crimeware-hosting websites in June, up from Q1 in
which Spain never account for more than 3.8 percent. The USA remained the top hosting country.
April May June
USA 34.46% USA 35.53% USA 31.44%
China 15.25% Spain 14.50% Spain 16.60%
Spain 11.44% China 14.26% China 11.56%
UK 4.75% UK 4.60% Brazil 4.36%
Russia 4.36% Israel 3.76% Latvia 4.32%
Germany 4.13% Brazil 3.17% Russia 3.95%
Netherlands 3.67% Russia 3.04% Germany 3.07%
Brazil 3.37% Germany 2.63% Rep. Korea 2.94%
Rep. Korea 2.74% Rep. Korea 2.42% Netherlands 2.84%
Canada 1.73% Netherlands 2.07% Trinidad/Tobago
go
2.05%
Rogue Anti-Malware Programs – 2nd Quarter 2010
Phishing-based Trojans and Downloader’s Hosting Countries (by IP address)
Luis Corrons, PandaLabs Technical
Director and APWG Trends Report
contributing analyst, found there was
a 13 percent increase in the creation
of rogueware samples detected in Q2
(207,322) compared to Q1 (183,781).
Three rogueware families are
responsible for 72 percent of all the
samples detected in this period.
Adware/SecurityTool was the most
frequently detected rogueware
family in Q2 with 25 percent.
Adware/TotalSecurity2009 was second
with a 24 percent
Adware/MSAntispyware2009 was third
with 21 percent of the rogueware
samples detected this quarter.

Phishing Activity Trends Report
2nd Quarter / 2010
w w w . a p w g . o r g ● i n f o @ a p w g . o r g
10
Phishing Activity Trends Report, 2nd Quarter / 2010
Desktop Crimeware Infections – 2nd Quarter 2010
Scanning and Sampling Methodology: Panda Labs gathers data from millions of computers worldwide through its
scanning service to give a statistically valid view of the security situation at the desktop. The scanned computers
belong to both corporate and consumer users in more than 100 countries. Though the scanning system checks for
many different kinds of potentially unwanted software, for this report, Panda Labs has segmented out
‘Downloaders’ and ‘Banking Trojans/Password Stealers’ as they are most often associated with financial crimes such
as automated phishing schemes.
According to Luis Corrons, PandaLabs Technical Director and an APWG Trends Report contributing analyst,
the proportion of infected computers has decreased (from 53 percent of desktops scanned in Q1 to just over 50
percent in Q2), but the infection rate is still is over 50 percent. That means, Corrons said, that Panda’s scanners have
detected malware (active or latent) in half of all computers scanned.
The percentage of computers infected with banking Trojans and Password Stealers rose to 17 more than percent
from 15 percent in Q1. The percentage of Downloaders rose from under 8.3 percent to almost 8.4 percent in Q2.
Q2: Scanned Computers 18,321,456
Infected Computers 9,215,692 50.30%
Non Infected Computers 9,105,764 49.70%
Banking Trojans / Password
Stealers
3,220,911 17.58%
Downloaders 1,533,506 8.37%

Phishing Activity Trends Report
2nd Quarter / 2010
w w w . a p w g . o r g ● i n f o @ a p w g . o r g
11
Phishing Activity Trends Report, 2nd Quarter / 2010
APWG Phishing Activity Trends Report Contributors
A bo ut t he APW G
The APWG, founded as the Anti-Phishing Working Group in 2003, is an industry association focused on eliminating the
identity theft and fraud that result from the growing problem of phishing and electronic messaging and communications
spoofing. Membership is open to qualified financial institutions, online retailers, ISPs, the law enforcement community,
solutions providers, and relevant non-profit oganizations. There are more than 1,800 companies and government agencies
worldwide participating in the APWG and more than 3,800 members. Because phishing attacks and email fraud are
sensitive subjects, the APWG has a policy of maintaining the confidentiality of member organizations.
The website of the APWG is http://www.antiphishing.org. It serves as a resource for information about the problem of
phishing and electronic frauds perpetrated against personal computers and their users. The APWG, a 501c6 tax-exempted
corporation, was founded by Tumbleweed Communications, financial services institutions and e-commerce providers.
APWG’s first meeting was in November 2003 in San Francisco and in June 2004 was incorporated as an independent
corporation controlled by its board of directors, steering committee and executives.
The APWG Phishing Activity Trends Report is published by the APWG, an industry, government and law
enforcement association focused on eliminating frauds that result from the growing problem of phishing,
crimeware, and electronic imposture. For further information about the APWG, please contact Foy Shiver at
404.434.7282 or [email protected]. For media inquiries related to the content of this report please contact
Secretary General Peter Cassidy at 617.669.1123 or [email protected]; Te Smith of MarkMonitor at
831.818.1267 or [email protected]; Luis Corrons of Panda at [email protected]; Heather
Read of Afilias at [email protected] or 215.706.5777; for Websense, contact [email protected]; and
for Internet Identity contact [email protected] or 253.590.4100
PWG thanks its contributing members, above, for the data and analyses in this report.
Report data consolidation and editing completed by Ronnie Manning, Mynt Public Relations, since 2005.
Websense, Inc. is a global leader in
secure Web gateway, data loss
prevention and email security
solutions, protecting more than 43
million employees at organizations
worldwide.
Afilias is the world’s leading
provider of Internet infrastructure
solutions that connect people to
their data.
Internet Identity (IID) is a US-
based provider of technology and
services that help organizations
secure Internet presence.
Panda Security’s mission is to keep
our customers' information and IT
assets safe from security threats,
providing the most effective
protection with minimum resource
consumption.
MarkMonitor, the global leader in
enterprise brand protection, offers
comprehensive solutions and
services that safeguard brands,
reputation and revenue from
online risks.


![[setting the stage]documents.rec.org/publications/2003.pdfCountries negotiating EU accession, including Turkey, which joins the REC family in 2004, require support in implementing](https://img.pdfslide.us/doc/110x75/5f0ce23a7e708231d4379b4d/setting-the-stage-countries-negotiating-eu-accession-including-turkey-which.jpg)