Embed Size (px)
Citation preview

Research Journal of Environmental and Earth Sciences 6(5): 266-277, 2014 ISSN: 2041-0484; e-ISSN: 2041-0492 © Maxwell Scientific Organization, 2014 Submitted: December 26, 2013 Accepted: January 04, 2014 Published: May 20, 2014
266
2D Electrical Resistivity Tomography Survey for Shallow Environmental Study at
Wastewater Valley of Southwestern Erbil City, Iraqi Kurdistan Region
Sirwa Qadir Smail Gardi Department of Geology, College of Science, University of Salahaddin, Erbil, Iraq
Abstract: The use of wastewater for irrigation in sandy soil increases the pollution risk of the soil and may infiltrate to the water table of groundwater aquifer. This is happening in an area southwest of Erbil City on both sides of the main wastewater valley outlet. Characterizing and monitoring underground conditions and the location of subsurface contaminants is a challenging and costly endeavor. Many sensors and non-invasive geophysical measurement techniques have been developed to interpret the nature of the subsurface without disturbing it. In this study the Electrical Resistivity Tomography (ERT) was used to get detailed 2D resistivity models of the shallowest parts of the subsurface on both side of the valley along eight profiles. The wenner array was employed with 1m, 3m and 5m electrode spacing. The length of each profile was 60 m. To create a model for the subsurface resistivity Res2Dinv software was used. The results showed that the shallowest parts of the ground consist of two types of materials: the first is a clayey sandy gravel soil represents the recent alluvial deposits with resistivity value of 15-167 Ω.m and thickness 1-2 m. Many pollutant zones were detected within it; the second is saturated silty clay and other clayey materials with resistivity value of 9-52 Ω.m. Again some polluted zones were detected. Moreover some fractured areas were detected at where the risk of downward infiltration is expected. The resistivity value changes randomly in both horizontal and vertical direction because of the high infiltration which transports the contaminated materials downward and sideward along in homogeneities formed by human activity in the studied area. Keywords: Electrical resistivity tomography, environmental study, Iraqi, Kurdistan, Southwestern Erbil city,
wenner array, wastewater valley
INTRODUCTION
Environmental problems will be definitely one of the major social problems in this century. Iraqi Kurdistan Region has a rapid development in economic due to relative stability. It is associated with a rapid industrialization, urbanization, agriculture and growth of population. Many populations are living in the rural areas around the cities which mainly depend on the agriculture in landform and livestock, while others are living in the cities and towns.
At the same time, with population expanding at a high rate, the need for increased food production and water consumption are increased. Expansion of urban populations and increased coverage of domestic water supply and sewerage give rise to greater quantities of wastewater and diverse pollution problems developed. Along wastewater valley at the southwest of Erbil City used wastewater for irrigation in rural area. It may generate negative impact on environment and health risks for community.
The shallow subsurface of the earth is an extremely important zone that supports our industrial, agriculture and infrastructure. Soil is one of the important resources in achieving food security through direct association with agricultural production. As safe and effective use of the near-surface environment is a major
challenge facing our society, there is a great need to improve our understanding of the shallow subsurface.
Environmental studies can be studied at both large and small scales. Among all the surface geophysical techniques for shallow subsurface prospecting, electrical resistivity method is the most widely applied method for this purpose. Geo electrical measurements are an important and integral component of geophysical investigations connected with environmental problems. Electrical resistivity survey methods have been widely used in order to solve engineering, archeology, environmental and geological problems in the last decades (Adli et al., 2010).
PURPOSE AND SCOPE OF THE STUDY
Due to the dangerous effect of the pollution on soil
and geological formations, the electrical method has been employed to investigate the extent of waste water intrusion of the valley found everywhere around it, this research aims to:
• Characterize the geological structures which allow
the infiltration • Detect the pollution and to localize of potential
infiltration of pollutant • Localize the infiltration zone of pollution.

Res. J. Environ. Earth Sci., 6(5): 266-277, 2014
267
ELECTRICAL RESISTIVITY IMAGING SURVEY
Resistivity is a physical property of materials. It is
the ability to resist a flow of charges; it is the measurement of how strongly a material resists the flow of electric current (Denchik and Chapellier, 2005). The purpose of electrical surveys is to determine the subsurface resistivity distribution by making measurements on the ground surface. The 2D resistivity measurements are normally made by injecting current into the ground through two current electrodes and measuring the resulting voltage difference at two potential electrodes (Nordiana et al., 2012). Resistivity imaging technique depends on Ohm’s law, which states that the electric current in a material is proportional to the potential difference across it (Abdelwahab, 2013). From these measurements, the true resistivity of the subsurface can be estimated (Loke, 2012).
Geo electrical resistivity imaging has played an important role in addressing a wide variety of hydrogeological, environmental and geotechnical issue. A more accurate model of the subsurface is a two-dimensional (2-D) model where the resistivity changes in the vertical direction, as well as in the horizontal direction along the survey line (Loke, 2012). However, at the present time, 2-D surveys are the most practical economic compromise between obtaining very accurate results and keeping the survey costs down (Dahlin, 1996). Electrical resistivity imaging technique has the ability to present the changes in electrical resistivity values of the compounds during a period of time, thus it is applicable in the environmental pollution (Kaya et al., 2007). This development started with the introduction of practical electrical imaging field systems, like the geoelectrical Wenner pseudosection and was soon followed by effective processing and inversion software (Omowumi, 2012). The imaging technique is particularly powerful and useful in the study areas of complex geology, in groundwater problems and in many other shallow subsurface investigations (Dahlin, 1996).
Electrical resistivity is known to be highly variable among other physical properties of rock (Adli et al., 2010). The resistivity of the 2D model is assumed to vary both vertically and laterally along the survey line but constant in the direction perpendicular to the survey line (Aizebeokhai et al., 2010). Thus a given rock type can have a large range of resistivity, from about 1000 to 10 million Ω.m, depending on whether it is wet or dry (Loke, 2004). The resistivity of a soil or rock is dependent on several factors that include amount of interconnected pore water, porosity, amount of total dissolved solid such as salts and mineral composition (clays) (Nordiana et al., 2012) and degree of water saturation in the rock (Srinivasamoorthy et al., 2009).
MATERIALS AND METHODS Study area: The study area is located at approximately 6.0 km southwest of Erbil City within wastewater valley and has a surface area of approximately 684km2
restricted by Latitudes: 36°9'25.25"N, 36°7'48.54"N and Longitudes: 43°54'26.54"E, 43°51'12.30"E (Fig. 1). Two main branches of wastewater start from north and east parts of the city passing many quarters towards southern west of city to rural region (Jaf, 2008).
Geomorphologic ally the studied area is considered as a plain area which restricted between Erbil City and Guwer town further to the west. The area is almost flat sloping gently towards south and southwest. Six tributaries supply the main valley during rainy seasons (Ghaib, 2004). Geology and structural setting: The study area is a part of the unstable shelf zone that is affected by Alpine orogeny in chamchamal butma subzone in the Foothill zone of Iraq (Buday, 1980). The unstable shelf is characterized by structural trends and facies changes that are parallel to the Zagros-Taurus suture belts.
The Butma-Chamchamal subzone is the NE unit of the Foothill zone. Butma-Chemchemal subzone, however, has very conspicuous long and deep synclines with thick Pliocene molasses dominated by conglomerate and the strata are essentially horizontal (Jassim and Goff, 2006). Erbil plain is considered to be among these plains as a broad syncline between two main anticlinal structures, Pirmam from east and Khurmala-Avana from west (Hassan, 1998) and it is bounded by the Greater Zab and Lesser Zab rivers from the northwest and southeast respectively (Gardi, 2007).
The study area is covered by quaternary sediments (Pleistocene-Holocene) of polygenetic origin (synclinal filling of gravel, sand, silt and clay) (Buday, 1980) (Fig. 1). The sediments filling the synclines consist mainly of a mixture of gravel and clay (Jassim and Goff, 2006). The age of the formation is mostly Pliocene (Buday, 1980). Surficial expectedly thick Quaternary accumulation glacis and alluvial deposits that overlie the Bi Hassan Formation of Late Pliocene age characterize most parts of the Erbil area (Numan and Ghaib, 2006).
As a whole the soil of Kurdistan Region of Iraq is calcareous because it is originated from limestone and dolomite of different formations (FAO, 2001). The texture of soils in the plain regions consists of loam clay sand, loam silt and silt clay, with an average depth of 140cm (Hameed, 2013). Methods of study: In order to achieve the objectives of the present study; resistivity measurements using 2-D electrical imaging survey by ABEM SAS 300 B manufactured by Sweden ABEM cooperation was

Res. J. Environ. Earth Sci., 6(5): 266-277, 2014
268
Fig. 1: Location and geological map of the study area (After Sissakian, 1997)
Fig. 2: Images showing the profiles (1 through 8)

Res. J. Environ. Earth Sci., 6(5): 266-277, 2014
269
Table 1: Coordination of profiles (1-8) as taken by twelve channels global positioning system (GPS) set- the "GARMIN GPS 12"
Profile No.
First point -------------------------------------------------------------------
Last point --------------------------------------------------------------------
Latitude Longitude Latitude Longitude 1 36° 9' 24.18"N 43° 54' 29.20"E 36° 9'25.25"N 43° 54'26.54"E 2 36° 9' 19.89"N 43° 54' 32.75"E 36° 9' 18.15"N 43° 54' 34.13"E 3 36° 9' o5.34"N 43° 53' 34.80"E 36° 9' 06.89"N 43° 53' 33.90"E 4 36° 9' 02.18"N 43° 53' 37.77"E 36° 9' 00.40"N 43° 53' 68.19"E 5 36° 8' 36.01"N 43° 52' 54.60"E 36° 8' 37.20"N 43° 52' 53.46"E 6 36° 8' 33.35"N 43° 52' 57.56"E 36° 8' 32.07"N 43° 52' 59.26"E 7 36° 7' 50.84"N 43° 51' 08.66"E 36° 7' 51.84"N 43° 51' 07.73"E 8 36° 7' 49.85"N 43° 51' 10.28"E 36 °7' 48.54"N 43° 51' 12.30"E
Fig. 3: (a) The observed and; (b) Calculated apparent resistivity pseudosection with; (c) The inverse model resistivity section for
the data set along profile 1 carried out. Field resistivity data were obtained along eight imaging lines (profiles) on both sides of the wastewater valley (Table 1, Fig. 2) and using wenner configuration and a maximum of three levels (1m, 3m and 5m) were attained for each profile which gives 3m depth. It is a common rule of thumb to say that the depth of investigation is of the order of 0.1 to 0.3 times the AB length depending on the type of layering (Bernard, 2003). 2-D resistivity data were acquired along 60 m long profile. Four of the profiles which are 1, 3, 5 and 7 were oriented to the northwest direction while the remaining four profiles 2, 4, 6 and 8 were oriented to the southeast direction. A manual data collection technique was employed. All profiles were established in a direction perpendicular to the wastewater valley (flow direction).
To be able to give a two-dimensional picture of the resistivity distribution within the subsurface as well as a qualitative picture of the resistivity data obtained, the resistivity measurements were used to construct a pseudo section.
RESULTS AND INTERPRETATION
The measured apparent resistivity data were inverted to create a model for the subsurface resistivity using Res2 Dinv software with the new version 3.71.111. The inversion routine used by the program is based on the smoothness-constrained least-squares method by using finite difference forward modeling and Quasi-Newton techniques (Geoelectrical Imaging 2D and 3D, 2013; Loke and Dahlin, 2002).
The first zone of all profiles is interpreted as a layer of recent alluvium deposit. Profile 1: Inverted section (Fig. 3) shows two main zones. The first zone is the surface soil showing variable resistivity materials with resistivity values ranging 30.0-167 Ω.m with thickness of about 1m and increasing towards right of the section to about 2m between electrode numbers 48 and 56. It is composed of silty sand with lateral variation to a lens of sand with thickness of about 0.7-1m beneath electrodes 10-22 to sandy gravel and a lens of conglomerate of polygenetic deposits with thickness of about 1m beneath electrodes

Res. J. Environ. Earth Sci., 6(5): 266-277, 2014
270
Plate 1: Agricultural lands irrigated by wastewater around
Sweri village 48-56. Below this zone there is moderately conductive layer with resistivity ranges of 9-32 Ω.m. This can be interpreted as relatively fine-grained materials of saturated silty clay which represents the sediments of polygenetic of quaternary deposits and may represent surface water. In this layer two zones were detected with low resistivity values ranges 9-14 Ω.m which may represent the pollution that infiltrates from the weak position by wastewater irrigation on the surface (Plate 1). Profile 2: In this Inverted section two zones with various electric resistivity’s were recognized (Fig. 4). The first zone, near the surface, shows a layer of variable resistivity materials forming the surface soil. This is interpreted as variation in the natural soils, which can be sandy soil 40-60 Ω.m and changing laterally to sandy gravel soils 60-80 Ω.m to the right of the section. These variations in resistivity value from left to right may show the impact of wastewater irrigation on surface soil. The thickness of this zone is about 1.0-1.3 m.
The second one represents fine materials of saturated silt and clay with resistivity value ranges 9-20 Ω.m at the left with increasing the ratio of fine sediments like clay to the right of the section. Towards
the central and right parts of the section, zones with low resistivity values 9-12 Ω.m were observed which may be interpreted as pollution zones within shallow surface water. Profile 3: Figure 5 shows the electrical resistivity sections of profile 3. The inverted section shows distinctively different types of resistivity materials of surface soil which ranges between 35-75.4 Ω.m. It has thickness of about 1.0-1.7 m. These variations in resistivity value occur due to variety types of sediments fine and medium to coarse grained material of silt, sand and gravel of quaternary sediments. The second zone represents the saturated fine materials like clay, silt and fine sand with resistivity ranges of 15-30 Ω.m. In this zone the ratio of fine materials increased toward the right of the section. In this section decreasing the resistivity value at some positions as seem from surface downward might expose the effect of wastewater irrigation by farmers. The Geo-Electrical Section of seven (VES) points carried out by Ghaib (2004) along the same profile was compared with the present sections some differences are noted (Fig. 4) shown in the right side of geoelectrical section the high resistivity lens while in the inverted section this lens is absent it means that the wastewater infiltrates to the down with time. Profile 4: The electrical resistivity sections (Fig. 6) can distinguish two zones with different electrical resistivity. The sections show a zone 1.0-1.3 m of different resistivity values ranges 24-75 Ω.m which constitutes variable materials of different sizes like silt and sand which may be exposed to the pollution by irrigated process with wastewater valley through the section and its infiltrate and as shown in the left side of
Fig. 4: (a) The observed and; (b) Calculated apparent resistivity pseudosection with; (c) The inverse model resistivity section for
the data set along profile 2
Res. J. Environ. Earth Sci., 6(5): 266-277, 2014
271
Fig. 5: (a) The observed and; (b) Calculated apparent resistivity pseudosection; (c) Inverseion model resistivity section for the
data set along profile 3 a, b, c and; (d) Geoelectrical section of the same profile constructed by (Ghaib, 2004)
Fig. 6: (a) The observed and; (b) Calculated apparent resistivity pseudosection with; (c) The inverse model resistivity section for
the data set along profile 4, (fracture-like is clear on the left side)

Res. J. Environ. Earth Sci., 6(5): 266-277, 2014
272
Fig. 7: (a) The observed and; (b) Calculated apparent resistivity pseudosection with; (c) The inverse model resistivity section for the data set along profile 5
Fig. 8: (a) The observed and; (b) Calculated apparent resistivity pseudosection with; (c) The inverse model resistivity section for
the data set along profile 6 the section and from center to the right side of the section. This is followed by a zone of silty sand with resistivity values of 43-52 Ω.m and the distinct channel of gravel detected with high resistivity value 60-91 Ω.m from electrode 24 to the end of the section. While at the right of the section moderately resistivity value is
shown which may represent the effect of wastewater that continue inflow to the down through a fracture or very weak zone of sediments may be distinct which the pollutant materials infiltrates through it to the down and it is expect as a risk pollution of surface water. The presence of these geologic weak zones (i.e., fractures)
Res. J. Environ. Earth Sci., 6(5): 266-277, 2014
273
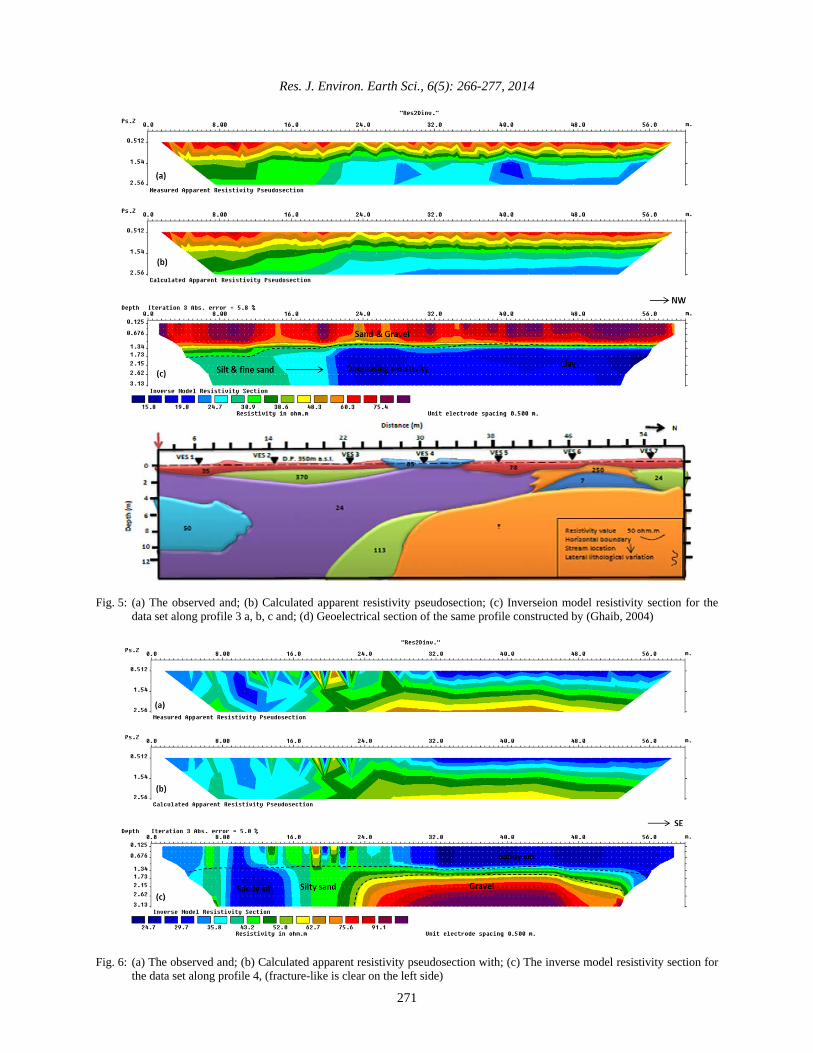
Plate 2: Farmers extract wastewater for agricultural purposes within the subsurface will further reach to the deeper groundwater table. Profile 5: The inverted section presented in Fig. 7, distinguishes two zones with various electric resistivities. The first shallowest zone shows a thin layer of variety resistivity ranges 25-80 Ω.m mostly polluted and having thickness ranges 1.0 m and 1.5 m from electrode 45-60. It represents the classic sediments of quaternary deposits like silt, sand and gravel. The
resistivity values decreases with depth to 10-20 Ω.m indicating that the underneath materials are relatively conductive. This zone is possibly composed of saturated fine sediments like clay and clayey silt and the low resistivity value was observed at the electrode 19-25 which may represent the pollution zone within the surface water. Towards the right of the section, there is increasing in resistivity value due to increasing grain size or increasing the ratio of silt. Profile 6: Inverted section of this profile (Fig. 8) shows two main zones. The first zone is the surface soil and has a variation in resistivity values 30-51 Ω.m due to its composition which contains different types of sediments with a thickness of about 1-2 m at the center of the section. It is composed of sand and gravel and may be interpreted as a polluted soil by the wastewater at electrode position 12 to 22 (Plate 2). Below this zone there is material with resistivity ranges of 22-37 Ω.m.
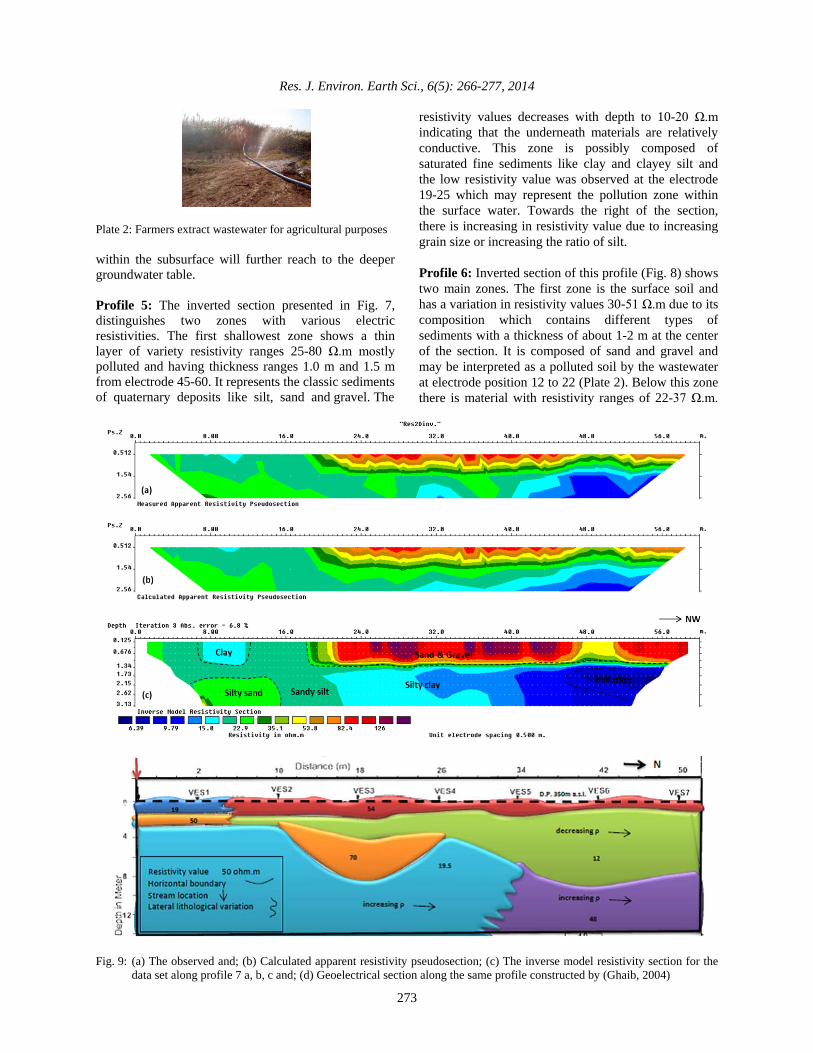
Fig. 9: (a) The observed and; (b) Calculated apparent resistivity pseudosection; (c) The inverse model resistivity section for the
data set along profile 7 a, b, c and; (d) Geoelectrical section along the same profile constructed by (Ghaib, 2004)

Res. J. Environ. Earth Sci., 6(5): 266-277, 2014
274
Fig. 10: (a) The observed and; (b) Calculated apparent resistivity pseudosection with; (c) The inverse model resistivity section
for the data set along profile 8, (fracture-like is clear on the left side) This can be interpreted as relatively saturated fine-grained materials with silt and fine sand content at the center of the section. Decreasing in resistivity value in this zone again may show the effect of pollution. Profile 7: Figure 9 shows the electrical resistivity sections of profile 7. The inverted section shows distinctively different types of resistivity materials of surface soil which ranges between 15-126 Ω.m. It has thickness of about 1.0-1.3 m which represents the clastic sediments of Quaternary sediments (clay, silt, sand and gravel) and it is may be exposed to the risk of pollution near the wastewater valley of about 18 m far from the source of pollution and its infiltrates downward. A lens of clay is present beneath electrodes 7-11, also a position is observed for pollution infiltration just beneath electrodes 47-50. Below this zone low to moderate resistivity values are evident with resistivities 6-30 Ω.m, the value of resistivity is decreased from right to left which represent saturated silty sand to clay and may be contaminated due to very low resistivity value and the infiltration of wastewater is shown beneath the weak position of first zone toward shallow situated grndwater. This section is in good agreement with the Geoelectrical section that was constructed by Ghaib (2004) (Fig. 9d). Profile 8: The inverted section (Fig. 10) of this profile distinguished two zones. The surface soil has resistivity value ranges 34-60 Ω.m representing silty sand to coarse sand sediments with thickness of about 1.0-2.0 m (Plate 3). Underneath the surface soil there is a zone of higher resistivity value ranges 56-193Ω.m. It
Plate 3: Wastewater valley discharges near Jimka village represents a channel of gravel at the left of the section. At the right end of the section the resistivity value becomes low again due to lateral variation which represents silty sand too or may be the pollution zone because it's continued from surface to the shallow surface gound water.
DISSCUSSION
In the studied area annual rainfall is between November and April; mostly in the winter months from December through March which grain crops is depending on rainfall. The remaining six months, particularly the hottest ones of June, July and August, are dry. During that time farmers irrigate vegetables by other water resources because the area lacks irrigation wells, so they use wastewater valley in rural areas along both sides of the wastewater valley mainly those located between Toraq till to Greater-Zab River they are depended on large scale up on the Erbil wastewater taken from sewer outfall (Saeed et al., 2010).
The 2D electrical resistivity tomography was employed with wenner array for three levels only to

Res. J. Environ. Earth Sci., 6(5): 266-277, 2014
275
study environment at shallow depth. After the data acquisition in the field, the observed data (apparent resistivity) was processed by Res2Dinv software, the used method is smoothness-constrained inversion using finite difference forward modeling and Quasi-Newton techniques. The Res2dinv program by default uses a model where the width of the interior model blocks is the same as the unit electrode spacing. In some situations with large resistivity variations near the ground surface better results can be obtained by using narrower model cells. In most cases with large resistivity variations near the surface, using a model with a cell width of half the actual unit electrode spacing is sufficient. When the Res2dinv program reads this file, it will set the model blocks to a 0.5 m width. The model with the 0.5 m block width is able to more accurately model the high resistivity anomalies near the surface (Geoelectrical Imaging 2D and 3D, 2013). Among the Inverted sections three of them have had high errors (more than 5.0), it didn’t mean that’s unacceptable but its depend upon the interpreter and the geological background of the studied area, however the model with the lowest possible error can sometimes show large and unrealistic variations in the model resistivity values and might not always be the "best" model from a geological perspective.
The results obtained illustrate the in homogeneities of the subsurface in general where the pollution zones are well detected. This in homogeneity can be considered as the main reason of infiltration which leads to a suitable environment for pollution distribution of pollutants. The obtained results verified the resolution and low cost of the surveys of the electrical method, in order to delineate some of the environmental aspect; wastewater intrusion. In particular, the technique was suitable for detecting zones of pollution and pollutants caused by wastewater intrusion in the in homogeneity materials, with good reliability.
The wastewater is used for irrigation and it is absorbed by soil then by plants thus affects food quality and safety and these plants are used by human beings and animals as a food. Wastewater contains a variety of pollutants including pathogens and heavy metals (Srinivasan and Reddy, 2009) these toxic elements (heavy metals) are normally present in small amounts and, hence, they are called trace elements (Pescod, 1992) which can potentially harm environment as well as human and animal health. The use of untreated wastewater for irrigation, no doubt, poses a high risk to human health in all age groups. However, the degree of risk may vary among the various age groups (Hussain et al., 2002).
Mojiri et al. (2013) studied the effects of urban wastewater on soil properties. They resulted that the application of wastewater caused an increase of Electrical Conductivity (EC), Organic Matter (OM),
Total Nitrogen (TN), Cl, Na, Cr, Ni, Fe, Mn and Zn in soil. The irrigation with wastewater caused accumulation of heavy metals. Organic matter and the root system in the soil increase the soil porosity, thus leading to increased infiltration of the soil.
Therefore, irrigation with wastewater has both beneficial and harmful effects. Irrigation by wastewater is a beneficial use in water scarce regions while the contaminants present in it pose several environmental and health problems. The wastewater using for irrigation purpose has many negative impacts as Hussain et al. (2002) followed the potential impacts of wastewater use in agriculture are: public health, crops, soil resources, groundwater resources, property values, ecological impacts and social impact. Bapeer (2010) studied the water quality of Erbil waste water and conceded that the wastewater in the main channel match to irrigation purpose only in winter season.
CONCLUSION
A 2-D electrical resistivity tomography survey by using Wenner array has revealed the pattern of resistivity variations within the study area. The inverted sections for the eight investigated sites reveal essentially the lithology changes at each site.
Generally the shallowest part of the ground was divided into two main zones. The top soil of the survey area is generally resistive represents the recent alluvial deposits with resistivity value of 15-167 Ω.m and thickness 1-2 m, this variation in resistivity value shows variable materials: siltys and soil, sandy soil and sandy gravel soil and may be related to different degree of compaction in the area, in addition to its contaminated by wastewater irrigation.
In the second zone on the other hand, the low resistivity anomalies observed with resistivity value of 9-52 Ω.m with increase in depth along the profiles could be due to changes in moisture contents and degree of contamination which could cause the subsurface to have varying resistivities. The decrease in resistivity may indicate that overburden is relatively tending towards siltyclay/clayey material at depth. However, low resistivity anomaly may be due to the presence of saturated clayey materials at shallow depth and intrusion of wastewater through the in homogeneity materials with resistivity value 6-15 Ω.m which detected as a polluted zone within shallow groundwater in profiles 1, 2, 3, 4, 5 and 7 but this low resistivity value is not detected in profile 6 and 8 because of high resistivite materials which may be affected by pollution too. In this zone two channels of gravel is detected in profiles 4 and 8 with resistivity value of 56-193Ω.m, this is very common in recent alluvial deposits in the Erbil Plain area (Ghaib, 2001).
There is a contact zone between topsoil and saturated siltyclay and clayey material which produces

Res. J. Environ. Earth Sci., 6(5): 266-277, 2014
276
the weak zone. The approximate depth to the saturated zone is 1-2 m. The presence of these geologic weak zones within the subsurface will further support downward of continuation of the contamination process at more depth with high concentration.
During this study observed that the resistivity changes randomly in both horizontal and vertical direction which indicate the high infiltration transports the contaminated materials downward along in homogenities formed by human activity in the studied area.
ACKNOWLEDGMENT
The author wishes to express her gratitude to Professor Dr. Fadhil Ali Ghaib in geology department, Salahaddin University for his contributions, planning and supporting during the period of carrying out the research. The author would like to special thanks to Mr. Ahmed Jadooh Ridha Al-Heety, M.Sc. student (Geophysics) in Mousl University for his helpful comments on this paper and providing many valuable references.
REFERENCES
Abdelwahab, H., 2013. Comparison of 2D and 3D
resistivity imaging methods in the study of shallow subsurface structures. Greener J. Phys. Sci., 3(4): 149-158.
Adli, Z.H., M.H. Musa and M.N.K. Arifin, 2010. Electrical resistivity of subsurface: Field and laboratory assessment. World Acad. Sci. Eng. Technol., 69: 805-808.
Aizebeokhai, A.P., A.I. Olayinka and V.S. Singh, 2010. Application of 2D and 3D geoelectrical resistivity imaging for engineering site investigation in a crystalline basement terrain, southwestern Nigeria. Environ. Earth Sci., 61: 1481-1492.
Bapeer, U.H.K., 2010. A study on the main sewage channel in Erbil city Destiny and its matching to irrigation purpose. J. Kirkuk Univ. Sci. Stud., 5(2): 61-75.
Bernard, J., 2003. Short Note on the Depth of Investigation of Electrical Methods. IRIS Instruments, pp: 8.
Buday, T., 1980. The Regional Geology of Iraq: Stratigraphy and Paleogeography. State Organization for Minerals, Baghdad, 1: 445.
Dahlin, T., 1996. 2D resistivity surveying for environmental and engineering applications. First Break, 14: 275-284.
Denchik, N. and D. Chapellier, 2005. 3D electrical resistivity monitoring during rainfalls. Proceeding of the Paper Presented at the 3rd Swiss Geoscience Meeting.
FAO (Food and Agriculture Organization), 2001. Study of agro-ecological zoning for Diana, Mergasor, Barzan and Sheruan- Mazin/Rubar Barazgird valley areas. FAO Representation in Iraq. FAO Coordination Office for Northern Iraq.
Gardi, K.I.M., 2007. Study of subsurface features by using seismic reflection data in Erbil area, Kurdistan region-Iraq. M.Sc. Thesis, Department of Geology, Science College, University of Sulaimani, Iraq, pp: 93.
Geoelectrical Imaging 2D and 3D, 2013. Rapid 2-D Resistivity and IP Inversion using the Least-Squares Method. RES2DINVx32 ver. 3.71.109 with Multi-Core Support, Geotomo Software, Malaysia, pp: 161.
Ghaib, F.A., 2004. Pollution around the wastewater valley of Erbil City (a geophysical contribution). Proceeding of the 6th International Conference on Geochemistry, Alexandria University, Egypt.
Ghaib, F.A., 2001. Gravity and magnetic survey in Erbil and Aqra Plains and Their geological implications. Ph.D. Thesis, Salahaddin University, Erbil-Iraq.
Hameed, H.M., 2013. Water harvesting in Erbil Governorate, Kurdistan region, Iraq, Detection of suitable sites using Geographic Information System and Remote Sensing. M.Sc. Thesis, Department of Physical Geography and Ecosystems Science, Lund University, Sweden, pp: 58.
Hassan, E.O., 1998. Urban hydrogeology of Erbil city region. Ph.D. Thesis, University of Baghdad, Iraq.
Hussain, I., L. Raschid, A.M. Hanjra, F. Marikar and M.V.D. Hoek, 2002. Wastewater use in agriculture: Review of impacts and methodological issues in valuing impacts. (With an extended list of bibliographical references). Working Paper 37. International Water Management Institute, Colombo, Sri Lanka, pp: 55.
Jaf, T.A.A., 2008. A study on (Pb, Ni, Cu) concentration and related factors in some uncooked vegetables irrigation by sewage water of Hawler City, Kurdistan Region of Iraq. M.Sc. Thesis, Department of Biology, Science College, Salahaddin University.
Jassim, S.Z. and J.C. Goff, 2006. Geology of Iraq. Published by Dolin, Prague and Moravian Museum, Brno, pp: 341.
Kaya, M.A., G. Ozurlan and E. Sengul, 2007. Delineation of soil and groundwater contamination using geophysical methods at a waste disposal site in Canakkale, Turkey. Environ. Monit. Assess., 135: 441-446.
Loke, M.H., 2004. User’s Manual for RES2DINV Software. Geotomo Software, pp: 128.
Loke, M.H., 2012. Rapid 2-D Resistivity and IP inversion using the least-squares method. Geoelectrical Imaging 2D and 3D GEOTOMO Software, Malaysia, pp: 160.

Res. J. Environ. Earth Sci., 6(5): 266-277, 2014
277
Loke, M.H. and T. Dahlin, 2002. A combine Gauss-Newton and Quasi-Newton inversion methods for interpretation of apparent resistivity pseudosections. J. Appl. Geophys., 49: 149-162.
Mojiri, A., H. Abdul Aziz, S.H. Aziz, A. Gholami and M. Aboutorab, 2013. Impact of urban wastewater on soil properties and Lepidium sativum in an arid region. Int. J. Sci. Res. Environ. Sci., 1(1): 7-15.
Nordiana, M.M., S. Rosali, S.M. Mokhtar, N.M.M. Nawawi and I.N. Azwin, 2012. Imaging subsurface characterization at Bukit Bunuh using 2D resistivity method: The effectiveness of enhancing horizontal resolution (EHR) technique. Int. J. Environ. Sci. Develop., 3(6): 569-573.
Numan and Ghaib, 2006. Qualitative Interpretation of Gravity and Magnetic Data of Erbil Area, Iraqi Kurdistan Region. Proceeding of the 4th
International Symposium on Geophysics, Tama, pp: 185-200.
Omowumi, O., 2012. Electrical resistivity imaging survey for shallow site investigation at university of Ibadan campus southwestern Nigeria. J. Eng. Appl. Sci., 7(2): 187-196.
Pescod, M.B., 1992. Wastewater treatment and use in agriculture. FAO Irrigation and Drainage Paper 47, Food and Agriculture Organization, United Nations, pp: 169.
Saeed, M.A.H., M.H.H. Lak and J.J. Toma, 2010. Environmental and biological study of Arab - Kand waste water channel in Erbil governorate Kurdistan region-Iraq. Tikrit J. Pure Sci., 15(3): 91-100.
Srinivasamoorthy, K., V.S. Sarma, M. Vasantavigar, K. Vijayaraghavan, S. Chidambaram and R. Rajivganthi, 2009. Electrical imaging techniques for groundwater pollution studies: A case study from Tamilnadu State, South India. Earth Sci. Res. J., 13(1): 30-41.
Srinivasan, J.T.V. and R. Reddy, 2009. Impact of irrigation water quality on human health: A case study in India. Ecol. Econ., 68: 2800- 2807.
Sissakian, V.K., 1997. Geological Map of Iraq. 1st Edn., Scale 1:250000, Geosurv, Baghdad, Iraq.