Embed Size (px)
Citation preview

™
™
2944_Cover.indd 12944_Cover.indd 1 3/25/20 2:46 PM3/25/20 2:46 PM
© 2020 B&G Foods, Inc. All rights reserved.
�is Annual Report includes certain forward-looking statements that are basedupon current expectations and are subject to a number of risks and uncertain-ties. Please see “Forward-Looking Statements” beginning on page 3 of this Annual Report.
* As part of our precautions regarding COVID-19, we are planning for the possibilitythat the annual meeting may be held by means of remote communication only. If wetake this step, we will announce the decision to do so and provide details on how toparticipate at www.bgfoods.com/investor-relations. If you are planning to attendin person, please check the website one week prior to the meeting date.
Company Information
Board of DirectorsStephen C. SherrillChairman of the BoardDirector since 1996Kenneth G. RomanziPresident and Chief Executive O�cerDirector since 2019DeAnn L. BruntsDirector since 2015Charles F. MarcyDirector since 2010Robert D. MillsDirector since 2018Dennis M. MullenDirector since 2006Cheryl M. PalmerDirector since 2010Alfred PoeDirector since 1997David L. WennerDirector since 1997
Executive OfficersKenneth G. RomanziPresident and Chief Executive O�cerErich A. FritzExecutive Vice President and Chief Supply Chain O�cerJordan E. GreenbergExecutive Vice President and Chief Commercial O�cerEric H. HartExecutive Vice President of Human Resources andChief Human Resources O�cerScott E. LernerExecutive Vice President, General Counsel, Secretary and Chief Compliance O�cerEllen M. SchumExecutive Vice President and Chief Customer O�cerBruce C. WachaExecutive Vice President of Finance andChief Financial O�cer
Corporate headquartersB&G Foods, Inc.Four Gatehall DriveParsippany, NJ 07054Telephone: 973.401.6500Website: www.bgfoods.com
Stock Exchange ListlngB&G Foods’ common stock is traded on theNew York Stock Exchange under the ticker symbol BGS.
corporate news releases and sec filingsCorporate news releases and SEC �lings, including Forms 10-K, 10-Q and 8-K are available free of charge in theInvestor Relations section of our website, www.bgfoods.com. If you do not have internet access, you may contactICR, Inc. at the address and telephone number listed below to request these materials.
Investor RelationsInquiries and requests regarding this annual report and other stockholder questions should be directed to:
ICR, Inc.685 �ird Avenue, 2nd Floor, New York, NY 10017 Attn: Dara Dierks Telephone: 866.211.8151
Please also visit the Investor Relations section of our website, www.bgfoods.com.
Transfer Agent and RegistrarComputershare Investor ServicesP.O. Box 505000Louisville, KY 40233
Private Couriers/Registered Mail: Computershare Investor Services 462 South 4th Street, Suite 1600Louisville, KY 40202
Telephone: 877.373.6374Website: www.computershare.com Hearing Impaired #: TDD: 800.952.9245
Independent Registered Public Accounting FirmKPMG LLP51 John F. Kennedy Parkway Short Hills, NJ 07078
Annual Meeting�e annual meeting of stockholders will be held on Tuesday,May 12, 2020, at 10:00 a.m., local time, at the Hilton Parsippany,1 Hilton Court, Parsippany, NJ 07054.
*
Adjusted EBITDA is a “non-GAAP (Generally Accepted Accounting Principles) financial measure.” Please see the discussion within the footnotes to Item 6, “Selected Financial Data” in the following Annual Report for a more detailed discussion of adjusted EBITDA and a reconciliation of adjusted EBITDA with the most directly comparable GAAP measures for fiscal 2019, 2018, 2017, 2016 and 2015, along with the components of adjusted EBITDA.
*
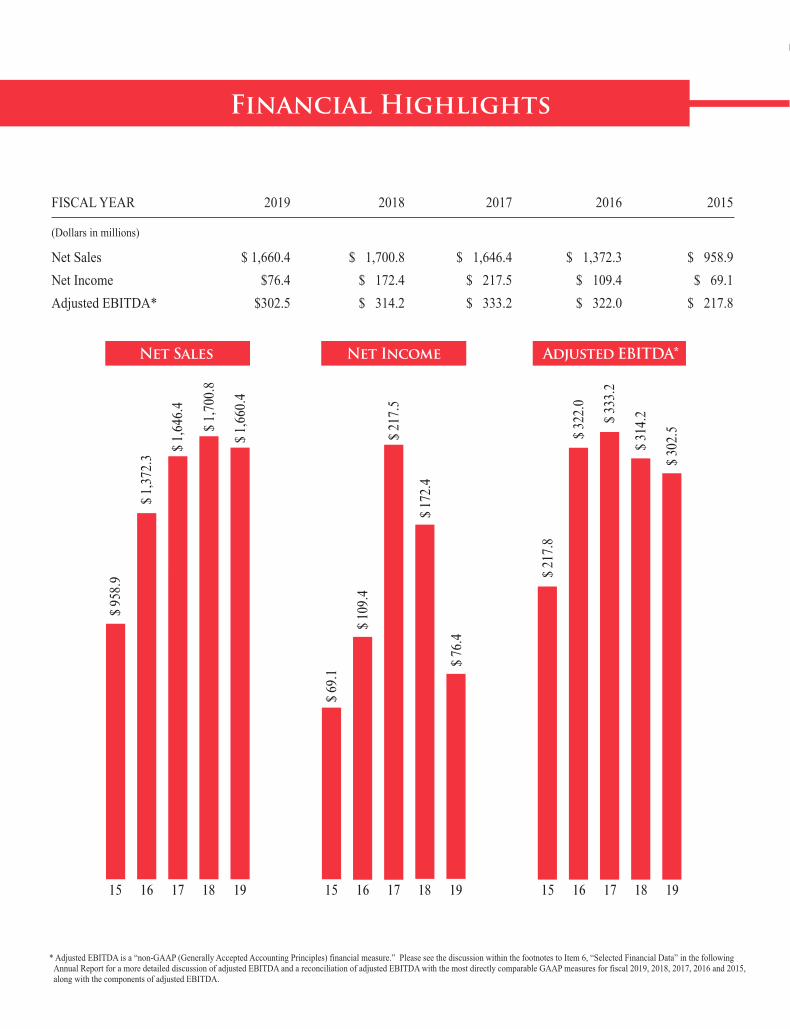
FISCAL YEAR 2019 2018 2017 2016 2015
(Dollars in millions)
Net Sales $ 1,660.4 $ 1,700.8 $ 1,646.4 $ 1,372.3 $ 958.9 Net Income $76.4 $ 172.4 $ 217.5 $ 109.4 $ 69.1 Adjusted EBITDA* $302.5 $ 314.2 $ 333.2 $ 322.0 $ 217.8
15 16 17 18 19
$ 30
2.5
$ 31
4.2
$ 21
7.8
$ 33
3.2
$ 32
2.0
15 16 17 18 19
$ 76
.4
$ 17
2.4
$ 69
.1
$ 21
7.5
$ 10
9.4
15 16 17 18 19
$ 1,
660.
4
$ 1,
700.
8
$ 95
8.9
$ 1,
646.
4
$ 1,
372.
3
Net Sales Net Income Adjusted EBITDA*
Financial Highlights
2944_Cover.indd 22944_Cover.indd 2 3/25/20 6:22 PM3/25/20 6:22 PM
21MAR201707310323
TO OUR STOCKHOLDERS:
Business Performance
I am pleased to report that our 2019 financial results were solid and consistent with our short-termand long-term plans, which are based upon our goal of a stable base business with pricing and costsavings initiatives to offset inflation, complemented by net sales and earnings growth through newproduct innovation and accretive acquisitions. We see 2019 as the start of a new era for B&G Foods.
Some of our notable 2019 highlights include:
• the realignment of our executive leadership team, including a new executive vice presidentand chief customer officer, executive vice president and chief commercial officer andexecutive vice president and chief supply chain officer;
• the successful implementation of our new enterprise resources planning (ERP) system;
• the continued roll out of our Green Giant brand vision to be the ‘‘plant-based veggie brand ofthe future’’ by delivering on its mission to get people to eat more vegetables with continuedgrowth of category re-inventing innovation;
• the successful acquisition of Clabber Girl Corporation and fully integrating the business intoour sales, distribution and manufacturing network;
• the completion of a $1 billion debt refinancing, the largest in our company’s history and atattractive interest rates; and
• the return of $123.7 million of cash to our stockholders in the form of dividends and anadditional $34.7 million in the form of share repurchases.
Our 2019 results demonstrate that we can get back to growth through accretive acquisitions anddeliver what we say. In 2019, we had net sales of $1,660.4 million and adjusted EBITDA* of$302.5 million. We also generated adjusted EBITDA as a percentage of net sales of 18.2% for fiscal2019, which was generally consistent with our expectations. After adjusting for approximately$74.9 million in net sales for Pirate Brands in fiscal 2018 (a business that we sold in late 2018), ourfiscal 2019 net sales represented an increase of $34.5 million, or 2.1%, over the prior year. While thereis certainly room for improvement, we believe 2019 was the first year of many in improvedperformance.
Investment Highlights
In our fifteen years as a publicly held company, we have proven our commitment to creatingstockholder value by consistently paying a generous and growing cash dividend. We have paid adividend every quarter since our initial public offering and over the fifteen years since our initial publicoffering, we have increased the dividend at a compound annual growth rate of 5.9%. We have beenable to maintain our dividend policy year after year by growing net sales and adjusted EBITDA overthe past fifteen years at compound annual growth rates of 10.5% and 10.2%, respectively. Our dividendyield is among the highest in the industry and we remain as committed as ever to our policy of
* Adjusted EBITDA is a ‘‘non-GAAP (Generally Accepted Accounting Principles) financial measure.’’ Please see thediscussion in the footnotes to Item 6, ‘‘Selected Financial Data’’ and in the Management’s Discussion and Analysis sectionin the following Annual Report on Form 10-K for a more detailed discussion of adjusted EBITDA and reconciliations ofadjusted EBITDA with the most directly comparable GAAP measures along with the components of adjusted EBITDA.
25MAR202015424801
returning a meaningful portion of our excess cash to stockholders. As mentioned above, during 2019,we returned almost $160 million of cash to our stockholders.
Acquisition Strategy
Our ongoing acquisition strategy, which we have executed successfully over many years, continuedto yield positive results in 2019. On May 15, 2019, we acquired Clabber Girl Corporation, a leader inbaking products, including baking powder, baking soda and corn starch, from Hulman & Company forapproximately $84.6 million in cash. In addition to Clabber Girl, the number one retail baking powderbrand, Clabber Girl Corporation’s product offerings include the Rumford, Davis, Hearth Club and Royalbrands of retail baking powder, baking soda and corn starch, and the Royal brand of foodservicedessert mixes. Clabber Girl is an excellent addition to our existing portfolio of brands. This acquisitionis another example, along with our acquisitions of Green Giant, McCann’s, Spice Islands and otherspices & seasoning brands, Victoria and Back to Nature, of our efforts in recent years to acquirebetter-for-you brands that taste great and resonate with today’s consumer.
In Closing
It has been almost a year since I took over as President and Chief Executive Officer ofB&G Foods. I am very proud of the progress we made during the last year, viewing 2019 as a year thatgot us back on track with our long-term goals.
While we understand investor concern over our stock price and debt leverage, we are committedto continuing to make progress in 2020 towards improved, sustainable performance and generatingexcess cash flow to help reduce leverage. We believe our 2020 plan will allow us to reduce our leveragebelow six times pro forma adjusted EBITDA by the end of the year. In addition, we believe wemaintain the capability to acquire additional businesses, consistent with our acquisition strategy. Webelieve opportunities remain to acquire businesses without increasing leverage and that in some cases,may even help reduce leverage.
For 2020, our long-term strategic objectives remain the same:
• driving modest organic growth of up to 2% through key brands, including Green Giant,Ortega, Mrs. Dash and McCann’s, amongst others, while maintaining a large portfolio ofstable brands and managing our remaining brands for cash flow;
• improving margins through cost savings initiatives and trade spend optimization;
• making accretive acquisitions of complementary businesses; and
• building a winning workplace by investing in our people, processes and systems.
Our passion for what we do, our commitment to food safety and quality, integrity andaccountability, our customer and consumer focus, our commitment to the safety and health of ouremployees and our belief in collaboration and empowerment are the values that have driven thesuccess of this company for many years and will continue to drive our company’s success in the future.It is because of these values that we have been able to create tremendous stockholder value over theyears, and I believe stockholders of B&G Foods should continue to expect a bright future ahead.
Sincerely,
Kenneth G. RomanziPresident and Chief Executive OfficerFebruary 26, 2020
As filed with the Securities and Exchange Commission on February 26, 2020
UNITED STATES SECURITIES AND EXCHANGE COMMISSION
Washington, D.C. 20549
FORM 10-K (Mark one)
☒ Annual Report Pursuant to Section 13 or 15(d) of the Securities Exchange Act of 1934
For the fiscal year ended December 28, 2019
or ☐ Transition Report Pursuant to Section 13 or 15(d) of the Securities Exchange Act of 1934
For the transition period from to .
Commission file number 001-32316
B&G FOODS, INC. (Exact name of Registrant as specified in its charter)
Delaware (State or other jurisdiction of incorporation or organization)
13-3918742 (I.R.S. Employer
Identification No.) Four Gatehall Drive, Parsippany, New Jersey
(Address of principal executive offices) 07054
(Zip Code)
Registrant’s telephone number, including area code: (973) 401-6500 Securities registered pursuant to Section 12(b) of the Act:
Title of each class Trading Symbol Name of each exchange on which registered Common Stock, par value $0.01 per share BGS New York Stock Exchange
Securities registered pursuant to Section 12(g) of the Act: None Indicate by check mark if the registrant is a well-known seasoned issuer, as defined in Rule 405 of the Securities Act. Yes No Indicate by check mark if the registrant is not required to file reports pursuant to Section 13 or Section 15(d) of the Act. Yes No Indicate by check mark whether the registrant: (1) has filed all reports required to be filed by Section 13 or 15(d) of the Securities
Exchange Act of 1934 during the preceding 12 months (or for such shorter period that the registrant was required to file such reports) and (2) has been subject to such filing requirements for the past 90 days. Yes No
Indicate by check mark whether the registrant has submitted electronically every Interactive Data File required to be submitted pursuant to Rule 405 of Regulation S-T during the preceding 12 months (or for such shorter period that the registrant was required to submit such files). Yes No
Indicate by check mark if disclosure of delinquent filers pursuant to Item 405 of Regulation S-K is not contained herein, and will not be contained, to the best of the registrant’s knowledge, in definitive proxy or information statements incorporated by reference in Part III of this Form 10-K or any amendment to this Form 10-K.
Indicate by check mark whether the registrant is a large accelerated filer, an accelerated filer, a non-accelerated filer, a smaller reporting company or an emerging growth company. See the definitions of “large accelerated filer,” “accelerated filer,” “smaller reporting company” and “emerging growth company” in Rule 12b-2 of the Exchange Act.
Large accelerated filer Accelerated filer Non-accelerated filer Smaller reporting company ☐
Emerging growth company ☐
If an emerging growth company, indicate by check mark if the registrant has elected not to use the extended transition period for complying with any new or revised financial accounting standards provided pursuant to Section 13(a) of the Exchange Act.
Indicate by check mark whether the registrant is a shell company (as defined in Rule 12b-2 of the Act). Yes ☐ No The aggregate market value of the registrant’s outstanding shares of common stock held by non-affiliates of the registrant (assuming for
these purposes, but without conceding, that all executive officers, directors and holders of more than 10% of the registrant’s common stock are affiliates of the registrant) as of June 28, 2019, the last business day of the registrant's most recently completed second fiscal quarter, was $975,141,544 (based on the $20.80 per share closing price of the registrant's common stock on that date as reported on the New York Stock Exchange).
As of February 21, 2020, the registrant had 64,044,649 shares of common stock outstanding. DOCUMENTS INCORPORATED BY REFERENCE
Selected designated portions of the registrant’s definitive proxy statement to be filed on or before April 27, 2020 in connection with the registrant’s 2020 annual meeting of stockholders are incorporated by reference into Part III of this annual report.
B&G FOODS, INC. ANNUAL REPORT ON FORM 10-K
FOR THE FISCAL YEAR ENDED DECEMBER 28, 2019
TABLE OF CONTENTS
Page PART I Item 1. Business . . . . . . . . . . . . . . . . . . . . . . . . . . . . . . . . . . . . . . . . . . . . . . . . . . . . . . . . . . . . . . . . . . . . . . . . . 5 Item 1A. Risk Factors . . . . . . . . . . . . . . . . . . . . . . . . . . . . . . . . . . . . . . . . . . . . . . . . . . . . . . . . . . . . . . . . . . . . . . 13 Item 1B. Unresolved Staff Comments . . . . . . . . . . . . . . . . . . . . . . . . . . . . . . . . . . . . . . . . . . . . . . . . . . . . . . . . . 25 Item 2. Properties . . . . . . . . . . . . . . . . . . . . . . . . . . . . . . . . . . . . . . . . . . . . . . . . . . . . . . . . . . . . . . . . . . . . . . . . 25 Item 3. Legal Proceedings . . . . . . . . . . . . . . . . . . . . . . . . . . . . . . . . . . . . . . . . . . . . . . . . . . . . . . . . . . . . . . . . . 25 Item 4. Mine Safety Disclosures . . . . . . . . . . . . . . . . . . . . . . . . . . . . . . . . . . . . . . . . . . . . . . . . . . . . . . . . . . . . 25 PART II Item 5.
Market for Registrant’s Common Equity, Related Stockholder Matters and Issuer
Purchases of Equity Securities . . . . . . . . . . . . . . . . . . . . . . . . . . . . . . . . . . . . . . . . . . . . . . . . . . . . . . 26
Item 6. Selected Financial Data . . . . . . . . . . . . . . . . . . . . . . . . . . . . . . . . . . . . . . . . . . . . . . . . . . . . . . . . . . . . . 29 Item 7. Management’s Discussion and Analysis of Financial Condition and Results of Operations . . . . . . 34 Item 7A. Quantitative and Qualitative Disclosures About Market Risk . . . . . . . . . . . . . . . . . . . . . . . . . . . . . . 51 Item 8. Financial Statements and Supplementary Data . . . . . . . . . . . . . . . . . . . . . . . . . . . . . . . . . . . . . . . . . . 53 Item 9. Changes in and Disagreements with Accountants on Accounting and Financial Disclosure . . . . . . 103 Item 9A. Controls and Procedures . . . . . . . . . . . . . . . . . . . . . . . . . . . . . . . . . . . . . . . . . . . . . . . . . . . . . . . . . . . . 103 Item 9B. Other Information . . . . . . . . . . . . . . . . . . . . . . . . . . . . . . . . . . . . . . . . . . . . . . . . . . . . . . . . . . . . . . . . . 104 PART III Item 10. Directors, Executive Officers and Corporate Governance . . . . . . . . . . . . . . . . . . . . . . . . . . . . . . . . . 104 Item 11. Executive Compensation . . . . . . . . . . . . . . . . . . . . . . . . . . . . . . . . . . . . . . . . . . . . . . . . . . . . . . . . . . . . 104 Item 12.
Security Ownership of Certain Beneficial Owners and Management and Related Stockholder
Matters . . . . . . . . . . . . . . . . . . . . . . . . . . . . . . . . . . . . . . . . . . . . . . . . . . . . . . . . . . . . . . . . . . . . . . . . . 105
Item 13. Certain Relationships and Related Transactions, and Director Independence . . . . . . . . . . . . . . . . . 105 Item 14. Principal Accountant Fees and Services . . . . . . . . . . . . . . . . . . . . . . . . . . . . . . . . . . . . . . . . . . . . . . . 105 PART IV Item 15. Exhibits, Financial Statement Schedules . . . . . . . . . . . . . . . . . . . . . . . . . . . . . . . . . . . . . . . . . . . . . . . 106 Item 16. Form 10-K Summary . . . . . . . . . . . . . . . . . . . . . . . . . . . . . . . . . . . . . . . . . . . . . . . . . . . . . . . . . . . . . . . 109 Signatures. . . . . . . . . . . . . . . . . . . . . . . . . . . . . . . . . . . . . . . . . . . . . . . . . . . . . . . . . . . . . . . . . . . . . . . . . . . . . . . . . . . 110
- 3 -
Forward-Looking Statements
This report includes forward-looking statements, including, without limitation, the statements under “Management’s Discussion and Analysis of Financial Condition and Results of Operations.” The words “believes,” “belief,” “expects,” “projects,” “intends,” “anticipates,” “assumes,” “could,” “should,” “estimates,” “potential,” “seek,” “predict,” “may,” “will” or “plans” and similar references to future periods are intended to identify forward-looking statements. These forward-looking statements involve known and unknown risks, uncertainties and other factors that may cause our actual results, performance and achievements, or industry results, to be materially different from any future results, performance, or achievements expressed or implied by any forward-looking statements. We believe important factors that could cause actual results to differ materially from our expectations include the following:
• our substantial leverage; • the effects of rising costs for our raw materials, packaging and ingredients; • crude oil prices and their impact on distribution, packaging and energy costs; • our ability to successfully implement sales price increases and cost saving measures to offset any cost
increases; • intense competition, changes in consumer preferences, demand for our products and local economic and
market conditions; • our continued ability to promote brand equity successfully, to anticipate and respond to new consumer
trends, to develop new products and markets, to broaden brand portfolios in order to compete effectively with lower priced products and in markets that are consolidating at the retail and manufacturing levels and to improve productivity;
• the risks associated with the expansion of our business; • our possible inability to identify new acquisitions or to integrate recent or future acquisitions or our failure
to realize anticipated revenue enhancements, cost savings or other synergies; • tax reform and legislation, including the effects of the U.S. Tax Cuts and Jobs Act; • our ability to access the credit markets and our borrowing costs and credit ratings, which may be influenced
by credit markets generally and the credit ratings of our competitors; • unanticipated expenses, including, without limitation, litigation or legal settlement expenses; • the effects of currency movements of the Canadian dollar and the Mexican peso as compared to the U.S.
dollar; • the effects of international trade disputes, tariffs, quotas, and other import or export restrictions on our
international procurement, sales and operations; • future impairments of our goodwill and intangible assets; • our ability to successfully complete the implementation of additional modules and the integration and
operation of a new enterprise resource planning (ERP) system; • our ability to protect information systems against, or effectively respond to, a cybersecurity incident or
other disruption; • our sustainability initiatives and changes to environmental laws and regulations; • other factors that affect the food industry generally, including:
• recalls if products become adulterated or misbranded, liability if product consumption causes injury, ingredient disclosure and labeling laws and regulations and the possibility that consumers could lose confidence in the safety and quality of certain food products;
• competitors’ pricing practices and promotional spending levels; • fluctuations in the level of our customers’ inventories and credit and other business risks related to our
customers operating in a challenging economic and competitive environment; and
- 4 -
• the risks associated with third-party suppliers and co-packers, including the risk that any failure by one or more of our third-party suppliers or co-packers to comply with food safety or other laws and regulations may disrupt our supply of raw materials or certain finished goods products or injure our reputation; and
• other factors discussed elsewhere in this report, including under Part I, Item 1A, “Risk Factors,” and in our other public filings with the SEC.
Developments in any of these areas could cause our results to differ materially from results that have been or may be projected by us or on our behalf.
All forward-looking statements included in this report are based on information available to us on the date of this report. We undertake no obligation to publicly update or revise any forward-looking statement, whether as a result of new information, future events or otherwise. All subsequent written and oral forward-looking statements attributable to us or persons acting on our behalf are expressly qualified in their entirety by the cautionary statements contained in this report.
We caution that the foregoing list of important factors is not exclusive. There may be other factors that may cause our actual results to differ materially from the forward-looking statements in this report, including factors disclosed under the sections of this report titled “Risk Factors” and “Management’s Discussion and Analysis of Financial Condition and Results of Operations.” You should evaluate all forward-looking statements made in this report in the context of these risks and uncertainties. We urge investors not to unduly rely on forward-looking statements contained in this report.
- 5 -
PART I Item 1. Business.
Overview
The terms “B&G Foods,” “our,” “we” and “us,” as used in this report, refer to B&G Foods, Inc. and its wholly owned subsidiaries, except where it is clear that the term refers only to the parent company. Throughout this report, we refer to our fiscal years ended January 2, 2016, December 31, 2016, December 30, 2017, December 29, 2018, December 28, 2019 and January 2, 2021 as “fiscal 2015,” “fiscal 2016,” “fiscal 2017,” “fiscal 2018,” “fiscal 2019” and “fiscal 2020,” respectively. Our fiscal year is the 52 or 53 week reporting period ending on the Saturday closest to December 31. Fiscal 2020 contains 53 weeks and fiscal 2019, 2018, 2017, 2016 and 2015 each contained 52 weeks.
B&G Foods manufactures, sells and distributes a diverse portfolio of branded, high quality, shelf-stable and frozen food and household products across the United States, Canada and Puerto Rico. Many of our branded products have leading regional or national market shares. In general, we position our products to appeal to the consumer desiring a high quality and reasonably priced product. We complement our branded product retail sales with institutional and foodservice sales and private label sales.
B&G Foods, including our subsidiaries and predecessors, has been in business for over 125 years. We were incorporated in Delaware on November 25, 1996 under the name B Companies Holdings Corp. On August 11, 1997, we changed our name to B&G Foods Holdings Corp. On October 14, 2004, B&G Foods, Inc., then our wholly owned subsidiary, was merged with and into us and we were renamed B&G Foods, Inc.
Our company has been built upon a successful track record of both organic and acquisition-related growth. Our goal is to continue to increase sales, profitability and cash flows through organic growth, disciplined acquisitions of complementary branded businesses and new product development. Since 1996, we have successfully acquired and integrated more than 50 brands into our company.
The table below includes some of the acquisitions and the divestiture we have completed in recent years: Date Significant Event May 2019
Acquisition of the Clabber Girl Corporation, including the Clabber Girl, Rumford, Davis, Hearth Club and Royal brands of retail baking powder, baking soda and corn starch, and the Royal brand of foodservice dessert mixes, from Hulman & Company, referred to as the “Clabber Girl acquisition” in the remainder of this report.
October 2018
Divestiture of Pirate Brands, including the Pirate’s Booty, Smart Puffs, and Original Tings brands, which was sold to The Hershey Company, referred to as the “Pirate Brands sale” in the remainder of this report.
July 2018
Acquisition of the McCann’s brand of premium Irish oatmeal from TreeHouse Foods, Inc., referred to as the “McCann’s acquisition” in the remainder of this report.
October 2017
Acquisition of Back to Nature Foods Company, LLC and related entities, including the Back to Nature and SnackWell’s brands, from Brynwood Partners VI L.P., Mondelēz International and certain other sellers, referred to as the “Back to Nature acquisition” in the remainder of this report.
December 2016
Acquisition of Victoria Fine Foods, LLC, and a related entity, from Huron Capital Partners and certain other sellers, referred to as the “Victoria acquisition” in the remainder of this report.
November 2016
Acquisition of the spices & seasonings business of ACH Food Companies, Inc., including the Spice Islands, Tone’s, Durkee and Weber brands, referred to as the “spices & seasonings acquisition” in the remainder of this report.
November 2015
Acquisition of the Green Giant and Le Sueur brands from General Mills, Inc., referred to as the “Green Giant acquisition” in the remainder of this report.
July 2015
Acquisition of Spartan Foods of America, Inc., and related entities, including the Mama Mary’s brand, from Linsalata Capital Partners and certain other sellers, referred to as the “Mama Mary’s acquisition” in the remainder of this report.
- 6 -
Products and Markets
The following is a brief description of some of our brands and product lines:
The Green Giant and Le Sueur brands trace their roots to Le Sueur, Minnesota in 1903, and the Minnesota Valley Canning Company. For more than 100 years, fresh and great-tasting Green Giant and Le Sueur vegetables have been grown and picked at the peak of perfection in the Valley of the Jolly Green Giant. In the remainder of this report, we generally refer to the Green Giant and Le Sueur brands collectively as the “Green Giant brand.”
The Ortega brand has been in existence since 1897; its products span the shelf-stable Mexican food segment including taco shells, tortillas, seasonings, dinner kits, taco sauces, peppers, refried beans, salsas and related food products.
The Maple Grove Farms of Vermont brand, which originated in 1915, is one of the leading brands of pure maple syrup sold in the United States. Other products under the Maple Grove Farms of Vermont label include a line of gourmet salad dressings, sugar free syrups, marinades, fruit syrups, confections, pancake mixes and organic products.
The Cream of Wheat brand was introduced in 1893 and is among the leading brands and one of the most trusted and widely recognized brands of hot cereals sold in the United States. Cream of Wheat is available in Original, Whole Grain and Maple Brown Sugar stove top, and also in instant packets of Original and other flavors. We also offer Cream of Rice, a gluten-free, rice-based hot cereal.
The Mrs. Dash brand, which was introduced in 1983 as the original brand in salt-free seasonings, is available in more than a dozen blends. In 2005, the leading brand in salt-free seasonings introduced salt-free marinades. Mrs. Dash’s brand essence, “Salt-Free, Flavor-Full,” resonates with consumers and underscores the brand’s commitment to provide healthy products that fulfill consumers’ expectations for taste.
Clabber Girl, which originated as a wholesale grocery company dating back to the 1850’s, is a leader in baking products, including baking powder, baking soda and corn starch. In addition to Clabber Girl, the number one retail baking powder brand, product offerings also include the Rumford, Davis, Hearth Club and Royal brands of retail baking powder, baking soda and corn starch, and the Royal brand of foodservice dessert mixes.
Back to Nature has been a pioneer in the better-for-you snack foods category and it is a leading cookie and cracker brand in the category. The Back to Nature brand’s product offerings include Non-GMO Project Verified, organic and gluten free products.
Victoria Fine Foods is a Brooklyn-based business founded in 1929. The Victoria brand offers a variety of premium pasta and specialty sauces, savory condiments and tasty gourmet spreads. Using traditional cooking methods, Victoria sauces are slow kettle-cooked in small batches to ensure rich flavor and a homemade taste. Committed to its values of quality, honesty, authenticity and community, Victoria believes that Ingredients Come First.
The Bear Creek Country Kitchens brand is the leading brand of hearty dry soups in the United States. Bear Creek Country Kitchens also offers a line of savory pasta dishes and hearty rice dishes.
The Weber brand of seasonings and other flavor enhancers was introduced in 2006 under a licensing agreement with Weber-Stephen Products LLC, maker of the popular Weber grills. Under the Weber brand, we offer a wide range of grilling seasoning blends, rubs, marinades, sprays and sauces.
The Las Palmas brand originated in 1922 and primarily includes authentic Mexican enchilada sauce, chili sauce and various pepper products.
The New York Style brand was created in 1985 and includes Original Bagel Crisps, Pita Chips and Panetini Italian Toast.
The Spice Islands brand, established in San Francisco in 1941, is a leading premium spices and extracts brand offering a diverse line of high quality products including spices, seasonings, dried herbs, extracts, flavorings and sauce blends. The brand recently expanded into organic products.
The Polaner brand was introduced in 1880 and is comprised of a broad array of fruit-based spreads as well as jarred wet spices such as chopped garlic and oregano. Polaner All Fruit is a leading national brand of fruit-juice sweetened fruit spread. The spreads are available in more than a dozen flavors. Polaner Sugar Free preserves are the second leading brand of sugar free preserves nationally.
- 7 -
The Mama Mary’s brand was introduced in 1986 and is a leading brand of shelf-stable pizza crusts. Mama Mary’s also offers pizza sauces and premium gourmet pepperoni slices.
The Bloch & Guggenheimer (B&G) brand originated in 1889, and its pickle, pepper and relish products are a leading brand in the New York metropolitan area. This line consists of shelf-stable pickles, peppers, relishes, olives and other related specialty items.
The Underwood brand’s “Underwood Devil” logo, which was registered in 1870, is believed to be the oldest registered trademark still in use for a prepackaged food product in the United States. Underwood meat spreads, which were introduced in the late 1860s, include deviled ham, white-meat chicken, roast beef, corned beef and liverwurst.
The Tone’s brand started as a family business in 1873 and was responsible for many of the early advancements in the spice industry. The Tone’s brand sells predominantly in the club channel while also servicing traditional grocery.
The Ac’cent brand was introduced in 1947 as a flavor enhancer for meat preparation and is generally used on beef, poultry, fish and vegetables. We believe that Ac’cent is positioned as a unique flavor enhancer that provides food with the “umami” flavor sensation.
The B&M brand was introduced in 1927 and is the original brand of brick-oven baked beans and remains one of the very few authentic baked beans. The B&M line includes a variety of baked beans and brown bread. The B&M brand currently has a leading market share in the New England region.
The Grandma’s brand of molasses, which was introduced in 1890, is the leading brand of premium-quality molasses sold in the United States. Grandma’s molasses products are offered in two distinct styles: Grandma’s Original Molasses and Grandma’s Robust Molasses.
The Trappey’s brand, which was introduced in 1898, has a Louisiana heritage. Trappey’s products fall into two major categories—high quality peppers and hot sauces, including Trappey’s Red Devil.
The Spring Tree brand originated in 1976 in Brattleboro, Vermont, and consists of pure maple syrup and sugar free syrup.
The Durkee brand was established in 1850 and, like our Tone’s brand, started as a family business and was an early leader in the spice industry.
The McCann’s brand has been in existence since 1800 and offers classic traditional steel cut Irish oatmeal as well as convenience-oriented oatmeal products.
The Don Pepino and Sclafani brands originated in 1955 and 1900, respectively, and primarily include pizza and spaghetti sauces, whole and crushed tomatoes and tomato puree.
The SnackWell’s brand of reduced fat snacks originated in 1992. SnackWell’s offerings include a variety of delicious reduced fat products such as its signature Devil’s Food Cookie Cakes and peanut-free treats such as its tasty Vanilla Creme Sandwich Cookies.
The TrueNorth brand was introduced in 2008. TrueNorth nut cluster snacks combine freshly roasted nuts, a dash of sea salt and just a hint of sweetness. TrueNorth varieties include almond pecan crunch, chocolate nut crunch and cashew crunch.
The Emeril’s brand was introduced in 2000 under a licensing agreement with celebrity chef Emeril Lagasse. We offer a line of pasta sauces, seasonings, cooking stocks, mustards and cooking sprays under the Emeril’s brand name.
The Cary’s brand originated in 1904 and is the oldest brand of pure maple syrup in the United States. Cary’s also offers sugar free syrup.
The Joan of Arc brand, which originated in 1895, includes a full range of canned beans including kidney, chili and other varieties.
The Baker’s Joy brand was introduced in 1982 and is the original brand of no-stick baking spray with flour. Baker’s Joy’s product proposition has been to “generate a perfect release from the pan every time,” making baking easier, faster and more successful for everyday bakers.
- 8 -
The Static Guard brand, the number one brand name in static elimination sprays, created the anti-static spray category when it was launched in 1978 to fulfill a previously unmet consumer need. The brand’s ability to consistently deliver on its promise to “instantly eliminate static cling” has resulted in a loyal consumer following.
The Regina brand, which has been in existence since 1949, includes vinegars and cooking wines. Regina products are most commonly used in the preparation of salad dressings as well as in a variety of recipe applications, including sauces, marinades and soups.
The Wright’s brand was introduced in 1895 and is a seasoning that reproduces the flavor and aroma of pit smoking in meats, chicken and fish. Wright’s is offered in three flavors: Hickory, Mesquite and Applewood.
The Sugar Twin brand was developed in 1968 and is a calorie free sugar substitute.
The Old London brand was created in 1932 and offers a wide variety of flavors available in melba toasts, melba rounds and other snacks. Old London also markets specialty snacks under the Devonsheer and JJ Flats brand names.
The Brer Rabbit brand has been in existence since 1907 and currently offers mild and full-flavored molasses as well as blackstrap molasses. Mild molasses is designed for table use and full-flavored molasses is typically used in baking, barbeque sauces and as a breakfast syrup.
The Sa-són brand was introduced in 1947 as a flavor enhancer used primarily for Puerto Rican and Hispanic food preparation. The product is generally used on beef, poultry, fish and vegetables. The brand’s flavor enhancer is offered in four flavors: Original, Coriander and Achiote, Garlic and Onion, and Tomato. We also offer reduced sodium versions of Sa-són.
The New York Flatbreads brand is a line of thin, crispy, flavorful crispbread that is available in several toppings.
The Vermont Maid brand has been in existence since 1919 and offers maple-flavored syrups. Vermont Maid syrup is available in regular, sugar-free and sugar-free butter varieties.
The Molly McButter brand created the butter-flavored sprinkles category in 1987. Molly McButter is available in butter and cheese flavors.
The Canoleo brand offers an all-purpose margarine used for spreading, cooking and baking.
Food Industry
The food industry is one of the United States’ largest industries. Historically, it has been characterized by relatively stable sales growth, based largely on price and population increases. In recent years, however, many traditional center of store grocery brands in the industry have often experienced flat to modestly declining sales. Over the past decade or so, the retail side of the food industry has seen a continuing shift of sales to alternate food outlets such as supercenters, warehouse clubs, organic and “natural” food stores, dollar stores, drug stores and e-tailers. Among other things, this shift has caused consolidation of traditional grocery chains into larger entities, often spanning the country under varying banner names. Consolidation has increased the importance of having a number one or two brand within a category, be that position national or regional. At the same time, this shift has also introduced many alternatives to traditional grocery chains. A broad sales and distribution infrastructure has also become critical for food companies, allowing them to reach all outlets selling food to consumers and expanding their growth opportunities.
Sales, Marketing and Distribution
Overview. We sell, market and distribute our products through a multiple-channel sales, marketing and distribution system to all major U.S. food channels, including sales and shipments to supermarkets, mass merchants, warehouse clubs, wholesalers, foodservice distributors and direct accounts, specialty food distributors, military commissaries and non-food outlets such as drug, dollar store chains and e-tailers. Certain of our brands, including Green Giant, Cream of Wheat, Back to Nature, Ac’cent, Crock Pot® seasoning mixes, Underwood, Polaner, Static Guard, Mrs. Dash, New York Style, Sugar Twin and Victoria are also distributed to similar food channels in Canada. We sell, market and distribute our household brand, Static Guard, through the same sales, marketing and distribution system to many of the same customers who buy our food products as well as to other household product retailers and distributors.
- 9 -
We sell our products primarily through broker sales networks to supermarket chains, foodservice outlets, mass merchants, warehouse clubs, non-food outlets and specialty distributors. The broker sales network handles the sale of our products at the retail level.
Sales. Our sales organization is aligned by distribution channels and consists of regional sales managers, key account managers and sales persons. Regional sales managers sell our products nationwide through national and regional brokers, with separate organizations focusing on foodservice, grocery chain accounts and special markets. Our sales managers coordinate our broker sales efforts, make key account calls with buyers or distributors and supervise broker retail coverage of the products at the store level.
Our sales strategy is centered on individual brands. We allocate promotional spending for each of our brands and our regional sales managers coordinate promotions with customers. Additionally, our marketing department works in conjunction with the sales department to coordinate special account activities and marketing support, such as couponing, public relations and media advertising.
We have a national sales force that is capable of supporting our current brands and quickly integrating and supporting any newly acquired brands.
Marketing. Our marketing organization is aligned by brand and is responsible for the strategic planning for each of our brands. We focus on deploying promotional dollars where we believe the spending will have the greatest impact on sales. Marketing and trade spending support, on a national basis, typically consists of advertising trade promotions, coupons and cross-promotions with supporting products. Radio, internet, social media and limited television advertising supplement this activity.
Distribution. We distribute our products through a multiple-channel system that covers every class of customer nationwide. Due to the different demands of distribution for frozen and shelf-stable products, we maintain separate distribution systems.
Our shelf-stable distribution network consists of five primary locations, four of which are leased by us and are operated for us by a third party logistics provider, and one that is located at an owned manufacturing facility and is operated by us. In Canada, Mexico and from time to time in the United States we also use public warehouse and distribution facilities for our shelf-stable products.
Our frozen distribution network consists of seven primary locations, which are owned and operated by third party logistics providers.
We believe that our distribution systems for shelf-stable and frozen products have sufficient capacity to accommodate incremental product volume. See Item 2, “Properties” for a listing of our owned and leased distribution centers and warehouses. During 2019 and 2018, we were negatively impacted by industry-wide increases in the cost of distribution, primarily driven by freight costs. Despite higher rates for freight in 2019, we were able to offset these increases, in part as a result of our 2019 pricing strategy that included both list price increases as well as a trade spend optimization program. Separately, we also benefited in 2019 from our distribution re-alignment efforts which helped to optimize both our shelf-stable and our frozen distribution networks.
We expect freight rates to remain elevated in 2020. To the extent that we are unable to offset present and future cost increases, our operating results will be negatively impacted.
Customers
Our top ten customers accounted for approximately 59.1% of our net sales and approximately 62.3% of our end of the year receivables for fiscal 2019. Other than Walmart, which accounted for approximately 25.6% of our fiscal 2019 net sales, no single customer accounted for 10.0% or more of our fiscal 2019 net sales. Other than Walmart, which accounted for approximately 29.1% of our receivables as of December 28, 2019, no single customer accounted for more than 10.0% of our receivables as of December 28, 2019. During fiscal 2019, 2018 and 2017, our net sales to foreign countries represented approximately 7.7%, 7.3% and 6.3%, respectively, of our total net sales. Our foreign sales are primarily to customers in Canada.
Seasonality
Sales of a number of our products tend to be seasonal and may be influenced by holidays, changes in seasons/weather or certain other annual events. In general, our sales are higher in the first and fourth quarters.
- 10 -
We purchase most of the produce used to make our frozen and shelf-stable canned vegetables, pickles, relishes, peppers, tomatoes and other related specialty items during the months of June through October, and we generally purchase the majority of our maple syrup requirements during the months of April through August. Consequently, our liquidity needs are greatest during these periods.
Competition
We face competition in each of our product lines. Numerous brands and products compete for shelf space and sales, with competition based primarily on product quality, convenience, price, trade promotion, consumer promotion, brand recognition and loyalty, customer service, advertising and other activities and the ability to identify and satisfy emerging consumer preferences. We compete with numerous companies of varying sizes, including divisions or subsidiaries of larger companies. Many of these competitors have multiple product lines, substantially greater financial and other resources and may have lower fixed costs and/or be substantially less leveraged than we are. Our ability to grow our business could be impacted by the relative effectiveness of, and competitive response to, our product initiatives, product innovation, advertising and promotional activities. In addition, from time to time, we experience margin pressure in certain markets as a result of competitors’ pricing practices.
Our products compete not only against other brands in their respective product categories, but also against products in similar or related product categories. For example, our shelf-stable pickles compete not only with other brands of shelf-stable pickles, but also with pickle products found in the refrigerated sections of grocery stores, and all our brands compete against private label products to varying degrees.
Raw Materials
We purchase raw materials, including agricultural products, meat, poultry, flour, other raw materials, ingredients and packaging materials from growers, commodity processors, other food companies and packaging suppliers located in U.S. and foreign locations. The principal raw materials for our products include corn, peas, broccoli, beans, pepper, garlic and other spices, maple syrup, wheat, corn, nuts, cheese, fruits, beans, tomatoes, peppers, meat, sugar, concentrates, molasses and corn sweeteners. Vegetables for the Green Giant brand are primarily purchased under dedicated acreage supply contracts from a number of growers prior to each growing season with the remaining demand being sourced directly from third parties. We purchase certain other agricultural raw materials in bulk or pursuant to short-term supply contracts. Most of our agricultural products are purchased between April 1 and October 31. We generally source pepper, garlic and other spices and herbs from locations other than the United States. We purchase the majority of our maple syrup from Canada. We also use packaging materials, particularly glass jars, cans, cardboard and plastic containers. The profitability of our business relies in substantial part on the prices we and our co-packers pay for these raw materials and packaging materials, which can fluctuate due to a number of factors, including changes in crop size, national, state and local government sponsored agricultural programs, export demand, currency exchange rates, natural disasters, weather conditions during the growing and harvesting seasons, water supply, general growing conditions, the effect of insects, plant diseases and fungi, and glass, metal and plastic prices.
Fluctuations in commodity prices can lead to retail price volatility and intensive price competition, and can influence consumer and trade buying patterns.
The cost of labor, manufacturing, energy, fuel, packaging materials and other costs related to the production and distribution of our food products can from time to time increase significantly and unexpectedly. We attempt to manage these risks by entering into short-term supply contracts and advance commodities purchase agreements, implementing cost saving measures and raising sales prices. During the past three years, our cost saving measures and sales price increases have not been sufficient to fully offset increases to our raw material, ingredient and packaging costs. To the extent we are unable to offset present and future cost increases, our operating results will be negatively impacted.
Production
Manufacturing. We operate eleven manufacturing facilities for our products. See Item 2, “Properties” for a listing of our manufacturing facilities.
- 11 -
Co-Packing Arrangements. In addition to our own manufacturing facilities, we source a significant portion of our products under “co-packing” arrangements, a common industry practice in which manufacturing is outsourced to other companies. We regularly evaluate our co-packing arrangements to ensure the most cost-effective manufacturing of our products and to utilize company-owned manufacturing facilities most effectively. Third parties located in U.S. and foreign locations produce our Back to Nature, Baker’s Joy, Bear Creek Country Kitchens, Canoleo, Cream of Rice, Crock Pot, Green Giant, JJ Flats, Joan of Arc, Le Sueur, MacDonald’s, McCann’s, New York Flatbreads, Regina, SnackWell’s, Spring Tree, Static Guard, Sugar Twin and TrueNorth products and certain B&G, Cary’s, Cream of Wheat, Emeril’s, Las Palmas and Ortega products under co-packing agreements or purchase orders. Each of our co-packers produces products for other companies as well. We believe that there are alternative sources of co-packing production readily available for the majority of our products, although we may experience short-term disturbances in our operations if we are required to change our co-packing arrangements unexpectedly.
Trademarks and Licensing Agreements
Trademarks. We consider our trademarks, in the aggregate, to be material to our business. We protect our trademarks by registration in the United States, Canada and in other countries where we sell our products. We also oppose any infringement in key markets. Trademark protection continues in some countries for as long as the mark is used and in other countries for as long as it is registered. Registrations generally are for renewable, fixed terms. Examples of our trademarks and registered trademarks include Ac’cent, Back to Nature, B&G, B&G Sandwich Toppers, B&M, Baker’s Joy, Bear Creek Country Kitchens, Brer Rabbit, Canoleo, Clabber Girl, Cary’s, Cream of Rice, Cream of Wheat, Devonsheer, Don Pepino, Durkee, Emeril’s, Grandma’s, Green Giant, JJ Flats, Joan of Arc, Las Palmas, Le Sueur, MacDonald’s, Mama Mary’s, Maple Grove Farms of Vermont, McCann’s, Molly McButter, Mrs. Dash, New York Flatbreads, New York Style, Old London, Ortega, Polaner, Regina, Sa-són, Sclafani SnackWell’s, Spice Islands, Spring Tree, Static Guard, Sugar Twin, Tone’s, Trappey’s, TrueNorth, Underwood, Vermont Maid, Victoria, Weber and Wright’s.
Inbound License Agreements. From time to time we enter into inbound licensing agreements. For example, we sell our Emeril’s brand products pursuant to a license agreement with Marquee Brands, Cream of Wheat Cinnabon®, a co-branded product, pursuant to a licensing agreement with Cinnabon, Inc., Crock Pot seasoning mixes pursuant to a licensing agreement with Sunbeam Products, Inc. dba Jarden Consumer Solutions, Weber seasonings and other flavor enhancers pursuant to a licensing agreement with Weber-Stephen Products LLC.
Outbound License Agreements. We also from time to time enter into outbound license agreements for our trademarks and other intellectual property. For example, the Green Giant trademark is licensed to third parties for use in connection with their sale of fresh produce in the United States and Europe. We also license the Green Giant name and related intellectual property to General Mills for use with its sale of frozen and shelf stable products in parts of Europe, Asia and in various other locations outside of the United States and Canada.
Employees and Labor Relations
As of December 28, 2019, our workforce consisted of 2,899 employees. Of that total, 2,534 employees were engaged in manufacturing, 133 were engaged in marketing and sales, 139 were engaged in warehouse and distribution and 93 were engaged in administration. Approximately 62.5% of our employees, located at six facilities in the United States and one facility in Mexico, are covered by collective bargaining agreements. Agreements covering employees at five of our facilities in the United States, which vary in term depending on the location, expire on March 27, 2020 (Terre Haute, Indiana; Chauffeurs, Teamsters, Warehousemen and Helpers Union, Local No. 135); March 31, 2020 (Roseland, New Jersey; International Brotherhood of Teamsters, Chauffeurs, Warehousemen & Helpers of America, Local No. 863); April 5, 2020 (Ankeny, Iowa; International Brotherhood of Teamsters, Local No. 238); March 27, 2021 (Stoughton, Wisconsin; Drivers, Salesmen, Warehousemen, Milk Processors, Cannery, Dairy Employees and Helpers Union, Local No. 695); and April 30, 2022 (Portland, Maine; Bakery, Confectionery, Tobacco Workers and Grain Millers International Union, AFL CIO, Local No. 334).
- 12 -
The agreement covering employees at a sixth facility in Brooklyn, New York expired on December 31, 2019. During January 2020, we reached an agreement in principle with the United Food and Commercial Workers Union, Local No. 342, to extend the collective bargaining agreement for an additional four-year period ending December 21, 2024. The new agreement has been ratified by the union employees at our Brooklyn facility. There are two unions representing employees at our facility in Mexico, (1) the Industrial Union of Stevedore Workers, Cargo Transport Operators and Similar from the Mexican Republic and (2) the Union of Agriculture Workers at the Service of the Region. Our collective bargaining agreements with these two unions do not expire; however, certain terms of the agreements must be reviewed periodically.
As noted above, three of our collective bargaining agreements, covering approximately 100 employees at our Terre Haute facility, approximately 50 employees at our Roseland facility and approximately 275 employees at our Ankeny facility, expire in the next twelve months. While we believe that our relations with our union employees are in general good, we cannot assure you that we will be able to negotiate new collective bargaining agreements for our Terre Haute, Roseland and Ankeny facilities on terms satisfactory to us, or at all, and without production interruptions, including labor stoppages. At this time, however, management does not expect that the outcome of these negotiations will have a material adverse impact on our business, financial condition or results of operations.
Government Regulation
As a manufacturer and marketer of food and household products, our operations are subject to extensive regulation by the United States Food and Drug Administration (FDA), the United States Department of Agriculture (USDA), the Federal Trade Commission (FTC), the Consumer Product Safety Commission (CPSC), the United States Department of Labor, the Environmental Protection Agency and various other federal, state, local and foreign authorities (including government authorities in Canada and Mexico) regarding the manufacturing, processing, packaging, storage, labeling, sale and distribution of our products and the health and safety of our employees. Our manufacturing facilities and products are subject to periodic inspection by federal, state, local and foreign authorities. In addition, our meat processing operation in Portland, Maine is subject to daily inspection by the USDA.
We are subject to the Food, Drug and Cosmetic Act and the Food Safety Modernization Act and the regulations promulgated thereunder by the FDA. This comprehensive regulatory program governs, among other things, the manufacturing, composition and ingredients, labeling, packaging and safety of food. We are also subject to the U.S. Bio-Terrorism Act of 2002 which imposes on us import and export regulations. Under the Bio-Terrorism Act we are required, among other things, to provide specific information about the food products we ship into the United States and to register our manufacturing, warehouse and distribution facilities with the FDA.
We believe that we are currently in substantial compliance with all material governmental laws and regulations and maintain all material permits and licenses relating to our operations. Nevertheless, there can be no assurance that we are in full compliance with all such laws and regulations or that we will be able to comply with any future laws and regulations in a cost-effective manner. Failure by us to comply with applicable laws and regulations could subject us to civil remedies, including fines, injunctions, recalls or seizures, as well as potential criminal sanctions, all of which could have a material adverse effect on our business, consolidated financial condition, results of operations or liquidity.
Environmental Matters
Environmental Sustainability. As part of our commitment to being a good corporate citizen, we consider environmental sustainability to be an important strategic focus area. For instance, our manufacturing operations have a variety of initiatives in place to reduce energy usage, conserve water, improve wastewater management, reduce packaging and where possible use recycled and recyclable packaging. We continue to evaluate and modify our manufacturing and other processes on an ongoing basis to mitigate risk and further reduce our impact on the environment, conserve water and reduce waste.
- 13 -
Environmental Laws and Regulations. We are also subject to environmental laws and regulations in the normal course of business. We have not made any material expenditures during the last three fiscal years in order to comply with environmental laws or regulations. Based on our experience to date, we believe that the future cost of compliance with existing environmental laws and regulations (and liability for known environmental conditions) will not have a material adverse effect on our business, consolidated financial condition, results of operations or liquidity. However, we cannot predict what environmental laws or regulations will be enacted in the future or how existing or future laws or regulations will be enforced, administered or interpreted, nor can we predict the amount of future expenditures that may be required in order to comply with such environmental laws or regulations or to respond to such environmental claims.
Available Information
Under the Securities Exchange Act of 1934, as amended, we are required to file with or furnish to the Securities and Exchange Commission (SEC) annual, quarterly and current reports, proxy and information statements and other information. The SEC maintains an internet site at http://www.sec.gov that contains reports, proxy and information statements, and other information regarding issuers that file electronically with the SEC. We file electronically with the SEC.
We make available, free of charge, through the investor relations section of our website, our reports on Forms 10-K, 10-Q and 8-K, and amendments to those reports, filed with or furnished to the SEC as soon as reasonably practicable after they are filed or furnished to the SEC. The address for the investor relations section of our website is https://www.bgfoods.com/investor-relations.
The full text of the charters for each of the audit, compensation, nominating and governance, and risk committees of our board of directors as well as our Code of Business Conduct and Ethics is available at the investor relations section of our website, https://www.bgfoods.com/investor-relations/governance/documents. Our Code of Business Conduct and Ethics applies to all of our employees, officers and directors, including our chief executive officer, chief financial officer and chief accounting officer. We intend to disclose any amendment to, or waiver from, a provision of the Code of Business Conduct and Ethics that applies to our chief executive officer, chief financial officer or chief accounting officer in the investor relations section of our website.
The information contained on our website is not part of, and is not incorporated in, this or any other report we file with or furnish to the SEC.
Item 1A. Risk Factors.
Any investment in our company will be subject to risks inherent to our business. Before making an investment decision, investors should carefully consider the risks described below together with all of the other information included in this report. The risks and uncertainties described below are not the only ones facing our company. Additional risks and uncertainties that we are not aware of or focused on or that we currently deem immaterial may also impair our business operations. This report is qualified in its entirety by these risk factors.
Any of the following risks could materially and adversely affect our business, consolidated financial condition, results of operations or liquidity. In that case, holders of our securities may lose all or part of their investment.
Risks Specific to Our Company
The packaged food industry is highly competitive.
The packaged food industry is highly competitive. Numerous brands and products, including private label products, compete for shelf space and sales, with competition based primarily on product quality, convenience, price, trade promotion, brand recognition and loyalty, customer service, effective consumer advertising and promotional activities and the ability to identify and satisfy emerging consumer preferences. We compete with a significant number of companies of varying sizes, including divisions or subsidiaries of larger companies. Many of these competitors have multiple product lines, substantially greater financial and other resources available to them and may have lower fixed costs and/or are substantially less leveraged than our company. If we are unable to continue to compete successfully with these companies or if competitive pressures or other factors cause our products to lose market share or result in significant price erosion, our business, consolidated financial condition, results of operations or liquidity could be materially and adversely affected.

- 14 -
We may be unable to maintain our profitability in the face of a consolidating retail environment.
Our largest customer, Walmart, accounted for approximately 25.6% of our fiscal 2019 net sales, and our ten largest customers together accounted for approximately 59.1% of our fiscal 2019 net sales. As the retail grocery trade continues to consolidate and our retail customers grow larger and become more sophisticated, our retail customers may demand lower pricing and increased promotional programs. Further, these customers are reducing their inventories and increasing their emphasis on products that hold either the number one or number two market position and private label products. If we fail to use our sales and marketing expertise to maintain our category leadership positions to respond to these trends, or if we lower our prices or increase promotional support of our products and are unable to increase the volume of our products sold, our profitability and financial condition may be adversely affected.
We are vulnerable to decreases in the supply and increases in the price of raw materials and labor, manufacturing, distribution and other costs, and we may not be able to offset increasing costs by increasing prices to our customers.
We purchase agricultural products, including vegetables and spices and seasonings, meat, poultry, other raw materials, ingredients and packaging materials from growers, commodity processors, other food companies and packaging manufacturers. Raw materials, ingredients and packaging materials are subject to increases in price attributable to a number of factors, including changes in crop size, federal and state agricultural programs, export demand, currency exchange rates, energy and fuel costs, water supply, weather conditions during the growing and harvesting seasons, insects, plant diseases and fungi, and glass, metal and plastic prices. Fluctuations in commodity prices can lead to retail price volatility and intensive price competition, and can influence consumer and trade buying patterns. The cost of labor, manufacturing, energy, fuel, packaging materials and other costs related to the production and distribution of our products can from time to time increase significantly and unexpectedly. We attempt to manage these risks by entering into short-term supply contracts and advance commodities purchase agreements from time to time, by implementing cost saving measures and by raising sales prices. During the past three years, our cost saving measures and sales price increases have not been sufficient to fully offset increases to our raw material, ingredient, packaging and distribution costs. To the extent we are unable to offset present and future cost increases, our operating results will be negatively impacted.
We may be unable to offset any reduction in net sales in our mature food product categories through an increase in trade spending for these categories or an increase in net sales in other categories.
Most of our food product categories are mature and certain categories have experienced declining consumption rates from time to time. If consumption rates and sales in our mature food product categories decline, our revenue and operating income may be adversely affected, and we may not be able to offset this decrease in business with increased trade spending or an increase in sales or profitability of other products and product categories.
We may have difficulties integrating acquisitions or identifying new acquisitions.
A major part of our strategy is to grow through acquisitions. We completed the Clabber Girl acquisition in May 2019, the McCann’s acquisition in July 2018 and the Back to Nature acquisition in October 2017 and we expect to pursue additional acquisitions of food product lines and businesses. However, we may be unable to identify and consummate additional acquisitions or may be unable to successfully integrate and manage the product lines or businesses that we have recently acquired or may acquire in the future. In addition, we may be unable to achieve a substantial portion of any anticipated cost savings from acquisitions or other anticipated benefits in the timeframe we anticipate, or at all. Moreover, any acquired product lines or businesses may require a greater than anticipated amount of trade, promotional and capital spending. Acquisitions involve numerous risks, including difficulties in the assimilation of the operations, technologies, services and products of the acquired companies, personnel turnover and the diversion of management’s attention from other business concerns. Any inability by us to integrate and manage any product lines or businesses that we have recently acquired or may acquire in the future in a timely and efficient manner, any inability to achieve a substantial portion of any anticipated cost savings or other anticipated benefits from these acquisitions in the time frame we anticipate or any unanticipated required increases in trade, promotional or capital spending could adversely affect our business, consolidated financial condition, results of operations or liquidity. Moreover, future acquisitions by us could result in our incurring substantial additional indebtedness, being exposed to contingent liabilities or incurring the impairment of goodwill and other intangible assets, all of which could adversely affect our financial condition, results of operations and liquidity.
- 15 -
We have substantial indebtedness, which could restrict our ability to pay dividends and impact our financing options and liquidity position.
At December 28, 2019, we had total long-term indebtedness of $1,900.0 million (before debt discount), including $450.0 million principal amount of senior secured indebtedness and $1,450.0 million principal amount of senior unsecured indebtedness. Our ability to pay dividends is subject to contractual restrictions contained in the instruments governing our indebtedness. Although our credit agreement and the indentures governing our senior notes (which we refer to as the senior notes indentures) contain covenants that restrict our ability to incur debt, as long as we meet these covenants we will be able to incur additional indebtedness. The degree to which we are leveraged on a consolidated basis could have important consequences to the holders of our securities, including:
• our ability in the future to obtain additional financing for working capital, capital expenditures or acquisitions may be limited;
• we may not be able to refinance our indebtedness on terms acceptable to us or at all; • a significant portion of our cash flow is likely to be dedicated to the payment of interest on our
indebtedness, thereby reducing funds available for future operations, capital expenditures, acquisitions and/or dividends on our common stock; and
• we may be more vulnerable to economic downturns and be limited in our ability to withstand competitive pressures.
We are subject to restrictive debt covenants and other requirements related to our debt that limit our business flexibility by imposing operating and financial restrictions on our operations.
The agreements governing our indebtedness impose significant operating and financial restrictions on us. These restrictions prohibit or limit, among other things:
• the incurrence of additional indebtedness and the issuance of certain preferred stock or redeemable capital stock;
• the payment of dividends on, and purchase or redemption of, capital stock; • a number of restricted payments, including investments; • specified sales of assets; • specified transactions with affiliates; • the creation of certain types of liens; • consolidations, mergers and transfers of all or substantially all of our assets; and • entry into certain sale and leaseback transactions.
Our credit agreement requires us to maintain specified financial ratios and satisfy financial condition tests, including, without limitation, a maximum leverage ratio and a minimum interest coverage ratio.
Our ability to comply with the ratios or tests may be affected by events beyond our control, including prevailing economic, financial and industry conditions. A breach of any of these covenants, or failure to meet or maintain ratios or tests could result in a default under our credit agreement and/or our senior notes indentures. Certain events of default under our credit agreement and our senior notes indentures would prohibit us from paying dividends on our common stock. In addition, upon the occurrence of an event of default under our credit agreement or our senior notes indentures, the lenders could elect to declare all amounts outstanding under the credit agreement and the senior notes, together with accrued interest, to be immediately due and payable. If we were unable to repay those amounts, the credit agreement lenders could proceed against the security granted to them to secure that indebtedness. If the lenders accelerate the payment of the indebtedness, our assets may not be sufficient to repay in full this indebtedness and our other indebtedness.
To service our indebtedness, we require a significant amount of cash. Our ability to generate cash depends on many factors beyond our control.
Our ability to make interest payments on and to refinance our indebtedness, and to fund planned capital expenditures and potential acquisitions depends on our ability to generate cash flow from operations in the future. This
- 16 -
ability, to a certain extent, is subject to general economic, financial, competitive, legislative, regulatory and other factors that are beyond our control.
A significant portion of our cash flow from operations is dedicated to servicing our debt requirements. In addition, in accordance with our current dividend policy we intend to continue distributing a significant portion of any remaining cash flow to our stockholders as dividends.
Our ability to continue to expand our business is, to a certain extent, dependent upon our ability to borrow funds under our credit agreement and to obtain other third-party financing, including through the issuance and sale of additional debt or equity securities.
Financial market conditions may impede our access to, or increase the cost of, financing for acquisitions.
Any future financial market disruptions or tightening of the credit markets, may make it more difficult for us to obtain financing for acquisitions or increase the cost of obtaining financing. In addition, our borrowing costs can be affected by short and long-term debt ratings assigned by independent rating agencies that are based, in significant part, on our performance as measured by credit metrics such as interest coverage and leverage ratios. A decrease in these ratings could increase our cost of borrowing or make it more difficult for us to obtain financing.
Future disruptions in the credit markets or other factors, could impair our ability to refinance our debt upon terms acceptable to us or at all.
Our $700.0 million revolving credit facility matures on November 21, 2022, our $900.0 million of 5.25% senior notes due 2025 mature on April 1, 2025, our $450.0 million of tranche B term loans mature on October 10, 2026 and our $550.0 million of 5.25% senior notes due 2027 mature on September 15, 2027. Our ability to raise debt or equity capital in the public or private markets in order to effect a refinancing of our debt at or prior to maturity could be impaired by various factors, including factors beyond our control. For example, in recent years U.S. credit markets experienced significant dislocations and liquidity disruptions that caused the spreads on prospective debt financings to widen considerably. These circumstances materially impacted liquidity in the debt markets, making financing terms for borrowers less attractive, and in certain cases resulted in the unavailability of certain types of debt financing. Any future uncertainty in the credit markets could negatively impact our ability to access additional debt financing or to refinance existing indebtedness on favorable terms, or at all. In addition, any future uncertainty in other financial markets in the U.S. could make it more difficult or costly for us to raise capital through the issuance of common stock or other equity securities. Any of these risks could impair our ability to fund our operations or limit our ability to expand our business or increase our interest expense, which could have a material adverse effect on our financial results.
If we are unable to refinance our indebtedness at or prior to maturity on commercially reasonable terms or at all, we would be forced to seek other alternatives, including:
• sales of assets; • sales of equity; and • negotiations with our lenders or noteholders to restructure the applicable debt.
If we are forced to pursue any of the above options, our business and/or the value of an investment in our securities could be adversely affected.
We rely on co-packers for a significant portion of our manufacturing needs, and the inability to enter into additional or future co-packing agreements may result in our failure to meet customer demand.
We rely upon co-packers for a significant portion of our manufacturing needs. The success of our business depends, in part, on maintaining a strong sourcing and manufacturing platform. We believe that there are a limited number of competent, high-quality co-packers in the industry, and if we were required to obtain additional or alternative co-packing agreements or arrangements in the future, we can provide no assurance that we would be able to do so on satisfactory terms or in a timely manner. Our inability to enter into satisfactory co-packing agreements could limit our ability to implement our business plan or meet customer demand.
- 17 -
We rely on the performance of major retailers, wholesalers, specialty distributors and mass merchants for the success of our business, and should they perform poorly or give higher priority to other brands or products, our business could be adversely affected.
We sell our products principally to retail outlets and wholesale distributors including, traditional supermarkets, mass merchants, warehouse clubs, wholesalers, foodservice distributors and direct accounts, specialty food distributors, military commissaries and non-food outlets such as drug store chains, dollar stores and e-tailers. The replacement by or poor performance of our major wholesalers, retailers or chains or our inability to collect accounts receivable from our customers could materially and adversely affect our results of operations and financial condition. In addition, our customers offer branded and private label products that compete directly with our products for retail shelf space and consumer purchases. Accordingly, there is a risk that our customers may give higher priority to their own products or to the products of our competitors. In the future, our customers may not continue to purchase our products or provide our products with adequate levels of promotional support. It is also possible that our customers may replace our branded products with private label products.
We may be unable to anticipate changes in consumer preferences and consumer demographics, which may result in decreased demand for our products.
Our success depends in part on our ability to anticipate and offer products that appeal to the changing tastes, dietary habits and product packaging preferences of consumers in the market categories in which we compete. If we are not able to anticipate, identify or develop and market products that respond to these changes in consumer preferences, whether resulting from changing consumer demographics or otherwise, demand for our products may decline and our operating results may be adversely affected. In addition, we may incur significant costs related to developing and marketing new products or expanding our existing product lines in reaction to what we perceive to be increased consumer preference or demand. Such development or marketing may not result in the volume of sales or profitability anticipated.
Severe weather conditions, natural disasters and other natural events can affect raw material supplies and reduce our operating results.
Severe weather conditions, natural disasters and other natural events, such as floods, droughts, frosts, earthquakes, pestilence or health pandemics, such as the novel coronavirus that recently originated in China, may affect the supply of the raw materials that we use for our products. Our maple syrup products, for instance, are particularly susceptible to severe freezing conditions in Québec, Canada and Vermont during the season in which maple syrup is produced. Our Green Giant frozen vegetable manufacturing facility in Irapuato, Mexico is located in a region affected by water scarcity and restrictions on usage. We source certain spices and other raw materials from China and if the severity and reach of the coronavirus outbreak increases, there may be significant disruptions to our supply chain and operations, and delays in the manufacture and shipment of our products. Competing manufacturers can be affected differently by weather conditions, natural disasters and other natural events depending on the location of their supplies. If our supplies of raw materials are delayed or reduced, we may not be able to find supplemental supply sources on favorable terms or at all, which could adversely affect our business and operating results.
Climate change, water scarcity or legal, regulatory, or market measures to address climate change or water scarcity, could negatively affect our business and operations.
In the event that climate change has a negative effect on agricultural productivity, we may be subject to decreased availability or less favorable pricing for certain commodities that are necessary for our products. We may also be subjected to decreased availability or less favorable pricing for water as a result of such change, which could impact our manufacturing and distribution operations. For example, our Green Giant frozen vegetable manufacturing facility in Irapuato, Mexico is already affected by water scarcity in that region of Mexico. Any further restrictions on, or loss of, water rights due to water scarcity, water rights violations or otherwise for our Irapuato manufacturing facility could have a material adverse effect on our business and operating results.
The increasing concern over climate change also may result in more regional, federal, foreign and/or global legal and regulatory requirements to reduce or mitigate the effects of greenhouse gases. In the event that such regulation is enacted and is more aggressive than the sustainability measures that we are currently undertaking to monitor our emissions and improve our energy and resource efficiency, we may experience significant increases in our manufacturing and distribution costs. In particular, increasing regulation of fuel emissions could substantially increase
- 18 -
the supply chain and distribution costs associated with our products. As a result, climate change or increased concern over climate change could negatively affect our business and operations.
Most of our products are sourced from single manufacturing sites, which means disruptions in our or our co-packers’ operations for any number of reasons could have a material adverse effect on our business.
Our products are manufactured at many different manufacturing facilities, including our eleven manufacturing facilities and manufacturing facilities operated by our co-packers. However, in most cases, individual products are produced only at a single location. If any of these manufacturing locations experiences a disruption for any reason, including a work stoppage, power failure, fire, or weather related condition or natural disaster, etc., this could result in a significant reduction or elimination of the availability of some of our products. If we were not able to obtain alternate production capability in a timely manner or on satisfactory terms, this could have a material adverse effect on our business, consolidated financial condition, results of operations or liquidity.
Our operations are subject to numerous laws and governmental regulations, exposing us to potential claims and compliance costs that could adversely affect our business.
Our operations are subject to extensive regulation by the FDA, the USDA, the FTC, the SEC, the CPSC, the United States Department of Labor, the Environmental Protection Agency and various other federal, state, local and foreign authorities. We are also subject to U.S. laws affecting operations outside of the United States, including anti-bribery laws such as the Foreign Corrupt Practices Act (FCPA). Any changes in these laws and regulations, or any changes in how existing or future laws or regulations will be enforced, administered or interpreted could increase the cost of developing, manufacturing and distributing our products or otherwise increase the cost of conducting our business, or expose us to additional risk of liabilities and claims, which could have a material adverse effect on our business, consolidated financial condition, results of operations or liquidity. In addition, failure by us to comply with applicable laws and regulations, including future laws and regulations, could subject us to civil remedies, including fines, injunctions, recalls or seizures, as well as potential criminal sanctions, which could have a material adverse effect on our business, consolidated financial condition, results of operations or liquidity. See Item 1, “Business—Government Regulation” and “—Environmental Matters.”
Failure by third-party co-packers or suppliers of raw materials to comply with food safety, environmental or other regulations may disrupt our supply of certain products and adversely affect our business.
We rely on co-packers to produce certain of our products and on other suppliers to supply raw materials. Such co-packers and other suppliers, whether in the United States or outside the United States, are subject to a number of regulations, including food safety and environmental regulations. Failure by any of our co-packers or other suppliers to comply with regulations, or allegations of compliance failure, may disrupt their operations. Disruption of the operations of a co-packer or other suppliers could disrupt our supply of product or raw materials, which could have an adverse effect on our business, consolidated financial condition, results of operations or liquidity. Additionally, actions we may take to mitigate the impact of any such disruption or potential disruption, including increasing inventory in anticipation of a potential production or supply interruption, may adversely affect our business, consolidated financial condition, results of operations or liquidity.
A recall of our products could have a material adverse effect on our business. In addition, we may be subject to significant liability should the consumption of any of our products cause injury, illness or death.
The sale of food products for human consumption involves the risk of injury to consumers. Such injuries may result from mislabeling, tampering by unauthorized third parties or product contamination or spoilage, including the presence of foreign objects, undeclared allergens, substances, chemicals, other agents or residues introduced during the growing, manufacturing, storage, handling or transportation phases of production. Under certain circumstances, we may be required to recall products, leading to a material adverse effect on our business, consolidated financial condition, results of operations or liquidity. Even if a situation does not necessitate a recall, product liability claims might be asserted against us. We have from time to time been involved in product liability lawsuits, none of which have been material to our business. While we are subject to governmental inspection and regulations and believe our facilities comply in all material respects with all applicable laws and regulations, if the consumption of any of our products causes, or is alleged to have caused, a health-related illness in the future we may become subject to claims or lawsuits relating to such matters. Even if a product liability claim is unsuccessful or is not fully pursued, the negative publicity surrounding any assertion that our products caused injury, illness or death could adversely affect our reputation with
- 19 -
existing and potential customers and our corporate and brand image. Moreover, claims or liabilities of this sort might not be covered by our insurance or by any rights of indemnity or contribution that we may have against others. We maintain product liability insurance and product contamination insurance in amounts we believe to be adequate. However, we cannot assure you that we will not incur claims or liabilities for which we are not insured or that exceed the amount of our insurance coverage. A product liability judgment against us or a product recall or the damage to our reputation resulting therefrom could have a material adverse effect on our business, consolidated financial condition, results of operations or liquidity.
Pending and future litigation may lead us to incur significant costs.
We are, or may become, party to various lawsuits and claims arising in the normal course of business, which may include lawsuits or claims relating to contracts, intellectual property, product recalls, product liability, the marketing and labeling of products, employment matters, environmental matters or other aspects of our business. Even when not merited, the defense of these lawsuits may divert our management’s attention, and we may incur significant expenses in defending these lawsuits. In addition, we may be required to pay damage awards or settlements or become subject to injunctions or other equitable remedies, which could have a material adverse effect on our business, consolidated financial condition, results of operations or liquidity. The outcome of litigation is often difficult to predict, and the outcome of pending or future litigation may have a material adverse effect on our business, consolidated financial condition, results of operations or liquidity.
Consumer concern regarding the safety and quality of food products or health concerns could adversely affect sales of certain of our products.
If consumers in our principal markets lose confidence in the safety and quality of our food products even without a product liability claim or a product recall, our business could be adversely affected. Consumers have been increasingly focused on food safety and health and wellness with respect to the food products they buy. We have been and will continue to be impacted by publicity concerning the health implications of food products generally, which could negatively influence consumer perception and acceptance of our products and marketing programs. Developments in any of these areas could cause our results to differ materially from results that have been or may be projected.
A weakening of the U.S. dollar in relation to the Canadian dollar would significantly increase our future costs relating to the production of maple syrup products.
We purchase a significant majority of our maple syrup requirements from suppliers in Québec, Canada. A weakening of the U.S. dollar in relation to the Canadian dollar would significantly increase our future costs relating to the production of our maple syrup products to the extent we have not purchased Canadian dollars or otherwise entered into a currency hedging arrangement in advance of any such weakening of the U.S. dollar. These increased costs may not be fully offset by the positive impact the change in the relative strength of the Canadian dollar versus the U.S. dollar would have on our net sales in Canada.
Our operations in foreign countries are subject to political, economic and foreign currency risk.
Our relationships with foreign suppliers and co-packers as well as our manufacturing location in Irapuato, Mexico also subject us to the risks of doing business outside the United States. The countries from which we source our raw materials and certain of our finished goods may be subject to political and economic instability, and may periodically enact new or revise existing laws, taxes, duties, quotas, tariffs, currency controls or other restrictions to which we are subject, including restrictions on the transfer of funds to and from foreign countries or the nationalization of operations. Our products are subject to import duties and other restrictions, and the U.S. government may periodically impose new or revise existing duties, quotas, tariffs or other restrictions to which we are subject, including restrictions on the transfer of funds to and from foreign countries.
In particular, our financial condition and results of operations could be materially and adversely affected by the new United States-Mexico-Canada Agreement, or other regulatory and economic impact of changes in taxation and trade relations among the United States and other countries.
In addition, changes in respective wage rates among the countries from which we and our competitors source product could substantially impact our competitive position. Changes in exchange rates, import/export duties or relative international wage rates applicable to us or our competitors could adversely impact our business, financial condition and results of operations. These changes may impact us in a different manner than our competitors.
- 20 -
Our financial performance on a U.S. dollar denominated basis is subject to fluctuations in currency exchange rates. These fluctuations could cause material variations in our results of operations. Our principal exposures are to the Canadian dollar and the Mexican peso. For example, our foreign sales are primarily to customers in Canada. Net sales in Canada accounted for approximately 5.7%, 5.7% and 5.5% of our total net sales in fiscal 2019, 2018 and 2017, respectively. Although our sales for export to other countries are generally denominated in U.S. dollars, our sales to Canada are generally denominated in Canadian dollars. As a result, our net sales to Canada are subject to the effect of foreign currency fluctuations, and these fluctuations could have an adverse impact on operating results. From time to time, we may enter into agreements that are intended to reduce the effects of our exposure to currency fluctuations, but these agreements may not be effective in significantly reducing our exposure.
Litigation regarding our trademarks and any other proprietary rights and intellectual property infringement claims may have a significant negative impact on our business.
We maintain an extensive trademark portfolio that we consider to be of significant importance to our business. If the actions we take to establish and protect our trademarks and other proprietary rights are not adequate to prevent imitation of our products by others or to prevent others from seeking to block sales of our products as an alleged violation of their trademarks and proprietary rights, it may be necessary for us to initiate or enter into litigation in the future to enforce our trademark rights or to defend ourselves against claimed infringement of the rights of others. Any legal proceedings could result in an adverse determination that could have a material adverse effect on our business, consolidated financial condition, results of operations or liquidity.
We face risks associated with our defined benefit pension plans and multi-employer pension plan obligations.
We maintain four company-sponsored defined benefit pension plans that cover approximately 39.7% of our employees. A deterioration in the value of plan assets resulting from poor market performance, a general financial downturn or otherwise could cause an increase in the amount of contributions we are required to make to these plans. For example, our defined benefit pension plans may from time to time move from an overfunded to underfunded status driven by decreases in plan asset values that may result from changes in long-term interest rates and disruptions in U.S. or global financial markets. Additionally, historically low interest rates coupled with poor market performance would have the effect of decreasing the funded status of these plans which would result in greater required contributions. For a more detailed description of these plans, see Part II, Item 7, “Management’s Discussion and Analysis of Financial Condition and Results of Operations—Critical Accounting Policies; Use of Estimates—Pension Expense” and Note 12, “Pension Benefits,” to our consolidated financial statements in Part II, Item 8 of this report.
We also participate in a multi-employer pension plan maintained by the labor union representing certain of our employees at our Portland, Maine facility. We make periodic contributions to this plan pursuant to the terms of a collective bargaining agreement. In the event that we withdraw from participation in this plan or substantially reduce our participation in this plan (such as due to a workforce reduction), or if a mass withdrawal were to occur, applicable law could require us to make withdrawal liability payments to the plan, and we would have to reflect that liability on our balance sheet. The amount of our withdrawal liability would depend on the extent of this plan’s funding of vested benefits at the time of our withdrawal. Currently the plan is severely underfunded. Furthermore, our withdrawal liability could increase as the number of employers participating in this plan decreases.
For a more detailed description of this multi-employer plan, which is in critical and declining status, see Note 12, “Pension Benefits,” to our consolidated financial statements in Part II, Item 8 of this report.
An obligation to make additional, unanticipated contributions to our defined benefit plans or the multi-employer plan described above could reduce the cash available for working capital and other corporate uses, and may have a material adverse effect on our business, consolidated financial position, results of operations and liquidity.
Our financial well-being could be jeopardized by unforeseen changes in our employees’ collective bargaining agreements, shifts in union policy or labor disruptions in the food industry.
As of December 28, 2019, approximately 62.5% of our 2,899 employees were covered by collective bargaining agreements. A prolonged work stoppage or strike at any of our facilities with union employees or a significant work disruption from other labor disputes in the food or related industries could have a material adverse effect on our business, consolidated financial condition, results of operations or liquidity. Three of our collective bargaining agreements expire in the next twelve months. The collective bargaining agreement covering our Terre Haute facility, which covers approximately 100 employees, is scheduled to expire on March 27, 2020; the collective bargaining agreement covering
- 21 -
our Roseland facility, which covers approximately 50 employees, is scheduled to expire on March 31, 2020; and the collective bargaining agreement covering our Ankeny facility, which covers approximately 275 employees, is scheduled to expire on April 5, 2020.
While we believe that our relations with our union employees are in general good, we cannot assure you that we will be able to negotiate new collective bargaining agreements for our Terre Haute, Roseland and Ankeny facilities on terms satisfactory to us, or at all, and without production interruptions, including labor stoppages. If, prior to the expiration of the collective bargaining agreements for the Terre Haute, Roseland or Ankeny facilities or prior to the expiration of any of our other existing collective bargaining agreements, we are unable to reach new agreements without union action or any such new agreements are not on terms satisfactory to us, our business, consolidated financial condition, results of operations or liquidity could be materially and adversely affected.
We are increasingly dependent on information technology; Disruptions, failures or security breaches of our information technology infrastructure could have a material adverse effect on our operations.
Information technology is critically important to our business operations. We rely on information technology networks and systems, including the Internet, to process, transmit and store electronic and financial information, to manage a variety of business processes and activities, including manufacturing, financial, logistics, sales, marketing and administrative functions.
We depend on our information technology infrastructure to communicate internally and externally with employees, customers, suppliers and others. We also use information technology networks and systems to comply with regulatory, legal and tax requirements. These information technology systems, many of which are managed by third parties or used in connection with shared service centers, may be susceptible to damage, disruptions or shutdowns due to failures during the process of upgrading or replacing software, databases or components thereof, issues with or errors in systems’ maintenance or security, migration of applications to the cloud, power outages, hardware or software failures, computer viruses, malware, attacks by computer hackers or other cybersecurity risks, telecommunication failures, denial of service, user errors, natural disasters, terrorist attacks or other catastrophic events.
Cyberattacks and other cyber incidents are occurring more frequently in the United States, are constantly evolving in nature, are becoming more sophisticated and are being made by groups and individuals (including criminal hackers, hacktivists, state-sponsored institutions, terrorist organizations and individuals or groups participating in organized crime) with a wide range of expertise and motives (including monetization of corporate, payment or other internal or personal data, theft of trade secrets and intellectual property for competitive advantage and leverage for political, social, economic and environmental reasons). Such cyberattacks and cyber incidents can take many forms including cyber extortion, denial of service, social engineering, such as impersonation attempts to fraudulently induce employees or others to disclose information or unwittingly provide access to systems or data, introduction of viruses or malware, such as ransomware through phishing emails, website defacement or theft of passwords and other credentials. We may incur significant costs in protecting against or remediating cyberattacks or other cyber incidents.
If any of our significant information technology systems suffer severe damage, disruption or shutdown, whether due to natural disaster, cyberattacks or otherwise, and our disaster recovery and business continuity plans, or those of our third party providers, do not effectively respond to or resolve the issues in a timely manner, our product sales, financial condition and results of operations may be materially and adversely affected, and we could experience delays in reporting our financial results, loss of intellectual property and damage to our reputation or brands.
In addition, if we are unable to prevent physical and electronic break‑ins, cyberattacks and other information security breaches, we may suffer financial and reputational damage, be subject to litigation or incur remediation costs or penalties because of the unauthorized disclosure of confidential information belonging to us or to our partners, customers, suppliers or employees. The mishandling or inappropriate disclosure of non‑public sensitive or protected information could lead to the loss of intellectual property, negatively impact planned corporate transactions or damage our reputation and brand image. Misuse, leakage or falsification of legally protected information could also result in a violation of data privacy laws and regulations and have a negative impact on our reputation, business, financial condition and results of operations.
We may experience difficulties fully implementing and integrating our new enterprise resource planning system.
We are implementing a new enterprise resource planning (ERP) system, including additional modules in 2020. We also plan to transition our Mexican operations to the new ERP system by the end of 2021. The implementation of the
- 22 -
new ERP system has required, and will continue to require, the investment of significant financial and human resources. We may not be able to complete successfully the full implementation and integration of the ERP system without experiencing difficulties. Any disruptions, delays or deficiencies in the design, implementation and integration of the new ERP system could adversely affect our ability to produce products, process orders, ship products, provide services and customer support, send invoices and track payments, fulfill contractual obligations, integrate acquisitions, or otherwise operate our business. It is also possible that the migration to a new ERP system could adversely affect our internal controls over financial reporting.
If we are unable to retain our key management personnel, our growth and future success may be impaired and our results of operations could suffer as a result.
Our success depends to a significant degree upon the continued contributions of senior management, certain of whom would be difficult to replace. As a result, departure by members of our senior management could have a material adverse effect on our business and results of operations. In addition, we do not maintain key-man life insurance on any of our executive officers.
We are a holding company and we rely on dividends, interest and other payments, advances and transfers of funds from our subsidiaries to meet our obligations.
We are a holding company, with all of our assets held by our direct and indirect subsidiaries, and we rely on dividends and other payments or distributions from our subsidiaries to meet our debt service obligations and to enable us to pay dividends. The ability of our subsidiaries to pay dividends or make other payments or distributions to us depends on their respective operating results and may be restricted by, among other things, the laws of their jurisdiction of organization (which may limit the amount of funds available for the payment of dividends), agreements of those subsidiaries, our credit agreement, our senior notes indentures and the covenants of any future outstanding indebtedness we or our subsidiaries incur.
Future changes that increase cash taxes payable by us could significantly decrease our future cash flow available to make interest and dividend payments with respect to our securities and have a material adverse effect on our business, consolidated financial condition, results of operations and liquidity.
We are able to amortize goodwill and certain intangible assets in accordance with Section 197 of the Internal Revenue Code of 1986. We expect to be able to amortize for tax purposes approximately $988.5 million between 2020 and 2034. The expected annual deductions are approximately $109.9 million for fiscal 2020, approximately $107.1 million for fiscal 2021, approximately $95.5 million for fiscal 2022, approximately $93.6 million per year for fiscal 2023 through fiscal 2024, approximately $93.4 million for fiscal 2025, approximately $89.4 million for fiscal 2026, approximately $69.5 million for fiscal 2027, approximately $67.0 million for fiscal 2028, approximately $66.4 million for fiscal 2029, approximately $60.3 million for fiscal 2030, approximately $27.6 million for fiscal 2031, approximately $9.5 million for fiscal 2032, approximately $4.5 million for fiscal 2033 and approximately $1.2 million for fiscal 2034.
We also take material annual deductions for net interest expense due to our substantial indebtedness. However, the U.S. Tax Cuts and Jobs Act, signed into law on December 22, 2017, limits the deduction for net interest expense (including the treatment of depreciation and other deductions in arriving at adjusted taxable income) incurred by a corporate taxpayer to 30% of the taxpayer’s adjusted taxable income. We were not impacted by this limitation in fiscal 2018 due to the gain on sale from the Pirate Brands divestiture, which increased our adjusted taxable income. However, in fiscal 2019 our interest expense exceeded 30% of our adjusted taxable income and this limitation resulted in an increase to our taxable income of $30.2 million, and we accordingly established a deferred tax asset of $7.4 million without a valuation allowance. Any interest that is non-deductible may be carried forward indefinitely and we believe we have sufficient deferred tax liabilities to offset any deferred tax assets resulting from currently non-deductible interest expense. However, if our interest expense deduction continues to be limited or if we are unable to fully utilize our interest expense deductions in future periods, our cash taxes would increase.
If there is a change in U.S. federal tax law or, in the case of the interest deduction, a change in our net interest expense relative to our adjusted taxable income that eliminates, limits or reduces our ability to amortize and deduct goodwill and certain intangible assets or the interest deduction we receive on our substantial indebtedness, or otherwise results in an increase in our corporate tax rate, our cash taxes payable would increase, which could significantly reduce
- 23 -
our future cash and impact our ability to make interest and dividend payments and have a material adverse effect on our business, consolidated financial condition, results of operations and liquidity.
Likewise, the ultimate impact of the U.S. Tax Cuts and Jobs Act on our reported results in fiscal 2020 and beyond may differ from the estimates provided in this report, possibly materially, due to guidance that may be issued and other actions we may take as a result of the new tax law different from that currently contemplated. See Note 10, “Income Taxes,” to our consolidated financial statements in Part II, Item 8 of this report for information about the U.S. Tax Cuts and Jobs Act.
A change in the assumptions used to value our goodwill or our indefinite-lived intangible assets could negatively affect our consolidated results of operations and net worth.
Our total assets include substantial goodwill and indefinite-lived intangible assets (trademarks). These assets are tested for impairment at least annually and whenever events or circumstances occur indicating that goodwill or indefinite-lived intangible assets might be impaired. The annual goodwill impairment test involves a two-step process. The first step of the impairment test involves comparing our company’s market capitalization with our company’s carrying value, including goodwill. If the carrying value of our company exceeds our market capitalization, we perform the second step of the impairment test to determine the amount of the impairment loss. The second step of the goodwill impairment test involves comparing the implied fair value of goodwill with the carrying value and recognizing a loss for the difference. We test our indefinite-lived intangible assets by comparing the fair value with the carrying value and recognize a loss for the difference. We estimate the fair value of our indefinite-lived intangible assets based on discounted cash flows that reflect certain third party market value indicators. Estimating our fair value for these purposes requires significant estimates and assumptions by management. We completed our annual impairment tests for fiscal 2019, 2018 and 2017 with no adjustments to the carrying values of goodwill and indefinite-lived intangible assets. However, an interim impairment analysis relating to one of our brands performed during fiscal 2014 resulted in our company recording non-cash impairment charges to finite-lived trademarks and customer relationships for the brand of $26.9 million and $7.3 million, respectively, during fiscal 2014. During the second quarter of 2016, we discontinued that brand because there was not sufficient demand to warrant continued production. Accordingly, we wrote off the related intangible assets and recorded non-cash impairment charges to finite-lived trademarks and customer relationships of $4.5 million and $0.9 million, respectively, which are recorded in “Impairment of intangible assets” on the consolidated statement of operations for fiscal 2016. If operating results for any of our other brands, including newly acquired brands, deteriorate, at rates in excess of our current projections, we may be required to record additional non-cash impairment charges to certain intangible assets. In addition, any significant decline in our market capitalization, even if due to macroeconomic factors, could put pressure on the carrying value of our goodwill. A determination that all or a portion of our goodwill or indefinite-lived intangible assets are impaired, although a non-cash charge to operations, could have a material adverse effect on our business, consolidated financial condition and results of operations.
Any future financial market disruptions or tightening of the credit markets could expose us to additional credit risks from customers and supply risks from suppliers and co-packers.
Any future financial market disruptions or tightening of the credit markets could result in some of our customers experiencing a significant decline in profits and/or reduced liquidity. A significant adverse change in the financial and/or credit position of a customer could require us to assume greater credit risk relating to that customer and could limit our ability to collect receivables. A significant adverse change in the financial and/or credit position of a supplier or co-packer could result in an interruption of supply. This could have a material adverse effect on our business, consolidated financial condition, results of operations and liquidity.
Risks Relating to our Securities
Holders of our common stock may not receive the level of dividends provided for in our dividend policy or any dividends at all.
Dividend payments are not mandatory or guaranteed and holders of our common stock do not have any legal right to receive, or require us to pay, dividends. Our board of directors may, in its sole discretion, decrease the level of dividends provided for in our dividend policy or entirely discontinue the payment of dividends. Future dividends with respect to shares of our capital stock, if any, depend on, among other things, our results of operations, cash requirements, financial condition, contractual restrictions (including restrictions in our credit agreement and senior notes indentures),
- 24 -
business opportunities, provisions of applicable law (including certain provisions of the Delaware General Corporation Law) and other factors that our board of directors may deem relevant.
If our cash flows from operating activities were to fall below our minimum expectations (or if our assumptions as to capital expenditures or interest expense were too low or our assumptions as to the sufficiency of our revolving credit facility to finance our working capital needs were to prove incorrect), we may need either to reduce or eliminate dividends or, to the extent permitted under our credit agreement and senior notes indentures, fund a portion of our dividends with borrowings or from other sources. If we were to use working capital or permanent borrowings to fund dividends, we would have less cash and/or borrowing capacity available for future dividends and other purposes, which could negatively impact our financial condition, results of operations, liquidity and ability to maintain or expand our business.
Our dividend policy may negatively impact our ability to finance capital expenditures, operations or acquisition opportunities.
Under our dividend policy, a substantial portion of our cash generated by our business in excess of operating needs, interest and principal payments on indebtedness, and capital expenditures sufficient to maintain our properties and assets is in general distributed as regular quarterly cash dividends to the holders of our common stock. As a result, we may not retain a sufficient amount of cash to finance growth opportunities or unanticipated capital expenditure needs or to fund our operations in the event of a significant business downturn. We may have to forego growth opportunities or capital expenditures that would otherwise be necessary or desirable if we do not find alternative sources of financing. If we do not have sufficient cash for these purposes, our financial condition and our business will suffer.
Our certificate of incorporation authorizes us to issue without stockholder approval preferred stock that may be senior to our common stock in certain respects.
Our certificate of incorporation authorizes the issuance of preferred stock without stockholder approval and, in the case of preferred stock, upon such terms as the board of directors may determine. The rights of the holders of shares of our common stock will be subject to, and may be adversely affected by, the rights of holders of any class or series of preferred stock that may be issued in the future, including any preferential rights that we may grant to the holders of preferred stock. The terms of any preferred stock we issue may place restrictions on the payment of dividends to the holders of our common stock. If we issue preferred stock that is senior to our common stock in right of dividend payment, and our cash flows from operating activities or surplus are insufficient to support dividend payments to the holders of preferred stock, on the one hand, and to the holders of common stock, on the other hand, we may be forced to reduce or eliminate dividends to the holders of our common stock.
Future sales or the possibility of future sales of a substantial number of shares of our common stock or other securities convertible or exchangeable into common stock may depress the price of our common stock.
We may issue shares of our common stock or other securities convertible or exchangeable into common stock from time to time in future financings or as consideration for future acquisitions and investments. In the event any such future financing, acquisition or investment is significant, the number of shares of our common stock or other securities convertible or exchangeable into common stock that we may issue may in turn be significant. In addition, we may grant registration rights covering shares of our common stock or other securities convertible or exchangeable into common stock, as applicable, issued in connection with any such future financing, acquisitions and investments.
Future sales or the availability for sale of a substantial number of shares of our common stock or other securities convertible or exchangeable into common stock, whether issued and sold pursuant to our currently effective shelf registration statement or otherwise, would dilute our earnings per share and the voting power of each share of common stock outstanding prior to such sale or distribution, could adversely affect the prevailing market price of our securities and could impair our ability to raise capital through future sales of our securities.
Our certificate of incorporation and bylaws and several other factors could limit another party’s ability to acquire us and deprive our investors of the opportunity to obtain a takeover premium for their securities.
Our certificate of incorporation and bylaws contain certain provisions that may make it difficult for another company to acquire us and for holders of our securities to receive any related takeover premium for their securities. For example, our certificate of incorporation authorizes the issuance of preferred stock without stockholder approval and upon such terms as the board of directors may determine. The rights of the holders of shares of our common stock will
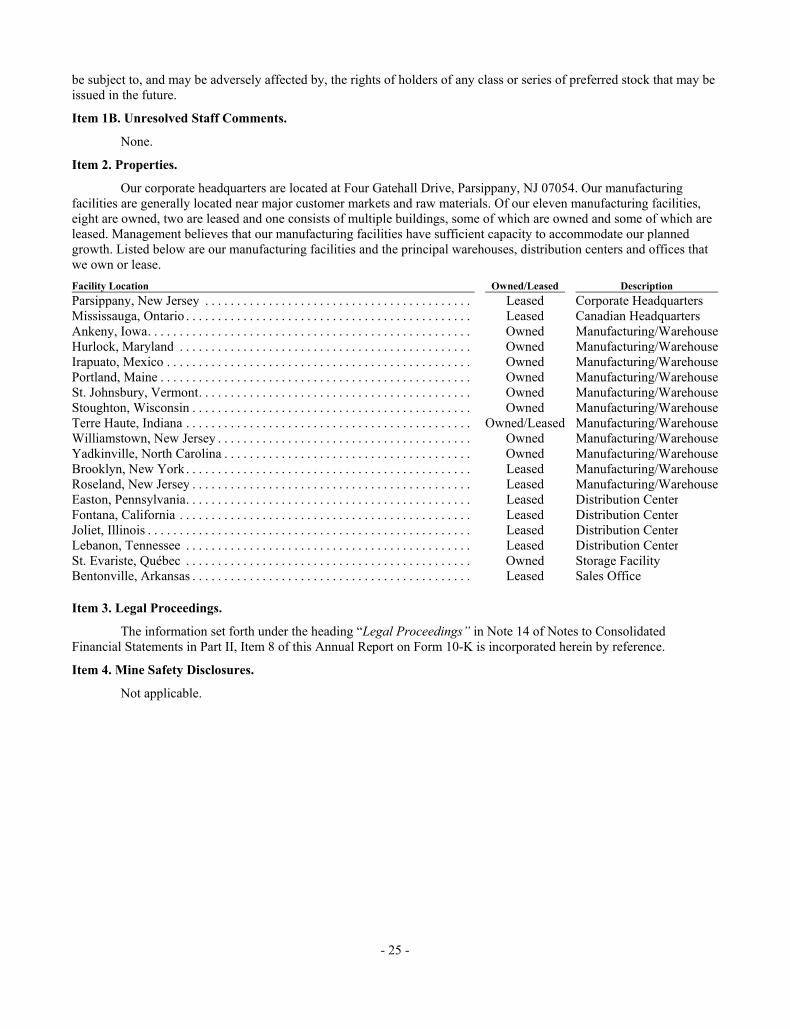
- 25 -
be subject to, and may be adversely affected by, the rights of holders of any class or series of preferred stock that may be issued in the future.
Item 1B. Unresolved Staff Comments.
None.
Item 2. Properties.
Our corporate headquarters are located at Four Gatehall Drive, Parsippany, NJ 07054. Our manufacturing facilities are generally located near major customer markets and raw materials. Of our eleven manufacturing facilities, eight are owned, two are leased and one consists of multiple buildings, some of which are owned and some of which are leased. Management believes that our manufacturing facilities have sufficient capacity to accommodate our planned growth. Listed below are our manufacturing facilities and the principal warehouses, distribution centers and offices that we own or lease. Facility Location Owned/Leased Description Parsippany, New Jersey . . . . . . . . . . . . . . . . . . . . . . . . . . . . . . . . . . . . . . . . . . Leased Corporate Headquarters Mississauga, Ontario . . . . . . . . . . . . . . . . . . . . . . . . . . . . . . . . . . . . . . . . . . . . . Leased Canadian Headquarters Ankeny, Iowa . . . . . . . . . . . . . . . . . . . . . . . . . . . . . . . . . . . . . . . . . . . . . . . . . . . Owned Manufacturing/Warehouse Hurlock, Maryland . . . . . . . . . . . . . . . . . . . . . . . . . . . . . . . . . . . . . . . . . . . . . . Owned Manufacturing/Warehouse Irapuato, Mexico . . . . . . . . . . . . . . . . . . . . . . . . . . . . . . . . . . . . . . . . . . . . . . . . Owned Manufacturing/Warehouse Portland, Maine . . . . . . . . . . . . . . . . . . . . . . . . . . . . . . . . . . . . . . . . . . . . . . . . . Owned Manufacturing/Warehouse St. Johnsbury, Vermont . . . . . . . . . . . . . . . . . . . . . . . . . . . . . . . . . . . . . . . . . . . Owned Manufacturing/Warehouse Stoughton, Wisconsin . . . . . . . . . . . . . . . . . . . . . . . . . . . . . . . . . . . . . . . . . . . . Owned Manufacturing/Warehouse Terre Haute, Indiana . . . . . . . . . . . . . . . . . . . . . . . . . . . . . . . . . . . . . . . . . . . . . Owned/Leased Manufacturing/Warehouse Williamstown, New Jersey . . . . . . . . . . . . . . . . . . . . . . . . . . . . . . . . . . . . . . . . Owned Manufacturing/Warehouse Yadkinville, North Carolina . . . . . . . . . . . . . . . . . . . . . . . . . . . . . . . . . . . . . . . Owned Manufacturing/Warehouse Brooklyn, New York . . . . . . . . . . . . . . . . . . . . . . . . . . . . . . . . . . . . . . . . . . . . . Leased Manufacturing/Warehouse Roseland, New Jersey . . . . . . . . . . . . . . . . . . . . . . . . . . . . . . . . . . . . . . . . . . . . Leased Manufacturing/Warehouse Easton, Pennsylvania . . . . . . . . . . . . . . . . . . . . . . . . . . . . . . . . . . . . . . . . . . . . . Leased Distribution Center Fontana, California . . . . . . . . . . . . . . . . . . . . . . . . . . . . . . . . . . . . . . . . . . . . . . Leased Distribution Center Joliet, Illinois . . . . . . . . . . . . . . . . . . . . . . . . . . . . . . . . . . . . . . . . . . . . . . . . . . . Leased Distribution Center Lebanon, Tennessee . . . . . . . . . . . . . . . . . . . . . . . . . . . . . . . . . . . . . . . . . . . . . Leased Distribution Center St. Evariste, Québec . . . . . . . . . . . . . . . . . . . . . . . . . . . . . . . . . . . . . . . . . . . . . Owned Storage Facility Bentonville, Arkansas . . . . . . . . . . . . . . . . . . . . . . . . . . . . . . . . . . . . . . . . . . . . Leased Sales Office
Item 3. Legal Proceedings.
The information set forth under the heading “Legal Proceedings” in Note 14 of Notes to Consolidated Financial Statements in Part II, Item 8 of this Annual Report on Form 10-K is incorporated herein by reference.
Item 4. Mine Safety Disclosures.
Not applicable.
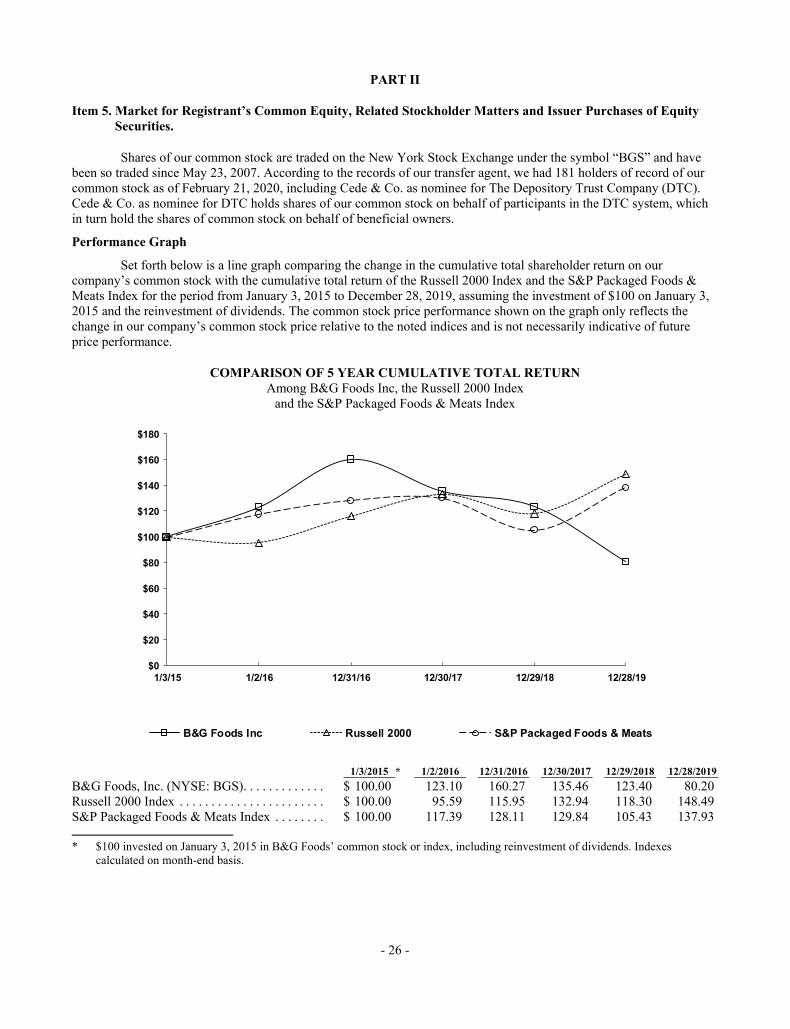
- 26 -
PART II
Item 5. Market for Registrant’s Common Equity, Related Stockholder Matters and Issuer Purchases of Equity Securities.
Shares of our common stock are traded on the New York Stock Exchange under the symbol “BGS” and have been so traded since May 23, 2007. According to the records of our transfer agent, we had 181 holders of record of our common stock as of February 21, 2020, including Cede & Co. as nominee for The Depository Trust Company (DTC). Cede & Co. as nominee for DTC holds shares of our common stock on behalf of participants in the DTC system, which in turn hold the shares of common stock on behalf of beneficial owners.
Performance Graph
Set forth below is a line graph comparing the change in the cumulative total shareholder return on our company’s common stock with the cumulative total return of the Russell 2000 Index and the S&P Packaged Foods & Meats Index for the period from January 3, 2015 to December 28, 2019, assuming the investment of $100 on January 3, 2015 and the reinvestment of dividends. The common stock price performance shown on the graph only reflects the change in our company’s common stock price relative to the noted indices and is not necessarily indicative of future price performance.
COMPARISON OF 5 YEAR CUMULATIVE TOTAL RETURN Among B&G Foods Inc, the Russell 2000 Index
and the S&P Packaged Foods & Meats Index
1/3/2015 * 1/2/2016 12/31/2016 12/30/2017 12/29/2018 12/28/2019 B&G Foods, Inc. (NYSE: BGS) . . . . . . . . . . . . . $ 100.00 123.10 160.27 135.46 123.40 80.20 Russell 2000 Index . . . . . . . . . . . . . . . . . . . . . . . $ 100.00 95.59 115.95 132.94 118.30 148.49 S&P Packaged Foods & Meats Index . . . . . . . . $ 100.00 117.39 128.11 129.84 105.43 137.93
* $100 invested on January 3, 2015 in B&G Foods’ common stock or index, including reinvestment of dividends. Indexes
calculated on month-end basis.
$0
$20
$40
$60
$80
$100
$120
$140
$160
$180
1/3/15 1/2/16 12/31/16 12/30/17 12/29/18 12/28/19
B&G Foods Inc Russell 2000 S&P Packaged Foods & Meats
- 27 -
Dividend Policy
General
Our dividend policy reflects a basic judgment that our stockholders are better served when we distribute a substantial portion of our cash available to pay dividends to them instead of retaining it in our business. Under this policy, a substantial portion of the cash generated by our company in excess of operating needs, interest and principal payments on indebtedness, capital expenditures sufficient to maintain our properties and other assets is distributed as regular quarterly cash dividends to the holders of our common stock and not retained by us. We have paid dividends every quarter since our initial public offering in October 2004.
For fiscal 2019 and fiscal 2018, we had cash flows from operating activities of $46.5 million and $209.5 million, respectively, and distributed $123.7 million and $124.5 million as dividends, respectively. At our current dividend rate of $1.90 per share per annum, we expect our aggregate dividend payments in 2020 to be approximately $121.7 million.
The following table sets forth the dividends per share we have declared in each of the quarterly periods of 2019 and 2018: Fiscal 2019 Fiscal 2018 Fourth Quarter . . . . . . . . . . . . . . . . . . . . . . . . . . . . . . . . . . . . . . . . . . . . . . . . . . . . . . . . . . . . . . . . $ 0.475 $ 0.475 Third Quarter . . . . . . . . . . . . . . . . . . . . . . . . . . . . . . . . . . . . . . . . . . . . . . . . . . . . . . . . . . . . . . . . . $ 0.475 $ 0.475 Second Quarter . . . . . . . . . . . . . . . . . . . . . . . . . . . . . . . . . . . . . . . . . . . . . . . . . . . . . . . . . . . . . . . $ 0.475 $ 0.475 First Quarter . . . . . . . . . . . . . . . . . . . . . . . . . . . . . . . . . . . . . . . . . . . . . . . . . . . . . . . . . . . . . . . . . . $ 0.475 $ 0.465
Under U.S. federal income tax law, distributions to holders of our common stock are taxable to the extent they are paid out of current or accumulated earnings and profits. Generally, the portion of the distribution treated as a return of capital should reduce the tax basis in the shares of common stock up to a holder’s adjusted basis in the common stock, with any excess treated as capital gains. Qualifying dividend income and the return of capital, if any, will be allocated on a pro-forma basis to all distributions for each fiscal year. Based on U.S. federal income tax laws, B&G Foods has determined that for fiscal 2019 and fiscal 2018, approximately 92.5% and 0.0%, respectively, of distributions paid on common stock were treated as a return of capital and approximately 7.5% and 100.0%, respectively, were treated as a taxable dividend paid from earnings and profits.
Our dividend policy is based upon our current assessment of our business and the environment in which we operate, and that assessment could change based on competitive or other developments (which could, for example, increase our need for capital expenditures or working capital), new acquisition opportunities or other factors. Our board of directors is free to depart from or change our dividend policy at any time and could do so, for example, if it was to determine that we have insufficient cash to take advantage of growth opportunities.
Restrictions on Dividend Payments
Our ability to pay future dividends, if any, with respect to shares of our capital stock will depend on, among other things, our results of operations, cash requirements, financial condition, contractual restrictions, provisions of applicable law and other factors that our board of directors may deem relevant. Under Delaware law, our board of directors may declare dividends only to the extent of our “surplus” (which is defined as total assets at fair market value minus total liabilities, minus statutory capital), or if there is no surplus, out of our net profits for the then current and/or immediately preceding fiscal years. Our board of directors will periodically and from time to time assess the appropriateness of the then current dividend policy before actually declaring any dividends.
In general, our senior notes indentures restrict our ability to declare and pay dividends on our common stock as follows:
• we may use up to 100% of our excess cash (as defined below) for the period (taken as one accounting period) from and including March 31, 2013 to the end of our most recent fiscal quarter for which internal financial statements are available at the time of such payments, plus certain incremental funds described in the indentures for the payment of dividends so long as the fixed charge coverage ratio for the four most recent fiscal quarters for which internal financial statements are available is not less than 1.6 to 1.0; and
- 28 -
• we may not pay any dividends on any dividend payment date if a default or event of default under our indentures has occurred or is continuing.
Excess cash is defined in our senior notes indentures and under the terms of our credit agreement. Excess cash is calculated as “consolidated cash flow,” as defined in the indentures and under the terms of our credit agreement (which, in each case, allows for certain adjustments and which is equivalent to the term adjusted EBITDA), minus the sum of cash tax expense, cash interest expense, certain capital expenditures, excess tax benefit from issuance of performance share long-term incentive award (LTIA) shares, certain repayment of indebtedness and the cash portion of restructuring charges.
In addition, the terms of our credit agreement also restrict our ability to declare and pay dividends on our common stock. In accordance with the terms of our credit agreement, we are not permitted to declare or pay dividends unless we are permitted to do so under our senior notes indentures. In addition, our credit agreement does not permit us to pay dividends unless we maintain:
• a “consolidated interest coverage ratio” (defined as the ratio on a pro forma basis of our adjusted EBITDA for any period of four consecutive fiscal quarters to our consolidated interest expense for such period payable in cash) of not less than 1.75 to 1.00; and
• a “consolidated leverage ratio” (defined as the ratio on a pro forma basis of our consolidated net debt, as of the last day of any period of four consecutive fiscal quarters to our adjusted EBITDA for such period) of not more than 7.00 to 1.00.
Recent Sales of Unregistered Securities
We did not issue any unregistered securities in fiscal 2019.
Issuer Purchases of Equity Securities
Not applicable.
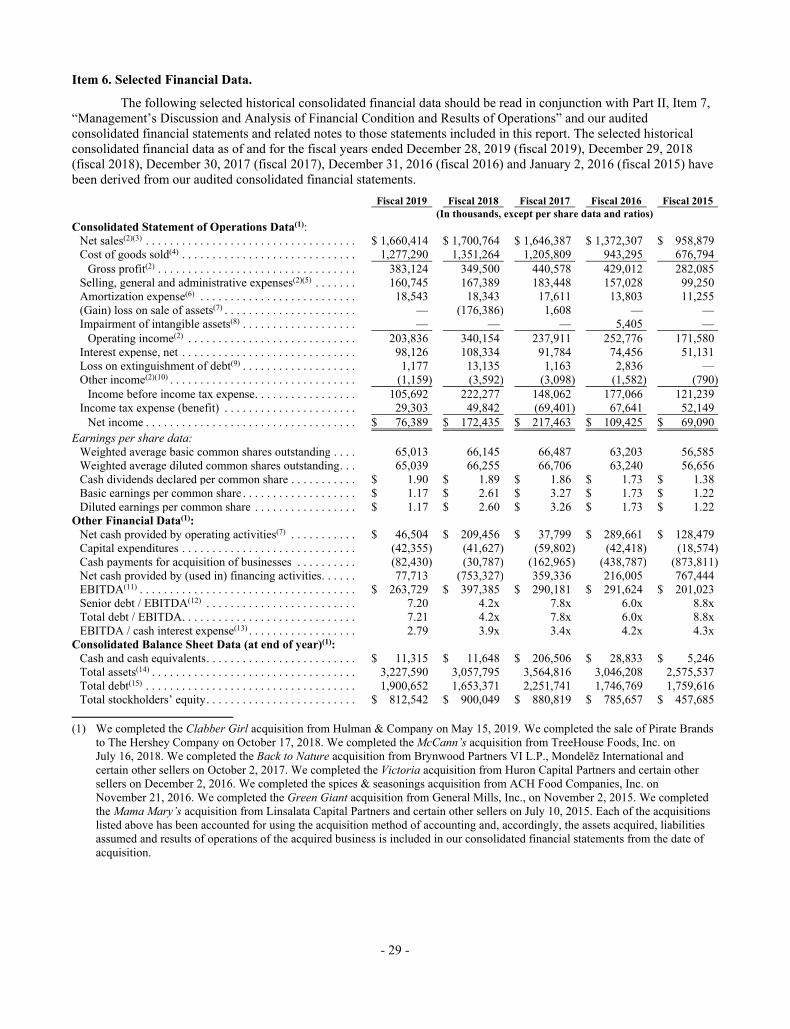
- 29 -
Item 6. Selected Financial Data.
The following selected historical consolidated financial data should be read in conjunction with Part II, Item 7, “Management’s Discussion and Analysis of Financial Condition and Results of Operations” and our audited consolidated financial statements and related notes to those statements included in this report. The selected historical consolidated financial data as of and for the fiscal years ended December 28, 2019 (fiscal 2019), December 29, 2018 (fiscal 2018), December 30, 2017 (fiscal 2017), December 31, 2016 (fiscal 2016) and January 2, 2016 (fiscal 2015) have been derived from our audited consolidated financial statements. Fiscal 2019 Fiscal 2018 Fiscal 2017 Fiscal 2016 Fiscal 2015 (In thousands, except per share data and ratios) Consolidated Statement of Operations Data(1):
Net sales(2)(3) . . . . . . . . . . . . . . . . . . . . . . . . . . . . . . . . . . . $ 1,660,414 $ 1,700,764 $ 1,646,387 $ 1,372,307 $ 958,879 Cost of goods sold(4) . . . . . . . . . . . . . . . . . . . . . . . . . . . . . 1,277,290 1,351,264 1,205,809 943,295 676,794
Gross profit(2) . . . . . . . . . . . . . . . . . . . . . . . . . . . . . . . . . 383,124 349,500 440,578 429,012 282,085 Selling, general and administrative expenses(2)(5) . . . . . . . 160,745 167,389 183,448 157,028 99,250 Amortization expense(6) . . . . . . . . . . . . . . . . . . . . . . . . . . 18,543 18,343 17,611 13,803 11,255 (Gain) loss on sale of assets(7) . . . . . . . . . . . . . . . . . . . . . . — (176,386) 1,608 — — Impairment of intangible assets(8) . . . . . . . . . . . . . . . . . . . — — — 5,405 —
Operating income(2) . . . . . . . . . . . . . . . . . . . . . . . . . . . . 203,836 340,154 237,911 252,776 171,580 Interest expense, net . . . . . . . . . . . . . . . . . . . . . . . . . . . . . 98,126 108,334 91,784 74,456 51,131 Loss on extinguishment of debt(9) . . . . . . . . . . . . . . . . . . . 1,177 13,135 1,163 2,836 — Other income(2)(10) . . . . . . . . . . . . . . . . . . . . . . . . . . . . . . . (1,159) (3,592) (3,098) (1,582) (790)
Income before income tax expense . . . . . . . . . . . . . . . . . 105,692 222,277 148,062 177,066 121,239 Income tax expense (benefit) . . . . . . . . . . . . . . . . . . . . . . 29,303 49,842 (69,401) 67,641 52,149
Net income . . . . . . . . . . . . . . . . . . . . . . . . . . . . . . . . . . . $ 76,389 $ 172,435 $ 217,463 $ 109,425 $ 69,090 Earnings per share data:
Weighted average basic common shares outstanding . . . . 65,013 66,145 66,487 63,203 56,585 Weighted average diluted common shares outstanding . . . 65,039 66,255 66,706 63,240 56,656 Cash dividends declared per common share . . . . . . . . . . . $ 1.90 $ 1.89 $ 1.86 $ 1.73 $ 1.38 Basic earnings per common share . . . . . . . . . . . . . . . . . . . $ 1.17 $ 2.61 $ 3.27 $ 1.73 $ 1.22 Diluted earnings per common share . . . . . . . . . . . . . . . . . $ 1.17 $ 2.60 $ 3.26 $ 1.73 $ 1.22
Other Financial Data(1): Net cash provided by operating activities(7) . . . . . . . . . . . $ 46,504 $ 209,456 $ 37,799 $ 289,661 $ 128,479 Capital expenditures . . . . . . . . . . . . . . . . . . . . . . . . . . . . . (42,355) (41,627) (59,802) (42,418) (18,574)Cash payments for acquisition of businesses . . . . . . . . . . (82,430) (30,787) (162,965) (438,787) (873,811)Net cash provided by (used in) financing activities . . . . . . 77,713 (753,327) 359,336 216,005 767,444 EBITDA(11) . . . . . . . . . . . . . . . . . . . . . . . . . . . . . . . . . . . . $ 263,729 $ 397,385 $ 290,181 $ 291,624 $ 201,023 Senior debt / EBITDA(12) . . . . . . . . . . . . . . . . . . . . . . . . . 7.20 4.2x 7.8x 6.0x 8.8x Total debt / EBITDA . . . . . . . . . . . . . . . . . . . . . . . . . . . . . 7.21 4.2x 7.8x 6.0x 8.8x EBITDA / cash interest expense(13) . . . . . . . . . . . . . . . . . . 2.79 3.9x 3.4x 4.2x 4.3x
Consolidated Balance Sheet Data (at end of year)(1): Cash and cash equivalents . . . . . . . . . . . . . . . . . . . . . . . . . $ 11,315 $ 11,648 $ 206,506 $ 28,833 $ 5,246 Total assets(14) . . . . . . . . . . . . . . . . . . . . . . . . . . . . . . . . . . 3,227,590 3,057,795 3,564,816 3,046,208 2,575,537 Total debt(15) . . . . . . . . . . . . . . . . . . . . . . . . . . . . . . . . . . . 1,900,652 1,653,371 2,251,741 1,746,769 1,759,616 Total stockholders’ equity . . . . . . . . . . . . . . . . . . . . . . . . . $ 812,542 $ 900,049 $ 880,819 $ 785,657 $ 457,685
(1) We completed the Clabber Girl acquisition from Hulman & Company on May 15, 2019. We completed the sale of Pirate Brands
to The Hershey Company on October 17, 2018. We completed the McCann’s acquisition from TreeHouse Foods, Inc. on July 16, 2018. We completed the Back to Nature acquisition from Brynwood Partners VI L.P., Mondelēz International and certain other sellers on October 2, 2017. We completed the Victoria acquisition from Huron Capital Partners and certain other sellers on December 2, 2016. We completed the spices & seasonings acquisition from ACH Food Companies, Inc. on November 21, 2016. We completed the Green Giant acquisition from General Mills, Inc., on November 2, 2015. We completed the Mama Mary’s acquisition from Linsalata Capital Partners and certain other sellers on July 10, 2015. Each of the acquisitions listed above has been accounted for using the acquisition method of accounting and, accordingly, the assets acquired, liabilities assumed and results of operations of the acquired business is included in our consolidated financial statements from the date of acquisition.

- 30 -
(2) In fiscal 2018, net sales, gross profit, selling, general and administrative expenses, operating income and other income for fiscal 2017, 2016 and 2015 were adjusted as a result of our retrospective adoption of new accounting standards relating to revenue recognition and the presentation of net periodic pension cost and net periodic post-retirement benefit costs. We also reclassified a $1.6 million pre-tax loss on sale of assets for fiscal 2017 from selling, general and administrative expenses to loss on sale of assets. The adjustments described above had no impact on net income or earnings per share. See Note 2(s), “Summary of Significant Accounting Policies — Recently Issued Accounting Standards” to our consolidated financial statements in Part II, Item 8 of this report, for detailed information.
(3) Fiscal 2019, 2018, 2017, 2016 and 2015 each contained 52 weeks. Net sales for fiscal 2015 were negatively impacted by $1.2 million of customer refunds, net of insurance recoveries, related to our November 2014 voluntary recall of certain Ortega and Las Palmas products.
(4) Cost of goods sold for fiscal 2019 includes $22.0 million of non-recurring expenses, $16.4 million of which relates to the trailing non-cash accounting impact of the underutilization of our manufacturing facilities in 2018 as we reduced inventory during the implementation of the inventory reduction plan, $0.9 million of which relates to amortization of acquisition-related inventory fair value step-up (for certain Clabber Girl inventory acquired and sold during the period) and $4.7 million of which relates to other non-recurring expenses. Cost of goods sold for fiscal 2018 includes $76.3 million of non-recurring expenses, including $66.3 million relating to the non-cash accounting impact of our inventory reduction plan and $10.0 million of warehouse, delivery and other costs associated with our transition from certain of our existing distribution centers to new distribution centers. Cost of goods sold for fiscal 2017 includes $2.4 million of amortization of acquisition-related inventory fair value step-up (for certain spices & seasonings business and Back to Nature inventory acquired and sold during the period) and a $3.3 million loss on disposal of inventory related to the write-off of discontinued and expired inventory from recent acquisitions. Fiscal 2016 includes $5.4 million of amortization of acquisition-related inventory fair value step-up (for certain spices & seasonings business inventory acquired and sold during the period and certain Green Giant inventory sold during the period) and a $0.8 million loss on disposal of inventory related to the impairment of Rickland Orchards. Fiscal 2015 includes $6.1 million of amortization of acquisition-related inventory fair value step-up (for certain Green Giant inventory acquired and sold during the period) and $0.5 million of charges, net of insurance recoveries, related to the Ortega and Las Palmas recall.
(5) Selling, general and administrative expenses for fiscal 2019 includes $16.7 million of acquisition/divestiture-related and non-recurring expenses, including acquisition and integration expenses for the Clabber Girl acquisition and transition expenses for the Pirate Brands sale, and severance and other expenses primarily relating to a workforce reduction. Selling, general and administrative expenses for fiscal 2018 includes $16.9 million of acquisition/divestiture-related and non-recurring expenses, including transition expenses for the Pirate Brands sale and acquisition and integration expenses for the McCann’s, Green Giant, spices & seasonings, Victoria and Back to Nature acquisitions. Selling, general and administrative expenses for fiscal 2017 includes $35.6 million of acquisition-related and non-recurring expenses, including acquisition and integration expenses for the Green Giant, spices & seasonings, Victoria and Back to Nature acquisitions, severance and hiring costs and a non-recurring startup surcharge paid to a co-packer. Selling, general and administrative expenses for fiscal 2016 includes $17.5 million of acquisition-related expenses for the Victoria, spices & seasonings, Green Giant and Mama Mary’s acquisitions and $1.3 million of distribution restructuring expenses. Selling, general and administrative expenses for fiscal 2015 includes $6.1 million of acquisition-related expenses for the Green Giant and Mama Mary’s acquisitions, $2.7 million of distribution restructuring expenses and $0.2 million of administrative expenses, net of insurance recoveries, related to the Ortega and Las Palmas recall.
(6) Amortization expense includes the amortization of customer relationships, finite-lived trademarks and other intangible assets acquired in the Clabber Girl, McCann’s, Back to Nature, Victoria, spices & seasonings, Green Giant, Mama Mary’s and prior acquisitions.
(7) During fiscal 2018, our divestiture of Pirate Brands resulted in a gain on sale of approximately $176.4 million. The gain on sale negatively impacted our income taxes for fiscal 2019 by approximately $73.9 million, which includes cash tax payments we made during fiscal 2019 of $44.7 million and a cash tax benefit we otherwise would have expected to receive of approximately $29.2 million. Excluding the negative tax impact of the gain on sale, our net cash provided by operating activities for fiscal 2019 would have been approximately $120.4 million. See Note 3, “Acquisitions and Divestitures” to our consolidated financial statements in Part II, Item 8 of this report, for detailed information. During fiscal 2017, we recorded a $1.6 million pre-tax loss as we sold to a third-party co-packer our Le Sueur, Minnesota research center, including the seed technology assets, property, plant and equipment.
(8) Impairment of intangible assets for fiscal 2016 includes a $4.5 million loss for the impairment of finite-lived trademarks and a $0.9 million loss for the impairment of customer relationships, both relating to Rickland Orchards.
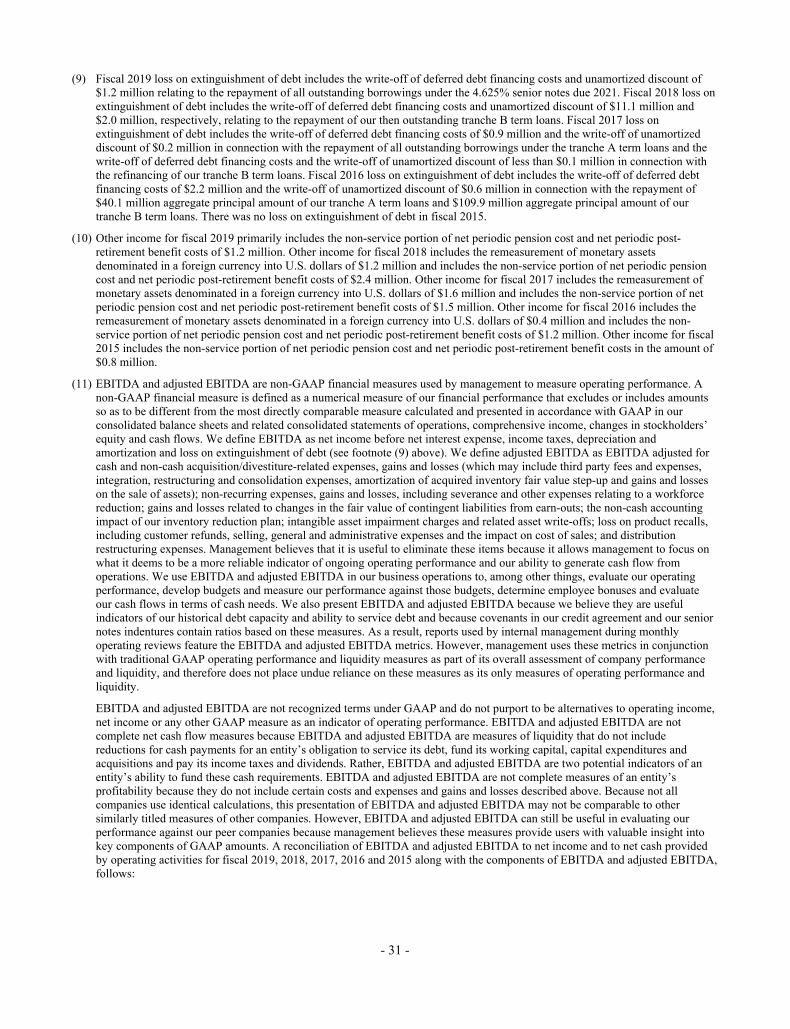
- 31 -
(9) Fiscal 2019 loss on extinguishment of debt includes the write-off of deferred debt financing costs and unamortized discount of $1.2 million relating to the repayment of all outstanding borrowings under the 4.625% senior notes due 2021. Fiscal 2018 loss on extinguishment of debt includes the write-off of deferred debt financing costs and unamortized discount of $11.1 million and $2.0 million, respectively, relating to the repayment of our then outstanding tranche B term loans. Fiscal 2017 loss on extinguishment of debt includes the write-off of deferred debt financing costs of $0.9 million and the write-off of unamortized discount of $0.2 million in connection with the repayment of all outstanding borrowings under the tranche A term loans and the write-off of deferred debt financing costs and the write-off of unamortized discount of less than $0.1 million in connection with the refinancing of our tranche B term loans. Fiscal 2016 loss on extinguishment of debt includes the write-off of deferred debt financing costs of $2.2 million and the write-off of unamortized discount of $0.6 million in connection with the repayment of $40.1 million aggregate principal amount of our tranche A term loans and $109.9 million aggregate principal amount of our tranche B term loans. There was no loss on extinguishment of debt in fiscal 2015.
(10) Other income for fiscal 2019 primarily includes the non-service portion of net periodic pension cost and net periodic post-retirement benefit costs of $1.2 million. Other income for fiscal 2018 includes the remeasurement of monetary assets denominated in a foreign currency into U.S. dollars of $1.2 million and includes the non-service portion of net periodic pension cost and net periodic post-retirement benefit costs of $2.4 million. Other income for fiscal 2017 includes the remeasurement of monetary assets denominated in a foreign currency into U.S. dollars of $1.6 million and includes the non-service portion of net periodic pension cost and net periodic post-retirement benefit costs of $1.5 million. Other income for fiscal 2016 includes the remeasurement of monetary assets denominated in a foreign currency into U.S. dollars of $0.4 million and includes the non-service portion of net periodic pension cost and net periodic post-retirement benefit costs of $1.2 million. Other income for fiscal 2015 includes the non-service portion of net periodic pension cost and net periodic post-retirement benefit costs in the amount of $0.8 million.
(11) EBITDA and adjusted EBITDA are non-GAAP financial measures used by management to measure operating performance. A non-GAAP financial measure is defined as a numerical measure of our financial performance that excludes or includes amounts so as to be different from the most directly comparable measure calculated and presented in accordance with GAAP in our consolidated balance sheets and related consolidated statements of operations, comprehensive income, changes in stockholders’ equity and cash flows. We define EBITDA as net income before net interest expense, income taxes, depreciation and amortization and loss on extinguishment of debt (see footnote (9) above). We define adjusted EBITDA as EBITDA adjusted for cash and non-cash acquisition/divestiture-related expenses, gains and losses (which may include third party fees and expenses, integration, restructuring and consolidation expenses, amortization of acquired inventory fair value step-up and gains and losses on the sale of assets); non-recurring expenses, gains and losses, including severance and other expenses relating to a workforce reduction; gains and losses related to changes in the fair value of contingent liabilities from earn-outs; the non-cash accounting impact of our inventory reduction plan; intangible asset impairment charges and related asset write-offs; loss on product recalls, including customer refunds, selling, general and administrative expenses and the impact on cost of sales; and distribution restructuring expenses. Management believes that it is useful to eliminate these items because it allows management to focus on what it deems to be a more reliable indicator of ongoing operating performance and our ability to generate cash flow from operations. We use EBITDA and adjusted EBITDA in our business operations to, among other things, evaluate our operating performance, develop budgets and measure our performance against those budgets, determine employee bonuses and evaluate our cash flows in terms of cash needs. We also present EBITDA and adjusted EBITDA because we believe they are useful indicators of our historical debt capacity and ability to service debt and because covenants in our credit agreement and our senior notes indentures contain ratios based on these measures. As a result, reports used by internal management during monthly operating reviews feature the EBITDA and adjusted EBITDA metrics. However, management uses these metrics in conjunction with traditional GAAP operating performance and liquidity measures as part of its overall assessment of company performance and liquidity, and therefore does not place undue reliance on these measures as its only measures of operating performance and liquidity.
EBITDA and adjusted EBITDA are not recognized terms under GAAP and do not purport to be alternatives to operating income, net income or any other GAAP measure as an indicator of operating performance. EBITDA and adjusted EBITDA are not complete net cash flow measures because EBITDA and adjusted EBITDA are measures of liquidity that do not include reductions for cash payments for an entity’s obligation to service its debt, fund its working capital, capital expenditures and acquisitions and pay its income taxes and dividends. Rather, EBITDA and adjusted EBITDA are two potential indicators of an entity’s ability to fund these cash requirements. EBITDA and adjusted EBITDA are not complete measures of an entity’s profitability because they do not include certain costs and expenses and gains and losses described above. Because not all companies use identical calculations, this presentation of EBITDA and adjusted EBITDA may not be comparable to other similarly titled measures of other companies. However, EBITDA and adjusted EBITDA can still be useful in evaluating our performance against our peer companies because management believes these measures provide users with valuable insight into key components of GAAP amounts. A reconciliation of EBITDA and adjusted EBITDA to net income and to net cash provided by operating activities for fiscal 2019, 2018, 2017, 2016 and 2015 along with the components of EBITDA and adjusted EBITDA, follows:
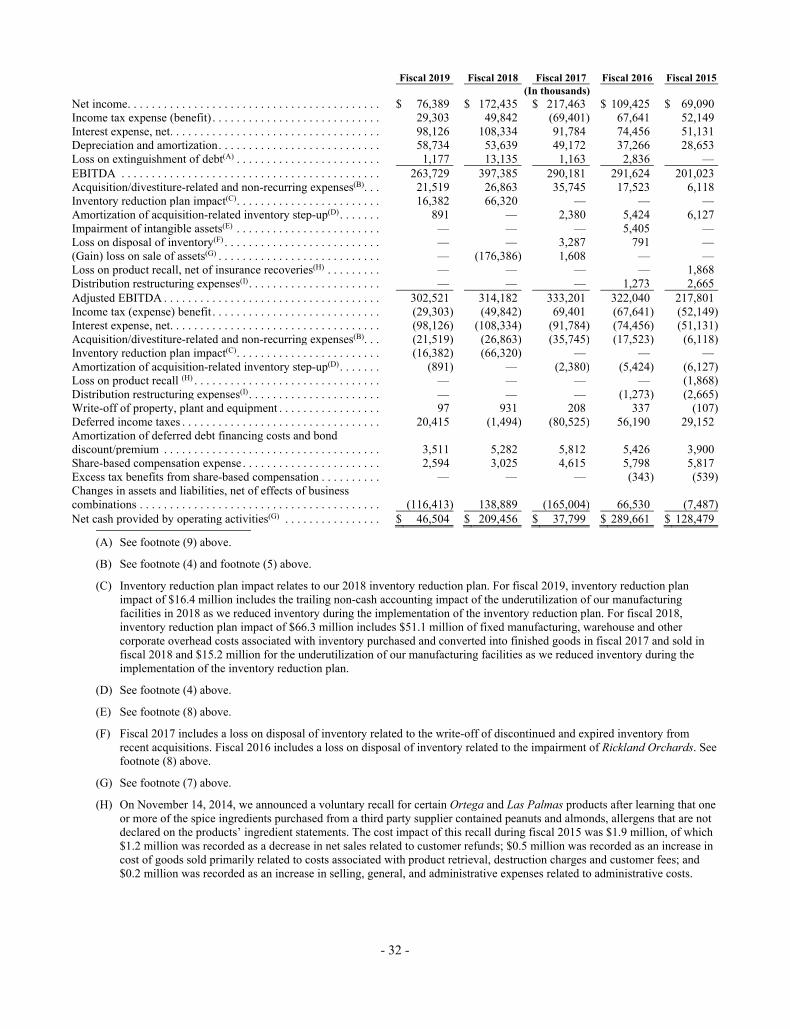
- 32 -
Fiscal 2019 Fiscal 2018 Fiscal 2017 Fiscal 2016 Fiscal 2015 (In thousands) Net income . . . . . . . . . . . . . . . . . . . . . . . . . . . . . . . . . . . . . . . . . . $ 76,389 $ 172,435 $ 217,463 $ 109,425 $ 69,090 Income tax expense (benefit) . . . . . . . . . . . . . . . . . . . . . . . . . . . . 29,303 49,842 (69,401) 67,641 52,149 Interest expense, net . . . . . . . . . . . . . . . . . . . . . . . . . . . . . . . . . . . 98,126 108,334 91,784 74,456 51,131 Depreciation and amortization . . . . . . . . . . . . . . . . . . . . . . . . . . . 58,734 53,639 49,172 37,266 28,653 Loss on extinguishment of debt(A) . . . . . . . . . . . . . . . . . . . . . . . . 1,177 13,135 1,163 2,836 — EBITDA . . . . . . . . . . . . . . . . . . . . . . . . . . . . . . . . . . . . . . . . . . . 263,729 397,385 290,181 291,624 201,023 Acquisition/divestiture-related and non-recurring expenses(B). . . 21,519 26,863 35,745 17,523 6,118 Inventory reduction plan impact(C) . . . . . . . . . . . . . . . . . . . . . . . . 16,382 66,320 — — — Amortization of acquisition-related inventory step-up(D) . . . . . . . 891 — 2,380 5,424 6,127 Impairment of intangible assets(E) . . . . . . . . . . . . . . . . . . . . . . . . — — — 5,405 — Loss on disposal of inventory(F) . . . . . . . . . . . . . . . . . . . . . . . . . . — — 3,287 791 — (Gain) loss on sale of assets(G) . . . . . . . . . . . . . . . . . . . . . . . . . . . — (176,386) 1,608 — — Loss on product recall, net of insurance recoveries(H) . . . . . . . . . — — — — 1,868 Distribution restructuring expenses(I) . . . . . . . . . . . . . . . . . . . . . . — — — 1,273 2,665 Adjusted EBITDA . . . . . . . . . . . . . . . . . . . . . . . . . . . . . . . . . . . . 302,521 314,182 333,201 322,040 217,801 Income tax (expense) benefit . . . . . . . . . . . . . . . . . . . . . . . . . . . . (29,303) (49,842) 69,401 (67,641) (52,149)Interest expense, net . . . . . . . . . . . . . . . . . . . . . . . . . . . . . . . . . . . (98,126) (108,334) (91,784) (74,456) (51,131)Acquisition/divestiture-related and non-recurring expenses(B). . . (21,519) (26,863) (35,745) (17,523) (6,118)Inventory reduction plan impact(C) . . . . . . . . . . . . . . . . . . . . . . . . (16,382) (66,320) — — — Amortization of acquisition-related inventory step-up(D) . . . . . . . (891) — (2,380) (5,424) (6,127)Loss on product recall (H) . . . . . . . . . . . . . . . . . . . . . . . . . . . . . . . — — — — (1,868)Distribution restructuring expenses(I) . . . . . . . . . . . . . . . . . . . . . . — — — (1,273) (2,665)Write-off of property, plant and equipment . . . . . . . . . . . . . . . . . 97 931 208 337 (107)Deferred income taxes . . . . . . . . . . . . . . . . . . . . . . . . . . . . . . . . . 20,415 (1,494) (80,525) 56,190 29,152 Amortization of deferred debt financing costs and bond discount/premium . . . . . . . . . . . . . . . . . . . . . . . . . . . . . . . . . . . . 3,511 5,282 5,812 5,426 3,900 Share-based compensation expense . . . . . . . . . . . . . . . . . . . . . . . 2,594 3,025 4,615 5,798 5,817 Excess tax benefits from share-based compensation . . . . . . . . . . — — — (343) (539)Changes in assets and liabilities, net of effects of business combinations . . . . . . . . . . . . . . . . . . . . . . . . . . . . . . . . . . . . . . . . (116,413) 138,889 (165,004) 66,530 (7,487)Net cash provided by operating activities(G) . . . . . . . . . . . . . . . . $ 46,504 $ 209,456 $ 37,799 $ 289,661 $ 128,479
(A) See footnote (9) above.
(B) See footnote (4) and footnote (5) above.
(C) Inventory reduction plan impact relates to our 2018 inventory reduction plan. For fiscal 2019, inventory reduction plan impact of $16.4 million includes the trailing non-cash accounting impact of the underutilization of our manufacturing facilities in 2018 as we reduced inventory during the implementation of the inventory reduction plan. For fiscal 2018, inventory reduction plan impact of $66.3 million includes $51.1 million of fixed manufacturing, warehouse and other corporate overhead costs associated with inventory purchased and converted into finished goods in fiscal 2017 and sold in fiscal 2018 and $15.2 million for the underutilization of our manufacturing facilities as we reduced inventory during the implementation of the inventory reduction plan.
(D) See footnote (4) above.
(E) See footnote (8) above.
(F) Fiscal 2017 includes a loss on disposal of inventory related to the write-off of discontinued and expired inventory from recent acquisitions. Fiscal 2016 includes a loss on disposal of inventory related to the impairment of Rickland Orchards. See footnote (8) above.
(G) See footnote (7) above.
(H) On November 14, 2014, we announced a voluntary recall for certain Ortega and Las Palmas products after learning that one or more of the spice ingredients purchased from a third party supplier contained peanuts and almonds, allergens that are not declared on the products’ ingredient statements. The cost impact of this recall during fiscal 2015 was $1.9 million, of which $1.2 million was recorded as a decrease in net sales related to customer refunds; $0.5 million was recorded as an increase in cost of goods sold primarily related to costs associated with product retrieval, destruction charges and customer fees; and $0.2 million was recorded as an increase in selling, general, and administrative expenses related to administrative costs.
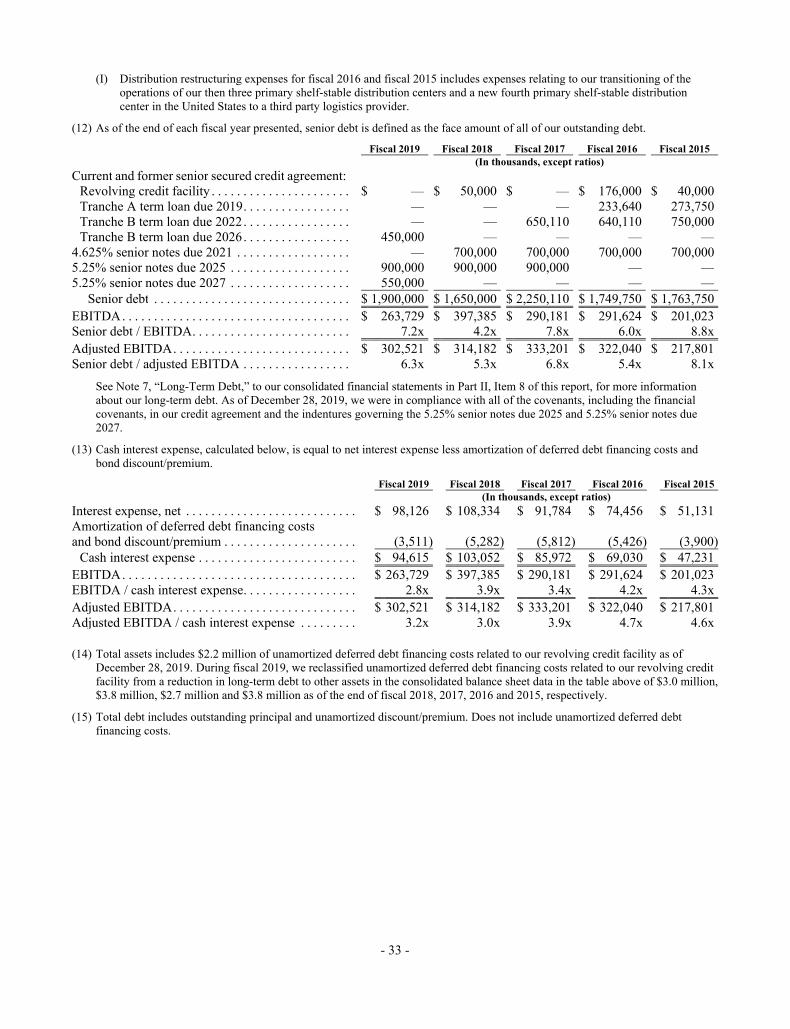
- 33 -
(I) Distribution restructuring expenses for fiscal 2016 and fiscal 2015 includes expenses relating to our transitioning of the operations of our then three primary shelf-stable distribution centers and a new fourth primary shelf-stable distribution center in the United States to a third party logistics provider.
(12) As of the end of each fiscal year presented, senior debt is defined as the face amount of all of our outstanding debt. Fiscal 2019 Fiscal 2018 Fiscal 2017 Fiscal 2016 Fiscal 2015 (In thousands, except ratios) Current and former senior secured credit agreement:
Revolving credit facility . . . . . . . . . . . . . . . . . . . . . . $ — $ 50,000 $ — $ 176,000 $ 40,000 Tranche A term loan due 2019 . . . . . . . . . . . . . . . . . — — — 233,640 273,750 Tranche B term loan due 2022 . . . . . . . . . . . . . . . . . — — 650,110 640,110 750,000 Tranche B term loan due 2026 . . . . . . . . . . . . . . . . . 450,000 — — — —
4.625% senior notes due 2021 . . . . . . . . . . . . . . . . . . — 700,000 700,000 700,000 700,000 5.25% senior notes due 2025 . . . . . . . . . . . . . . . . . . . 900,000 900,000 900,000 — — 5.25% senior notes due 2027 . . . . . . . . . . . . . . . . . . . 550,000 — — — —
Senior debt . . . . . . . . . . . . . . . . . . . . . . . . . . . . . . . $ 1,900,000 $ 1,650,000 $ 2,250,110 $ 1,749,750 $ 1,763,750 EBITDA . . . . . . . . . . . . . . . . . . . . . . . . . . . . . . . . . . . . $ 263,729 $ 397,385 $ 290,181 $ 291,624 $ 201,023 Senior debt / EBITDA . . . . . . . . . . . . . . . . . . . . . . . . . 7.2x 4.2x 7.8x 6.0x 8.8x Adjusted EBITDA . . . . . . . . . . . . . . . . . . . . . . . . . . . . $ 302,521 $ 314,182 $ 333,201 $ 322,040 $ 217,801 Senior debt / adjusted EBITDA . . . . . . . . . . . . . . . . . 6.3x 5.3x 6.8x 5.4x 8.1x
See Note 7, “Long-Term Debt,” to our consolidated financial statements in Part II, Item 8 of this report, for more information about our long-term debt. As of December 28, 2019, we were in compliance with all of the covenants, including the financial covenants, in our credit agreement and the indentures governing the 5.25% senior notes due 2025 and 5.25% senior notes due 2027.
(13) Cash interest expense, calculated below, is equal to net interest expense less amortization of deferred debt financing costs and bond discount/premium.
Fiscal 2019 Fiscal 2018 Fiscal 2017 Fiscal 2016 Fiscal 2015 (In thousands, except ratios) Interest expense, net . . . . . . . . . . . . . . . . . . . . . . . . . . . $ 98,126 $ 108,334 $ 91,784 $ 74,456 $ 51,131 Amortization of deferred debt financing costs and bond discount/premium . . . . . . . . . . . . . . . . . . . . . (3,511) (5,282) (5,812) (5,426) (3,900)
Cash interest expense . . . . . . . . . . . . . . . . . . . . . . . . . $ 94,615 $ 103,052 $ 85,972 $ 69,030 $ 47,231 EBITDA . . . . . . . . . . . . . . . . . . . . . . . . . . . . . . . . . . . . . $ 263,729 $ 397,385 $ 290,181 $ 291,624 $ 201,023 EBITDA / cash interest expense . . . . . . . . . . . . . . . . . . 2.8x 3.9x 3.4x 4.2x 4.3x Adjusted EBITDA . . . . . . . . . . . . . . . . . . . . . . . . . . . . . $ 302,521 $ 314,182 $ 333,201 $ 322,040 $ 217,801 Adjusted EBITDA / cash interest expense . . . . . . . . . 3.2x 3.0x 3.9x 4.7x 4.6x
(14) Total assets includes $2.2 million of unamortized deferred debt financing costs related to our revolving credit facility as of
December 28, 2019. During fiscal 2019, we reclassified unamortized deferred debt financing costs related to our revolving credit facility from a reduction in long-term debt to other assets in the consolidated balance sheet data in the table above of $3.0 million, $3.8 million, $2.7 million and $3.8 million as of the end of fiscal 2018, 2017, 2016 and 2015, respectively.
(15) Total debt includes outstanding principal and unamortized discount/premium. Does not include unamortized deferred debt financing costs.
- 34 -
Item 7. Management’s Discussion and Analysis of Financial Condition and Results of Operations.
The following Management’s Discussion and Analysis of Financial Condition and Results of Operations contains forward-looking statements that involve risks and uncertainties. Our actual results could differ materially from those anticipated in these forward-looking statements as a result of certain factors, including those set forth under Part I, Item 1A, “Risk Factors,” under the heading “Forward-Looking Statements” before Part I of this report and elsewhere in this report. The following discussion should be read in conjunction with the consolidated financial statements and related notes included elsewhere in this report.
General
We manufacture, sell and distribute a diverse portfolio of branded, high quality, shelf-stable and frozen foods and household products, many of which have leading regional or national market shares. In general, we position our branded products to appeal to the consumer desiring a high quality and reasonably priced product. We complement our branded product retail sales with institutional and foodservice sales and private label sales.
Our company has been built upon a successful track record of acquisition-driven growth. Our goal is to continue to increase sales, profitability and cash flows through strategic acquisitions, new product development and organic growth. We intend to implement our growth strategy through the following initiatives: expanding our brand portfolio with disciplined acquisitions of complementary branded businesses, continuing to develop new products and delivering them to market quickly, leveraging our multiple channel sales and distribution system and continuing to focus on higher growth customers and distribution channels.
Since 1996, we have successfully acquired and integrated more than 50 brands into our company. Most recently, on May 15, 2019, we acquired the Clabber Girl Corporation, including the Clabber Girl, Rumford, Davis, Hearth Club and Royal brands of retail baking powder, baking soda and corn starch, and the Royal brand of foodservice dessert mixes, from Hulman & Company. On July 16, 2018, we acquired the McCann’s brand of premium Irish oatmeal from TreeHouse Foods, Inc. We refer to these acquisitions in this report as the “Clabber Girl” acquisition and the “McCann’s acquisition.” Both of these recent acquisitions have been accounted for using the acquisition method of accounting and, accordingly, the assets acquired, liabilities assumed and results of operations of the acquired businesses are included in our consolidated financial statements from the date of acquisition. These acquisitions and the application of the acquisition method of accounting affect comparability between periods.
On October 17, 2018, we sold Pirate Brands, which includes the Pirate’s Booty, Smart Puffs and Original Tings brands, to The Hershey Company for a purchase price of $420.0 million in cash. We refer to this divestiture in this report as the “Pirate Brands sale.” We recognized a pre-tax gain on the Pirate Brands sale of $176.4 million. This divestiture affects comparability between periods.
We are subject to a number of challenges that may adversely affect our businesses. These challenges, which are discussed above before Part I of this report under the heading “Forward-Looking Statements” and in Part I, Item 1A, “Risk Factors” include:
Fluctuations in Commodity Prices and Production and Distribution Costs. We purchase raw materials, including agricultural products, meat, poultry, ingredients and packaging materials from growers, commodity processors, other food companies and packaging suppliers located in U.S. and foreign locations. Raw materials and other input costs, such as fuel and transportation, are subject to fluctuations in price attributable to a number of factors. Fluctuations in commodity prices can lead to retail price volatility and intensive price competition, and can influence consumer and trade buying patterns. The cost of raw materials, fuel, labor, distribution and other costs related to our operations can increase from time to time significantly and unexpectedly. For example, we have experienced industry-wide significant increases in freight expenses and we expect freight expenses to continue to remain elevated for the foreseeable future.
We attempt to manage cost inflation risks by locking in prices through short-term supply contracts and advance commodities purchase agreements and by implementing cost saving measures. We also attempt to offset rising input costs by raising sales prices to our customers. However, increases in the prices we charge our customers may lag behind rising input costs. Competitive pressures also may limit our ability to quickly raise prices in response to rising costs.
- 35 -
We experienced moderate net cost increases for raw materials during fiscal 2019 and fiscal 2018 and anticipate higher raw materials cost increases for fiscal 2020. We are currently locked into our supply and prices for a majority of our most significant commodities (excluding, among others, maple syrup) through fiscal 2020.
During 2019 and 2018, we were negatively impacted by industry-wide increases in the cost of distribution, primarily driven by freight costs. Despite higher rates for freight in 2019, we were able to offset these increases, in part as a result of our 2019 pricing strategy that included both list price increases as well as a trade spend optimization program. Separately, we also benefited in 2019 from our distribution re-alignment efforts which helped to optimize both our shelf-stable and our frozen distribution networks.
To the extent we are unable to avoid or offset any present or future cost increases by locking in our costs, implementing cost saving measures or increasing prices to our customers, our operating results could be materially adversely affected. In addition, if input costs begin to decline, customers may look for price reductions in situations where we have locked into purchases at higher costs.
Consolidation in the Retail Trade and Consequent Inventory Reductions. As the retail grocery trade continues to consolidate and our retail customers grow larger and become more sophisticated, our retail customers may demand lower pricing and increased promotional programs. These customers are also reducing their inventories and increasing their emphasis on private label products.
Changing Consumer Preferences. Consumers in the market categories in which we compete frequently change their taste preferences, dietary habits and product packaging preferences.
Consumer Concern Regarding Food Safety, Quality and Health. The food industry is subject to consumer concerns regarding the safety and quality of certain food products. If consumers in our principal markets lose confidence in the safety and quality of our food products, even as a result of a product liability claim or a product recall by a food industry competitor, our business could be adversely affected.
Fluctuations in Currency Exchange Rates. Our foreign sales are primarily to customers in Canada. Our sales to Canada are generally denominated in Canadian dollars and our sales for export to other countries are generally denominated in U.S. dollars. During fiscal 2019 and fiscal 2018, our net sales to customers in foreign countries represented approximately 7.7% and 7.3%, respectively, of our total net sales. We also purchase a significant majority of our maple syrup requirements from suppliers located in Québec, Canada. Any weakening of the U.S. dollar against the Canadian dollar could significantly increase our costs relating to the production of our maple syrup products to the extent we have not purchased Canadian dollars in advance of any such weakening of the U.S. dollar or otherwise entered into a currency hedging arrangement in advance of any such weakening of the U.S. dollar. These increased costs would not be fully offset by the positive impact the change in the relative strength of the Canadian dollar versus the U.S. dollar would have on our net sales in Canada. Our purchases of raw materials from other foreign suppliers are generally denominated in U.S. dollars. We also operate a manufacturing facility in Irapuato, Mexico for the manufacture of Green Giant frozen products and are as a result exposed to fluctuations in the Mexican peso. Our results of operations could be adversely impacted by changes in foreign currency exchange rates. Costs and expenses in Mexico are recognized in local foreign currency, and therefore we are exposed to potential gains or losses from the translation of those amounts into U.S. dollars for consolidation into our consolidated financial statements.
To confront these challenges, we continue to take steps to build the value of our brands, to improve our existing portfolio of products with new product and marketing initiatives, to reduce costs through improved productivity, to address consumer concerns about food safety, quality and health and to favorably manage currency fluctuations.
Critical Accounting Policies; Use of Estimates
The preparation of financial statements in accordance with generally accepted accounting principles in the United States (GAAP) requires our management to make a number of estimates and assumptions relating to the reporting of assets and liabilities and the disclosure of contingent assets and liabilities at the date of the consolidated financial statements and the reported amounts of revenues and expenses during the reporting period. Some of the more significant estimates and assumptions made by management involve revenue recognition as it relates to trade and consumer promotion expenses; pension benefits; acquisition accounting fair value allocations; the recoverability of goodwill, other intangible assets, property, plant and equipment, and deferred tax assets; and the determination of the useful life of customer relationship and finite-lived trademark intangible assets. Actual results could differ significantly from these estimates and assumptions.
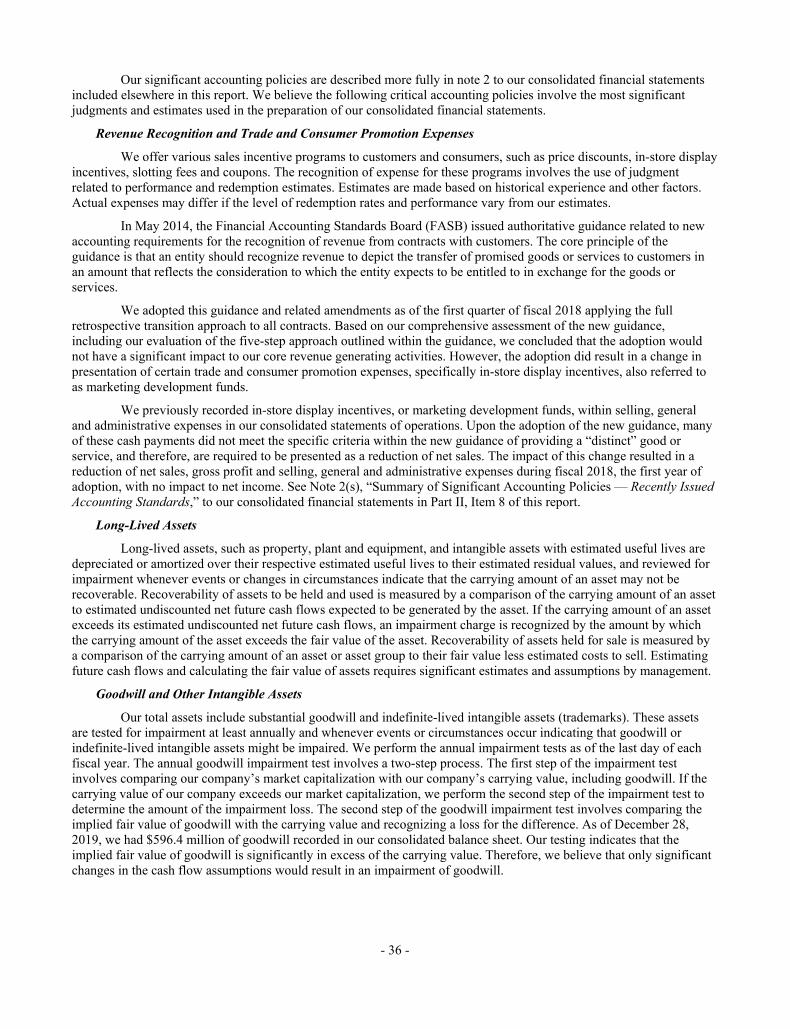
- 36 -
Our significant accounting policies are described more fully in note 2 to our consolidated financial statements included elsewhere in this report. We believe the following critical accounting policies involve the most significant judgments and estimates used in the preparation of our consolidated financial statements.
Revenue Recognition and Trade and Consumer Promotion Expenses
We offer various sales incentive programs to customers and consumers, such as price discounts, in-store display incentives, slotting fees and coupons. The recognition of expense for these programs involves the use of judgment related to performance and redemption estimates. Estimates are made based on historical experience and other factors. Actual expenses may differ if the level of redemption rates and performance vary from our estimates.
In May 2014, the Financial Accounting Standards Board (FASB) issued authoritative guidance related to new accounting requirements for the recognition of revenue from contracts with customers. The core principle of the guidance is that an entity should recognize revenue to depict the transfer of promised goods or services to customers in an amount that reflects the consideration to which the entity expects to be entitled to in exchange for the goods or services.
We adopted this guidance and related amendments as of the first quarter of fiscal 2018 applying the full retrospective transition approach to all contracts. Based on our comprehensive assessment of the new guidance, including our evaluation of the five-step approach outlined within the guidance, we concluded that the adoption would not have a significant impact to our core revenue generating activities. However, the adoption did result in a change in presentation of certain trade and consumer promotion expenses, specifically in-store display incentives, also referred to as marketing development funds.
We previously recorded in-store display incentives, or marketing development funds, within selling, general and administrative expenses in our consolidated statements of operations. Upon the adoption of the new guidance, many of these cash payments did not meet the specific criteria within the new guidance of providing a “distinct” good or service, and therefore, are required to be presented as a reduction of net sales. The impact of this change resulted in a reduction of net sales, gross profit and selling, general and administrative expenses during fiscal 2018, the first year of adoption, with no impact to net income. See Note 2(s), “Summary of Significant Accounting Policies — Recently Issued Accounting Standards,” to our consolidated financial statements in Part II, Item 8 of this report.
Long-Lived Assets
Long-lived assets, such as property, plant and equipment, and intangible assets with estimated useful lives are depreciated or amortized over their respective estimated useful lives to their estimated residual values, and reviewed for impairment whenever events or changes in circumstances indicate that the carrying amount of an asset may not be recoverable. Recoverability of assets to be held and used is measured by a comparison of the carrying amount of an asset to estimated undiscounted net future cash flows expected to be generated by the asset. If the carrying amount of an asset exceeds its estimated undiscounted net future cash flows, an impairment charge is recognized by the amount by which the carrying amount of the asset exceeds the fair value of the asset. Recoverability of assets held for sale is measured by a comparison of the carrying amount of an asset or asset group to their fair value less estimated costs to sell. Estimating future cash flows and calculating the fair value of assets requires significant estimates and assumptions by management.
Goodwill and Other Intangible Assets
Our total assets include substantial goodwill and indefinite-lived intangible assets (trademarks). These assets are tested for impairment at least annually and whenever events or circumstances occur indicating that goodwill or indefinite-lived intangible assets might be impaired. We perform the annual impairment tests as of the last day of each fiscal year. The annual goodwill impairment test involves a two-step process. The first step of the impairment test involves comparing our company’s market capitalization with our company’s carrying value, including goodwill. If the carrying value of our company exceeds our market capitalization, we perform the second step of the impairment test to determine the amount of the impairment loss. The second step of the goodwill impairment test involves comparing the implied fair value of goodwill with the carrying value and recognizing a loss for the difference. As of December 28, 2019, we had $596.4 million of goodwill recorded in our consolidated balance sheet. Our testing indicates that the implied fair value of goodwill is significantly in excess of the carrying value. Therefore, we believe that only significant changes in the cash flow assumptions would result in an impairment of goodwill.
- 37 -
We test our indefinite-lived intangible assets by comparing the fair value with the carrying value and recognize a loss for the difference. We estimate the fair value of our indefinite-lived intangible assets based on discounted cash flows that reflect certain third party market value indicators. Calculating our fair value for these purposes requires significant estimates and assumptions by management, including future cash flows consistent with management’s expectations, annual sales growth rates, and certain assumptions underlying a discount rate based on available market data. Significant management judgment is necessary to estimate the impact of competitive operating, macroeconomic and other factors to estimate the future levels of sales and cash flows.
We completed our annual impairment tests for fiscal 2019 and fiscal 2018 with no adjustments to the carrying values of goodwill and indefinite-lived intangible assets. As of December 28, 2019, we had $1,375.3 million of indefinite-lived intangible assets recorded in our consolidated balance sheet. None of our indefinite-lived intangible assets had a book value in excess of their calculated fair values and the percentage excess of the aggregate calculated fair value over the aggregate book value was approximately 154.4%. However, materially different assumptions regarding the future performance of our businesses could result in significant impairment losses. For example, if future revenues and contributions to our operating results for certain of our brands continue to decline and do not achieve our expected future cash flows, this could result in impairment losses for those brands. In addition, any significant decline in our market capitalization, even if due to macroeconomic factors, could put pressure on the carrying value of our goodwill. A determination that all or a portion of our goodwill or indefinite-lived intangible assets are impaired, although a non-cash charge to operations, could have a material adverse effect on our business, consolidated financial condition and results of operations.
The table below sets forth the book value as of December 28, 2019 of the indefinite-lived trademarks of each of our brands whose fiscal 2019 net sales were equal to or exceeded 3% of our total fiscal 2019 net sales and for “all other brands” in the aggregate: December 28, 2019 Brand: (In thousands)
Green Giant . . . . . . . . . . . . . . . . . . . . . . . . . . . . . . . . . . . . . . . . . . . . . . . . . . . . . . . . . . . . . . . $ 422,000 Mrs. Dash . . . . . . . . . . . . . . . . . . . . . . . . . . . . . . . . . . . . . . . . . . . . . . . . . . . . . . . . . . . . . . . . . 189,000 Back to Nature . . . . . . . . . . . . . . . . . . . . . . . . . . . . . . . . . . . . . . . . . . . . . . . . . . . . . . . . . . . . . 109,900 Spices & Seasonings(1) . . . . . . . . . . . . . . . . . . . . . . . . . . . . . . . . . . . . . . . . . . . . . . . . . . . . . . . 65,200 Ortega . . . . . . . . . . . . . . . . . . . . . . . . . . . . . . . . . . . . . . . . . . . . . . . . . . . . . . . . . . . . . . . . . . . . 32,339 Cream of Wheat . . . . . . . . . . . . . . . . . . . . . . . . . . . . . . . . . . . . . . . . . . . . . . . . . . . . . . . . . . . . 27,000 Clabber Girl(2) . . . . . . . . . . . . . . . . . . . . . . . . . . . . . . . . . . . . . . . . . . . . . . . . . . . . . . . . . . . . . 19,600 Maple Grove Farms of Vermont . . . . . . . . . . . . . . . . . . . . . . . . . . . . . . . . . . . . . . . . . . . . . . . 11,627 All other brands . . . . . . . . . . . . . . . . . . . . . . . . . . . . . . . . . . . . . . . . . . . . . . . . . . . . . . . . . . . . 498,634
Total indefinite-lived trademarks . . . . . . . . . . . . . . . . . . . . . . . . . . . . . . . . . . . . . . . . . . . . . $ 1,375,300
(1) The spices & seasonings acquisition was completed on November 21, 2016. Includes trademark values for multiple brands acquired as part of the acquisition.
(2) The Clabber Girl acquisition was completed on May 15, 2019. Includes trademark values for multiple brands acquired as part of the acquisition.
All assumptions used in our impairment evaluations for goodwill and indefinite-lived intangible assets, such as forecasted growth rates and discount rate, are based on the best available market information and are consistent with our internal forecasts and operating plans. We believe these assumptions to be reasonable, but they are inherently uncertain. These assumptions could be adversely impacted by certain of the risks described in Part I, Item 1A, “Risk Factors,” of this report.
Income Tax Expense Estimates and Policies
As part of the income tax provision process of preparing our consolidated financial statements, we are required to estimate our income taxes. This process involves estimating our current tax expenses together with assessing temporary differences resulting from differing treatment of items for tax and accounting purposes. These differences result in deferred tax assets and liabilities. We then assess the likelihood that our deferred tax assets will be recovered from future taxable income and to the extent we believe the recovery is not likely, we establish a valuation allowance. Further, to the extent that we establish a valuation allowance or increase this allowance in a financial accounting period,
- 38 -
we include such charge in our tax provision, or reduce our tax benefits in our consolidated statements of operations. We use our judgment to determine our provision or benefit for income taxes, deferred tax assets and liabilities and any valuation allowance recorded against our deferred tax assets.
There are various factors that may cause these tax assumptions to change in the near term, and we may have to record a valuation allowance against our deferred tax assets. We cannot predict whether future U.S. federal, state and international income tax laws and regulations might be passed that could have a material effect on our results of operations. We assess the impact of significant changes to the U.S. federal, state and international income tax laws and regulations on a regular basis and update the assumptions and estimates used to prepare our consolidated financial statements when new regulations and legislation are enacted. We recognize the benefit of an uncertain tax position that we have taken or expect to take on the income tax returns we file if it is more likely than not that such tax position will be sustained based upon its technical merits.
See “U.S. Tax Act” below for a discussion of the U.S. Tax Cuts and Jobs Act that was signed into law on December 22, 2017, and the impact it has had and may have on our business and financial results.
Pension Expense
We have defined benefit pension plans covering approximately 39.7% of our employees. Our funding policy is to contribute annually not less than the amount recommended by our actuaries. The funded status of our pension plans is dependent upon many factors, including returns on invested assets and the level of certain market interest rates, employee-related demographic factors, such as turnover, retirement age and mortality, and the rate of salary increases. Certain assumptions reflect our historical experience and management’s best judgment regarding future expectations. Due to the significant management judgment involved, our assumptions could have a material impact on the measurement of our pension expenses and obligations. We review pension assumptions regularly and we may from time to time make voluntary contributions to our pension plans, which exceed the amounts required by statute. We made total contributions to our pension plans of $5.0 million and $5.6 million during fiscal 2019 and fiscal 2018, respectively. Changes in interest rates and the market value of the securities held by the plans could materially change, positively or negatively, the funded status of the plans and affect the level of pension expense and required contributions in fiscal 2020 and beyond.
Our discount rate assumption for our four defined benefit plans changed from 4.08% - 4.18% at December 29, 2018 to 3.03% - 3.18% at December 28, 2019. While we do not currently anticipate a change in our fiscal 2020 assumptions, as a sensitivity measure, a 0.25% decrease or increase in our discount rate would increase or decrease our pension expense by approximately $0.9 million to $1.0 million. Similarly, a 0.25% decrease or increase in the expected return on pension plan assets would increase or decrease our pension expense by approximately $0.3 million. During fiscal 2020 we expect to make total defined benefit pension plan contributions of approximately $4.9 million, including approximately $4.0 million for our four company- sponsored defined benefit pension plans and approximately $0.9 million for the multi-employer defined benefit pension plan to which we contribute. See Note 12, “Pension Benefits,” to our consolidated financial statements in Part II, Item 8 of this report for additional information about pension expense and the pension plans to which we contribute.
Acquisition Accounting
Our consolidated financial statements and results of operations include an acquired business’s operations after the completion of the acquisition. We account for acquired businesses using the acquisition method of accounting, which requires that the assets acquired and liabilities assumed be recorded at the date of acquisition at their respective fair values. Any excess of the purchase price over the estimated fair values of the net assets acquired is recorded as goodwill. Transaction costs are expensed as incurred.
The judgments made in determining the estimated fair value assigned to each class of assets acquired and liabilities assumed, as well as asset lives, can materially impact our results of operations. Accordingly, for significant items, we typically obtain assistance from third party valuation specialists. Determining the useful life of an intangible asset also requires judgment as different types of intangible assets will have different useful lives and certain assets may even be considered to have indefinite useful lives. All of these judgments and estimates can materially impact our results of operations.
- 39 -
U.S. Tax Act
On December 22, 2017, President Trump signed into law the Tax Cuts and Jobs Act, which we refer to as the “U.S. Tax Act.” The U.S. Tax Act provides for significant changes in the U.S. Internal Revenue Code of 1986, as amended. The changes in the U.S. Tax Act are broad and complex and we continue to examine the impact the U.S. Tax Act may have on our business and financial results. The U.S. Tax Act contains provisions with separate effective dates but is generally effective for taxable years beginning after December 31, 2017.
Under FASB Accounting Standards Codification (ASC) Topic 740, Income Taxes, we are required to revalue any deferred tax assets or liabilities in the period of enactment of change in tax rates. Beginning on January 1, 2018, the U.S. Tax Act lowered the U.S. federal corporate income tax rate from 35% to 21% on our U.S. earnings from that date and beyond. The reduction in the corporate income tax rate from 35% to 21% was effective for our fiscal 2018 and subsequent years. Our consolidated effective tax rate was approximately 27.7% and 22.4% for fiscal 2019 and fiscal 2018, respectively.
We also expect to realize a cash tax benefit for future bonus depreciation on certain business additions, which, together with the reduced income tax rate, we expect to reduce our cash income tax payments.
The U.S. Tax Act also limits the deduction for net interest expense (including the treatment of depreciation and other deductions in arriving at adjusted taxable income) incurred by a corporate taxpayer to 30% of the taxpayer’s adjusted taxable income. We were not impacted by this limitation in fiscal 2018 due to the gain on the Pirate Brands sale which increased our adjusted taxable income. However, in fiscal 2019 this limitation resulted in an increase to our taxable income of $30.2 million, and we accordingly established a deferred tax asset of $7.4 million without a valuation allowance. Although our interest expense exceeded 30% of our adjusted taxable income in fiscal 2019, at this time we do not believe this limitation has had, or will have, a material adverse impact on our business or financial results because any interest that is non-deductible may be carried forward indefinitely and we believe we have sufficient deferred tax liabilities to offset any deferred tax assets resulting from currently non-deductible interest expense.
The U.S. Treasury issued several regulations supplementing the U.S. Tax Act in 2018, including detailed guidance clarifying the calculation of the mandatory tax on previously unrepatriated earnings, application of the existing foreign tax credit rules to newly created categories and expanding details for application of the base erosion tax on affiliate payments. These regulations are to be applied retroactively and did not materially impact our 2018 or 2019 tax rates.
The ultimate impact of the U.S. Tax Act on our reported results in fiscal 2020 and beyond may differ from the estimates provided in this report, possibly materially, due to guidance that may be issued and other actions we may take as a result of the U.S. Tax Act different from that currently contemplated.
- 40 -
Results of Operations
The following table sets forth the percentages of net sales represented by selected items for fiscal 2019 and fiscal 2018 reflected in our consolidated statements of operations. The comparisons of financial results are not necessarily indicative of future results: Fiscal 2019 Fiscal 2018 Statement of Operations Data: Net sales . . . . . . . . . . . . . . . . . . . . . . . . . . . . . . . . . . . . . . . . . . . . . . . . . . . . . . . . . . . . . . . . 100.0 % 100.0 % Cost of goods sold . . . . . . . . . . . . . . . . . . . . . . . . . . . . . . . . . . . . . . . . . . . . . . . . . . . . . . . . 76.9 % 79.5 %
Gross profit . . . . . . . . . . . . . . . . . . . . . . . . . . . . . . . . . . . . . . . . . . . . . . . . . . . . . . . . . . . 23.1 % 20.5 %
Operating expenses: Selling, general and administrative expenses . . . . . . . . . . . . . . . . . . . . . . . . . . . . . . . . . 9.7 % 9.8 % Amortization expense . . . . . . . . . . . . . . . . . . . . . . . . . . . . . . . . . . . . . . . . . . . . . . . . . . . . 1.1 % 1.1 % Gain on sale of assets . . . . . . . . . . . . . . . . . . . . . . . . . . . . . . . . . . . . . . . . . . . . . . . . . . . . — % (10.4)%
Operating income . . . . . . . . . . . . . . . . . . . . . . . . . . . . . . . . . . . . . . . . . . . . . . . . . . . . . . 12.3 % 20.0 %
Other income and expenses: Interest expense, net . . . . . . . . . . . . . . . . . . . . . . . . . . . . . . . . . . . . . . . . . . . . . . . . . . . . . 5.9 % 6.4 % Loss on extinguishment of debt . . . . . . . . . . . . . . . . . . . . . . . . . . . . . . . . . . . . . . . . . . . . 0.1 % 0.8 % Other income . . . . . . . . . . . . . . . . . . . . . . . . . . . . . . . . . . . . . . . . . . . . . . . . . . . . . . . . . . . (0.1)% (0.3)%
Income before income tax expense . . . . . . . . . . . . . . . . . . . . . . . . . . . . . . . . . . . . . . . . 6.4 % 13.1 % Income tax expense . . . . . . . . . . . . . . . . . . . . . . . . . . . . . . . . . . . . . . . . . . . . . . . . . . . . . . . 1.8 % 3.0 %
Net income . . . . . . . . . . . . . . . . . . . . . . . . . . . . . . . . . . . . . . . . . . . . . . . . . . . . . . . . . . . 4.6 % 10.1 %
As used in this section, the terms listed below have the following meanings:
Net Sales. Our net sales represents gross sales of products shipped to customers plus amounts charged to customers for shipping and handling, less cash discounts, coupon redemptions, slotting fees and trade promotional spending, including marketing development funds.
Gross Profit. Our gross profit is equal to our net sales less cost of goods sold. The primary components of our cost of goods sold are cost of internally manufactured products, purchases of finished goods from co-packers, a portion of our warehousing expenses plus freight costs to our distribution centers and to our customers.
Selling, General and Administrative Expenses. Our selling, general and administrative expenses include costs related to selling our products, as well as all other general and administrative expenses. Some of these costs include administrative, marketing and internal sales force employee compensation and benefits costs, consumer advertising programs, brokerage costs, a portion of our warehousing expenses, information technology and communication costs, office rent, utilities, supplies, professional services, severance, acquisition/divestiture-related and non-recurring expenses and other general corporate expenses.
Amortization Expense. Amortization expense includes the amortization expense associated with customer relationships, finite-lived trademarks and other intangible assets.
Gain on Sale of Assets. Gain on sale of assets includes a gain recognized on the Pirate Brands sale in fiscal 2018.
Net Interest Expense. Net interest expense includes interest relating to our outstanding indebtedness, amortization of bond discount and amortization of deferred debt financing costs (net of interest income).
Loss on Extinguishment of Debt. Loss on extinguishment of debt includes costs relating to the retirement of indebtedness, including repurchase premium, if any, and write-off of deferred debt financing costs and unamortized discount, if any.
Other Income. Other income includes income or expense resulting from the remeasurement of monetary assets denominated in a foreign currency into U.S. dollars for financial reporting purposes and the non-service portion of net periodic pension cost and net periodic post-retirement benefit costs.
- 41 -
Non-GAAP Financial Measures
Certain disclosures in this report include non-GAAP financial measures. A non-GAAP financial measure is defined as a numerical measure of our financial performance that excludes or includes amounts so as to be different from the most directly comparable measure calculated and presented in accordance with GAAP in our consolidated balance sheets and related consolidated statements of operations, comprehensive income, changes in stockholders’ equity and cash flows.
Base Business Net Sales. Base business net sales is a non-GAAP financial measure used by management to measure operating performance. We define base business net sales as our net sales excluding (1) the net sales of acquisitions until the net sales from such acquisitions are included in both comparable periods, (2) net sales of discontinued or divested brands and (3) net sales of our IQF bulk rice products, see footnote 2 to the table below. The portion of current period net sales attributable to recent acquisitions for which there is no corresponding period in the comparable period of the prior year is excluded. For each acquisition, the excluded period starts at the beginning of the most recent fiscal period being compared and ends on the first anniversary of the acquisition date. For discontinued or divested brands, the entire amount of net sales is excluded from each fiscal period being compared. We have included this financial measure because our management believes it provides useful and comparable trend information regarding the results of our business without the effect of the timing of acquisitions and the effect of discontinued or divested brands.
The definition of base business net sales set forth above, as it relates to acquisitions, was modified during the third quarter of 2019 from the definition we had most recently used. Under our most recent prior definition of base business net sales, for each acquisition, the excluded period started at the beginning of the most recent fiscal period being compared and ended on the last day of the quarter in which the first anniversary of the date of acquisition occurred. Our management believes that it is more useful to measure base business net sales on a partial quarter basis based upon the actual period of comparable ownership instead of adjusting for an entire quarter.
A reconciliation of base business net sales to net sales for fiscal 2019 and 2018 follows (in thousands): Fiscal 2019 Fiscal 2018 Net sales . . . . . . . . . . . . . . . . . . . . . . . . . . . . . . . . . . . . . . . . . . . . . . . . . . . . . . . . . . . . . . . . . $ 1,660,414 $ 1,700,764 Net sales from acquisitions(1) . . . . . . . . . . . . . . . . . . . . . . . . . . . . . . . . . . . . . . . . . . . . . . . . (59,455) — Net sales of non-branded IQF bulk rice products(2) . . . . . . . . . . . . . . . . . . . . . . . . . . . . . . — (1,494)Net sales from divested and discontinued brands(3) . . . . . . . . . . . . . . . . . . . . . . . . . . . . . . — (76,091)
Base business net sales . . . . . . . . . . . . . . . . . . . . . . . . . . . . . . . . . . . . . . . . . . . . . . . . . . . . $ 1,600,959 $ 1,623,179
(1) Fiscal 2019 includes net sales for Clabber Girl and also includes six and one-half months of net sales for McCann’s in 2019, for which there was no comparable period of net sales in fiscal 2018. McCann’s was acquired on July 16, 2018 and Clabber Girl was acquired on May 15, 2019.
(2) Reflects net sales of our non-branded individually quick frozen (IQF) bulk rice products, which is a product line we acquired as part of the Green Giant acquisition, and which we are excluding from net sales for the purposes of calculating base business net sales because we do not consider the non-branded IQF bulk rice products to be part of our core business or material. We discontinued the sale of non-branded IQF bulk rice products during the fourth quarter of 2018.
(3) Reflects $74.9 million of net sales of Pirate Brands and $1.2 million of net sales of French’s® seasoning mixes. We completed the divestiture of Pirate Brands on October 17, 2018. See Note 3, “Acquisitions and Divestitures,” to our consolidated financial statements in Part II, Item 8 of this report. We discontinued the sale of French’s products, which had been sold pursuant to a licensing agreement, during the third quarter of 2018.
EBITDA and Adjusted EBITDA. EBITDA and adjusted EBITDA are non-GAAP financial measures used by management to measure operating performance. We define EBITDA as net income before net interest expense, income taxes, depreciation and amortization and loss on extinguishment of debt. We define adjusted EBITDA as EBITDA adjusted for cash and non-cash acquisition/divestiture-related expenses, gains and losses (which may include third party fees and expenses, integration, restructuring and consolidation expenses, amortization of acquired inventory fair value step-up and gains and losses on the sale of assets); non-recurring expenses, gains and losses, including severance and other expenses relating to a workforce reduction; gains and losses related to changes in the fair value of contingent liabilities from earn-outs; the non-cash accounting impact of our inventory reduction plan; intangible asset impairment charges and related asset write-offs; loss on product recalls, including customer refunds, selling, general and
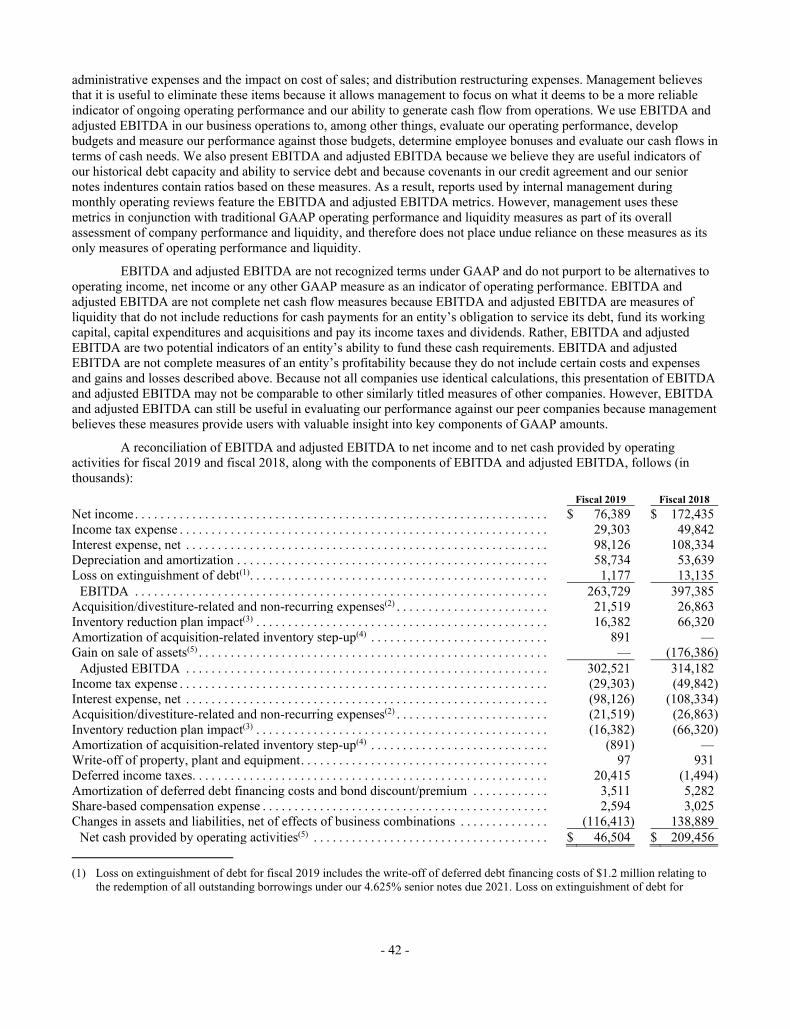
- 42 -
administrative expenses and the impact on cost of sales; and distribution restructuring expenses. Management believes that it is useful to eliminate these items because it allows management to focus on what it deems to be a more reliable indicator of ongoing operating performance and our ability to generate cash flow from operations. We use EBITDA and adjusted EBITDA in our business operations to, among other things, evaluate our operating performance, develop budgets and measure our performance against those budgets, determine employee bonuses and evaluate our cash flows in terms of cash needs. We also present EBITDA and adjusted EBITDA because we believe they are useful indicators of our historical debt capacity and ability to service debt and because covenants in our credit agreement and our senior notes indentures contain ratios based on these measures. As a result, reports used by internal management during monthly operating reviews feature the EBITDA and adjusted EBITDA metrics. However, management uses these metrics in conjunction with traditional GAAP operating performance and liquidity measures as part of its overall assessment of company performance and liquidity, and therefore does not place undue reliance on these measures as its only measures of operating performance and liquidity.
EBITDA and adjusted EBITDA are not recognized terms under GAAP and do not purport to be alternatives to operating income, net income or any other GAAP measure as an indicator of operating performance. EBITDA and adjusted EBITDA are not complete net cash flow measures because EBITDA and adjusted EBITDA are measures of liquidity that do not include reductions for cash payments for an entity’s obligation to service its debt, fund its working capital, capital expenditures and acquisitions and pay its income taxes and dividends. Rather, EBITDA and adjusted EBITDA are two potential indicators of an entity’s ability to fund these cash requirements. EBITDA and adjusted EBITDA are not complete measures of an entity’s profitability because they do not include certain costs and expenses and gains and losses described above. Because not all companies use identical calculations, this presentation of EBITDA and adjusted EBITDA may not be comparable to other similarly titled measures of other companies. However, EBITDA and adjusted EBITDA can still be useful in evaluating our performance against our peer companies because management believes these measures provide users with valuable insight into key components of GAAP amounts.
A reconciliation of EBITDA and adjusted EBITDA to net income and to net cash provided by operating activities for fiscal 2019 and fiscal 2018, along with the components of EBITDA and adjusted EBITDA, follows (in thousands): Fiscal 2019 Fiscal 2018 Net income . . . . . . . . . . . . . . . . . . . . . . . . . . . . . . . . . . . . . . . . . . . . . . . . . . . . . . . . . . . . . . . . . $ 76,389 $ 172,435 Income tax expense . . . . . . . . . . . . . . . . . . . . . . . . . . . . . . . . . . . . . . . . . . . . . . . . . . . . . . . . . . 29,303 49,842 Interest expense, net . . . . . . . . . . . . . . . . . . . . . . . . . . . . . . . . . . . . . . . . . . . . . . . . . . . . . . . . . 98,126 108,334 Depreciation and amortization . . . . . . . . . . . . . . . . . . . . . . . . . . . . . . . . . . . . . . . . . . . . . . . . . 58,734 53,639 Loss on extinguishment of debt(1) . . . . . . . . . . . . . . . . . . . . . . . . . . . . . . . . . . . . . . . . . . . . . . . 1,177 13,135
EBITDA . . . . . . . . . . . . . . . . . . . . . . . . . . . . . . . . . . . . . . . . . . . . . . . . . . . . . . . . . . . . . . . . . 263,729 397,385 Acquisition/divestiture-related and non-recurring expenses(2) . . . . . . . . . . . . . . . . . . . . . . . . 21,519 26,863 Inventory reduction plan impact(3) . . . . . . . . . . . . . . . . . . . . . . . . . . . . . . . . . . . . . . . . . . . . . . 16,382 66,320 Amortization of acquisition-related inventory step-up(4) . . . . . . . . . . . . . . . . . . . . . . . . . . . . 891 — Gain on sale of assets(5) . . . . . . . . . . . . . . . . . . . . . . . . . . . . . . . . . . . . . . . . . . . . . . . . . . . . . . . — (176,386)
Adjusted EBITDA . . . . . . . . . . . . . . . . . . . . . . . . . . . . . . . . . . . . . . . . . . . . . . . . . . . . . . . . . 302,521 314,182 Income tax expense . . . . . . . . . . . . . . . . . . . . . . . . . . . . . . . . . . . . . . . . . . . . . . . . . . . . . . . . . . (29,303) (49,842)Interest expense, net . . . . . . . . . . . . . . . . . . . . . . . . . . . . . . . . . . . . . . . . . . . . . . . . . . . . . . . . . (98,126) (108,334)Acquisition/divestiture-related and non-recurring expenses(2) . . . . . . . . . . . . . . . . . . . . . . . . (21,519) (26,863)Inventory reduction plan impact(3) . . . . . . . . . . . . . . . . . . . . . . . . . . . . . . . . . . . . . . . . . . . . . . (16,382) (66,320)Amortization of acquisition-related inventory step-up(4) . . . . . . . . . . . . . . . . . . . . . . . . . . . . (891) — Write-off of property, plant and equipment . . . . . . . . . . . . . . . . . . . . . . . . . . . . . . . . . . . . . . . 97 931 Deferred income taxes . . . . . . . . . . . . . . . . . . . . . . . . . . . . . . . . . . . . . . . . . . . . . . . . . . . . . . . . 20,415 (1,494)Amortization of deferred debt financing costs and bond discount/premium . . . . . . . . . . . . 3,511 5,282 Share-based compensation expense . . . . . . . . . . . . . . . . . . . . . . . . . . . . . . . . . . . . . . . . . . . . . 2,594 3,025 Changes in assets and liabilities, net of effects of business combinations . . . . . . . . . . . . . . (116,413) 138,889
Net cash provided by operating activities(5) . . . . . . . . . . . . . . . . . . . . . . . . . . . . . . . . . . . . . $ 46,504 $ 209,456
(1) Loss on extinguishment of debt for fiscal 2019 includes the write-off of deferred debt financing costs of $1.2 million relating to the redemption of all outstanding borrowings under our 4.625% senior notes due 2021. Loss on extinguishment of debt for
- 43 -
fiscal 2018 includes the write-off of deferred debt financing costs and unamortized discount of $11.1 million and $2.0 million, respectively, relating to the prepayment of our then outstanding tranche B term loans.
(2) Acquisition/divestiture-related and non-recurring expenses for fiscal 2019 of $22.4 million primarily includes acquisition and integration expenses for the Clabber Girl acquisition and transition expenses for the Pirate Brands sale, and severance and other expenses primarily relating to a workforce reduction. Acquisition/divestiture-related and non-recurring expenses for fiscal 2018 of $26.9 million primarily includes transition expenses for the Pirate Brands sale and acquisition and integration expenses for the McCann’s, Green Giant, spices & seasonings, Victoria and Back to Nature acquisitions.
(3) Inventory reduction plan impact relates to our 2018 inventory reduction plan. For fiscal 2019, inventory reduction plan impact of $16.4 million includes the trailing non-cash accounting impact of the underutilization of our manufacturing facilities in 2018 as we reduced inventory during the implementation of the inventory reduction plan. For fiscal 2018, inventory reduction plan impact of $66.3 million includes $51.1 million of fixed manufacturing, warehouse and other corporate overhead costs associated with inventory purchased and converted into finished goods in fiscal 2017 and sold in fiscal 2018 as part of our inventory reduction plan and $15.2 million for the underutilization of our manufacturing facilities as we reduced inventory during the implementation of the inventory reduction plan.
(4) For fiscal 2019, amortization of acquisition-related inventory step-up relates to the purchase accounting adjustments made to inventory acquired in the Clabber Girl acquisition.
(5) Our divestiture of Pirate Brands during the fourth quarter of 2018 resulted in a gain on sale during 2018 of approximately $176.4 million. The gain on sale negatively impacted our income taxes for fiscal 2019 by approximately $73.9 million, which includes cash tax payments we made during fiscal 2019 of $44.7 million and a cash tax benefit we otherwise would have expected to receive of approximately $29.2 million. Excluding the negative tax impact of the gain on sale, our net cash provided by operating activities for fiscal 2019 would have been approximately $120.4 million.
Adjusted Net Income and Adjusted Diluted Earnings Per Share. Adjusted net income and adjusted diluted earnings per share are non-GAAP financial measures used by management to measure operating performance. We define adjusted net income and adjusted diluted earnings per share as net income and diluted earnings per share adjusted for certain items that affect comparability. These non-GAAP financial measures reflect adjustments to net income and diluted earnings per share to eliminate the items identified in the reconciliation below. This information is provided in order to allow investors to make meaningful comparisons of our operating performance between periods and to view our business from the same perspective as our management. Because we cannot predict the timing and amount of these items, management does not consider these items when evaluating our company’s performance or when making decisions regarding allocation of resources.
A reconciliation of adjusted net income and adjusted diluted earnings per share to net income for fiscal 2019 and fiscal 2018, along with the components of adjusted net income and adjusted diluted earnings per share, follows (in thousands): Fiscal Year Ended Fiscal 2019 Fiscal 2018 Net income . . . . . . . . . . . . . . . . . . . . . . . . . . . . . . . . . . . . . . . . . . . . . . . . . . . . . . . . . . . . . . . . . $ 76,389 $ 172,435 Loss on extinguishment of debt, net of tax(1) . . . . . . . . . . . . . . . . . . . . . . . . . . . . . . . . . . . . . . 889 10,190 Acquisition/divestiture-related and non-recurring expenses, net of tax(2) . . . . . . . . . . . . . . . 16,247 20,754 Inventory reduction plan impact, net of tax(3) . . . . . . . . . . . . . . . . . . . . . . . . . . . . . . . . . . . . . 12,368 51,451 Amortization of acquisition-related inventory step-up, net of tax(4) . . . . . . . . . . . . . . . . . . . 673 — Gain on sale of assets, net of tax(5) . . . . . . . . . . . . . . . . . . . . . . . . . . . . . . . . . . . . . . . . . . . . . . — (133,172)Tax true-ups(6) . . . . . . . . . . . . . . . . . . . . . . . . . . . . . . . . . . . . . . . . . . . . . . . . . . . . . . . . . . . . . . — 650
Adjusted net income . . . . . . . . . . . . . . . . . . . . . . . . . . . . . . . . . . . . . . . . . . . . . . . . . . . . . . . . $ 106,566 $ 122,308 Adjusted diluted earnings per share . . . . . . . . . . . . . . . . . . . . . . . . . . . . . . . . . . . . . . . . . . . . $ 1.64 $ 1.85
(1) Loss on extinguishment of debt for fiscal 2019 includes the write-off of deferred debt financing costs and unamortized discount
of $0.9 million, net of tax, relating to the redemption of all outstanding borrowings under our 4.625% senior notes due 2021. Loss on extinguishment of debt for fiscal 2018 includes the write-off of deferred debt financing costs and unamortized discount of $8.6 million, net of tax, and $1.6 million, net of tax, respectively, relating to the prepayment of our then outstanding tranche B term loans.
- 44 -
(2) Acquisition/divestiture-related and non-recurring expenses for fiscal 2019 primarily includes acquisition and integration expenses for the Clabber Girl acquisition and transition expenses for the Pirate Brands sale, and severance and other expenses primarily relating to a workforce reduction. Acquisition/divestiture-related and non-recurring expenses for fiscal 2018 primarily includes transition expenses for the Pirate Brands sale and acquisition and integration expenses for the McCann’s, Green Giant, spices & seasonings, Victoria and Back to Nature acquisitions.
(3) Inventory reduction plan impact relates to our 2018 inventory reduction plan. For fiscal 2019, inventory reduction plan impact of $16.4 million (or $12.4 million net of taxes) includes the trailing non-cash accounting impact of the underutilization of our manufacturing facilities in 2018 as we reduced inventory during the implementation of the inventory reduction plan. For fiscal 2018, inventory reduction plan impact of $66.3 million (or $51.5 million net of taxes) includes $51.1 million of fixed manufacturing, warehouse and other corporate overhead costs associated with inventory purchased and converted into finished goods in fiscal 2017 and sold in fiscal 2018 as part of our inventory reduction plan and $15.2 million for the underutilization of our manufacturing facilities as we reduced inventory during the implementation of the inventory reduction plan.
(4) For fiscal 2019, amortization of acquisition-related inventory step-up, net of tax relates to the purchase accounting adjustments made to inventory acquired in the Clabber Girl acquisition.
(5) During the fourth quarter of 2018, we completed the Pirate Brands sale. The sale resulted in a gain of $133.2 million, net of tax.
(6) Tax true-ups for fiscal 2018 reflects prior year foreign tax expense true-up and impact of enacted state rate changes.
Fiscal 2019 Compared to Fiscal 2018
Net Sales. We generated net sales of $1,660.4 million for fiscal 2019, compared to $1,700.8 million for fiscal 2018. The decrease was primarily attributable to the Pirate Brands divestiture, offset in part by the McCann’s and Clabber Girl acquisitions. Net sales of Pirate Brands, which was sold on October 17, 2018 and therefore not part of our fiscal 2019 results, were $74.9 million during fiscal 2018. An additional six and one-half months of net sales of McCann’s, which was acquired on July 16, 2018, contributed $5.8 million to our net sales for fiscal 2019. Net sales of Clabber Girl, which was acquired on May 15, 2019 and therefore not part of our fiscal 2018 results, contributed $53.6 million to our net sales for fiscal 2019.
Base business net sales for fiscal 2019 decreased $22.2 million, or 1.4%, to $1,601.0 million from $1,623.2 million for fiscal 2018. The decrease in base business net sales reflected an increase in net pricing of $20.3 million, or 1.3% of base business net sales, inclusive of list price increases and promotional trade spend optimization, more than offset by a decrease in unit volume of $42.4 million and the negative impact of foreign currency of $0.1 million.
Net sales of all Green Giant products in the aggregate (including Le Sueur) increased $7.8 million, or 1.5%, in fiscal 2019, as compared to fiscal 2018. Net sales of Green Giant shelf stable (including Le Sueur), increased $17.3 million, or 11.8%, for fiscal 2019. Net sales of Green Giant frozen decreased $9.5 million, or 2.5%, for fiscal 2019 as compared to fiscal 2018.
See Note 16, “Net Sales by Brand,” to our consolidated financial statements in Part II, Item 8 of this report, for detailed information regarding total net sales by brand for fiscal 2019 and fiscal 2018 for each of our brands that equaled or exceeded approximately 3% of our fiscal 2019 or fiscal 2018 net sales and for all other brands in the aggregate.

- 45 -
The following table sets forth the most significant base business net sales increases and decreases by brand for fiscal 2019: Base Business Net Sales Increase (Decrease)
Dollars
(in millions) Percentage Brand:
Green Giant - shelf stable(1) . . . . . . . . . . . . . . . . . . . . . . . . . . . . . . . . . . . . . . . . . . . . . . . . $ 17.3 11.8 % Maple Grove Farms of Vermont . . . . . . . . . . . . . . . . . . . . . . . . . . . . . . . . . . . . . . . . . . . . 2.6 3.7 % Mrs. Dash . . . . . . . . . . . . . . . . . . . . . . . . . . . . . . . . . . . . . . . . . . . . . . . . . . . . . . . . . . . . . . 0.1 0.2 % Green Giant - frozen . . . . . . . . . . . . . . . . . . . . . . . . . . . . . . . . . . . . . . . . . . . . . . . . . . . . . (9.5) (2.5) % Back to Nature . . . . . . . . . . . . . . . . . . . . . . . . . . . . . . . . . . . . . . . . . . . . . . . . . . . . . . . . . . (8.8) (12.6) % Spices & Seasonings(2) . . . . . . . . . . . . . . . . . . . . . . . . . . . . . . . . . . . . . . . . . . . . . . . . . . . . (5.3) (2.1) % Cream of Wheat . . . . . . . . . . . . . . . . . . . . . . . . . . . . . . . . . . . . . . . . . . . . . . . . . . . . . . . . . (2.6) (4.2) % Ortega . . . . . . . . . . . . . . . . . . . . . . . . . . . . . . . . . . . . . . . . . . . . . . . . . . . . . . . . . . . . . . . . . (0.9) (0.6) % All other brands . . . . . . . . . . . . . . . . . . . . . . . . . . . . . . . . . . . . . . . . . . . . . . . . . . . . . . . . . (15.1) (3.4) %
Base business net sales decrease . . . . . . . . . . . . . . . . . . . . . . . . . . . . . . . . . . . . . . . . . . . $ (22.2) (1.4) %
(1) Includes net sales of the Le Sueur brand. (2) Includes net sales for multiple brands acquired as part of the spices & seasonings acquisition that we completed on
November 21, 2016. Does not include net sales for Mrs. Dash and our other legacy spices & seasonings brands or net sales for French’s® seasoning mixes, which we discontinued during the third quarter of 2018.
Gross Profit. Gross profit was $383.1 million for fiscal 2019, or 23.1% of net sales. Excluding the negative impact of $22.0 million of acquisition/divestiture-related and non-recurring expenses during fiscal 2019, which includes expenses related to the trailing non-cash accounting impact of our 2018 inventory reduction plan and the amortization of acquisition-related inventory fair value step-up of inventory, our gross profit would have been $405.1 million, or 24.4% of net sales. Gross profit was $349.5 million for fiscal 2018, or 20.5% of net sales. Excluding the negative impact of $76.3 million of acquisition/divestiture-related and non-recurring expenses during fiscal 2018, which includes expenses relating to the non-cash accounting impact of our 2018 inventory reduction plan, our gross profit would have been $425.8 million, or 25.0% of net sales.
Selling, General and Administrative Expenses. Selling, general and administrative expenses decreased $6.7 million, or 4.0%, to $160.7 million for fiscal 2019 from $167.4 million for fiscal 2018. The decrease was composed of decreases in consumer marketing expenses of $5.7 million, warehousing expenses of $2.7 million, selling expenses of $2.5 million and acquisition/divestiture-related and non-recurring expenses of $0.2 million, partially offset by an increase in other general and administrative expenses of $4.4 million. Expressed as a percentage of net sales, selling, general and administrative expenses improved by 0.1 percentage points to 9.7% for fiscal 2019, compared to 9.8% for fiscal 2018.
Amortization Expense. Amortization expense increased $0.2 million to $18.5 million for fiscal 2019 from $18.3 million for fiscal 2018 due to the Clabber Girl acquisition completed in fiscal 2019 and the McCann’s acquisition completed in fiscal 2018, partially offset by the Pirate Brands sale in fiscal 2018.
Gain on Sale of Assets. On October 17, 2018, we completed the Pirate Brands sale. We recognized a pre-tax gain on the Pirate Brands sale of $176.4 million.
Operating Income. As a result of the foregoing, operating income decreased $136.4 million, or 40.1%, to $203.8 million for fiscal 2019 from $340.2 million for fiscal 2018. Operating income expressed as a percentage of net sales decreased to 12.3% in fiscal 2019 from 20.0% in fiscal 2018.
Net Interest Expense. Net interest expense decreased $10.2 million, or 9.4%, to $98.1 million for fiscal 2019 from $108.3 million in fiscal 2018. The decrease was primarily attributable to a reduction in average long-term debt outstanding during fiscal 2019 as compared to fiscal 2018, primarily as a result of the use of the proceeds from the sale of Pirate Brands to prepay long-term debt during the fourth quarter of 2018, and earlier prepayments of long-term debt made during the first and second quarters of 2018, which was partially offset by additional borrowings made in fiscal 2019 to fund the Clabber Girl acquisition, to pay cash taxes resulting from the 2018 gain on sale of Pirate Brands and to
- 46 -
fund the repurchase of shares of our common stock as part of our stock repurchase program. During fiscal 2019, net interest expense was negatively impacted in connection with our debt refinancing because our new 5.25% senior notes due 2027 were issued on September 26, 2019, prior to the redemption of our 4.625% senior notes due 2021 on October 10, 2019, and therefore during such fourteen day period we incurred interest expense on both sets of notes.
Loss on Extinguishment of Debt. Loss on extinguishment of debt decreased $11.9 million, or 91.0%, to $1.2 million for fiscal 2019 from $13.1 million in fiscal 2018. Loss on extinguishment of debt for fiscal 2019 includes the write-off of deferred deft financing costs of $1.2 million relating to the redemption of all outstanding borrowings under our 4.625% senior notes due 2021. Loss on extinguishment of debt for fiscal 2018 includes the write-off of deferred debt financing costs and unamortized discount of $11.1 million and $2.0 million, respectively, relating to the use of the net proceeds from the sale of Pirate Brands to prepay long-term debt during the fourth quarter of 2018 and earlier prepayments of long-term debt during the first and second quarters of 2018. See “—Liquidity and Capital Resources—Debt” below.
Other Income. Other income for fiscal 2019 primarily includes the non-service portion of net periodic pension cost and net periodic post-retirement benefit costs of $1.2 million. Other income for fiscal 2018 includes the remeasurement of monetary assets denominated in a foreign currency into U.S. dollars of $1.2 million and includes the non-service portion of net periodic pension cost and net periodic post-retirement benefit costs of $2.4 million.
Income Tax Expense. Income tax expense decreased $20.5 million to $29.3 million in fiscal 2019 from $49.8 million for fiscal 2018. See “U.S. Tax Act” above for a discussion of the impact of the tax legislation on income tax expense.
Fiscal 2018 Compared to Fiscal 2017
For a discussion of fiscal 2018 compared to fiscal 2017, please refer to our 2018 Annual Report on Form 10-K, Part II, Item 7. Management’s Discussion and Analysis of Financial Condition and Results of Operations, filed with the SEC on February 26, 2019.
Liquidity and Capital Resources
Our primary liquidity requirements include debt service, capital expenditures and working capital needs. See also, “Dividend Policy” and “Commitments and Contractual Obligations” below. We fund our liquidity requirements, as well as our dividend payments and financing for acquisitions, primarily through cash generated from operations and external sources of financing, including our revolving credit facility.
Cash Flows
Net Cash Provided by Operating Activities. Net cash provided by operating activities decreased $163.0 million to $46.5 million for fiscal 2019 from $209.5 million for fiscal 2018. The decrease was primarily due to the negative impact to income taxes resulting from the Pirate Brands sale of approximately $73.9 million, which includes a cash tax payment of $44.7 million made during fiscal 2019 and a cash tax benefit we otherwise would have expected to receive of approximately $29.2 million. The decrease in net cash provided by operating activities was also due to unfavorable working capital comparisons to fiscal 2018 (primarily comprised of inventories and trade accounts payable, partially offset by a favorable change in trade accounts receivable). There was an increase in inventory of $57.4 million for fiscal 2019 as compared to a decrease of $88.0 million during fiscal 2018. The decrease in inventory in fiscal 2018 was primarily attributable to our inventory reduction plan. The decrease in net cash provided by operating activities was also due to the timing of payments received in 2018 from post-acquisition transition services agreements.
Net Cash (Used in) Provided by Investing Activities. Net cash provided by investing activities of $347.6 million for fiscal 2018 decreased $472.3 million to cash used in investing activities of $124.7 million for fiscal 2019. Net cash provided by investing activities for fiscal 2018 includes the $420.0 million of pre-tax gross proceeds received from the Pirate Brands sale, partially offset by the $30.8 million purchase price paid for the McCann’s acquisition. Net cash used in investing activities for fiscal 2019 includes the $82.4 million purchase price (net of cash acquired of $2.2 million) paid for the Clabber Girl acquisition.
- 47 -
Net Cash Provided by (Used in) Financing Activities. During fiscal 2019, net cash provided by financing activities was $77.7 million, primarily reflecting net borrowings of long-term debt of $250.0 million used to fund the Clabber Girl acquisition, pay income taxes due on the 2018 gain on sale of Pirate Brands and fund share repurchases and working capital needs, partially offset by $123.7 million of dividend payments, $34.7 million of share repurchases and $13.0 million of debt financing costs in connection with our 2019 long-term debt refinancing.
During fiscal 2018, net cash used in financing activities was $753.3 million, primarily reflecting the prepayment of $650.1 million of tranche B term loans, $124.5 million of dividend payments and $26.9 million of share repurchases, partially offset by net borrowings under our revolving credit facility of $50.0 million.
Cash Income Tax Payments. We made cash tax payments of approximately $47.5 million and $4.7 million during fiscal 2019 and fiscal 2018, respectively. The increase was primarily attributable to $44.7 million of cash tax payments made in fiscal 2019 relating to the fiscal 2018 gain on sale of Pirate Brands. We believe that we will realize a benefit to our cash taxes payable from amortization of our trademarks, goodwill and other intangible assets for the taxable years 2020 through 2034. In fiscal 2019, however, our cash taxes were negatively impacted by the U.S. Tax Act’s limitations on the deductibility of interest expense. See “U.S. Tax Act” above for a discussion of the impact and expected impact of the U.S. Tax Act on our cash income tax payments, including the impact the U.S. Tax Act had in fiscal 2019 and is expected to have in fiscal 2020 and beyond on our interest expense deductions. If there is a change in U.S. federal tax policy or, in the case of the interest deduction, a change in our net interest expense relative to our adjusted taxable income that eliminates, limits or reduces our ability to amortize and deduct goodwill and certain intangible assets or the interest deduction we receive on our substantial indebtedness, or otherwise that reduces any of these available deductions or results in an increase in our corporate tax rate, our cash taxes payable may increase further, which could significantly reduce our future liquidity and impact our ability to make interest and dividend payments and have a material adverse effect on our business, consolidated financial condition, results of operations and liquidity.
Dividend Policy
For a discussion of our dividend policy, see the information set forth under the heading “Dividend Policy” in Part II, Item 5 of this report.
Acquisitions
Our liquidity and capital resources have been significantly impacted by acquisitions and may be impacted in the foreseeable future by additional acquisitions. As discussed elsewhere in this report, as part of our growth strategy we plan to expand our brand portfolio with disciplined acquisitions of complementary brands. We have historically financed acquisitions by incurring additional indebtedness, issuing equity and/or using cash flows from operating activities. Our interest expense has over time increased as a result of additional indebtedness we have incurred in connection with acquisitions and will increase with any additional indebtedness we may incur to finance future acquisitions. Although we may subsequently issue equity and use the proceeds to repay all or a portion of the additional indebtedness incurred to finance an acquisition and reduce our interest expense, the additional shares of common stock would increase the amount of cash flows from operating activities necessary to fund dividend payments.
We financed the Clabber Girl acquisition, completed in May 2019, with cash on hand and additional revolving loans under our credit facility. We financed the McCann’s acquisition, completed in October 2018, with cash on hand and additional revolving loans under our credit facility. The impact of future acquisitions, whether financed with additional indebtedness or otherwise, may have a material impact on our liquidity and capital resources.
Divestitures
We used the net proceeds from the Pirate Brands sale, completed in October 2018, along with additional borrowings under our revolving credit facility, to prepay the entire $500.1 million principal amount of tranche B term loans then outstanding under our credit facility. See “Debt” below.
Debt
Senior Secured Credit Agreement. We made optional prepayments of our tranche B term loans of $125.0 million principal amount in the first quarter of 2018 and $25.0 million principal amount in the second quarter of 2018. On October 18, 2018, we made a mandatory prepayment of $352.2 million principal amount of tranche B term loans with the net proceeds of the Pirate Brands sale. On October 19, 2018, we made an optional prepayment of the remaining $147.9 million principal amount of tranche B term loans then outstanding under our credit agreement from cash on hand
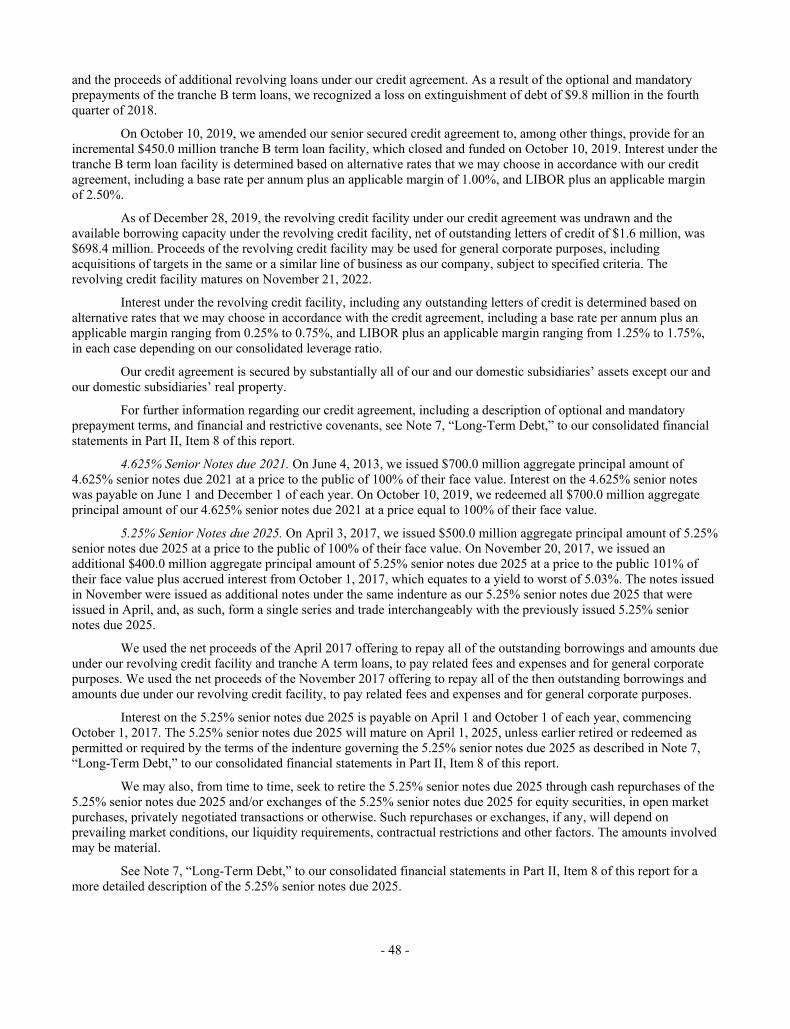
- 48 -
and the proceeds of additional revolving loans under our credit agreement. As a result of the optional and mandatory prepayments of the tranche B term loans, we recognized a loss on extinguishment of debt of $9.8 million in the fourth quarter of 2018.
On October 10, 2019, we amended our senior secured credit agreement to, among other things, provide for an incremental $450.0 million tranche B term loan facility, which closed and funded on October 10, 2019. Interest under the tranche B term loan facility is determined based on alternative rates that we may choose in accordance with our credit agreement, including a base rate per annum plus an applicable margin of 1.00%, and LIBOR plus an applicable margin of 2.50%.
As of December 28, 2019, the revolving credit facility under our credit agreement was undrawn and the available borrowing capacity under the revolving credit facility, net of outstanding letters of credit of $1.6 million, was $698.4 million. Proceeds of the revolving credit facility may be used for general corporate purposes, including acquisitions of targets in the same or a similar line of business as our company, subject to specified criteria. The revolving credit facility matures on November 21, 2022.
Interest under the revolving credit facility, including any outstanding letters of credit is determined based on alternative rates that we may choose in accordance with the credit agreement, including a base rate per annum plus an applicable margin ranging from 0.25% to 0.75%, and LIBOR plus an applicable margin ranging from 1.25% to 1.75%, in each case depending on our consolidated leverage ratio.
Our credit agreement is secured by substantially all of our and our domestic subsidiaries’ assets except our and our domestic subsidiaries’ real property.
For further information regarding our credit agreement, including a description of optional and mandatory prepayment terms, and financial and restrictive covenants, see Note 7, “Long-Term Debt,” to our consolidated financial statements in Part II, Item 8 of this report.
4.625% Senior Notes due 2021. On June 4, 2013, we issued $700.0 million aggregate principal amount of 4.625% senior notes due 2021 at a price to the public of 100% of their face value. Interest on the 4.625% senior notes was payable on June 1 and December 1 of each year. On October 10, 2019, we redeemed all $700.0 million aggregate principal amount of our 4.625% senior notes due 2021 at a price equal to 100% of their face value.
5.25% Senior Notes due 2025. On April 3, 2017, we issued $500.0 million aggregate principal amount of 5.25% senior notes due 2025 at a price to the public of 100% of their face value. On November 20, 2017, we issued an additional $400.0 million aggregate principal amount of 5.25% senior notes due 2025 at a price to the public 101% of their face value plus accrued interest from October 1, 2017, which equates to a yield to worst of 5.03%. The notes issued in November were issued as additional notes under the same indenture as our 5.25% senior notes due 2025 that were issued in April, and, as such, form a single series and trade interchangeably with the previously issued 5.25% senior notes due 2025.
We used the net proceeds of the April 2017 offering to repay all of the outstanding borrowings and amounts due under our revolving credit facility and tranche A term loans, to pay related fees and expenses and for general corporate purposes. We used the net proceeds of the November 2017 offering to repay all of the then outstanding borrowings and amounts due under our revolving credit facility, to pay related fees and expenses and for general corporate purposes.
Interest on the 5.25% senior notes due 2025 is payable on April 1 and October 1 of each year, commencing October 1, 2017. The 5.25% senior notes due 2025 will mature on April 1, 2025, unless earlier retired or redeemed as permitted or required by the terms of the indenture governing the 5.25% senior notes due 2025 as described in Note 7, “Long-Term Debt,” to our consolidated financial statements in Part II, Item 8 of this report.
We may also, from time to time, seek to retire the 5.25% senior notes due 2025 through cash repurchases of the 5.25% senior notes due 2025 and/or exchanges of the 5.25% senior notes due 2025 for equity securities, in open market purchases, privately negotiated transactions or otherwise. Such repurchases or exchanges, if any, will depend on prevailing market conditions, our liquidity requirements, contractual restrictions and other factors. The amounts involved may be material.
See Note 7, “Long-Term Debt,” to our consolidated financial statements in Part II, Item 8 of this report for a more detailed description of the 5.25% senior notes due 2025.
- 49 -
5.25% Senior Notes due 2027. On September 26, 2019, we issued $550.0 million aggregate principal amount of 5.25% senior notes due 2027 at a price to the public of 100% of their face value.
We used the proceeds of the offering, together with the proceeds of incremental term loans made during the fourth quarter of 2019, to redeem all of our outstanding 4.625% senior notes due 2021, repay a portion of our borrowings under our revolving credit facility, pay related fees and expenses and for general corporate purposes.
Interest on the 5.25% senior notes due 2027 is payable on March 15 and September 15 of each year, commencing March 15, 2020. The 5.25% senior notes due 2027 will mature on September 15, 2027, unless earlier retired or redeemed as permitted or required by the terms of the indenture governing the 5.25% senior notes due 2027 as described in Note 7, “Long-Term Debt,” to our consolidated financial statements in Part II, Item 8 of this report.
We may also, from time to time, seek to retire the 5.25% senior notes due 2027 through cash repurchases of the 5.25% senior notes due 2027 and/or exchanges of the 5.25% senior notes due 2027 for equity securities, in open market purchases, privately negotiated transactions or otherwise. Such repurchases or exchanges, if any, will depend on prevailing market conditions, our liquidity requirements, contractual restrictions and other factors. The amounts involved may be material.
See Note 7, “Long-Term Debt,” to our consolidated financial statements in Part II, Item 8 of this report for a more detailed description of the 5.25% senior notes due 2027.
Loss on Extinguishment of Debt. Loss on extinguishment of debt for fiscal 2019 includes the write-off of deferred debt financing costs of $1.2 million relating to the redemption of all outstanding borrowings under our 4.625% senior notes due 2021. Loss on extinguishment of debt for fiscal 2018 includes the write-off of deferred debt financing costs and unamortized discount of $11.1 million and $2.0 million, respectively, relating to the repayment of all outstanding borrowings under the tranche B term loans.
Stock Repurchase Program
On March 13, 2018, our board of directors authorized a stock repurchase program for the repurchase of up to $50.0 million of our company’s common stock through March 15, 2019.
Under that authorization, we repurchased and retired 1,397,148 shares of common stock at an average price per share (excluding fees and commissions) of $26.41, or $36.9 million in the aggregate, including 694,749 shares of common stock at an average price per share (excluding fees and commissions) of $26.65, or $18.5 million in the aggregate, during the second quarter of 2018, 295,377 shares of common stock at an average price per share (excluding fees and commissions) of $28.39, or $8.4 million in the aggregate, during the fourth quarter of 2018 and 407,022 shares of common stock at an average price per share (excluding fees and commissions) of $24.55, or $10.0 million in the aggregate, during the first quarter of 2019.
On March 12, 2019, our board of directors authorized an extension of our stock repurchase program from March 15, 2019 to March 15, 2020. In extending the repurchase program, our board of directors also reset the repurchase authority to up to $50.0 million. Under the new authorization, we repurchased and retired 1,330,865 shares of common stock at an average price per share, excluding fees and commissions, of $18.55, or $24.7 million in the aggregate, during the third quarter of 2019. As of December 28, 2019, we had $25.3 million available for future repurchases of common stock under the stock repurchase program and we had 64,044,649 shares of common stock outstanding.
Under the authorization, we may purchase shares of common stock from time to time in the open market or in privately negotiated transactions in compliance with the applicable rules and regulations of the SEC.
The timing and amount of future stock repurchases, if any, under the program will be at the discretion of management, and will depend on a variety of factors, including price, available cash, general business and market conditions and other investment opportunities. Therefore, we cannot assure you as to the number or aggregate dollar amount of additional shares, if any, that will be repurchased under the program. We may discontinue the program at any time. Any shares repurchased pursuant to the program will be retired.
See Note 12, “Pension Benefits,” to our consolidated financial statements in Part II, Item 8 of this report for disclosure relating to shares of our company’s common stock purchased by our defined benefit pension plans.
- 50 -
Future Capital Needs
On December 28, 2019, our total long-term debt of $1,874.2 million, net of our cash and cash equivalents of $11.3 million, was $1,862.9 million. Stockholders’ equity as of that date was $812.5 million.
Our ability to generate sufficient cash to fund our operations depends generally on our results of operations and the availability of financing. Our management believes that our cash and cash equivalents on hand, cash flow from operating activities and available borrowing capacity under our revolving credit facility will be sufficient for the foreseeable future to fund operations, meet debt service requirements, fund capital expenditures, make future acquisitions, if any, and pay our anticipated quarterly dividends on our common stock.
We expect to make capital expenditures of approximately $40.0 million to $45.0 million in the aggregate during fiscal 2020. Our projected capital expenditures for fiscal 2020 include, among other things, approximately $22.1 million for profit enhancing and asset sustainability projects, $11.1 million for productivity increases and cost saving initiatives and $8.1 million for information technology (hardware and software).
Seasonality
Sales of a number of our products tend to be seasonal and may be influenced by holidays, changes in seasons or certain other annual events. In general our sales are higher during the first and fourth quarters.
We purchase most of the produce used to make our frozen and shelf-stable vegetables, shelf-stable pickles, relishes, peppers, tomatoes and other related specialty items during the months of June through October, and we generally purchase the majority of our maple syrup requirements during the months of April through August. Consequently, our liquidity needs are greatest during these periods.
Inflation
We experienced moderate net cost increases for raw materials during fiscal 2019 and fiscal 2018 and anticipate higher raw materials cost increases for fiscal 2020. We are currently locked into our supply and prices for a majority of our most significant commodities (excluding, among others, maple syrup) through fiscal 2020.
In addition, during 2019 and 2018, we were negatively impacted by industry-wide increases in the cost of distribution, primarily driven by freight costs. Despite higher rates for freight in 2019, we were able to offset these increases, in part as a result of our 2019 pricing strategy that included both list price increases as well as a trade spend optimization program. Separately, we also benefited in 2019 from our distribution re-alignment efforts which helped to optimize both our shelf-stable and our frozen distribution networks. We expect freight rates to remain elevated in 2020.
We plan to continue managing inflation risk by entering into short term supply contracts and advance commodities purchase agreements from time to time, and, if necessary, by raising prices. To the extent we are unable to avoid or offset any present or future cost increases by locking in our costs, implementing cost saving measures or increasing prices to our customers, our operating results could be materially and adversely affected. In addition, if input costs begin to decline, customers may look for price reductions in situations where we have locked into purchases at higher costs. During the past three years, our cost saving measures and sales price increases have not been sufficient to fully offset increases to our raw material, ingredient and packaging and distribution costs.
Contingencies
See Note 14, “Commitments and Contingencies,” to our consolidated financial statements in Part II, Item 8 of this report.
Recent Accounting Pronouncements
See Note 2(s), “Summary of Significant Accounting Policies — Recently Issued Accounting Standards,” to our consolidated financial statements in Part II, Item 8 of this report.
Off-balance Sheet Arrangements
As of December 28, 2019, we did not have any off-balance sheet arrangements as defined in Item 303(a)(4)(ii) of Regulation S-K.
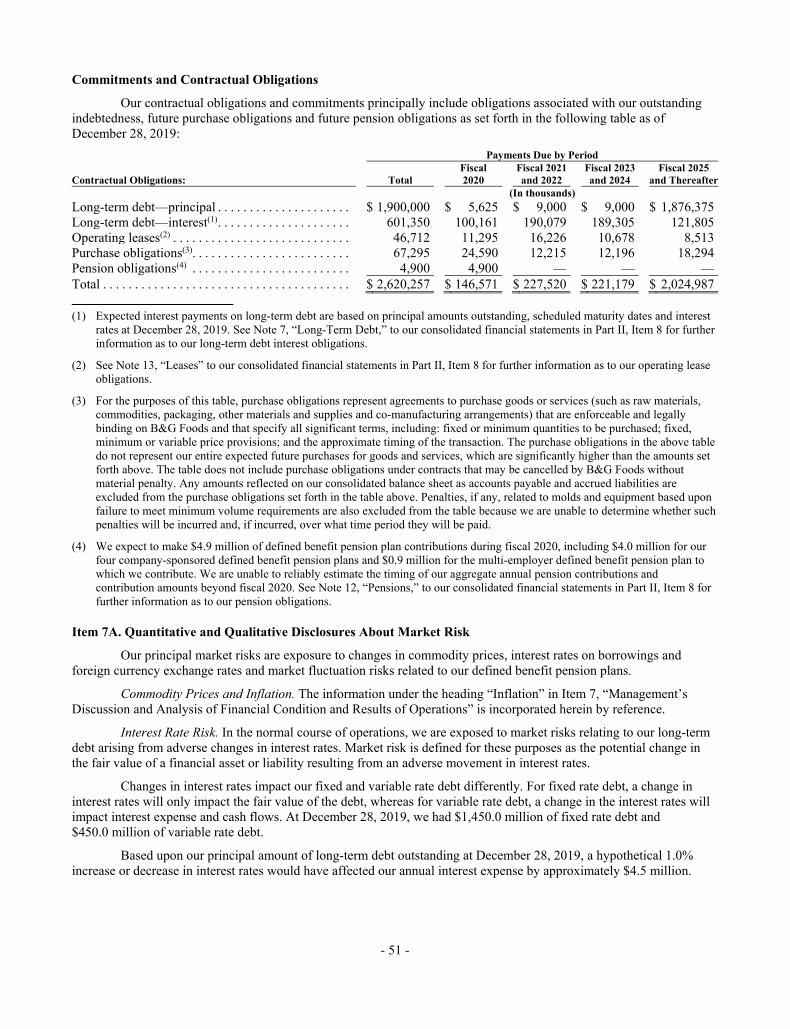
- 51 -
Commitments and Contractual Obligations
Our contractual obligations and commitments principally include obligations associated with our outstanding indebtedness, future purchase obligations and future pension obligations as set forth in the following table as of December 28, 2019: Payments Due by Period Fiscal Fiscal 2021 Fiscal 2023 Fiscal 2025 Contractual Obligations: Total 2020 and 2022 and 2024 and Thereafter (In thousands) Long-term debt—principal . . . . . . . . . . . . . . . . . . . . . $ 1,900,000 $ 5,625 $ 9,000 $ 9,000 $ 1,876,375 Long-term debt—interest(1) . . . . . . . . . . . . . . . . . . . . . 601,350 100,161 190,079 189,305 121,805 Operating leases(2) . . . . . . . . . . . . . . . . . . . . . . . . . . . . 46,712 11,295 16,226 10,678 8,513 Purchase obligations(3). . . . . . . . . . . . . . . . . . . . . . . . . 67,295 24,590 12,215 12,196 18,294 Pension obligations(4) . . . . . . . . . . . . . . . . . . . . . . . . . 4,900 4,900 — — — Total . . . . . . . . . . . . . . . . . . . . . . . . . . . . . . . . . . . . . . . $ 2,620,257 $ 146,571 $ 227,520 $ 221,179 $ 2,024,987
(1) Expected interest payments on long-term debt are based on principal amounts outstanding, scheduled maturity dates and interest
rates at December 28, 2019. See Note 7, “Long-Term Debt,” to our consolidated financial statements in Part II, Item 8 for further information as to our long-term debt interest obligations.
(2) See Note 13, “Leases” to our consolidated financial statements in Part II, Item 8 for further information as to our operating lease obligations.
(3) For the purposes of this table, purchase obligations represent agreements to purchase goods or services (such as raw materials, commodities, packaging, other materials and supplies and co-manufacturing arrangements) that are enforceable and legally binding on B&G Foods and that specify all significant terms, including: fixed or minimum quantities to be purchased; fixed, minimum or variable price provisions; and the approximate timing of the transaction. The purchase obligations in the above table do not represent our entire expected future purchases for goods and services, which are significantly higher than the amounts set forth above. The table does not include purchase obligations under contracts that may be cancelled by B&G Foods without material penalty. Any amounts reflected on our consolidated balance sheet as accounts payable and accrued liabilities are excluded from the purchase obligations set forth in the table above. Penalties, if any, related to molds and equipment based upon failure to meet minimum volume requirements are also excluded from the table because we are unable to determine whether such penalties will be incurred and, if incurred, over what time period they will be paid.
(4) We expect to make $4.9 million of defined benefit pension plan contributions during fiscal 2020, including $4.0 million for our four company-sponsored defined benefit pension plans and $0.9 million for the multi-employer defined benefit pension plan to which we contribute. We are unable to reliably estimate the timing of our aggregate annual pension contributions and contribution amounts beyond fiscal 2020. See Note 12, “Pensions,” to our consolidated financial statements in Part II, Item 8 for further information as to our pension obligations.
Item 7A. Quantitative and Qualitative Disclosures About Market Risk
Our principal market risks are exposure to changes in commodity prices, interest rates on borrowings and foreign currency exchange rates and market fluctuation risks related to our defined benefit pension plans.
Commodity Prices and Inflation. The information under the heading “Inflation” in Item 7, “Management’s Discussion and Analysis of Financial Condition and Results of Operations” is incorporated herein by reference.
Interest Rate Risk. In the normal course of operations, we are exposed to market risks relating to our long-term debt arising from adverse changes in interest rates. Market risk is defined for these purposes as the potential change in the fair value of a financial asset or liability resulting from an adverse movement in interest rates.
Changes in interest rates impact our fixed and variable rate debt differently. For fixed rate debt, a change in interest rates will only impact the fair value of the debt, whereas for variable rate debt, a change in the interest rates will impact interest expense and cash flows. At December 28, 2019, we had $1,450.0 million of fixed rate debt and $450.0 million of variable rate debt.
Based upon our principal amount of long-term debt outstanding at December 28, 2019, a hypothetical 1.0% increase or decrease in interest rates would have affected our annual interest expense by approximately $4.5 million.
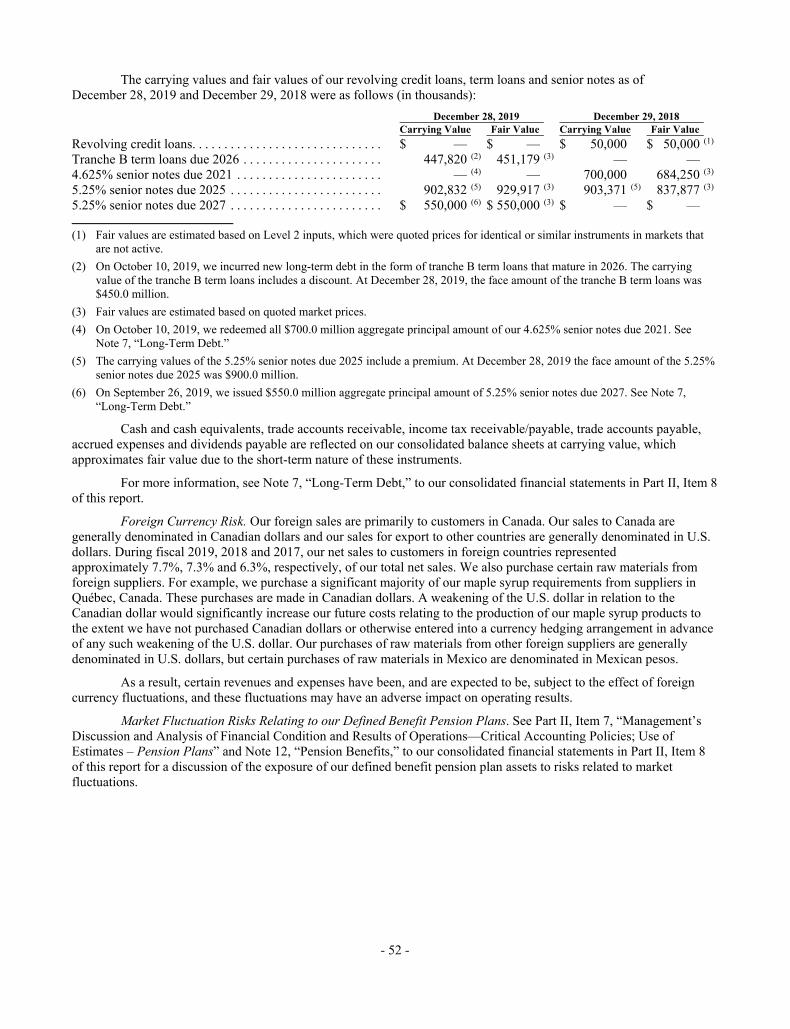
- 52 -
The carrying values and fair values of our revolving credit loans, term loans and senior notes as of December 28, 2019 and December 29, 2018 were as follows (in thousands): December 28, 2019 December 29, 2018 Carrying Value Fair Value Carrying Value Fair Value Revolving credit loans . . . . . . . . . . . . . . . . . . . . . . . . . . . . . . $ — $ — $ 50,000 $ 50,000 (1)
Tranche B term loans due 2026 . . . . . . . . . . . . . . . . . . . . . . 447,820 (2) 451,179 (3) — —
4.625% senior notes due 2021 . . . . . . . . . . . . . . . . . . . . . . . — (4) — 700,000 684,250 (3)
5.25% senior notes due 2025 . . . . . . . . . . . . . . . . . . . . . . . . 902,832 (5) 929,917 (3) 903,371 (5) 837,877 (3)
5.25% senior notes due 2027 . . . . . . . . . . . . . . . . . . . . . . . . $ 550,000 (6) $ 550,000 (3) $ — $ —
(1) Fair values are estimated based on Level 2 inputs, which were quoted prices for identical or similar instruments in markets that
are not active. (2) On October 10, 2019, we incurred new long-term debt in the form of tranche B term loans that mature in 2026. The carrying
value of the tranche B term loans includes a discount. At December 28, 2019, the face amount of the tranche B term loans was $450.0 million.
(3) Fair values are estimated based on quoted market prices. (4) On October 10, 2019, we redeemed all $700.0 million aggregate principal amount of our 4.625% senior notes due 2021. See
Note 7, “Long-Term Debt.” (5) The carrying values of the 5.25% senior notes due 2025 include a premium. At December 28, 2019 the face amount of the 5.25%
senior notes due 2025 was $900.0 million. (6) On September 26, 2019, we issued $550.0 million aggregate principal amount of 5.25% senior notes due 2027. See Note 7,
“Long-Term Debt.”
Cash and cash equivalents, trade accounts receivable, income tax receivable/payable, trade accounts payable, accrued expenses and dividends payable are reflected on our consolidated balance sheets at carrying value, which approximates fair value due to the short-term nature of these instruments.
For more information, see Note 7, “Long-Term Debt,” to our consolidated financial statements in Part II, Item 8 of this report.
Foreign Currency Risk. Our foreign sales are primarily to customers in Canada. Our sales to Canada are generally denominated in Canadian dollars and our sales for export to other countries are generally denominated in U.S. dollars. During fiscal 2019, 2018 and 2017, our net sales to customers in foreign countries represented approximately 7.7%, 7.3% and 6.3%, respectively, of our total net sales. We also purchase certain raw materials from foreign suppliers. For example, we purchase a significant majority of our maple syrup requirements from suppliers in Québec, Canada. These purchases are made in Canadian dollars. A weakening of the U.S. dollar in relation to the Canadian dollar would significantly increase our future costs relating to the production of our maple syrup products to the extent we have not purchased Canadian dollars or otherwise entered into a currency hedging arrangement in advance of any such weakening of the U.S. dollar. Our purchases of raw materials from other foreign suppliers are generally denominated in U.S. dollars, but certain purchases of raw materials in Mexico are denominated in Mexican pesos.
As a result, certain revenues and expenses have been, and are expected to be, subject to the effect of foreign currency fluctuations, and these fluctuations may have an adverse impact on operating results.
Market Fluctuation Risks Relating to our Defined Benefit Pension Plans. See Part II, Item 7, “Management’s Discussion and Analysis of Financial Condition and Results of Operations—Critical Accounting Policies; Use of Estimates – Pension Plans” and Note 12, “Pension Benefits,” to our consolidated financial statements in Part II, Item 8 of this report for a discussion of the exposure of our defined benefit pension plan assets to risks related to market fluctuations.
- 53 -
Item 8. Financial Statements and Supplementary Data.
The consolidated balance sheets at December 28, 2019 and December 29, 2018 and the consolidated statements of operations, comprehensive income, changes in stockholders’ equity and cash flows for fiscal 2019, 2018 and 2017 and related notes are set forth below. Page
Reports of Independent Registered Public Accounting Firm . . . . . . . . . . . . . . . . . . . . . . . . . . . . . . . . . . . 54
Consolidated Balance Sheets as of December 28, 2019 and December 29, 2018 . . . . . . . . . . . . . . . . . . . 58
Consolidated Statements of Operations for the fiscal years ended December 28, 2019, December 29, 2018 and December 30, 2017 . . . . . . . . . . . . . . . . . . . . . . . . . . . . . . . . . . . . . . . . . . . . . . 59
Consolidated Statements of Comprehensive Income for the fiscal years ended December 28, 2019,
December 29, 2018 and December 30, 2017 . . . . . . . . . . . . . . . . . . . . . . . . . . . . . . . . . . . . . . . . . . . . . . 60
Consolidated Statements of Changes in Stockholders’ Equity for the fiscal years ended December 28, 2019, December 29, 2018 and December 30, 2017 . . . . . . . . . . . . . . . . . . . . . . . . . . . . 61
Consolidated Statements of Cash Flows for the fiscal years ended December 28, 2019,
December 29, 2018 and December 30, 2017 . . . . . . . . . . . . . . . . . . . . . . . . . . . . . . . . . . . . . . . . . . . . . 62
Notes to Consolidated Financial Statements . . . . . . . . . . . . . . . . . . . . . . . . . . . . . . . . . . . . . . . . . . . . . . . . 63
Schedule II—Schedule of Valuation and Qualifying Accounts . . . . . . . . . . . . . . . . . . . . . . . . . . . . . . . . . 102
- 54 -
Report of Independent Registered Public Accounting Firm
To the Stockholders and Board of Directors B&G Foods, Inc.:
Opinion on the Consolidated Financial Statements
We have audited the accompanying consolidated balance sheets of B&G Foods, Inc. and subsidiaries (the Company) as of December 28, 2019 and December 29, 2018, the related consolidated statements of operations, comprehensive income, changes in stockholders’ equity and cash flows for the fiscal years ended December 28, 2019, December 29, 2018 and December 30, 2017, and the related notes and the schedule of valuation and qualifying accounts (collectively, the consolidated financial statements). In our opinion, the consolidated financial statements present fairly, in all material respects, the financial position of the Company as of December 28, 2019 and December 29, 2018, and the results of its operations and its cash flows for the fiscal years ended December 28, 2019, December 29, 2018 and December 30, 2017, in conformity with U.S. generally accepted accounting principles.
We also have audited, in accordance with the standards of the Public Company Accounting Oversight Board (United States) (PCAOB), the Company’s internal control over financial reporting as of December 28, 2019, based on criteria established in Internal Control – Integrated Framework (2013) issued by the Committee of Sponsoring Organizations of the Treadway Commission, and our report dated February 26, 2020 expressed an unqualified opinion on the effectiveness of the Company’s internal control over financial reporting.
Basis for Opinion
These consolidated financial statements are the responsibility of the Company’s management. Our responsibility is to express an opinion on these consolidated financial statements based on our audits. We are a public accounting firm registered with the PCAOB and are required to be independent with respect to the Company in accordance with the U.S. federal securities laws and the applicable rules and regulations of the Securities and Exchange Commission and the PCAOB.
We conducted our audits in accordance with the standards of the PCAOB. Those standards require that we plan and perform the audit to obtain reasonable assurance about whether the consolidated financial statements are free of material misstatement, whether due to error or fraud. Our audits included performing procedures to assess the risks of material misstatement of the consolidated financial statements, whether due to error or fraud, and performing procedures that respond to those risks. Such procedures included examining, on a test basis, evidence regarding the amounts and disclosures in the consolidated financial statements. Our audits also included evaluating the accounting principles used and significant estimates made by management, as well as evaluating the overall presentation of the consolidated financial statements. We believe that our audits provide a reasonable basis for our opinion.
Critical Audit Matters
The critical audit matters communicated below are matters arising from the current period audit of the consolidated financial statements that were communicated or required to be communicated to the audit committee and that: (1) relate to accounts or disclosures that are material to the consolidated financial statements and (2) involved our especially challenging, subjective, or complex judgments. The communication of critical audit matters does not alter in any way our opinion on the consolidated financial statements, taken as a whole, and we are not, by communicating the critical audit matters below, providing separate opinions on the critical audit matters or on the accounts or disclosures to which they relate.
Initial measurement of Clabber Girl trademarks and customer relationships
As discussed in Note 3 to the consolidated financial statements, on May 15, 2019, the Company acquired Clabber Girl Corporation (Clabber Girl) in a business combination. The Company acquired trademarks and customer relationships associated with the generation of future income from Clabber Girl’s existing customers. The acquisition-date fair value for the Clabber Girl trademarks and customer relationships was $19.6 million and $18.5 million, respectively.
We identified the evaluation of the initial measurement of the acquired Clabber Girl trademarks and customer relationships as a critical audit matter. There was a high degree of subjectivity in applying and
- 55 -
evaluating the discounted cash flow model used to calculate the acquisition-date fair value of the Clabber Girl trademarks and customer relationships. Specifically, the discounted cash flow model included the following assumptions, including internally developed assumptions for which there was limited observable market information, and the calculated fair values of such assets were sensitive to possible changes to these assumptions:
• forecasted revenues attributable to Clabber Girl trademarks and customer contracts • estimated annual attrition • forecasted earnings before interest, taxes, depreciation and amortization (EBITDA) • weighted-average cost of capital (WACC), including the estimated discount rate.
The primary procedures we performed to address this critical audit matter included the following. We tested certain internal controls over the Company’s acquisition-date valuation process to develop the relevant assumptions, as listed above, including controls related to the analysis of the assumptions based on market participants’ views. We evaluated the Company’s forecasted revenue growth rates by comparing them to industry benchmarks and data. We compared the Company’s estimates of (1) forecasted revenue growth and EBITDA to Clabber Girl’s historical actual results and (2) forecasted annual attrition to Clabber Girl’s historical customer attrition data. We assessed the assumptions for comparison to those of a market participant, including consideration of recent similar market transactions. We tested the Company’s determined WACC by comparing it to the WACCs of comparable peer companies. In addition, we involved valuation professionals with specialized skills and knowledge, who assisted in:
• evaluating the Company’s discount rate, and comparing it against a discount rate that was independently developed using publicly available market data for comparable entities; and
• evaluating an estimate of the fair value of the Clabber Girl trademarks and customer relationships using the Company’s cash flow forecast and a discount rate that was independently developed.
Assessment of the carrying values of certain indefinite-lived intangible assets
As discussed in Notes 2 and 6 to the consolidated financial statements, the other intangible assets, net balance as of December 28, 2019 was $1,615.1 million, of which $1,375.3 million related to indefinite-lived intangible assets (trademarks). The Company performs indefinite-lived intangible assets impairment testing as of the last day of each fiscal year.
We identified the assessment of the carrying values of certain indefinite-lived intangible assets as a critical audit matter. The revenue growth rates and the WACC assumptions used to calculate the fair values of certain indefinite-lived intangible assets were challenging to audit due to the significant estimation in the assumptions and that minor changes to these assumptions would have a significant effect on the Company’s assessment of the carrying values of the indefinite-lived intangible assets.
The primary procedures we performed to address this critical audit matter included the following. We tested certain internal controls over the Company’s indefinite-lived intangible assets impairment assessment process, including controls related to the determination of the fair values of the indefinite-lived intangible assets, related revenue growth rates, and determination of the WACC. We performed sensitivity analyses over the revenue growth rates assumption to assess their impact on the Company’s determination that the fair values of certain indefinite-lived intangible assets exceeded their carrying values. We evaluated the Company’s revenue growth rates by comparing them to historical results, economic and industry growth rates. In addition, we compared the Company’s historical revenue forecasts to actual results. We involved valuation professionals with specialized skill and knowledge, who assisted in evaluating the Company’s WACC, by comparing it to a WACC that was independently developed using publicly available market data for comparable entities.
/s/ KPMG LLP We have served as the Company’s auditor since 1996.
Short Hills, New Jersey February 26, 2020
- 56 -
Report of Independent Registered Public Accounting Firm
To the Stockholders and Board of Directors B&G Foods, Inc.:
Opinion on Internal Control Over Financial Reporting
We have audited B&G Foods, Inc. and subsidiaries’ (the Company) internal control over financial reporting as of December 28, 2019, based on criteria established in Internal Control – Integrated Framework (2013) issued by the Committee of Sponsoring Organizations of the Treadway Commission. In our opinion, the Company maintained, in all material respects, effective internal control over financial reporting as of December 28, 2019, based on criteria established in Internal Control – Integrated Framework (2013) issued by the Committee of Sponsoring Organizations of the Treadway Commission.
We also have audited, in accordance with the standards of the Public Company Accounting Oversight Board (United States) (PCAOB), the consolidated balance sheets of the Company as of December 28, 2019 and December 29, 2018, the related consolidated statements of operations, comprehensive income, changes in stockholders’ equity and cash flows for the fiscal years ended December 28, 2019, December 29, 2018 and December 30, 2017, and the related notes and the schedule of valuation and qualifying accounts (collectively, the consolidated financial statements), and our report dated February 26, 2020 expressed an unqualified opinion on those consolidated financial statements.
The Company acquired Clabber Girl Corporation on May 15, 2019, and management excluded from its assessment of the effectiveness of the Company’s internal control over financial reporting as of December 28, 2019, Clabber Girl Corporation’s internal control over financial reporting associated with 2.9% of total assets and 3.2% of total net sales included in the consolidated financial statements of the Company as of and for the fiscal year ended December 28, 2019. Our audit of internal control over financial reporting of the Company also excluded an evaluation of the internal control over financial reporting of Clabber Girl Corporation.
Basis for Opinion
The Company’s management is responsible for maintaining effective internal control over financial reporting and for its assessment of the effectiveness of internal control over financial reporting, included in the accompanying “Management’s Report on Internal Control Over Financial Reporting.” Our responsibility is to express an opinion on the Company’s internal control over financial reporting based on our audit. We are a public accounting firm registered with the PCAOB and are required to be independent with respect to the Company in accordance with the U.S. federal securities laws and the applicable rules and regulations of the Securities and Exchange Commission and the PCAOB.
We conducted our audit in accordance with the standards of the PCAOB. Those standards require that we plan and perform the audit to obtain reasonable assurance about whether effective internal control over financial reporting was maintained in all material respects. Our audit of internal control over financial reporting included obtaining an understanding of internal control over financial reporting, assessing the risk that a material weakness exists, and testing and evaluating the design and operating effectiveness of internal control based on the assessed risk. Our audit also included performing such other procedures as we considered necessary in the circumstances. We believe that our audit provides a reasonable basis for our opinion.
- 57 -
Definition and Limitations of Internal Control Over Financial Reporting
A company’s internal control over financial reporting is a process designed to provide reasonable assurance regarding the reliability of financial reporting and the preparation of financial statements for external purposes in accordance with generally accepted accounting principles. A company’s internal control over financial reporting includes those policies and procedures that (1) pertain to the maintenance of records that, in reasonable detail, accurately and fairly reflect the transactions and dispositions of the assets of the company; (2) provide reasonable assurance that transactions are recorded as necessary to permit preparation of financial statements in accordance with generally accepted accounting principles, and that receipts and expenditures of the company are being made only in accordance with authorizations of management and directors of the company; and (3) provide reasonable assurance regarding prevention or timely detection of unauthorized acquisition, use, or disposition of the company’s assets that could have a material effect on the financial statements.
Because of its inherent limitations, internal control over financial reporting may not prevent or detect misstatements. Also, projections of any evaluation of effectiveness to future periods are subject to the risk that controls may become inadequate because of changes in conditions, or that the degree of compliance with the policies or procedures may deteriorate.
/s/ KPMG LLP
Short Hills, New Jersey February 26, 2020
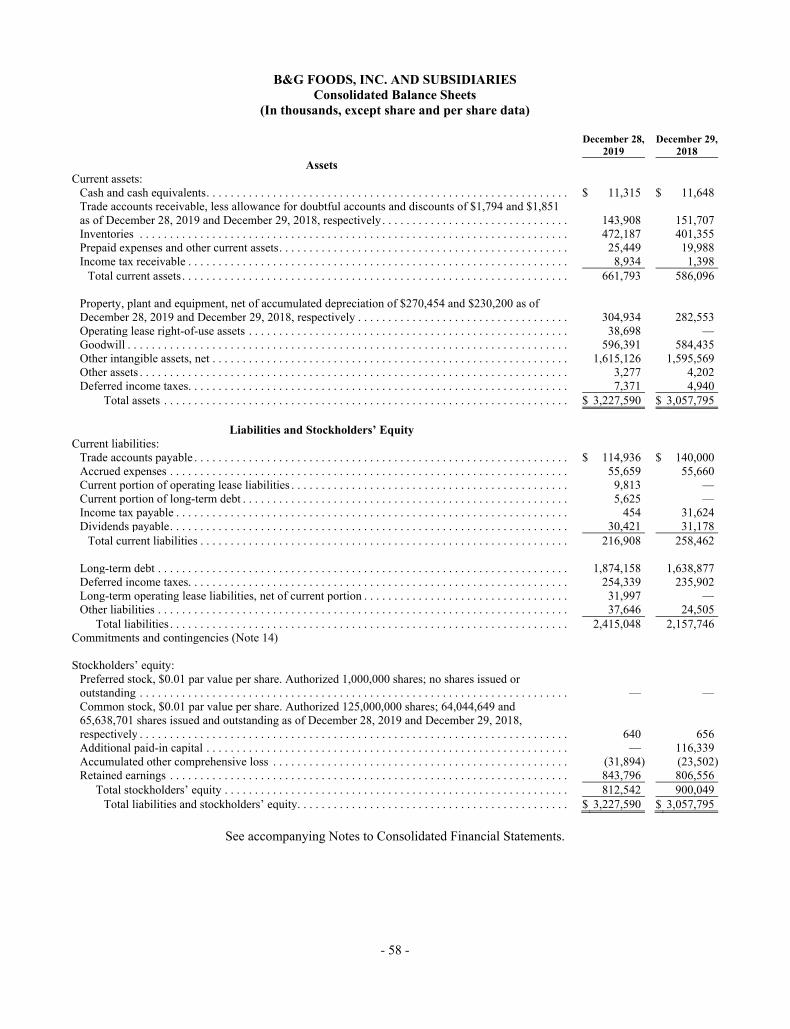
- 58 -
B&G FOODS, INC. AND SUBSIDIARIES Consolidated Balance Sheets
(In thousands, except share and per share data) December 28, December 29, 2019 2018
Assets Current assets:
Cash and cash equivalents . . . . . . . . . . . . . . . . . . . . . . . . . . . . . . . . . . . . . . . . . . . . . . . . . . . . . . . . . . . . $ 11,315 $ 11,648 Trade accounts receivable, less allowance for doubtful accounts and discounts of $1,794 and $1,851 as of December 28, 2019 and December 29, 2018, respectively . . . . . . . . . . . . . . . . . . . . . . . . . . . . . . . 143,908 151,707 Inventories . . . . . . . . . . . . . . . . . . . . . . . . . . . . . . . . . . . . . . . . . . . . . . . . . . . . . . . . . . . . . . . . . . . . . . . 472,187 401,355 Prepaid expenses and other current assets . . . . . . . . . . . . . . . . . . . . . . . . . . . . . . . . . . . . . . . . . . . . . . . . 25,449 19,988 Income tax receivable . . . . . . . . . . . . . . . . . . . . . . . . . . . . . . . . . . . . . . . . . . . . . . . . . . . . . . . . . . . . . . . 8,934 1,398
Total current assets . . . . . . . . . . . . . . . . . . . . . . . . . . . . . . . . . . . . . . . . . . . . . . . . . . . . . . . . . . . . . . . . 661,793 586,096
Property, plant and equipment, net of accumulated depreciation of $270,454 and $230,200 as of December 28, 2019 and December 29, 2018, respectively . . . . . . . . . . . . . . . . . . . . . . . . . . . . . . . . . . . 304,934 282,553 Operating lease right-of-use assets . . . . . . . . . . . . . . . . . . . . . . . . . . . . . . . . . . . . . . . . . . . . . . . . . . . . . 38,698 — Goodwill . . . . . . . . . . . . . . . . . . . . . . . . . . . . . . . . . . . . . . . . . . . . . . . . . . . . . . . . . . . . . . . . . . . . . . . . . 596,391 584,435 Other intangible assets, net . . . . . . . . . . . . . . . . . . . . . . . . . . . . . . . . . . . . . . . . . . . . . . . . . . . . . . . . . . . 1,615,126 1,595,569 Other assets . . . . . . . . . . . . . . . . . . . . . . . . . . . . . . . . . . . . . . . . . . . . . . . . . . . . . . . . . . . . . . . . . . . . . . . 3,277 4,202 Deferred income taxes. . . . . . . . . . . . . . . . . . . . . . . . . . . . . . . . . . . . . . . . . . . . . . . . . . . . . . . . . . . . . . . 7,371 4,940
Total assets . . . . . . . . . . . . . . . . . . . . . . . . . . . . . . . . . . . . . . . . . . . . . . . . . . . . . . . . . . . . . . . . . . . $ 3,227,590 $ 3,057,795
Liabilities and Stockholders’ Equity Current liabilities:
Trade accounts payable . . . . . . . . . . . . . . . . . . . . . . . . . . . . . . . . . . . . . . . . . . . . . . . . . . . . . . . . . . . . . . $ 114,936 $ 140,000 Accrued expenses . . . . . . . . . . . . . . . . . . . . . . . . . . . . . . . . . . . . . . . . . . . . . . . . . . . . . . . . . . . . . . . . . . 55,659 55,660 Current portion of operating lease liabilities . . . . . . . . . . . . . . . . . . . . . . . . . . . . . . . . . . . . . . . . . . . . . . 9,813 — Current portion of long-term debt . . . . . . . . . . . . . . . . . . . . . . . . . . . . . . . . . . . . . . . . . . . . . . . . . . . . . . 5,625 — Income tax payable . . . . . . . . . . . . . . . . . . . . . . . . . . . . . . . . . . . . . . . . . . . . . . . . . . . . . . . . . . . . . . . . . 454 31,624 Dividends payable . . . . . . . . . . . . . . . . . . . . . . . . . . . . . . . . . . . . . . . . . . . . . . . . . . . . . . . . . . . . . . . . . . 30,421 31,178
Total current liabilities . . . . . . . . . . . . . . . . . . . . . . . . . . . . . . . . . . . . . . . . . . . . . . . . . . . . . . . . . . . . . 216,908 258,462
Long-term debt . . . . . . . . . . . . . . . . . . . . . . . . . . . . . . . . . . . . . . . . . . . . . . . . . . . . . . . . . . . . . . . . . . . . 1,874,158 1,638,877 Deferred income taxes. . . . . . . . . . . . . . . . . . . . . . . . . . . . . . . . . . . . . . . . . . . . . . . . . . . . . . . . . . . . . . . 254,339 235,902 Long-term operating lease liabilities, net of current portion . . . . . . . . . . . . . . . . . . . . . . . . . . . . . . . . . . 31,997 — Other liabilities . . . . . . . . . . . . . . . . . . . . . . . . . . . . . . . . . . . . . . . . . . . . . . . . . . . . . . . . . . . . . . . . . . . . 37,646 24,505
Total liabilities . . . . . . . . . . . . . . . . . . . . . . . . . . . . . . . . . . . . . . . . . . . . . . . . . . . . . . . . . . . . . . . . . . 2,415,048 2,157,746 Commitments and contingencies (Note 14) Stockholders’ equity:
Preferred stock, $0.01 par value per share. Authorized 1,000,000 shares; no shares issued or outstanding . . . . . . . . . . . . . . . . . . . . . . . . . . . . . . . . . . . . . . . . . . . . . . . . . . . . . . . . . . . . . . . . . . . . . . . — — Common stock, $0.01 par value per share. Authorized 125,000,000 shares; 64,044,649 and 65,638,701 shares issued and outstanding as of December 28, 2019 and December 29, 2018, respectively . . . . . . . . . . . . . . . . . . . . . . . . . . . . . . . . . . . . . . . . . . . . . . . . . . . . . . . . . . . . . . . . . . . . . . . 640 656 Additional paid-in capital . . . . . . . . . . . . . . . . . . . . . . . . . . . . . . . . . . . . . . . . . . . . . . . . . . . . . . . . . . . . — 116,339 Accumulated other comprehensive loss . . . . . . . . . . . . . . . . . . . . . . . . . . . . . . . . . . . . . . . . . . . . . . . . . (31,894) (23,502)Retained earnings . . . . . . . . . . . . . . . . . . . . . . . . . . . . . . . . . . . . . . . . . . . . . . . . . . . . . . . . . . . . . . . . . . 843,796 806,556
Total stockholders’ equity . . . . . . . . . . . . . . . . . . . . . . . . . . . . . . . . . . . . . . . . . . . . . . . . . . . . . . . . . 812,542 900,049 Total liabilities and stockholders’ equity . . . . . . . . . . . . . . . . . . . . . . . . . . . . . . . . . . . . . . . . . . . . . $ 3,227,590 $ 3,057,795
See accompanying Notes to Consolidated Financial Statements.
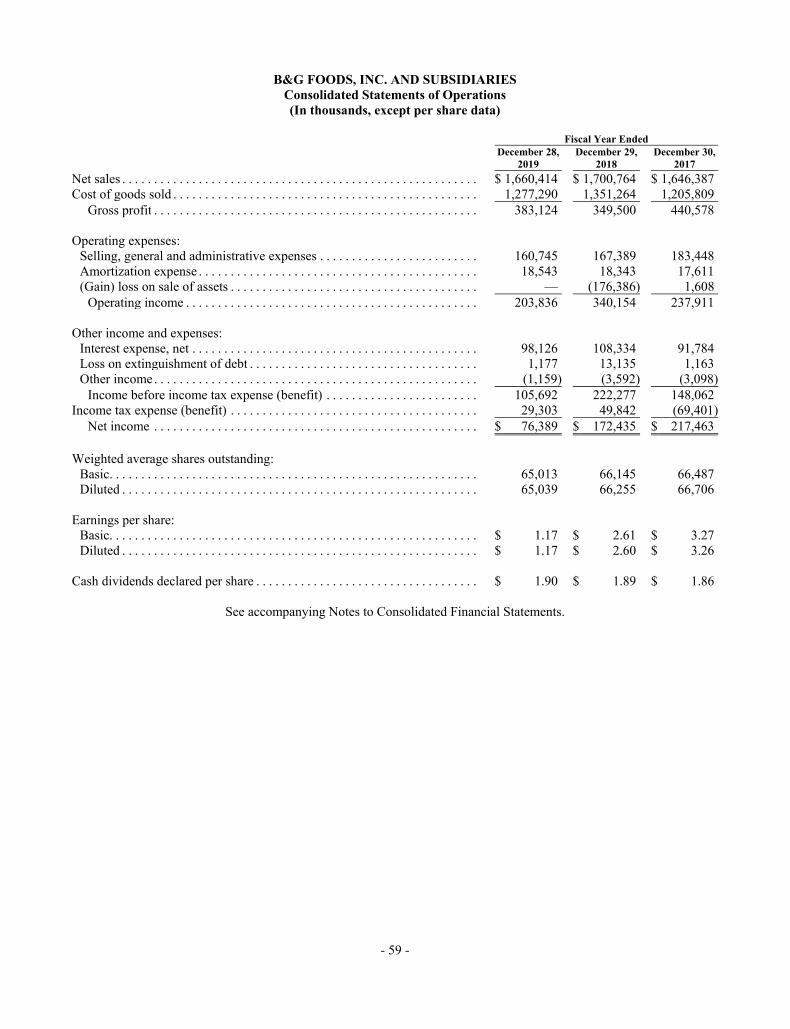
- 59 -
B&G FOODS, INC. AND SUBSIDIARIES Consolidated Statements of Operations (In thousands, except per share data)
Fiscal Year Ended December 28, December 29, December 30, 2019 2018 2017 Net sales . . . . . . . . . . . . . . . . . . . . . . . . . . . . . . . . . . . . . . . . . . . . . . . . . . . . . . . . $ 1,660,414 $ 1,700,764 $ 1,646,387 Cost of goods sold . . . . . . . . . . . . . . . . . . . . . . . . . . . . . . . . . . . . . . . . . . . . . . . . 1,277,290 1,351,264 1,205,809
Gross profit . . . . . . . . . . . . . . . . . . . . . . . . . . . . . . . . . . . . . . . . . . . . . . . . . . . 383,124 349,500 440,578
Operating expenses: Selling, general and administrative expenses . . . . . . . . . . . . . . . . . . . . . . . . . 160,745 167,389 183,448 Amortization expense . . . . . . . . . . . . . . . . . . . . . . . . . . . . . . . . . . . . . . . . . . . . 18,543 18,343 17,611 (Gain) loss on sale of assets . . . . . . . . . . . . . . . . . . . . . . . . . . . . . . . . . . . . . . . — (176,386) 1,608
Operating income . . . . . . . . . . . . . . . . . . . . . . . . . . . . . . . . . . . . . . . . . . . . . . 203,836 340,154 237,911
Other income and expenses: Interest expense, net . . . . . . . . . . . . . . . . . . . . . . . . . . . . . . . . . . . . . . . . . . . . . 98,126 108,334 91,784 Loss on extinguishment of debt . . . . . . . . . . . . . . . . . . . . . . . . . . . . . . . . . . . . 1,177 13,135 1,163 Other income . . . . . . . . . . . . . . . . . . . . . . . . . . . . . . . . . . . . . . . . . . . . . . . . . . . (1,159) (3,592) (3,098)
Income before income tax expense (benefit) . . . . . . . . . . . . . . . . . . . . . . . . 105,692 222,277 148,062 Income tax expense (benefit) . . . . . . . . . . . . . . . . . . . . . . . . . . . . . . . . . . . . . . . 29,303 49,842 (69,401)
Net income . . . . . . . . . . . . . . . . . . . . . . . . . . . . . . . . . . . . . . . . . . . . . . . . . . . $ 76,389 $ 172,435 $ 217,463
Weighted average shares outstanding: Basic. . . . . . . . . . . . . . . . . . . . . . . . . . . . . . . . . . . . . . . . . . . . . . . . . . . . . . . . . . 65,013 66,145 66,487 Diluted . . . . . . . . . . . . . . . . . . . . . . . . . . . . . . . . . . . . . . . . . . . . . . . . . . . . . . . . 65,039 66,255 66,706
Earnings per share: Basic. . . . . . . . . . . . . . . . . . . . . . . . . . . . . . . . . . . . . . . . . . . . . . . . . . . . . . . . . . $ 1.17 $ 2.61 $ 3.27 Diluted . . . . . . . . . . . . . . . . . . . . . . . . . . . . . . . . . . . . . . . . . . . . . . . . . . . . . . . . $ 1.17 $ 2.60 $ 3.26
Cash dividends declared per share . . . . . . . . . . . . . . . . . . . . . . . . . . . . . . . . . . . $ 1.90 $ 1.89 $ 1.86
See accompanying Notes to Consolidated Financial Statements.
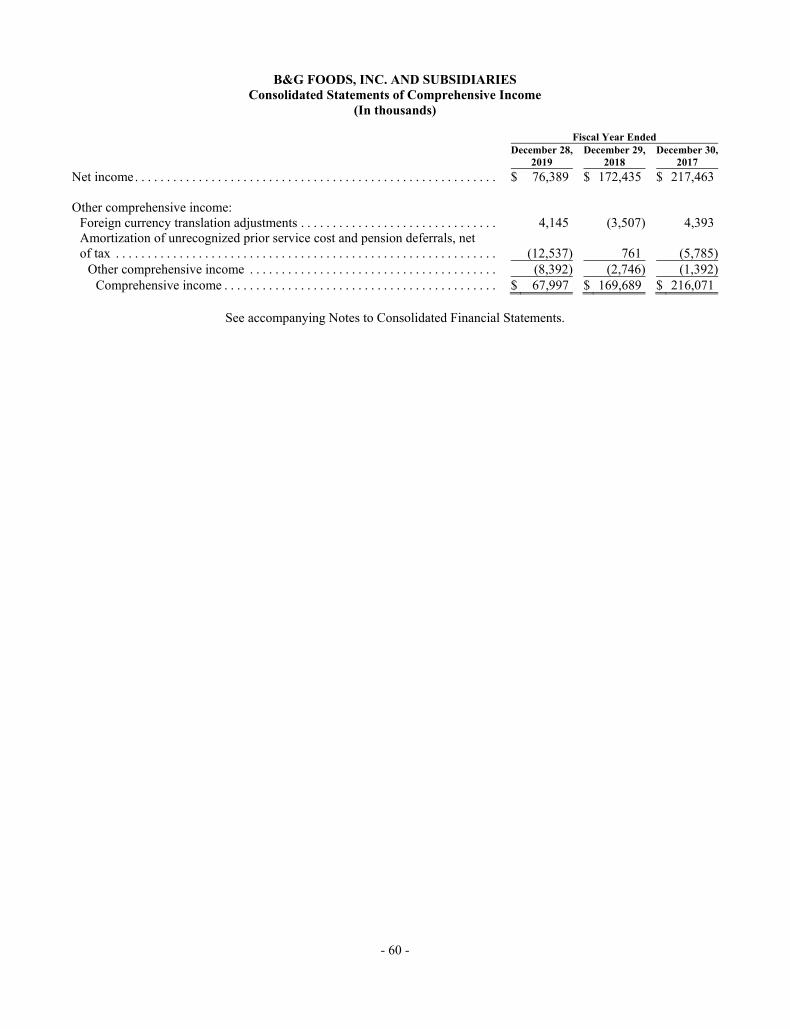
- 60 -
B&G FOODS, INC. AND SUBSIDIARIES Consolidated Statements of Comprehensive Income
(In thousands)
Fiscal Year Ended December 28, December 29, December 30, 2019 2018 2017 Net income . . . . . . . . . . . . . . . . . . . . . . . . . . . . . . . . . . . . . . . . . . . . . . . . . . . . . . . . . $ 76,389 $ 172,435 $ 217,463 Other comprehensive income:
Foreign currency translation adjustments . . . . . . . . . . . . . . . . . . . . . . . . . . . . . . . 4,145 (3,507) 4,393 Amortization of unrecognized prior service cost and pension deferrals, net of tax . . . . . . . . . . . . . . . . . . . . . . . . . . . . . . . . . . . . . . . . . . . . . . . . . . . . . . . . . . . . (12,537) 761 (5,785)
Other comprehensive income . . . . . . . . . . . . . . . . . . . . . . . . . . . . . . . . . . . . . . . (8,392) (2,746) (1,392)Comprehensive income . . . . . . . . . . . . . . . . . . . . . . . . . . . . . . . . . . . . . . . . . . . $ 67,997 $ 169,689 $ 216,071
See accompanying Notes to Consolidated Financial Statements.
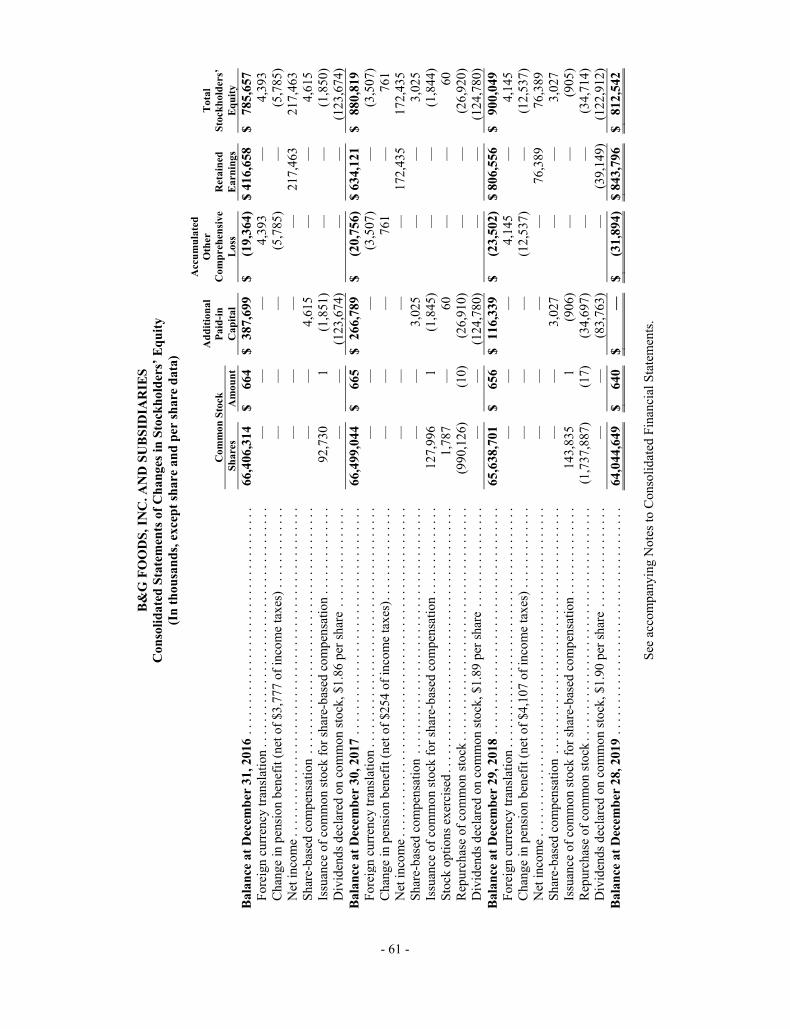
- 61 -
B&G
FO
OD
S, IN
C. A
ND
SU
BSID
IAR
IES
Con
solid
ated
Sta
tem
ents
of C
hang
es in
Sto
ckho
lder
s’ E
quity
(I
n th
ousa
nds,
exce
pt sh
are a
nd p
er sh
are d
ata)
A
ccum
ulat
ed
Add
ition
al
Oth
er
Tota
l
C
omm
on S
tock
Paid
-in
C
ompr
ehen
sive
Ret
aine
d
Stoc
khol
ders
’
Shar
es
A
mou
nt
C
apita
l
Lo
ss
Earn
ings
Eq
uity
Ba
lanc
e at D
ecem
ber 3
1, 2
016
....
....
....
....
....
....
....
....
....
6
6,40
6,31
4
$ 6
64
$ 3
87,6
99
$ (1
9,36
4)
$ 41
6,65
8
$ 7
85,6
57
Fore
ign
curre
ncy
trans
latio
n ..
....
....
....
....
....
....
....
....
....
—
—
—
4,3
93
—
4,3
93
Chan
ge in
pen
sion
bene
fit (n
et o
f $3,
777
of in
com
e ta
xes)
...
....
....
..
—
—
—
(5
,785
)
—
(5
,785
)N
et in
com
e ...
....
....
....
....
....
....
....
....
....
....
....
....
.
—
—
—
—
217,
463
217
,463
Sh
are-
base
d co
mpe
nsat
ion
....
....
....
....
....
....
....
....
....
...
—
—
4
,615
—
—
4,6
15
Issu
ance
of c
omm
on st
ock
for s
hare
- bas
ed c
ompe
nsat
ion
....
....
....
..
92,
730
1
(1
,851
)
—
—
(1,8
50)
Div
iden
ds d
ecla
red
on c
omm
on st
ock,
$1.
86 p
er sh
are
....
....
....
....
—
—
(1
23,6
74)
—
—
(1
23,6
74)
Bala
nce a
t Dec
embe
r 30,
201
7 ..
....
....
....
....
....
....
....
....
..
66,
499,
044
$
665
$
266
,789
$
(20,
756)
$
634,
121
$
880
,819
Fo
reig
n cu
rrenc
y tra
nsla
tion
....
....
....
....
....
....
....
....
....
..
—
—
—
(3
,507
)
—
(3
,507
)Ch
ange
in p
ensio
n be
nefit
(net
of $
254
of in
com
e ta
xes)
....
....
....
...
—
—
—
761
—
7
61
Net
inco
me .
....
....
....
....
....
....
....
....
....
....
....
....
...
—
—
—
—
17
2,43
5
1
72,4
35
Shar
e-ba
sed
com
pens
atio
n ..
....
....
....
....
....
....
....
....
....
.
—
—
3,0
25
—
—
3
,025
Is
suan
ce o
f com
mon
stoc
k fo
r sha
re-b
ased
com
pens
atio
n ..
....
....
....
1
27,9
96
1
(1,8
45)
—
—
(1
,844
)St
ock
optio
ns e
xerc
ised .
....
....
....
....
....
....
....
....
....
....
.
1,7
87
—
60
—
—
60
Repu
rcha
se o
f com
mon
stoc
k ...
....
....
....
....
....
....
....
....
..
(990
,126
)
(10)
(26,
910)
—
—
(26,
920)
Div
iden
ds d
ecla
red
on c
omm
on st
ock,
$1.
89 p
er sh
are
....
....
....
....
—
—
(1
24,7
80)
—
—
(1
24,7
80)
Bala
nce a
t Dec
embe
r 29,
201
8 ..
....
....
....
....
....
....
....
....
..
65,
638,
701
$
656
$
116
,339
$
(23,
502)
$
806,
556
$
900
,049
Fo
reig
n cu
rrenc
y tra
nsla
tion
....
....
....
....
....
....
....
....
....
..
—
—
—
4
,145
—
4
,145
Ch
ange
in p
ensio
n be
nefit
(net
of $
4,10
7 of
inco
me
taxe
s) .
....
....
....
—
—
—
(12,
537)
—
(1
2,53
7)N
et in
com
e ...
....
....
....
....
....
....
....
....
....
....
....
....
.
—
—
—
—
76,
389
76,
389
Shar
e-ba
sed
com
pens
atio
n ..
....
....
....
....
....
....
....
....
....
.
—
—
3,0
27
—
—
3
,027
Is
suan
ce o
f com
mon
stoc
k fo
r sha
re- b
ased
com
pens
atio
n ..
....
....
....
1
43,8
35
1
(906
)
—
—
(905
)Re
purc
hase
of c
omm
on st
ock .
....
....
....
....
....
....
....
....
....
(1
,737
,887
)
(17)
(34,
697)
—
—
(34,
714)
Div
iden
ds d
ecla
red
on c
omm
on st
ock,
$1.
90 p
er sh
are
....
....
....
....
—
—
(8
3,76
3)
—
(39,
149)
(122
,912
)Ba
lanc
e at D
ecem
ber 2
8, 2
019
....
....
....
....
....
....
....
....
....
6
4,04
4,64
9
$ 6
40
$ —
$
(31,
894)
$
843,
796
$
812
,542
See
acco
mpa
nyin
g N
otes
to C
onso
lidat
ed F
inan
cial
Sta
tem
ents.
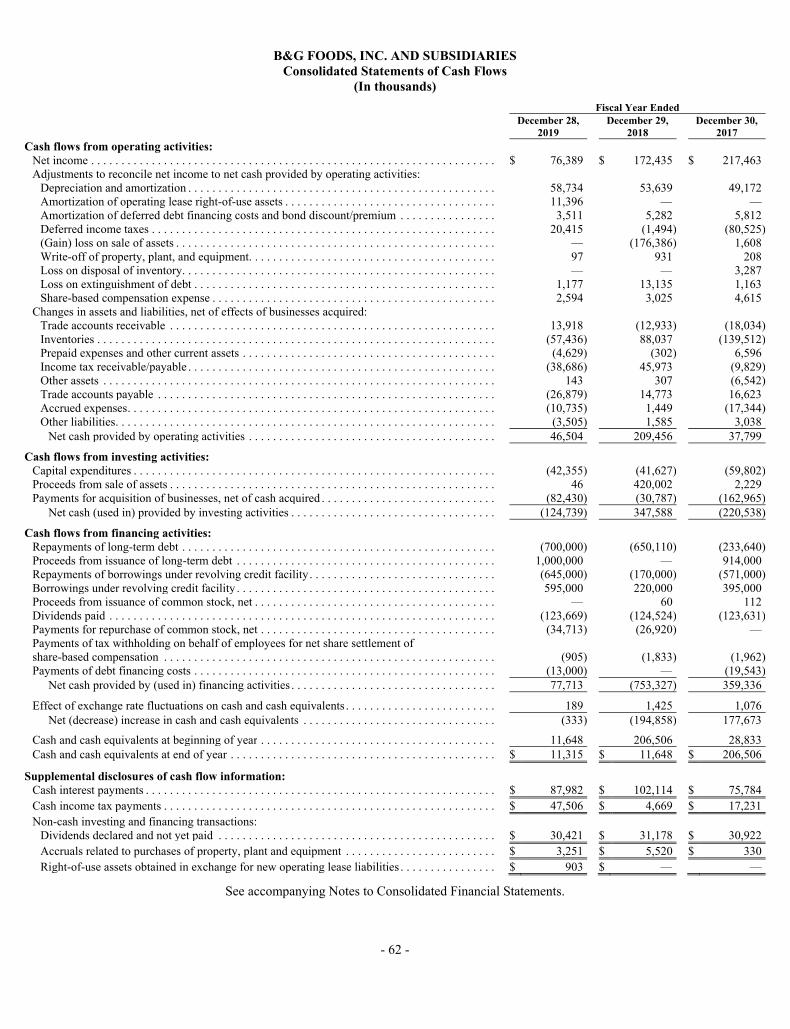
- 62 -
B&G FOODS, INC. AND SUBSIDIARIES Consolidated Statements of Cash Flows
(In thousands)
Fiscal Year Ended December 28, December 29, December 30, 2019 2018 2017 Cash flows from operating activities:
Net income . . . . . . . . . . . . . . . . . . . . . . . . . . . . . . . . . . . . . . . . . . . . . . . . . . . . . . . . . . . . . . . . . . . $ 76,389 $ 172,435 $ 217,463 Adjustments to reconcile net income to net cash provided by operating activities:
Depreciation and amortization . . . . . . . . . . . . . . . . . . . . . . . . . . . . . . . . . . . . . . . . . . . . . . . . . . . 58,734 53,639 49,172 Amortization of operating lease right-of-use assets . . . . . . . . . . . . . . . . . . . . . . . . . . . . . . . . . . . 11,396 — — Amortization of deferred debt financing costs and bond discount/premium . . . . . . . . . . . . . . . . 3,511 5,282 5,812 Deferred income taxes . . . . . . . . . . . . . . . . . . . . . . . . . . . . . . . . . . . . . . . . . . . . . . . . . . . . . . . . . 20,415 (1,494) (80,525)(Gain) loss on sale of assets . . . . . . . . . . . . . . . . . . . . . . . . . . . . . . . . . . . . . . . . . . . . . . . . . . . . . — (176,386) 1,608 Write-off of property, plant, and equipment . . . . . . . . . . . . . . . . . . . . . . . . . . . . . . . . . . . . . . . . . 97 931 208 Loss on disposal of inventory . . . . . . . . . . . . . . . . . . . . . . . . . . . . . . . . . . . . . . . . . . . . . . . . . . . . — — 3,287 Loss on extinguishment of debt . . . . . . . . . . . . . . . . . . . . . . . . . . . . . . . . . . . . . . . . . . . . . . . . . . 1,177 13,135 1,163 Share-based compensation expense . . . . . . . . . . . . . . . . . . . . . . . . . . . . . . . . . . . . . . . . . . . . . . . 2,594 3,025 4,615
Changes in assets and liabilities, net of effects of businesses acquired: Trade accounts receivable . . . . . . . . . . . . . . . . . . . . . . . . . . . . . . . . . . . . . . . . . . . . . . . . . . . . . . 13,918 (12,933) (18,034)Inventories . . . . . . . . . . . . . . . . . . . . . . . . . . . . . . . . . . . . . . . . . . . . . . . . . . . . . . . . . . . . . . . . . . (57,436) 88,037 (139,512)Prepaid expenses and other current assets . . . . . . . . . . . . . . . . . . . . . . . . . . . . . . . . . . . . . . . . . . (4,629) (302) 6,596 Income tax receivable/payable . . . . . . . . . . . . . . . . . . . . . . . . . . . . . . . . . . . . . . . . . . . . . . . . . . . (38,686) 45,973 (9,829)Other assets . . . . . . . . . . . . . . . . . . . . . . . . . . . . . . . . . . . . . . . . . . . . . . . . . . . . . . . . . . . . . . . . . 143 307 (6,542)Trade accounts payable . . . . . . . . . . . . . . . . . . . . . . . . . . . . . . . . . . . . . . . . . . . . . . . . . . . . . . . . (26,879) 14,773 16,623 Accrued expenses . . . . . . . . . . . . . . . . . . . . . . . . . . . . . . . . . . . . . . . . . . . . . . . . . . . . . . . . . . . . . (10,735) 1,449 (17,344)Other liabilities . . . . . . . . . . . . . . . . . . . . . . . . . . . . . . . . . . . . . . . . . . . . . . . . . . . . . . . . . . . . . . . (3,505) 1,585 3,038
Net cash provided by operating activities . . . . . . . . . . . . . . . . . . . . . . . . . . . . . . . . . . . . . . . . . 46,504 209,456 37,799
Cash flows from investing activities: Capital expenditures . . . . . . . . . . . . . . . . . . . . . . . . . . . . . . . . . . . . . . . . . . . . . . . . . . . . . . . . . . . . (42,355) (41,627) (59,802)Proceeds from sale of assets . . . . . . . . . . . . . . . . . . . . . . . . . . . . . . . . . . . . . . . . . . . . . . . . . . . . . . 46 420,002 2,229 Payments for acquisition of businesses, net of cash acquired . . . . . . . . . . . . . . . . . . . . . . . . . . . . . (82,430) (30,787) (162,965)
Net cash (used in) provided by investing activities . . . . . . . . . . . . . . . . . . . . . . . . . . . . . . . . . . (124,739) 347,588 (220,538)
Cash flows from financing activities: Repayments of long-term debt . . . . . . . . . . . . . . . . . . . . . . . . . . . . . . . . . . . . . . . . . . . . . . . . . . . . (700,000) (650,110) (233,640)Proceeds from issuance of long-term debt . . . . . . . . . . . . . . . . . . . . . . . . . . . . . . . . . . . . . . . . . . . 1,000,000 — 914,000 Repayments of borrowings under revolving credit facility . . . . . . . . . . . . . . . . . . . . . . . . . . . . . . . (645,000) (170,000) (571,000)Borrowings under revolving credit facility . . . . . . . . . . . . . . . . . . . . . . . . . . . . . . . . . . . . . . . . . . . 595,000 220,000 395,000 Proceeds from issuance of common stock, net . . . . . . . . . . . . . . . . . . . . . . . . . . . . . . . . . . . . . . . . — 60 112 Dividends paid . . . . . . . . . . . . . . . . . . . . . . . . . . . . . . . . . . . . . . . . . . . . . . . . . . . . . . . . . . . . . . . . (123,669) (124,524) (123,631)Payments for repurchase of common stock, net . . . . . . . . . . . . . . . . . . . . . . . . . . . . . . . . . . . . . . . (34,713) (26,920) — Payments of tax withholding on behalf of employees for net share settlement of share-based compensation . . . . . . . . . . . . . . . . . . . . . . . . . . . . . . . . . . . . . . . . . . . . . . . . . . . . . . . (905) (1,833) (1,962)Payments of debt financing costs . . . . . . . . . . . . . . . . . . . . . . . . . . . . . . . . . . . . . . . . . . . . . . . . . . (13,000) — (19,543)
Net cash provided by (used in) financing activities . . . . . . . . . . . . . . . . . . . . . . . . . . . . . . . . . . 77,713 (753,327) 359,336
Effect of exchange rate fluctuations on cash and cash equivalents . . . . . . . . . . . . . . . . . . . . . . . . . 189 1,425 1,076 Net (decrease) increase in cash and cash equivalents . . . . . . . . . . . . . . . . . . . . . . . . . . . . . . . . (333) (194,858) 177,673
Cash and cash equivalents at beginning of year . . . . . . . . . . . . . . . . . . . . . . . . . . . . . . . . . . . . . . . 11,648 206,506 28,833 Cash and cash equivalents at end of year . . . . . . . . . . . . . . . . . . . . . . . . . . . . . . . . . . . . . . . . . . . . $ 11,315 $ 11,648 $ 206,506
Supplemental disclosures of cash flow information: Cash interest payments . . . . . . . . . . . . . . . . . . . . . . . . . . . . . . . . . . . . . . . . . . . . . . . . . . . . . . . . . . $ 87,982 $ 102,114 $ 75,784 Cash income tax payments . . . . . . . . . . . . . . . . . . . . . . . . . . . . . . . . . . . . . . . . . . . . . . . . . . . . . . . $ 47,506 $ 4,669 $ 17,231 Non-cash investing and financing transactions:
Dividends declared and not yet paid . . . . . . . . . . . . . . . . . . . . . . . . . . . . . . . . . . . . . . . . . . . . . . $ 30,421 $ 31,178 $ 30,922 Accruals related to purchases of property, plant and equipment . . . . . . . . . . . . . . . . . . . . . . . . . $ 3,251 $ 5,520 $ 330 Right-of-use assets obtained in exchange for new operating lease liabilities . . . . . . . . . . . . . . . . $ 903 $ — —
See accompanying Notes to Consolidated Financial Statements.
B&G FOODS, INC. AND SUBSIDIARIES Notes to Consolidated Financial Statements
December 28, 2019, December 29, 2018 and December 30, 2017
- 63 -
(1) Nature of Operations
Organization and Nature of Operations
B&G Foods, Inc. is a holding company whose principal assets are the shares of capital stock of its subsidiaries. Unless the context requires otherwise, references in this report to “B&G Foods,” “our company,” “we,” “us” and “our” refer to B&G Foods, Inc. and its subsidiaries. Our financial statements are presented on a consolidated basis.
We operate in a single industry segment and manufacture, sell and distribute a diverse portfolio of high-quality shelf-stable and frozen foods across the United States, Canada and Puerto Rico. Our products include frozen and canned vegetables, oatmeal and other hot cereals, fruit spreads, canned meats and beans, bagel chips, spices, seasonings, hot sauces, wine vinegar, maple syrup, molasses, salad dressings, pizza crusts, Mexican-style sauces, dry soups, taco shells and kits, salsas, pickles, peppers, tomato-based products, cookies and crackers, baking powder, baking soda, corn starch, nut clusters and other specialty products. Our products are marketed under many recognized brands, including Ac’cent, B&G, B&M, Back to Nature, Baker’s Joy, Bear Creek Country Kitchens, Brer Rabbit, Canoleo, Cary’s, Clabber Girl, Cream of Rice, Cream of Wheat, Davis, Devonsheer, Don Pepino, Durkee, Emeril’s, Grandma’s Molasses, Green Giant, JJ Flats, Joan of Arc, Las Palmas, Le Sueur, MacDonald’s, Mama Mary’s, Maple Grove Farms of Vermont, McCann’s, Molly McButter, Mrs. Dash, New York Flatbreads, New York Style, Old London, Ortega, Polaner, Red Devil, Regina, Rumford, Sa-són, Sclafani, SnackWell’s, Spice Islands, Spring Tree, Sugar Twin, Tone’s, Trappey’s, TrueNorth, Underwood, Vermont Maid, Victoria, Weber and Wright’s. We also sell and distribute Static Guard, a household product brand. We compete in the retail grocery, foodservice, specialty, private label, club and mass merchandiser channels of distribution. We sell and distribute our products directly and via a network of independent brokers and distributors to supermarket chains, foodservice outlets, mass merchants, warehouse clubs, non-food outlets and specialty distributors.
Sales of a number of our products tend to be seasonal and may be influenced by holidays, changes in seasons/weather or certain other annual events. In general, our sales are higher in the first and fourth quarter. We purchase most of the produce used to make our frozen and shelf-stable canned vegetables, pickles, relishes, peppers, tomatoes and other related specialty items during the months of June through October, and we generally purchase the majority of our maple syrup requirements during the months of April through August. Consequently, our liquidity needs are greatest during these periods.
Fiscal Year
We utilize a 52-53 week fiscal year ending on the Saturday closest to December 31. The fiscal years ended December 28, 2019 (fiscal 2019), December 29, 2018 (fiscal 2018) and December 30, 2017 (fiscal 2017) contained 52 weeks each.
Business and Credit Concentrations
Our exposure to credit loss in the event of non-payment of accounts receivable by customers is estimated in the amount of the allowance for doubtful accounts. We perform ongoing credit evaluations of the financial condition of our customers. Our top ten customers accounted for approximately 59.1%, 56.9% and 55.8% of consolidated net sales in fiscal 2019, 2018 and 2017, respectively. Our top ten customers accounted for approximately 62.3%, 55.8% and 51.7% of our consolidated trade accounts receivables as of the end of fiscal 2019, 2018 and 2017, respectively. Other than Walmart, which accounted for approximately 25.6%, 24.1% and 24.1% of our consolidated net sales in fiscal 2019, 2018 and 2017, respectively, no single customer accounted for more than 10.0% of consolidated net sales in fiscal 2019, 2018 or 2017. Other than Walmart, which accounted for approximately 29.1%, 24.9% and 22.4% of our consolidated trade accounts receivables as of the end of fiscal 2019, 2018 and 2017, respectively, no single customer accounted for more than 10.0% of our consolidated trade accounts receivables as of the end of fiscal 2019, 2018 and 2017. As of December 28, 2019, we do not believe we have any significant concentration of credit risk with respect to our consolidated trade accounts receivable with any single customer whose failure or nonperformance would materially affect our results other than as described above with respect to Walmart.
During fiscal 2019, 2018 and 2017, our sales to foreign countries represented approximately 7.7%, 7.3% and 6.3%, respectively, of net sales. Our foreign sales are primarily to customers in Canada.
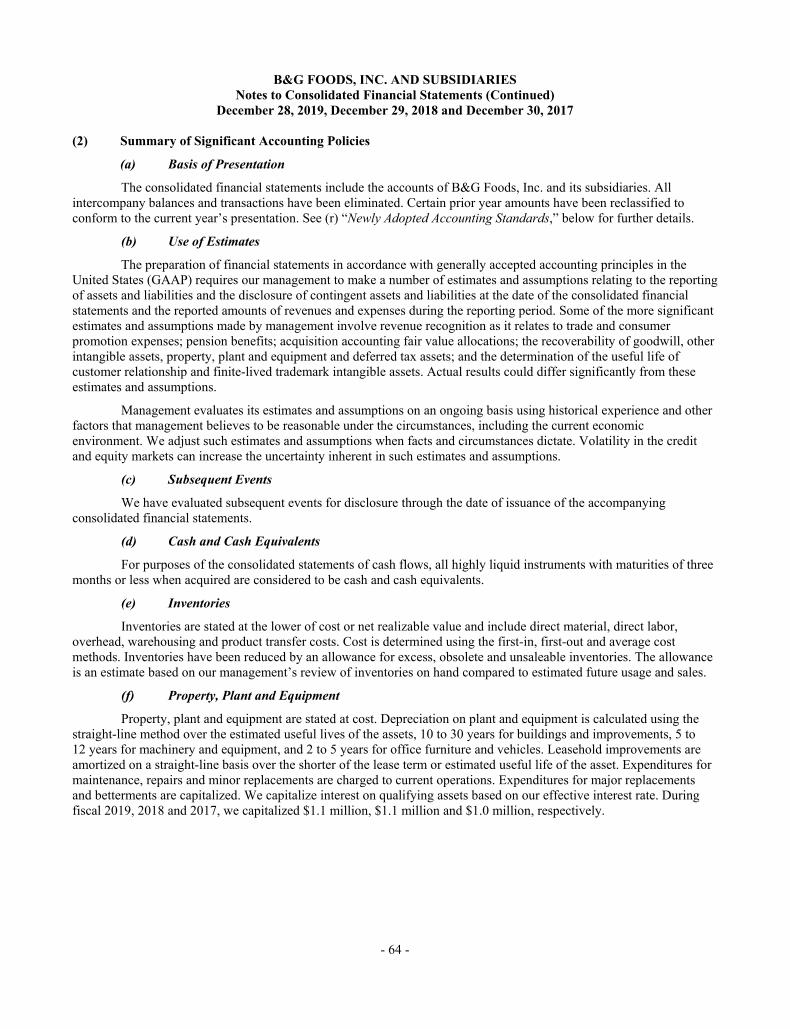
B&G FOODS, INC. AND SUBSIDIARIES Notes to Consolidated Financial Statements (Continued)
December 28, 2019, December 29, 2018 and December 30, 2017
- 64 -
(2) Summary of Significant Accounting Policies
(a) Basis of Presentation
The consolidated financial statements include the accounts of B&G Foods, Inc. and its subsidiaries. All intercompany balances and transactions have been eliminated. Certain prior year amounts have been reclassified to conform to the current year’s presentation. See (r) “Newly Adopted Accounting Standards,” below for further details.
(b) Use of Estimates
The preparation of financial statements in accordance with generally accepted accounting principles in the United States (GAAP) requires our management to make a number of estimates and assumptions relating to the reporting of assets and liabilities and the disclosure of contingent assets and liabilities at the date of the consolidated financial statements and the reported amounts of revenues and expenses during the reporting period. Some of the more significant estimates and assumptions made by management involve revenue recognition as it relates to trade and consumer promotion expenses; pension benefits; acquisition accounting fair value allocations; the recoverability of goodwill, other intangible assets, property, plant and equipment and deferred tax assets; and the determination of the useful life of customer relationship and finite-lived trademark intangible assets. Actual results could differ significantly from these estimates and assumptions.
Management evaluates its estimates and assumptions on an ongoing basis using historical experience and other factors that management believes to be reasonable under the circumstances, including the current economic environment. We adjust such estimates and assumptions when facts and circumstances dictate. Volatility in the credit and equity markets can increase the uncertainty inherent in such estimates and assumptions.
(c) Subsequent Events
We have evaluated subsequent events for disclosure through the date of issuance of the accompanying consolidated financial statements.
(d) Cash and Cash Equivalents
For purposes of the consolidated statements of cash flows, all highly liquid instruments with maturities of three months or less when acquired are considered to be cash and cash equivalents.
(e) Inventories
Inventories are stated at the lower of cost or net realizable value and include direct material, direct labor, overhead, warehousing and product transfer costs. Cost is determined using the first-in, first-out and average cost methods. Inventories have been reduced by an allowance for excess, obsolete and unsaleable inventories. The allowance is an estimate based on our management’s review of inventories on hand compared to estimated future usage and sales.
(f) Property, Plant and Equipment
Property, plant and equipment are stated at cost. Depreciation on plant and equipment is calculated using the straight-line method over the estimated useful lives of the assets, 10 to 30 years for buildings and improvements, 5 to 12 years for machinery and equipment, and 2 to 5 years for office furniture and vehicles. Leasehold improvements are amortized on a straight-line basis over the shorter of the lease term or estimated useful life of the asset. Expenditures for maintenance, repairs and minor replacements are charged to current operations. Expenditures for major replacements and betterments are capitalized. We capitalize interest on qualifying assets based on our effective interest rate. During fiscal 2019, 2018 and 2017, we capitalized $1.1 million, $1.1 million and $1.0 million, respectively.
B&G FOODS, INC. AND SUBSIDIARIES Notes to Consolidated Financial Statements (Continued)
December 28, 2019, December 29, 2018 and December 30, 2017
- 65 -
(g) Goodwill and Other Intangible Assets
Goodwill and indefinite-lived intangible assets (trademarks) are tested for impairment at least annually and whenever events or circumstances occur indicating that goodwill or indefinite-lived intangible assets might be impaired. We perform the annual impairment tests as of the last day of each fiscal year. The annual goodwill impairment test involves a two-step process. The first step of the impairment test involves comparing our company’s market capitalization with our company’s carrying value, including goodwill. If the carrying value of our company exceeds our market capitalization, we perform the second step of the impairment test to determine the amount of the impairment loss. The second step of the goodwill impairment test involves comparing the implied fair value of goodwill with the carrying value and recognizing a loss for the difference.
We test our indefinite-lived intangible assets by comparing the fair value with the carrying value and recognize a loss for the difference. We estimate the fair value of our indefinite-lived intangible assets based on discounted cash flows that reflect certain third party market value indicators.
Calculating our fair value for these purposes requires significant estimates and assumptions by management. We completed our annual impairment tests for fiscal 2019, 2018 and 2017 with no adjustments to the carrying values of goodwill and indefinite-lived intangible assets. Each annual test confirmed that the market capitalization and fair values of our goodwill and indefinite-lived intangible assets, respectively, exceeded their current carrying values.
Customer relationships and finite-lived trademarks are presented at cost, net of accumulated amortization, and are amortized on a straight-line basis over their estimated useful lives of 10 to 20 years.
Seed technology assets are presented at cost, net of accumulated amortization, and are amortized utilizing a declining balance approach over their estimated useful lives of 5 years. During fiscal 2017, we sold to a third-party co-packer our Le Sueur, Minnesota research center, including the seed technology assets, property, plant and equipment, which we acquired as part of the Green Giant acquisition, resulting in a $1.6 million pre-tax loss on sale of assets.
(h) Deferred Debt Financing Costs
Debt financing costs are capitalized and amortized over the term of the related debt agreements and are included as a reduction of long-term debt. Amortization of deferred debt financing costs for fiscal 2019, 2018 and 2017 was $3.5 million, $5.3 million and $5.4 million, respectively.
(i) Long-Lived Assets
Long-lived assets, such as property, plant and equipment, and intangible assets with estimated useful lives, are depreciated or amortized over their respective estimated useful lives to their estimated residual values, and reviewed for impairment whenever events or changes in circumstances indicate that the carrying amount of an asset may not be recoverable. Recoverability of assets to be held and used is measured by a comparison of the carrying amount of an asset to estimated undiscounted future net cash flows expected to be generated by the asset. If the carrying amount of an asset exceeds its estimated undiscounted future net cash flows, an impairment charge is recognized by the amount by which the carrying amount of the asset exceeds the fair value of the asset. Recoverability of assets held for sale is measured by a comparison of the carrying amount of an asset or asset group to their fair value less estimated costs to sell. Estimating future cash flows and calculating the fair value of assets requires significant estimates and assumptions by management.
Assets to be disposed of are separately presented in the consolidated balance sheets and are no longer depreciated.
(j) Accumulated Other Comprehensive Loss
Accumulated other comprehensive loss includes foreign currency translation adjustments relating to assets and liabilities located in our foreign subsidiaries and changes in our pension benefits due to the initial adoption and ongoing application of the authoritative accounting literature relating to pensions, net of tax.
B&G FOODS, INC. AND SUBSIDIARIES Notes to Consolidated Financial Statements (Continued)
December 28, 2019, December 29, 2018 and December 30, 2017
- 66 -
(k) Revenue Recognition
Revenues are recognized when our performance obligation is satisfied. Our primary performance obligation is satisfied when products are shipped. We report all amounts billed to a customer in a sale transaction as revenue, including those amounts related to shipping and handling. Shipping and handling costs are included in cost of goods sold. Consideration from a vendor to a retailer is presumed to be a reduction to the selling prices of the vendor’s products and, therefore, is characterized as a reduction of sales when recognized in the vendor’s income statement. As a result, coupon incentives, slotting and promotional expenses are recorded as a reduction of sales. Additionally, as a result of the recently adopted revenue recognition standard, certain payments to customers related to in-store display incentives, or marketing development funds, are also recorded as a reduction of sales. See (r) “Newly Adopted Accounting Standards,” below, for further details regarding the revenue recognition standard adopted in fiscal 2018.
(l) Selling, General and Administrative Expenses
We promote our products with advertising, consumer incentives and trade promotions. These programs include, but are not limited to, discounts, slotting fees, coupons, rebates, in-store display incentives and volume-based incentives. Consumer incentive and trade promotion activities are recorded as a reduction to revenues based on amounts estimated as being due to customers and consumers at the end of a period. We base these estimates principally on historical utilization and redemption rates. We expense our advertising costs either in the period the advertising first takes place or as incurred. Advertising expenses were approximately $7.8 million, $15.9 million and $22.7 million, for fiscal 2019, 2018 and 2017, respectively.
(m) Pension Plans
We have defined benefit pension plans covering approximately 39.7% of our employees. Our funding policy is to contribute annually the amount recommended by our actuaries. From time to time, however, we voluntarily contribute greater amounts based on pension asset performance, tax considerations and other relevant factors.
(n) Share-Based Compensation Expense
We provide compensation benefits in the form of stock options, performance share long-term incentive awards (LTIAs) and common stock to employees and non-employee directors. The cost of share-based compensation is recorded at fair value at the date of grant and expensed in our consolidated statements of operations over the requisite service period, if any.
Performance share LTIAs granted to our executive officers and certain other members of senior management entitle each participant to earn shares of common stock upon the attainment of certain performance goals over the applicable performance period. The recognition of compensation expense for the performance share LTIAs is initially based on the probable outcome of the performance condition based on the fair value of the award on the date of grant and the anticipated number of shares to be awarded on a straight-line basis over the applicable performance period. The fair value of the awards on the date of grant is determined based upon the closing price of our common stock on the applicable measurement dates (i.e., the deemed grant dates for accounting purposes) reduced by the present value of expected dividends using the risk-free interest-rate as the award holders are not entitled to dividends or dividend equivalents during the vesting period. Our company’s performance against the defined performance goals are re-evaluated on a quarterly basis throughout the applicable performance period and the recognition of compensation expense is adjusted for subsequent changes in the estimated or actual outcome. The cumulative effect of a change in the estimated number of shares of common stock to be issued in respect of performance share awards is recognized as an adjustment to earnings in the period of the revision.
B&G FOODS, INC. AND SUBSIDIARIES Notes to Consolidated Financial Statements (Continued)
December 28, 2019, December 29, 2018 and December 30, 2017
- 67 -
The fair value of stock option awards is estimated on the date of grant using the Black-Scholes option pricing model and is recognized in expense over the vesting period of the options using the straight-line method. The Black-Scholes option pricing model requires various assumptions, including the expected volatility of our stock, the expected term of the option, the risk-free interest rate and the expected dividend yield. Expected volatility is based on both historical and implied volatilities of our common stock over the estimated expected term of the award. The risk-free rate for the expected term of the option is based on the U.S. Treasury yield curve in effect at the time of grant. All stock option grants have an exercise price equal to the fair market value of our common stock on the date of grant and have a 10-year term. Employee stock options cliff vest three years after the date of grant and non-employee director stock options vest one year after the date of grant.
We recognize compensation expense for only that portion of share-based awards that are expected to vest. We utilize historical employee termination behavior to determine our estimated forfeiture rates. If the actual forfeitures differ from those estimated by management, adjustments to compensation expense will be made in future periods.
(o) Income Tax Expense Estimates and Policies
Income taxes are accounted for under the asset and liability method. Deferred tax assets and liabilities of our company are recognized for the future tax consequences attributable to differences between the financial statement carrying amounts of existing assets and liabilities and their respective tax bases and operating loss and tax credit carryforwards. Deferred tax assets and liabilities are measured using enacted tax rates expected to apply to taxable income in the years in which those temporary differences are expected to be recovered or settled. A valuation allowance is provided when it is more likely than not that all or some portion of the deferred tax asset will not be realized. The effect on deferred tax assets and liabilities of a change in tax rates is recognized in operations in the period that includes the enactment date.
As part of the income tax provision process of preparing our consolidated financial statements, we are required to estimate our income taxes. This process involves estimating our current tax expenses together with assessing temporary differences resulting from differing treatment of items for tax and accounting purposes. These differences result in deferred tax assets and liabilities. We then assess the likelihood that our deferred tax assets will be recovered from future taxable income and to the extent we believe the recovery is not likely, we establish a valuation allowance. Further, to the extent that we establish a valuation allowance or increase this allowance in a financial accounting period, we include such charge in our tax provision, or reduce our tax benefits in our consolidated statements of operations. We use our judgment to determine our provision or benefit for income taxes, deferred tax assets and liabilities and any valuation allowance recorded against our deferred tax assets.
There are various factors that may cause these tax assumptions to change in the near term, and we may have to record a valuation allowance against our deferred tax assets. We cannot predict whether future U.S. federal and state income tax laws and regulations might be passed that could have a material effect on our results of operations. See Note 10, “Income Taxes,” for a discussion of the Tax Cuts and Jobs Act enacted in December 2017, which we refer to in this report as the “U.S. Tax Act.” We assess the impact of significant changes to the U.S. federal, state and international income tax laws and regulations on a regular basis and update the assumptions and estimates used to prepare our consolidated financial statements when new regulations and legislation are enacted. We recognize the benefit of an uncertain tax position that we have taken or expect to take on our income tax returns we file if it is “more likely than not” that such tax position will be sustained based on its technical merits.
(p) Dividends
Cash dividends, if any, are accrued as a liability on our consolidated balance sheets and recorded as a decrease to additional paid-in capital when declared.
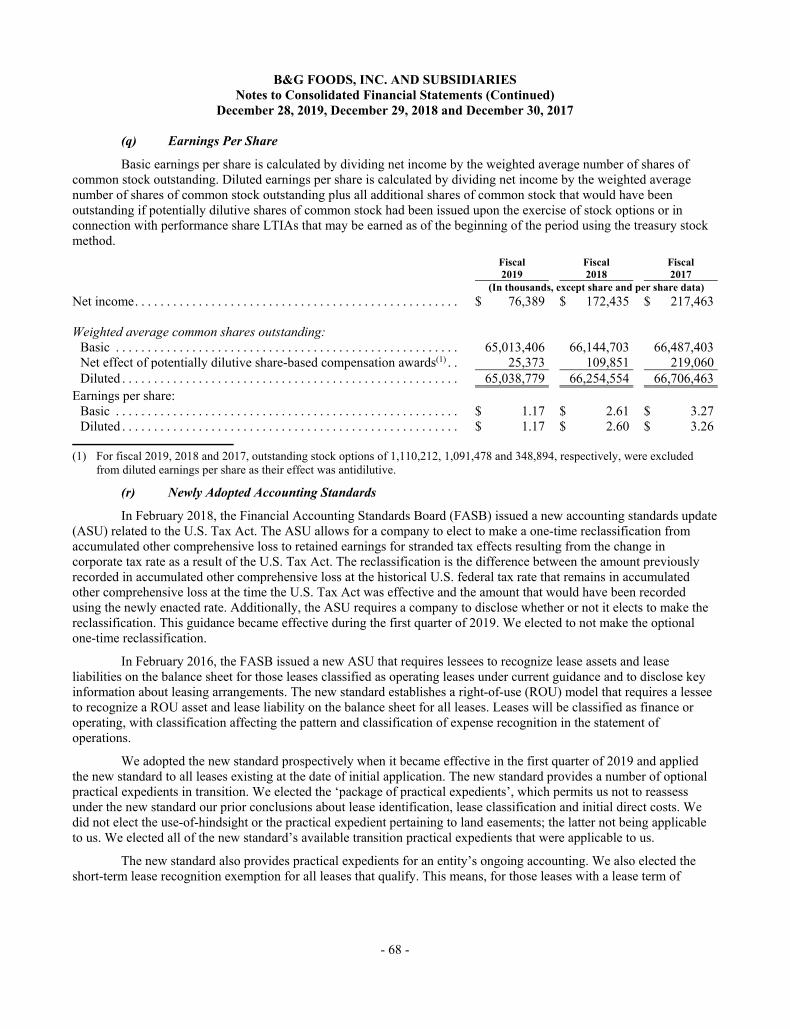
B&G FOODS, INC. AND SUBSIDIARIES Notes to Consolidated Financial Statements (Continued)
December 28, 2019, December 29, 2018 and December 30, 2017
- 68 -
(q) Earnings Per Share
Basic earnings per share is calculated by dividing net income by the weighted average number of shares of common stock outstanding. Diluted earnings per share is calculated by dividing net income by the weighted average number of shares of common stock outstanding plus all additional shares of common stock that would have been outstanding if potentially dilutive shares of common stock had been issued upon the exercise of stock options or in connection with performance share LTIAs that may be earned as of the beginning of the period using the treasury stock method. Fiscal Fiscal Fiscal 2019 2018 2017 (In thousands, except share and per share data) Net income . . . . . . . . . . . . . . . . . . . . . . . . . . . . . . . . . . . . . . . . . . . . . . . . . . . $ 76,389 $ 172,435 $ 217,463 Weighted average common shares outstanding:
Basic . . . . . . . . . . . . . . . . . . . . . . . . . . . . . . . . . . . . . . . . . . . . . . . . . . . . . . 65,013,406 66,144,703 66,487,403 Net effect of potentially dilutive share-based compensation awards(1) . . 25,373 109,851 219,060 Diluted . . . . . . . . . . . . . . . . . . . . . . . . . . . . . . . . . . . . . . . . . . . . . . . . . . . . . 65,038,779 66,254,554 66,706,463
Earnings per share: Basic . . . . . . . . . . . . . . . . . . . . . . . . . . . . . . . . . . . . . . . . . . . . . . . . . . . . . . $ 1.17 $ 2.61 $ 3.27 Diluted . . . . . . . . . . . . . . . . . . . . . . . . . . . . . . . . . . . . . . . . . . . . . . . . . . . . . $ 1.17 $ 2.60 $ 3.26
(1) For fiscal 2019, 2018 and 2017, outstanding stock options of 1,110,212, 1,091,478 and 348,894, respectively, were excluded
from diluted earnings per share as their effect was antidilutive.
(r) Newly Adopted Accounting Standards
In February 2018, the Financial Accounting Standards Board (FASB) issued a new accounting standards update (ASU) related to the U.S. Tax Act. The ASU allows for a company to elect to make a one-time reclassification from accumulated other comprehensive loss to retained earnings for stranded tax effects resulting from the change in corporate tax rate as a result of the U.S. Tax Act. The reclassification is the difference between the amount previously recorded in accumulated other comprehensive loss at the historical U.S. federal tax rate that remains in accumulated other comprehensive loss at the time the U.S. Tax Act was effective and the amount that would have been recorded using the newly enacted rate. Additionally, the ASU requires a company to disclose whether or not it elects to make the reclassification. This guidance became effective during the first quarter of 2019. We elected to not make the optional one-time reclassification.
In February 2016, the FASB issued a new ASU that requires lessees to recognize lease assets and lease liabilities on the balance sheet for those leases classified as operating leases under current guidance and to disclose key information about leasing arrangements. The new standard establishes a right-of-use (ROU) model that requires a lessee to recognize a ROU asset and lease liability on the balance sheet for all leases. Leases will be classified as finance or operating, with classification affecting the pattern and classification of expense recognition in the statement of operations.
We adopted the new standard prospectively when it became effective in the first quarter of 2019 and applied the new standard to all leases existing at the date of initial application. The new standard provides a number of optional practical expedients in transition. We elected the ‘package of practical expedients’, which permits us not to reassess under the new standard our prior conclusions about lease identification, lease classification and initial direct costs. We did not elect the use-of-hindsight or the practical expedient pertaining to land easements; the latter not being applicable to us. We elected all of the new standard’s available transition practical expedients that were applicable to us.
The new standard also provides practical expedients for an entity’s ongoing accounting. We also elected the short-term lease recognition exemption for all leases that qualify. This means, for those leases with a lease term of
B&G FOODS, INC. AND SUBSIDIARIES Notes to Consolidated Financial Statements (Continued)
December 28, 2019, December 29, 2018 and December 30, 2017
- 69 -
twelve months or less, we did not recognize ROU assets or lease liabilities. We also elected the practical expedient to not separate lease and non-lease components for all of our leases.
This standard did not have a material effect on our financial statements. Upon adoption, the most significant effects related to (1) the recognition of new ROU assets and lease liabilities on our balance sheet for our operating leases, which was $39.6 million and $42.6 million, respectively, as of the beginning of fiscal 2019; and (2) providing additional disclosures about our leasing activities.
In March 2017, the FASB issued a new ASU that improves the presentation of net periodic pension cost and net periodic post-retirement benefit costs. The new guidance revises how employers that sponsor defined benefit pension and other post-retirement plans present the net periodic benefit costs in their income statement and requires that the service cost component of net periodic benefit costs be presented in the same income statement line items as other employee compensation costs from services rendered during the period and present the other components of net periodic pension cost below operating profit. The update was effective beginning with the first quarter of fiscal 2018. We adopted this standard retrospectively as of the first quarter of fiscal 2018. The adoption of this ASU did not have any impact on our consolidated financial position, results of operations or liquidity, but did require a reclassification among selling, general and administrative expenses and other income on our consolidated statements of operations.
In May 2014, the FASB issued guidance on revenue recognition, with final guidance issued in 2016. The guidance provides for a five-step model to determine the revenue to be recognized from the transfer of goods or services to customers. The guidance also requires improved disclosures to help users of the financial statements better understand the nature, amount, timing and uncertainty of revenue and cash flows relating to customer contracts. It also provides clarification for principal versus agent considerations, identifying performance obligations and the accounting of intellectual property licenses. In addition, the FASB introduced practical expedients related to disclosures of remaining performance obligations, as well as other amendments to guidance on collectability, non-cash consideration and the presentation of sales and other similar taxes.
We adopted this guidance and related amendments as of the first quarter of fiscal 2018, applying the full retrospective transition method to all contracts. We concluded that the adoption of this standard primarily affected our policies and estimation methodologies of variable consideration associated with rebates and bill-backs, product returns and cash discounts. The provisions of the new standard did not impact the timing of revenue recognition but did impact the classification of certain payments to customers, moving an immaterial amount of such payments from expense to a deduction from net sales.
Our sales predominantly contain a single performance obligation and revenue is recognized at a single point in time when ownership, risks and rewards transfer. Typically, this occurs when the goods are shipped to the customer. Revenues are recognized in an amount that reflects the net consideration we expect to receive in exchange for the goods. We report all amounts billed to a customer in a sale transaction as revenue, including those amounts related to shipping and handling. Shipping and handling costs are included in cost of goods sold. Under the new revenue guidance, we recognize our shipping and handling activities as a fulfillment of our promise to transfer products to our customers.
We promote our products with advertising, consumer incentives and trade promotions. These programs include discounts, slotting fees, coupons, rebates, in-store display incentives and volume-based incentives. Customer trade promotion and consumer incentive activities are recorded as a reduction to the sale price based on amounts estimated as being due to customers and consumers at the end of a period. We derive these estimates principally on historical utilization and redemption rates.
Payment terms in our invoices are based on the billing schedule established in our contracts or purchase orders with customers. We generally recognize the related trade receivable when the goods are shipped. In certain cases, we require a payment in advance of performance when the customer’s credit has not been established. We record these revenues as a contract liability; however, these amounts have historically been immaterial.
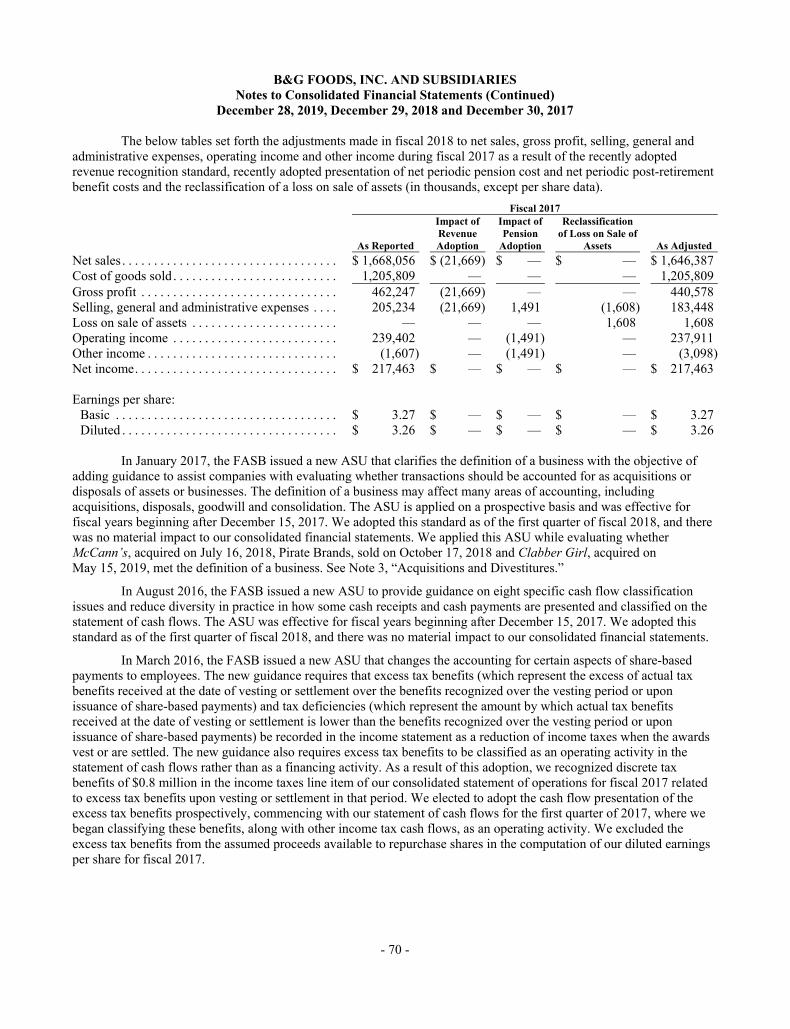
B&G FOODS, INC. AND SUBSIDIARIES Notes to Consolidated Financial Statements (Continued)
December 28, 2019, December 29, 2018 and December 30, 2017
- 70 -
The below tables set forth the adjustments made in fiscal 2018 to net sales, gross profit, selling, general and administrative expenses, operating income and other income during fiscal 2017 as a result of the recently adopted revenue recognition standard, recently adopted presentation of net periodic pension cost and net periodic post-retirement benefit costs and the reclassification of a loss on sale of assets (in thousands, except per share data). Fiscal 2017
As Reported
Impact of Revenue Adoption
Impact of Pension
Adoption
Reclassification of Loss on Sale of
Assets As Adjusted Net sales . . . . . . . . . . . . . . . . . . . . . . . . . . . . . . . . . . $ 1,668,056 $ (21,669) $ — $ — $ 1,646,387 Cost of goods sold . . . . . . . . . . . . . . . . . . . . . . . . . . 1,205,809 — — — 1,205,809 Gross profit . . . . . . . . . . . . . . . . . . . . . . . . . . . . . . . 462,247 (21,669) — — 440,578 Selling, general and administrative expenses . . . . 205,234 (21,669) 1,491 (1,608) 183,448 Loss on sale of assets . . . . . . . . . . . . . . . . . . . . . . . — — — 1,608 1,608 Operating income . . . . . . . . . . . . . . . . . . . . . . . . . . 239,402 — (1,491) — 237,911 Other income . . . . . . . . . . . . . . . . . . . . . . . . . . . . . . (1,607) — (1,491) — (3,098)Net income . . . . . . . . . . . . . . . . . . . . . . . . . . . . . . . . $ 217,463 $ — $ — $ — $ 217,463 Earnings per share:
Basic . . . . . . . . . . . . . . . . . . . . . . . . . . . . . . . . . . . $ 3.27 $ — $ — $ — $ 3.27 Diluted . . . . . . . . . . . . . . . . . . . . . . . . . . . . . . . . . . $ 3.26 $ — $ — $ — $ 3.26
In January 2017, the FASB issued a new ASU that clarifies the definition of a business with the objective of
adding guidance to assist companies with evaluating whether transactions should be accounted for as acquisitions or disposals of assets or businesses. The definition of a business may affect many areas of accounting, including acquisitions, disposals, goodwill and consolidation. The ASU is applied on a prospective basis and was effective for fiscal years beginning after December 15, 2017. We adopted this standard as of the first quarter of fiscal 2018, and there was no material impact to our consolidated financial statements. We applied this ASU while evaluating whether McCann’s, acquired on July 16, 2018, Pirate Brands, sold on October 17, 2018 and Clabber Girl, acquired on May 15, 2019, met the definition of a business. See Note 3, “Acquisitions and Divestitures.”
In August 2016, the FASB issued a new ASU to provide guidance on eight specific cash flow classification issues and reduce diversity in practice in how some cash receipts and cash payments are presented and classified on the statement of cash flows. The ASU was effective for fiscal years beginning after December 15, 2017. We adopted this standard as of the first quarter of fiscal 2018, and there was no material impact to our consolidated financial statements.
In March 2016, the FASB issued a new ASU that changes the accounting for certain aspects of share-based payments to employees. The new guidance requires that excess tax benefits (which represent the excess of actual tax benefits received at the date of vesting or settlement over the benefits recognized over the vesting period or upon issuance of share-based payments) and tax deficiencies (which represent the amount by which actual tax benefits received at the date of vesting or settlement is lower than the benefits recognized over the vesting period or upon issuance of share-based payments) be recorded in the income statement as a reduction of income taxes when the awards vest or are settled. The new guidance also requires excess tax benefits to be classified as an operating activity in the statement of cash flows rather than as a financing activity. As a result of this adoption, we recognized discrete tax benefits of $0.8 million in the income taxes line item of our consolidated statement of operations for fiscal 2017 related to excess tax benefits upon vesting or settlement in that period. We elected to adopt the cash flow presentation of the excess tax benefits prospectively, commencing with our statement of cash flows for the first quarter of 2017, where we began classifying these benefits, along with other income tax cash flows, as an operating activity. We excluded the excess tax benefits from the assumed proceeds available to repurchase shares in the computation of our diluted earnings per share for fiscal 2017.
B&G FOODS, INC. AND SUBSIDIARIES Notes to Consolidated Financial Statements (Continued)
December 28, 2019, December 29, 2018 and December 30, 2017
- 71 -
In November 2015, the FASB issued a new ASU that requires deferred tax assets and liabilities to be classified as noncurrent on the balance sheet. The ASU was effective beginning with the first quarter of fiscal 2017. We adopted the provisions of this ASU at the beginning of fiscal 2017 and applied the required changes in accounting principle on a retrospective basis. The update impacted presentation and disclosure only, and therefore, the adoption of this ASU did not have any impact on our results of operations or liquidity.
In July 2015, the FASB issued a new ASU that simplifies the subsequent measurement of inventories by replacing the current lower of cost or market test with a lower of cost and net realizable value test. We adopted the provisions of this ASU at the beginning of fiscal 2017. The adoption of this ASU did not have any impact on our consolidated financial position, results of operations or liquidity.
(s) Recently Issued Accounting Standards
In June 2016, the FASB issued a new ASU which modifies the measurement of expected credit losses of certain financial instruments. This ASU replaces the incurred loss methodology for recognizing credit losses with a current expected credit losses model and applies to all financial assets, including trade accounts receivables. The update is effective for fiscal years beginning after December 15, 2019 and interim periods within those fiscal years. The amendments in this ASU should be applied on a modified retrospective basis to all periods presented. We intend to adopt the provisions of this ASU in the first quarter of 2020. Currently, we do not expect the adoption of the new standard to have a material impact to our consolidated financial statements and related disclosures.
In December 2019, the FASB issued a new ASU which removes certain exceptions for recognizing deferred taxes for investments, performing intraperiod allocation and calculating income taxes in interim periods. The ASU also adds guidance to reduce complexity in certain areas, including recognizing deferred taxes for goodwill and allocating taxes to members of a consolidated group. The update is effective for fiscal years beginning after December 15, 2020. Early adoption is permitted, including adoption in any interim period. We currently expect to adopt the standard when it becomes effective. We are in the process of evaluating the impact of the adoption of this ASU. Currently, we do not expect the adoption of this ASU to have a material impact to our consolidated financial statements.
In August 2018, the FASB issued a new ASU which clarifies that implementation costs incurred by customers in cloud computing arrangements are deferred if they would be capitalized by customers in software licensing arrangements under the internal-use software guidance. The update is effective for fiscal years beginning after December 15, 2019. Early adoption is permitted, including adoption in any interim period. Currently, we do not expect the adoption of this ASU to have a material impact to our consolidated financial statements.
In August 2018, the FASB issued a new ASU that aims to improve the overall usefulness of disclosures to financial statement users and reduce unnecessary costs to companies by changing disclosure requirements for employers that sponsor defined benefit pension or other post-retirement plans. The update is effective for fiscal years beginning after December 15, 2020. We expect to update our defined benefit pension plan disclosures when the new standard becomes effective. We do not expect the adoption of this ASU to have an impact to our consolidated financial statements as this ASU only modifies disclosure requirements.
In August 2018, the FASB issued a new ASU that aims to improve the overall usefulness of disclosures to financial statement users and reduce unnecessary costs to companies by changing disclosure requirements for fair value measurement. The update is effective for fiscal years beginning after December 15, 2019. We expect to update our fair value measurement disclosures when the new standard becomes effective. We do not expect the adoption of this ASU to have an impact to our consolidated financial statements as this ASU only modifies disclosure requirements.
B&G FOODS, INC. AND SUBSIDIARIES Notes to Consolidated Financial Statements (Continued)
December 28, 2019, December 29, 2018 and December 30, 2017
- 72 -
In January 2017, the FASB issued an amendment to the standards of goodwill impairment testing. The new guidance simplifies the test for goodwill impairment, by comparing the fair value of a reporting unit with its carrying amount. An entity should recognize an impairment charge for the amount by which the carrying amount exceeds the reporting unit’s fair value; however, the loss recognized should not exceed the total amount of goodwill allocated to that reporting unit. Additionally, an entity should consider income tax effects from any tax deductible goodwill on the carrying amount of the reporting unit when measuring the goodwill impairment loss, if applicable. The update is effective for fiscal years beginning after December 15, 2019. We expect to adopt the standards when they become effective.
(t) Financial Statement Reclassifications
During fiscal 2019, we reclassified unamortized deferred debt financing costs of $3.0 million related to our revolving credit facility as of December 29, 2018 from a reduction in long-term debt to other assets in our accompanying consolidated balance sheet.
(3) Acquisitions and Divestitures
Acquisitions
On May 15, 2019, we acquired Clabber Girl Corporation, a leader in baking products, including baking powder, baking soda and corn starch, from Hulman & Company for approximately $84.6 million in cash. In addition to Clabber Girl, the number one retail baking powder brand, Clabber Girl Corporation’s product offerings include the Rumford, Davis, Hearth Club and Royal brands of retail baking powder, baking soda and corn starch, and the Royal brand of foodservice dessert mixes. We refer to this acquisition as the “Clabber Girl acquisition.”
On July 16, 2018, we acquired the McCann’s brand of premium Irish oatmeal from TreeHouse Foods, Inc. for approximately $30.8 million in cash. We refer to this acquisition as the “McCann’s acquisition.”
On October 2, 2017, we acquired Back to Nature Foods Company, LLC and related entities, including the Back to Nature and SnackWell’s brands, from Brynwood Partners VI L.P., Mondelēz International and certain other sellers for approximately $162.8 million in cash. We refer to this acquisition as the “Back to Nature acquisition.”
We have accounted for each of these acquisitions using the acquisition method of accounting and, accordingly, have included the assets acquired, liabilities assumed and results of operations in our consolidated financial statements from the respective date of acquisition. The excess of the purchase price over the fair value of identifiable net assets acquired represents goodwill. Indefinite-lived trademarks are deemed to have an indefinite useful life and are not amortized. Customer relationships and finite-lived trademarks acquired are amortized over 10 to 20 years. Goodwill and other intangible assets, except in the case of the Victoria and Back to Nature acquisitions, are deductible for income tax purposes. Inventory has been recorded at estimated selling price less costs of disposal and a reasonable selling profit and the property, plant and equipment and other intangible assets (including trademarks, customer relationships and other intangible assets) acquired have been recorded at fair value as determined by our management with the assistance of a third-party valuation specialist. See Note 6, “Goodwill and Other Intangible Assets.”
Clabber Girl Acquisition
The following table sets forth the preliminary allocation of the Clabber Girl acquisition purchase price to the estimated fair value of the net assets acquired at the date of acquisition. The preliminary purchase price allocation may be adjusted as a result of the finalization of our purchase price allocation procedures related to the assets acquired and liabilities assumed. During fiscal 2019, we recorded a purchase price adjustment to increase operating lease right-of-use assets by $1.4 million; trademarks — indefinite-lived intangible assets by $1.1 million; and customer relationships — finite-lived intangible assets by $1.0 million; and to decrease goodwill by $1.4 million; long-term operating lease liabilities, net of current portion, by $1.3 million; inventories by $0.7 million; and current portion of operating lease liabilities by $0.1 million. We anticipate completing the purchase price allocation during the second quarter of fiscal 2020.
B&G FOODS, INC. AND SUBSIDIARIES Notes to Consolidated Financial Statements (Continued)
December 28, 2019, December 29, 2018 and December 30, 2017
- 73 -
Preliminary Allocation: May 15, 2019 Cash and cash equivalents . . . . . . . . . . . . . . . . . . . . . . . . . . . . . . . . . . . . . . . . . . . . . . . . . . . . . . . . . . . . . . $ 2,202 Trade accounts receivable, net . . . . . . . . . . . . . . . . . . . . . . . . . . . . . . . . . . . . . . . . . . . . . . . . . . . . . . . . . . . 5,627 Inventories . . . . . . . . . . . . . . . . . . . . . . . . . . . . . . . . . . . . . . . . . . . . . . . . . . . . . . . . . . . . . . . . . . . . . . . . . . . 10,641 Prepaid expenses and other current assets . . . . . . . . . . . . . . . . . . . . . . . . . . . . . . . . . . . . . . . . . . . . . . . . . . 154 Income tax receivable . . . . . . . . . . . . . . . . . . . . . . . . . . . . . . . . . . . . . . . . . . . . . . . . . . . . . . . . . . . . . . . . . . 7 Property, plant and equipment, net . . . . . . . . . . . . . . . . . . . . . . . . . . . . . . . . . . . . . . . . . . . . . . . . . . . . . . . 20,697 Operating lease right-of-use assets . . . . . . . . . . . . . . . . . . . . . . . . . . . . . . . . . . . . . . . . . . . . . . . . . . . . . . . 7,841 Trademarks — indefinite-lived intangible assets . . . . . . . . . . . . . . . . . . . . . . . . . . . . . . . . . . . . . . . . . . . . 19,600 Customer relationships — finite-lived intangible assets . . . . . . . . . . . . . . . . . . . . . . . . . . . . . . . . . . . . . . 18,500 Trade accounts payable . . . . . . . . . . . . . . . . . . . . . . . . . . . . . . . . . . . . . . . . . . . . . . . . . . . . . . . . . . . . . . . . (3,007)Accrued expenses . . . . . . . . . . . . . . . . . . . . . . . . . . . . . . . . . . . . . . . . . . . . . . . . . . . . . . . . . . . . . . . . . . . . . (1,315)Current portion of operating lease liabilities . . . . . . . . . . . . . . . . . . . . . . . . . . . . . . . . . . . . . . . . . . . . . . . . (952)Long-term operating lease liabilities, net of current portion . . . . . . . . . . . . . . . . . . . . . . . . . . . . . . . . . . . (7,319)Goodwill . . . . . . . . . . . . . . . . . . . . . . . . . . . . . . . . . . . . . . . . . . . . . . . . . . . . . . . . . . . . . . . . . . . . . . . . . . . . 11,956
Total purchase price (paid in cash) . . . . . . . . . . . . . . . . . . . . . . . . . . . . . . . . . . . . . . . . . . . . . . . . . . . . . . $ 84,632
McCann’s Acquisition
The following table sets forth the allocation of the McCann’s acquisition purchase price to the estimated fair value of the net assets acquired at the date of acquisition. During the fourth quarter of 2018, we recorded a purchase price adjustment to increase accrued expenses and goodwill by $0.2 million.
McCann’s Acquisition (in thousands): Allocation: July 16, 2018
Property, plant and equipment . . . . . . . . . . . . . . . . . . . . . . . . . . . . . . . . . . . . . . . . . . . . . . . . . . . . . . . . . . . $ 12 Inventories . . . . . . . . . . . . . . . . . . . . . . . . . . . . . . . . . . . . . . . . . . . . . . . . . . . . . . . . . . . . . . . . . . . . . . . . . . . 973 Trademarks — indefinite-lived intangible assets . . . . . . . . . . . . . . . . . . . . . . . . . . . . . . . . . . . . . . . . . . . . 24,800 Customer relationships — finite-lived intangible assets . . . . . . . . . . . . . . . . . . . . . . . . . . . . . . . . . . . . . . 2,000 Accrued expenses . . . . . . . . . . . . . . . . . . . . . . . . . . . . . . . . . . . . . . . . . . . . . . . . . . . . . . . . . . . . . . . . . . . . . (292)Goodwill . . . . . . . . . . . . . . . . . . . . . . . . . . . . . . . . . . . . . . . . . . . . . . . . . . . . . . . . . . . . . . . . . . . . . . . . . . . . 3,294
Total purchase price (paid in cash) . . . . . . . . . . . . . . . . . . . . . . . . . . . . . . . . . . . . . . . . . . . . . . . . . . . . . . $ 30,787
Back to Nature Acquisition
The following table sets forth the allocation of the Back to Nature acquisition purchase price to the estimated fair value of the net assets acquired at the date of acquisition. During fiscal 2018, we recorded a purchase price adjustment to increase indefinite-lived trademarks by $0.1 million, goodwill by $2.8 million and other working capital by $2.1 million, and decrease inventory by $1.7 million and long-term deferred income tax liabilities, net, by $0.9 million.
Back to Nature Acquisition (in thousands): Allocation: October 2, 2017
Trademarks — indefinite-lived intangible assets . . . . . . . . . . . . . . . . . . . . . . . . . . . . . . . . . . . . . . . . . . . . $ 109,900 Trademarks — finite-lived intangible assets . . . . . . . . . . . . . . . . . . . . . . . . . . . . . . . . . . . . . . . . . . . . . . . 12,800 Goodwill . . . . . . . . . . . . . . . . . . . . . . . . . . . . . . . . . . . . . . . . . . . . . . . . . . . . . . . . . . . . . . . . . . . . . . . . . . . . 36,334 Customer relationships — finite-lived intangible assets . . . . . . . . . . . . . . . . . . . . . . . . . . . . . . . . . . . . . . 14,700 Inventories . . . . . . . . . . . . . . . . . . . . . . . . . . . . . . . . . . . . . . . . . . . . . . . . . . . . . . . . . . . . . . . . . . . . . . . . . . . 5,088 Long-term deferred income tax liabilities, net . . . . . . . . . . . . . . . . . . . . . . . . . . . . . . . . . . . . . . . . . . . . . . (9,892)Other working capital . . . . . . . . . . . . . . . . . . . . . . . . . . . . . . . . . . . . . . . . . . . . . . . . . . . . . . . . . . . . . . . . . . (6,082)
Total purchase price (paid in cash) . . . . . . . . . . . . . . . . . . . . . . . . . . . . . . . . . . . . . . . . . . . . . . . . . . . . . . $ 162,848
B&G FOODS, INC. AND SUBSIDIARIES Notes to Consolidated Financial Statements (Continued)
December 28, 2019, December 29, 2018 and December 30, 2017
- 74 -
Unaudited Pro Forma Summary of Operations
None of the Clabber Girl, McCann’s and Back to Nature acquisitions were material to our consolidated results of operations or financial position and, therefore, pro forma financial information is not presented.
Pirate Brands Divestiture
On October 17, 2018, we sold Pirate Brands to The Hershey Company for a purchase price of $420.0 million in cash. Pirate Brands includes the Pirate’s Booty, Smart Puffs and Original Tings brands. We refer to this divestiture as the “Pirate Brands sale.” Net deferred tax liabilities associated with the Pirate Brands sale were $107.3 million. We recognized a pre-tax gain on the Pirate Brands sale of $176.4 million, as calculated below (in thousands): October 17, 2018 Cash received . . . . . . . . . . . . . . . . . . . . . . . . . . . . . . . . . . . . . . . . . . . . . . . . . . . . . . . . . . . . . . . . . . . . . . . . . . $ 420,002 Assets sold:
Inventories . . . . . . . . . . . . . . . . . . . . . . . . . . . . . . . . . . . . . . . . . . . . . . . . . . . . . . . . . . . . . . . . . . . . . . . . . . . (6,688)Property, plant and equipment . . . . . . . . . . . . . . . . . . . . . . . . . . . . . . . . . . . . . . . . . . . . . . . . . . . . . . . . . . . (404)Customer relationships — finite-lived intangible assets . . . . . . . . . . . . . . . . . . . . . . . . . . . . . . . . . . . . . . (8,408)Trademarks — indefinite-lived intangible assets . . . . . . . . . . . . . . . . . . . . . . . . . . . . . . . . . . . . . . . . . . . . (152,800)Goodwill . . . . . . . . . . . . . . . . . . . . . . . . . . . . . . . . . . . . . . . . . . . . . . . . . . . . . . . . . . . . . . . . . . . . . . . . . . . . (70,952)Other . . . . . . . . . . . . . . . . . . . . . . . . . . . . . . . . . . . . . . . . . . . . . . . . . . . . . . . . . . . . . . . . . . . . . . . . . . . . . . . (77)
Total assets sold . . . . . . . . . . . . . . . . . . . . . . . . . . . . . . . . . . . . . . . . . . . . . . . . . . . . . . . . . . . . . . . . . . . . . (239,328)Expenses . . . . . . . . . . . . . . . . . . . . . . . . . . . . . . . . . . . . . . . . . . . . . . . . . . . . . . . . . . . . . . . . . . . . . . . . . . . . . (4,288)Gain on sale of assets . . . . . . . . . . . . . . . . . . . . . . . . . . . . . . . . . . . . . . . . . . . . . . . . . . . . . . . . . . . . . . . . . . . $ 176,386
In December 2018, the compensation committee of our board of directors approved a special bonus pool of $6.0 million that was paid in fiscal 2019 to our executive officers and certain members of management to recognize their significant contributions to the successful operation of Pirate Brands during our company’s five years of ownership of Pirate Brands and to the successful completion of the Pirate Brands sale at a sale price more than double what our company paid for Pirate Brands in 2013.
(4) Inventories
Inventories consist of the following, as of the dates indicated (in thousands): December 28, 2019 December 29, 2018Raw materials and packaging . . . . . . . . . . . . . . . . . . . . . . . . . . . . . . . . . . . . . . . . . . . . . $ 65,673 $ 61,905 Work-in-process . . . . . . . . . . . . . . . . . . . . . . . . . . . . . . . . . . . . . . . . . . . . . . . . . . . . . . . 111,866 95,282 Finished goods . . . . . . . . . . . . . . . . . . . . . . . . . . . . . . . . . . . . . . . . . . . . . . . . . . . . . . . . . 294,648 244,168
Inventories . . . . . . . . . . . . . . . . . . . . . . . . . . . . . . . . . . . . . . . . . . . . . . . . . . . . . . . . . $ 472,187 $ 401,355
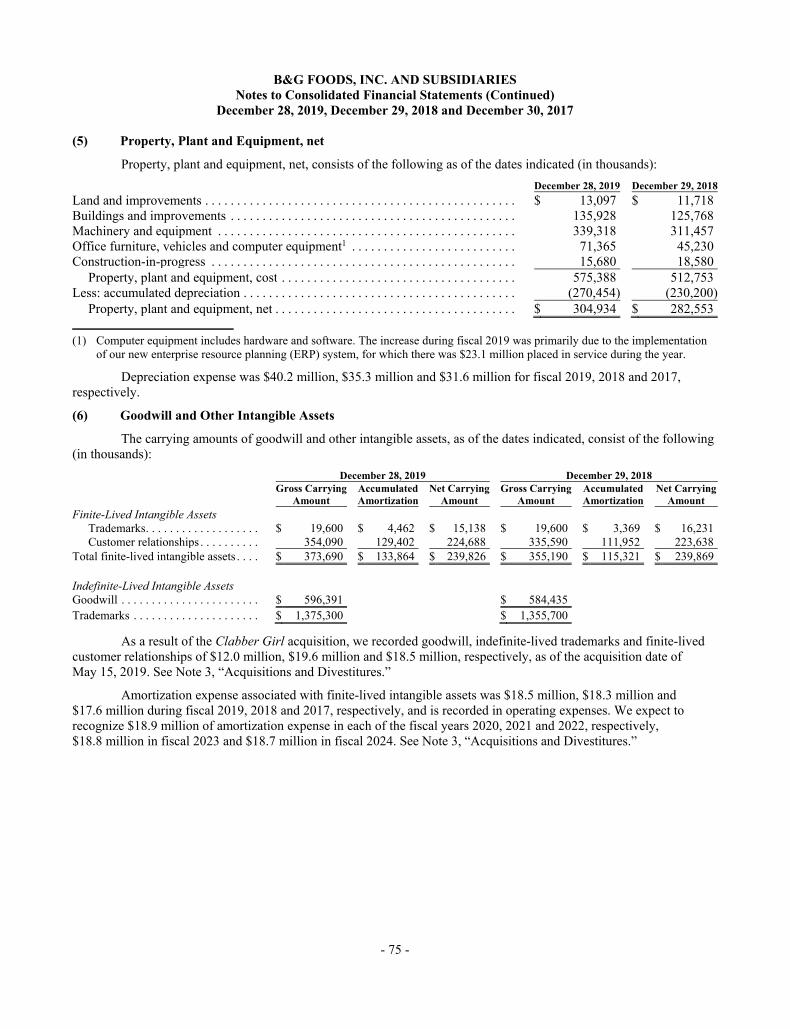
B&G FOODS, INC. AND SUBSIDIARIES Notes to Consolidated Financial Statements (Continued)
December 28, 2019, December 29, 2018 and December 30, 2017
- 75 -
(5) Property, Plant and Equipment, net
Property, plant and equipment, net, consists of the following as of the dates indicated (in thousands): December 28, 2019 December 29, 2018Land and improvements . . . . . . . . . . . . . . . . . . . . . . . . . . . . . . . . . . . . . . . . . . . . . . . . . $ 13,097 $ 11,718 Buildings and improvements . . . . . . . . . . . . . . . . . . . . . . . . . . . . . . . . . . . . . . . . . . . . . 135,928 125,768 Machinery and equipment . . . . . . . . . . . . . . . . . . . . . . . . . . . . . . . . . . . . . . . . . . . . . . . 339,318 311,457 Office furniture, vehicles and computer equipment1 . . . . . . . . . . . . . . . . . . . . . . . . . . 71,365 45,230 Construction-in-progress . . . . . . . . . . . . . . . . . . . . . . . . . . . . . . . . . . . . . . . . . . . . . . . . 15,680 18,580
Property, plant and equipment, cost . . . . . . . . . . . . . . . . . . . . . . . . . . . . . . . . . . . . . 575,388 512,753 Less: accumulated depreciation . . . . . . . . . . . . . . . . . . . . . . . . . . . . . . . . . . . . . . . . . . . (270,454) (230,200)
Property, plant and equipment, net . . . . . . . . . . . . . . . . . . . . . . . . . . . . . . . . . . . . . . $ 304,934 $ 282,553
(1) Computer equipment includes hardware and software. The increase during fiscal 2019 was primarily due to the implementation of our new enterprise resource planning (ERP) system, for which there was $23.1 million placed in service during the year.
Depreciation expense was $40.2 million, $35.3 million and $31.6 million for fiscal 2019, 2018 and 2017, respectively.
(6) Goodwill and Other Intangible Assets
The carrying amounts of goodwill and other intangible assets, as of the dates indicated, consist of the following (in thousands): December 28, 2019 December 29, 2018 Gross Carrying Accumulated Net Carrying Gross Carrying Accumulated Net Carrying Amount Amortization Amount Amount Amortization Amount Finite-Lived Intangible Assets
Trademarks . . . . . . . . . . . . . . . . . . . $ 19,600 $ 4,462 $ 15,138 $ 19,600 $ 3,369 $ 16,231 Customer relationships . . . . . . . . . . 354,090 129,402 224,688 335,590 111,952 223,638
Total finite-lived intangible assets . . . . $ 373,690 $ 133,864 $ 239,826 $ 355,190 $ 115,321 $ 239,869 Indefinite-Lived Intangible Assets Goodwill . . . . . . . . . . . . . . . . . . . . . . . $ 596,391 $ 584,435 Trademarks . . . . . . . . . . . . . . . . . . . . . $ 1,375,300 $ 1,355,700
As a result of the Clabber Girl acquisition, we recorded goodwill, indefinite-lived trademarks and finite-lived customer relationships of $12.0 million, $19.6 million and $18.5 million, respectively, as of the acquisition date of May 15, 2019. See Note 3, “Acquisitions and Divestitures.”
Amortization expense associated with finite-lived intangible assets was $18.5 million, $18.3 million and $17.6 million during fiscal 2019, 2018 and 2017, respectively, and is recorded in operating expenses. We expect to recognize $18.9 million of amortization expense in each of the fiscal years 2020, 2021 and 2022, respectively, $18.8 million in fiscal 2023 and $18.7 million in fiscal 2024. See Note 3, “Acquisitions and Divestitures.”
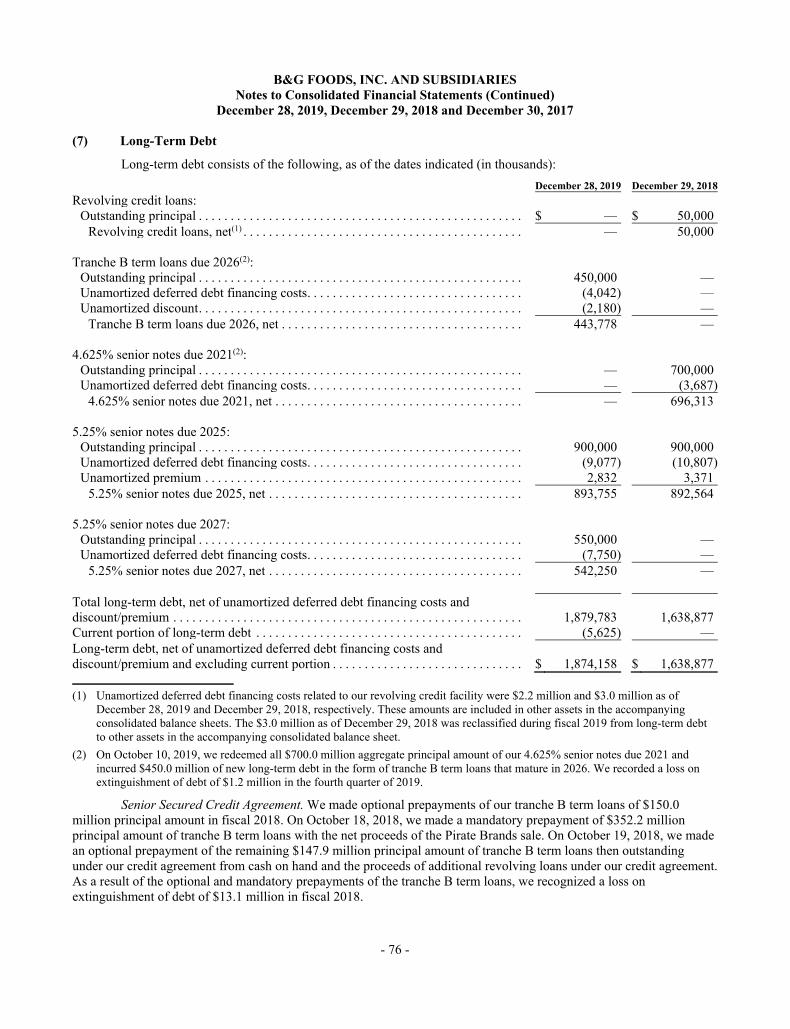
B&G FOODS, INC. AND SUBSIDIARIES Notes to Consolidated Financial Statements (Continued)
December 28, 2019, December 29, 2018 and December 30, 2017
- 76 -
(7) Long-Term Debt
Long-term debt consists of the following, as of the dates indicated (in thousands): December 28, 2019 December 29, 2018Revolving credit loans:
Outstanding principal . . . . . . . . . . . . . . . . . . . . . . . . . . . . . . . . . . . . . . . . . . . . . . . . . . . $ — $ 50,000 Revolving credit loans, net(1) . . . . . . . . . . . . . . . . . . . . . . . . . . . . . . . . . . . . . . . . . . . . — 50,000
Tranche B term loans due 2026(2):
Outstanding principal . . . . . . . . . . . . . . . . . . . . . . . . . . . . . . . . . . . . . . . . . . . . . . . . . . . 450,000 — Unamortized deferred debt financing costs . . . . . . . . . . . . . . . . . . . . . . . . . . . . . . . . . . (4,042) — Unamortized discount . . . . . . . . . . . . . . . . . . . . . . . . . . . . . . . . . . . . . . . . . . . . . . . . . . . (2,180) —
Tranche B term loans due 2026, net . . . . . . . . . . . . . . . . . . . . . . . . . . . . . . . . . . . . . . 443,778 —
4.625% senior notes due 2021(2): Outstanding principal . . . . . . . . . . . . . . . . . . . . . . . . . . . . . . . . . . . . . . . . . . . . . . . . . . . — 700,000 Unamortized deferred debt financing costs . . . . . . . . . . . . . . . . . . . . . . . . . . . . . . . . . . — (3,687)
4.625% senior notes due 2021, net . . . . . . . . . . . . . . . . . . . . . . . . . . . . . . . . . . . . . . . — 696,313
5.25% senior notes due 2025: Outstanding principal . . . . . . . . . . . . . . . . . . . . . . . . . . . . . . . . . . . . . . . . . . . . . . . . . . . 900,000 900,000 Unamortized deferred debt financing costs . . . . . . . . . . . . . . . . . . . . . . . . . . . . . . . . . . (9,077) (10,807)Unamortized premium . . . . . . . . . . . . . . . . . . . . . . . . . . . . . . . . . . . . . . . . . . . . . . . . . . 2,832 3,371
5.25% senior notes due 2025, net . . . . . . . . . . . . . . . . . . . . . . . . . . . . . . . . . . . . . . . . 893,755 892,564
5.25% senior notes due 2027: Outstanding principal . . . . . . . . . . . . . . . . . . . . . . . . . . . . . . . . . . . . . . . . . . . . . . . . . . . 550,000 — Unamortized deferred debt financing costs . . . . . . . . . . . . . . . . . . . . . . . . . . . . . . . . . . (7,750) —
5.25% senior notes due 2027, net . . . . . . . . . . . . . . . . . . . . . . . . . . . . . . . . . . . . . . . . 542,250 —
Total long-term debt, net of unamortized deferred debt financing costs and discount/premium . . . . . . . . . . . . . . . . . . . . . . . . . . . . . . . . . . . . . . . . . . . . . . . . . . . . . . . 1,879,783 1,638,877 Current portion of long-term debt . . . . . . . . . . . . . . . . . . . . . . . . . . . . . . . . . . . . . . . . . . (5,625) — Long-term debt, net of unamortized deferred debt financing costs and discount/premium and excluding current portion . . . . . . . . . . . . . . . . . . . . . . . . . . . . . . $ 1,874,158 $ 1,638,877
(1) Unamortized deferred debt financing costs related to our revolving credit facility were $2.2 million and $3.0 million as of
December 28, 2019 and December 29, 2018, respectively. These amounts are included in other assets in the accompanying consolidated balance sheets. The $3.0 million as of December 29, 2018 was reclassified during fiscal 2019 from long-term debt to other assets in the accompanying consolidated balance sheet.
(2) On October 10, 2019, we redeemed all $700.0 million aggregate principal amount of our 4.625% senior notes due 2021 and incurred $450.0 million of new long-term debt in the form of tranche B term loans that mature in 2026. We recorded a loss on extinguishment of debt of $1.2 million in the fourth quarter of 2019.
Senior Secured Credit Agreement. We made optional prepayments of our tranche B term loans of $150.0 million principal amount in fiscal 2018. On October 18, 2018, we made a mandatory prepayment of $352.2 million principal amount of tranche B term loans with the net proceeds of the Pirate Brands sale. On October 19, 2018, we made an optional prepayment of the remaining $147.9 million principal amount of tranche B term loans then outstanding under our credit agreement from cash on hand and the proceeds of additional revolving loans under our credit agreement. As a result of the optional and mandatory prepayments of the tranche B term loans, we recognized a loss on extinguishment of debt of $13.1 million in fiscal 2018.
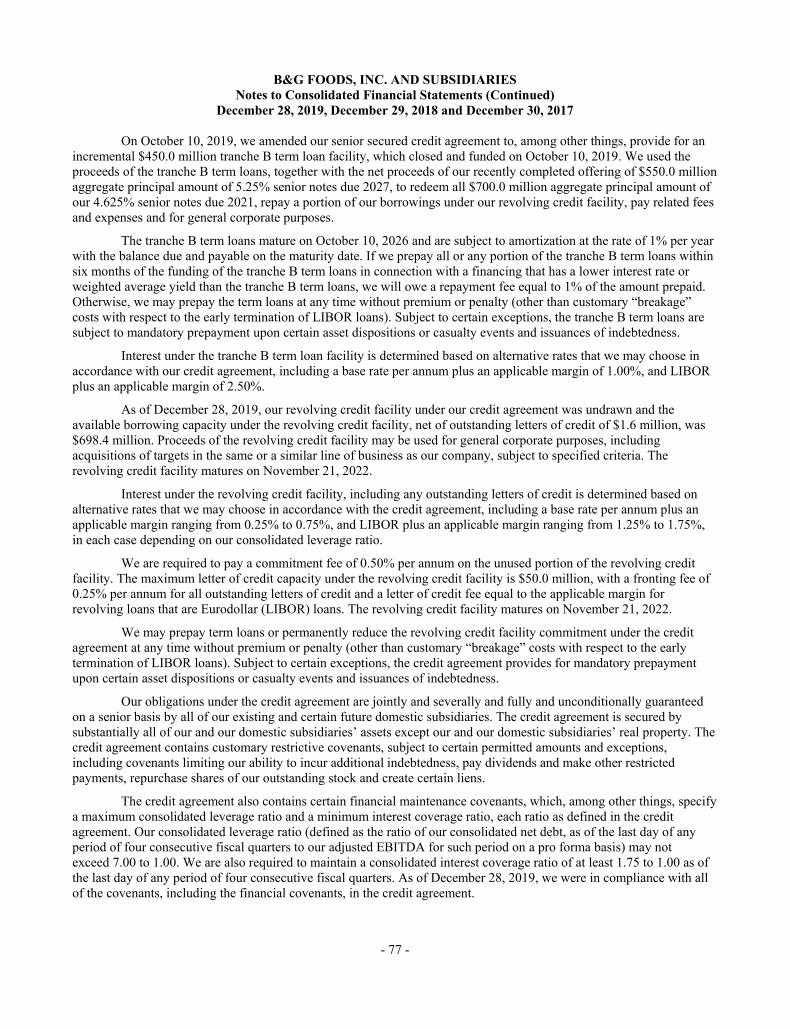
B&G FOODS, INC. AND SUBSIDIARIES Notes to Consolidated Financial Statements (Continued)
December 28, 2019, December 29, 2018 and December 30, 2017
- 77 -
On October 10, 2019, we amended our senior secured credit agreement to, among other things, provide for an incremental $450.0 million tranche B term loan facility, which closed and funded on October 10, 2019. We used the proceeds of the tranche B term loans, together with the net proceeds of our recently completed offering of $550.0 million aggregate principal amount of 5.25% senior notes due 2027, to redeem all $700.0 million aggregate principal amount of our 4.625% senior notes due 2021, repay a portion of our borrowings under our revolving credit facility, pay related fees and expenses and for general corporate purposes.
The tranche B term loans mature on October 10, 2026 and are subject to amortization at the rate of 1% per year with the balance due and payable on the maturity date. If we prepay all or any portion of the tranche B term loans within six months of the funding of the tranche B term loans in connection with a financing that has a lower interest rate or weighted average yield than the tranche B term loans, we will owe a repayment fee equal to 1% of the amount prepaid. Otherwise, we may prepay the term loans at any time without premium or penalty (other than customary “breakage” costs with respect to the early termination of LIBOR loans). Subject to certain exceptions, the tranche B term loans are subject to mandatory prepayment upon certain asset dispositions or casualty events and issuances of indebtedness.
Interest under the tranche B term loan facility is determined based on alternative rates that we may choose in accordance with our credit agreement, including a base rate per annum plus an applicable margin of 1.00%, and LIBOR plus an applicable margin of 2.50%.
As of December 28, 2019, our revolving credit facility under our credit agreement was undrawn and the available borrowing capacity under the revolving credit facility, net of outstanding letters of credit of $1.6 million, was $698.4 million. Proceeds of the revolving credit facility may be used for general corporate purposes, including acquisitions of targets in the same or a similar line of business as our company, subject to specified criteria. The revolving credit facility matures on November 21, 2022.
Interest under the revolving credit facility, including any outstanding letters of credit is determined based on alternative rates that we may choose in accordance with the credit agreement, including a base rate per annum plus an applicable margin ranging from 0.25% to 0.75%, and LIBOR plus an applicable margin ranging from 1.25% to 1.75%, in each case depending on our consolidated leverage ratio.
We are required to pay a commitment fee of 0.50% per annum on the unused portion of the revolving credit facility. The maximum letter of credit capacity under the revolving credit facility is $50.0 million, with a fronting fee of 0.25% per annum for all outstanding letters of credit and a letter of credit fee equal to the applicable margin for revolving loans that are Eurodollar (LIBOR) loans. The revolving credit facility matures on November 21, 2022.
We may prepay term loans or permanently reduce the revolving credit facility commitment under the credit agreement at any time without premium or penalty (other than customary “breakage” costs with respect to the early termination of LIBOR loans). Subject to certain exceptions, the credit agreement provides for mandatory prepayment upon certain asset dispositions or casualty events and issuances of indebtedness.
Our obligations under the credit agreement are jointly and severally and fully and unconditionally guaranteed on a senior basis by all of our existing and certain future domestic subsidiaries. The credit agreement is secured by substantially all of our and our domestic subsidiaries’ assets except our and our domestic subsidiaries’ real property. The credit agreement contains customary restrictive covenants, subject to certain permitted amounts and exceptions, including covenants limiting our ability to incur additional indebtedness, pay dividends and make other restricted payments, repurchase shares of our outstanding stock and create certain liens.
The credit agreement also contains certain financial maintenance covenants, which, among other things, specify a maximum consolidated leverage ratio and a minimum interest coverage ratio, each ratio as defined in the credit agreement. Our consolidated leverage ratio (defined as the ratio of our consolidated net debt, as of the last day of any period of four consecutive fiscal quarters to our adjusted EBITDA for such period on a pro forma basis) may not exceed 7.00 to 1.00. We are also required to maintain a consolidated interest coverage ratio of at least 1.75 to 1.00 as of the last day of any period of four consecutive fiscal quarters. As of December 28, 2019, we were in compliance with all of the covenants, including the financial covenants, in the credit agreement.
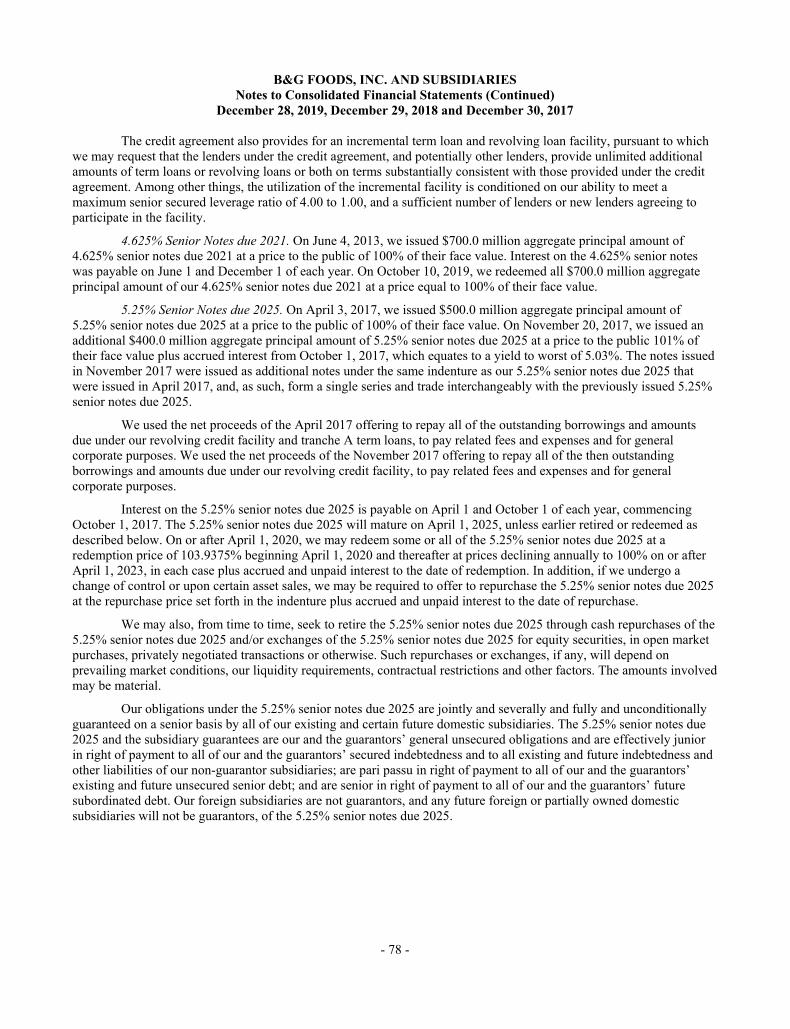
B&G FOODS, INC. AND SUBSIDIARIES Notes to Consolidated Financial Statements (Continued)
December 28, 2019, December 29, 2018 and December 30, 2017
- 78 -
The credit agreement also provides for an incremental term loan and revolving loan facility, pursuant to which we may request that the lenders under the credit agreement, and potentially other lenders, provide unlimited additional amounts of term loans or revolving loans or both on terms substantially consistent with those provided under the credit agreement. Among other things, the utilization of the incremental facility is conditioned on our ability to meet a maximum senior secured leverage ratio of 4.00 to 1.00, and a sufficient number of lenders or new lenders agreeing to participate in the facility.
4.625% Senior Notes due 2021. On June 4, 2013, we issued $700.0 million aggregate principal amount of 4.625% senior notes due 2021 at a price to the public of 100% of their face value. Interest on the 4.625% senior notes was payable on June 1 and December 1 of each year. On October 10, 2019, we redeemed all $700.0 million aggregate principal amount of our 4.625% senior notes due 2021 at a price equal to 100% of their face value.
5.25% Senior Notes due 2025. On April 3, 2017, we issued $500.0 million aggregate principal amount of 5.25% senior notes due 2025 at a price to the public of 100% of their face value. On November 20, 2017, we issued an additional $400.0 million aggregate principal amount of 5.25% senior notes due 2025 at a price to the public 101% of their face value plus accrued interest from October 1, 2017, which equates to a yield to worst of 5.03%. The notes issued in November 2017 were issued as additional notes under the same indenture as our 5.25% senior notes due 2025 that were issued in April 2017, and, as such, form a single series and trade interchangeably with the previously issued 5.25% senior notes due 2025.
We used the net proceeds of the April 2017 offering to repay all of the outstanding borrowings and amounts due under our revolving credit facility and tranche A term loans, to pay related fees and expenses and for general corporate purposes. We used the net proceeds of the November 2017 offering to repay all of the then outstanding borrowings and amounts due under our revolving credit facility, to pay related fees and expenses and for general corporate purposes.
Interest on the 5.25% senior notes due 2025 is payable on April 1 and October 1 of each year, commencing October 1, 2017. The 5.25% senior notes due 2025 will mature on April 1, 2025, unless earlier retired or redeemed as described below. On or after April 1, 2020, we may redeem some or all of the 5.25% senior notes due 2025 at a redemption price of 103.9375% beginning April 1, 2020 and thereafter at prices declining annually to 100% on or after April 1, 2023, in each case plus accrued and unpaid interest to the date of redemption. In addition, if we undergo a change of control or upon certain asset sales, we may be required to offer to repurchase the 5.25% senior notes due 2025 at the repurchase price set forth in the indenture plus accrued and unpaid interest to the date of repurchase.
We may also, from time to time, seek to retire the 5.25% senior notes due 2025 through cash repurchases of the 5.25% senior notes due 2025 and/or exchanges of the 5.25% senior notes due 2025 for equity securities, in open market purchases, privately negotiated transactions or otherwise. Such repurchases or exchanges, if any, will depend on prevailing market conditions, our liquidity requirements, contractual restrictions and other factors. The amounts involved may be material.
Our obligations under the 5.25% senior notes due 2025 are jointly and severally and fully and unconditionally guaranteed on a senior basis by all of our existing and certain future domestic subsidiaries. The 5.25% senior notes due 2025 and the subsidiary guarantees are our and the guarantors’ general unsecured obligations and are effectively junior in right of payment to all of our and the guarantors’ secured indebtedness and to all existing and future indebtedness and other liabilities of our non-guarantor subsidiaries; are pari passu in right of payment to all of our and the guarantors’ existing and future unsecured senior debt; and are senior in right of payment to all of our and the guarantors’ future subordinated debt. Our foreign subsidiaries are not guarantors, and any future foreign or partially owned domestic subsidiaries will not be guarantors, of the 5.25% senior notes due 2025.
B&G FOODS, INC. AND SUBSIDIARIES Notes to Consolidated Financial Statements (Continued)
December 28, 2019, December 29, 2018 and December 30, 2017
- 79 -
The indenture governing the 5.25% senior notes due 2025 contains covenants with respect to us and the guarantors and restricts the incurrence of additional indebtedness and the issuance of capital stock; the payment of dividends or distributions on, and redemption of, capital stock; a number of other restricted payments, including certain investments; creation of specified liens, certain sale-leaseback transactions and sales of certain specified assets; fundamental changes, including consolidation, mergers and transfers of all or substantially all of our assets; and specified transactions with affiliates. Each of the covenants is subject to a number of important exceptions and qualifications. As of December 28, 2019, we were in compliance with all of the covenants in the indenture governing the 5.25% senior notes due 2025.
5.25% Senior Notes due 2027. On September 26, 2019, we issued $550.0 million aggregate principal amount of 5.25% senior notes due 2027 at a price to the public of 100% of their face value.
We used the proceeds of the offering, together with the proceeds of incremental term loans made during the fourth quarter of 2019 to redeem all of our outstanding 4.625% senior notes due 2021, repay a portion of our borrowings under our revolving credit facility, pay related fees and expenses and for general corporate purposes.
Interest on the 5.25% senior notes due 2027 is payable on March 15 and September 15 of each year, commencing March 15, 2020. The 5.25% senior notes due 2027 will mature on September 15, 2027, unless earlier retired or redeemed as described below.
We may redeem some or all of the 5.25% senior notes due 2027 at a redemption price of 103.938% beginning March 1, 2022 and thereafter at prices declining annually to 100% on or after March 1, 2025, in each case plus accrued and unpaid interest to the date of redemption. We may redeem up to 40% of the aggregate principal amount of the 5.25% senior notes due 2027 prior to March 1, 2022 with the net proceeds from certain equity offerings. We may also redeem some or all of the 5.25% senior notes due 2027 at any time prior to March 1, 2022 at a redemption price equal to the make-whole amount set forth in the tenth supplemental indenture. In addition, if we undergo a change of control or upon certain asset sales, we may be required to offer to repurchase the 5.25% senior notes due 2027 at the repurchase price set forth in the indenture plus accrued and unpaid interest to the date of repurchase.
We may also, from time to time, seek to retire the 5.25% senior notes due 2027 through cash repurchases of the 5.25% senior notes due 2027 and/or exchanges of the 5.25% senior notes due 2027 for equity securities, in open market purchases, privately negotiated transactions or otherwise. Such repurchases or exchanges, if any, will depend on prevailing market conditions, our liquidity requirements, contractual restrictions and other factors. The amounts involved may be material.
Our obligations under the 5.25% senior notes due 2027 are jointly and severally and fully and unconditionally guaranteed on a senior basis by all of our existing and certain future domestic subsidiaries. The 5.25% senior notes due 2027 and the subsidiary guarantees are our and the guarantors’ general unsecured obligations and are effectively junior in right of payment to all of our and the guarantors’ secured indebtedness and to all existing and future indebtedness and other liabilities of our non-guarantor subsidiaries; are pari passu in right of payment to all of our and the guarantors’ existing and future unsecured senior debt; and are senior in right of payment to all of our and the guarantors’ future subordinated debt. Our foreign subsidiaries are not guarantors, and any future foreign or partially owned domestic subsidiaries will not be guarantors, of the 5.25% senior notes due 2027.
The indenture governing the 5.25% senior notes due 2027 contains covenants with respect to us and the guarantors and restricts the incurrence of additional indebtedness and the issuance of capital stock; the payment of dividends or distributions on, and redemption of, capital stock; a number of other restricted payments, including certain investments; creation of specified liens, certain sale-leaseback transactions and sales of certain specified assets; fundamental changes, including consolidation, mergers and transfers of all or substantially all of our assets; and specified transactions with affiliates. Each of the covenants is subject to a number of important exceptions and qualifications. As of December 28, 2019, we were in compliance with all of the covenants in the indenture governing the 5.25% senior notes due 2027.
B&G FOODS, INC. AND SUBSIDIARIES Notes to Consolidated Financial Statements (Continued)
December 28, 2019, December 29, 2018 and December 30, 2017
- 80 -
Subsidiary Guarantees. We have no assets or operations independent of our direct and indirect subsidiaries. All of our present domestic subsidiaries jointly and severally and fully and unconditionally guarantee our long-term debt. There are no significant restrictions on our ability and the ability of our subsidiaries to obtain funds from our respective subsidiaries by dividend or loan. See Note 19, “Guarantor and Non-Guarantor Financial Information.”
Loss on Extinguishment of Debt. Loss on extinguishment of debt for fiscal 2019 includes the write-off of deferred debt financing costs of $1.2 million, relating to the repayment of all outstanding borrowings under the 4.625% senior notes due 2021. Loss on extinguishment of debt for fiscal 2018 includes the write-off of deferred debt financing costs and unamortized discount of $11.1 million and $2.0 million, respectively, relating to the repayment of all outstanding borrowings under the tranche B term loans. Loss on extinguishment of debt for fiscal 2017 includes the write-off of deferred debt financing costs and unamortized discount of $0.9 million and $0.3 million, respectively, relating to the repayment of all outstanding borrowings under the tranche A term loans.
Contractual Maturities. As of December 28, 2019, the aggregate contractual maturities of long-term debt were as follows (in thousands)1:
Aggregate Contractual MaturitiesFiscal year:
2020 . . . . . . . . . . . . . . . . . . . . . . . . . . . . . . . . . . . . . . . . . . . . . . . . . . . . . . . . . . . . . . . . . . . . . $ 5,625 2021 . . . . . . . . . . . . . . . . . . . . . . . . . . . . . . . . . . . . . . . . . . . . . . . . . . . . . . . . . . . . . . . . . . . . . 4,500 2022 . . . . . . . . . . . . . . . . . . . . . . . . . . . . . . . . . . . . . . . . . . . . . . . . . . . . . . . . . . . . . . . . . . . . . 4,500 2023 . . . . . . . . . . . . . . . . . . . . . . . . . . . . . . . . . . . . . . . . . . . . . . . . . . . . . . . . . . . . . . . . . . . . . 4,500 2024 . . . . . . . . . . . . . . . . . . . . . . . . . . . . . . . . . . . . . . . . . . . . . . . . . . . . . . . . . . . . . . . . . . . . . 4,500 Thereafter . . . . . . . . . . . . . . . . . . . . . . . . . . . . . . . . . . . . . . . . . . . . . . . . . . . . . . . . . . . . . . . . 1,876,375
Total . . . . . . . . . . . . . . . . . . . . . . . . . . . . . . . . . . . . . . . . . . . . . . . . . . . . . . . . . . . . . . . . . . $ 1,900,000
(1) Fiscal years 2020 to 2024 reflect required 1% amortization prepayments of our tranche B term loan due 2026.
Accrued Interest. At December 28, 2019 and December 29, 2018, accrued interest of $21.4 million and $15.6 million, respectively, is included in accrued expenses in the accompanying consolidated balance sheets.
(8) Fair Value Measurements
The authoritative accounting literature relating to fair value measurements defines fair value as the price that would be received to sell an asset or paid to transfer a liability in an orderly transaction between market participants at the measurement date (an exit price). The accounting literature outlines a valuation framework and creates a fair value hierarchy in order to increase the consistency and comparability of fair value measurements and the related disclosures. Under GAAP, certain assets and liabilities must be measured at fair value, and the accounting literature details the disclosures that are required for items measured at fair value.
Financial assets and liabilities are measured using inputs from the three levels of the fair value hierarchy under the accounting literature. The three levels are as follows:
Level 1—Inputs are unadjusted quoted prices in active markets for identical assets or liabilities.
Level 2—Observable inputs other than Level 1 quoted prices, such as quoted prices for similar instruments in active markets; quoted prices for identical or similar instruments in markets that are not active; and model-derived valuations whose inputs are observable or whose significant value driver is observable for the asset or liability, either directly or indirectly.
Level 3—Unobservable inputs that reflect our assumptions about the assumptions that market participants would use in pricing the asset or liability.
B&G FOODS, INC. AND SUBSIDIARIES Notes to Consolidated Financial Statements (Continued)
December 28, 2019, December 29, 2018 and December 30, 2017
- 81 -
Cash and cash equivalents, trade accounts receivable, income tax receivable, trade accounts payable, accrued expenses, income tax payable and dividends payable are reflected in the consolidated balance sheets at carrying value, which approximates fair value due to the short-term nature of these instruments.
The carrying values and fair values of our revolving credit loans, term loans and senior notes as of December 28, 2019 and December 29, 2018 were as follows (in thousands): December 28, 2019 December 29, 2018 Carrying Value Fair Value Carrying Value Fair Value Revolving credit loans . . . . . . . . . . . . . . . . . . . . . . . . . . . . . $ — $ — $ 50,000 $ 50,000 (1)
Tranche B term loans due 2026 . . . . . . . . . . . . . . . . . . . . . . 447,820 (2) 451,179 (3) — —
4.625% senior notes due 2021 . . . . . . . . . . . . . . . . . . . . . . . — (4) — 700,000 684,250 (3)
5.25% senior notes due 2025 . . . . . . . . . . . . . . . . . . . . . . . . 902,832 (5) 929,917 (3) 903,371 (5) 837,877 (3)
5.25% senior notes due 2027 . . . . . . . . . . . . . . . . . . . . . . . . $ 550,000 (6) $ 550,000 (3) $ — $ —
(1) Fair values are estimated based on Level 2 inputs, which were quoted prices for identical or similar instruments in markets that
are not active. (2) On October 10, 2019, we incurred new long-term debt in the form of tranche B term loans that mature in 2026. The carrying
value of the tranche B term loans includes a discount. At December 28, 2019, the face amount of the tranche B term loans was $450.0 million.
(3) Fair values are estimated based on quoted market prices. (4) On October 10, 2019, we redeemed all $700.0 million aggregate principal amount of our 4.625% senior notes due 2021. See
Note 7, “Long-Term Debt.” (5) The carrying values of the 5.25% senior notes due 2025 include a premium. At December 28, 2019 the face amount of the
5.25% senior notes due 2025 was $900.0 million. (6) On September 26, 2019, we issued $550.0 million aggregate principal amount of 5.25% senior notes due 2027. See Note 7,
“Long-Term Debt.”
There was no Level 3 activity during fiscal 2019, 2018 or 2017.
(9) Accumulated Other Comprehensive Loss
The reclassifications from accumulated other comprehensive loss (AOCL) for fiscal 2019, 2018 and 2017 were as follows (in thousands): Amount Reclassified From AOCL Affected Line Item in the Statement Where Net Income Details about AOCL Components Fiscal 2019 Fiscal 2018 Fiscal 2017 (Loss) is Presented Defined benefit pension plan items
Amortization of unrecognized prior service cost . $ — $ 2 $ 35 See (1) below Amortization of unrecognized loss . . . . . . . . . . . . 861 696 517 See (1) below
Accumulated other comprehensive loss before tax . . 861 698 552 Total before tax Tax expense . . . . . . . . . . . . . . . . . . . . . . . . . . . . . . . . . (211) (174) (218) Income tax expense Total reclassification . . . . . . . . . . . . . . . . . . . . . . . . . $ 650 $ 524 $ 334 Net of tax
(1) These items are included in the computation of net periodic pension cost. See Note 12, “Pension Benefits,” for additional
information.
B&G FOODS, INC. AND SUBSIDIARIES Notes to Consolidated Financial Statements (Continued)
December 28, 2019, December 29, 2018 and December 30, 2017
- 82 -
Changes in AOCL for fiscal 2019, 2018 and 2017 were as follows (in thousands): Foreign Currency Defined Benefit Translation Pension Plan Items Adjustments Total Balance at December 31, 2016 . . . . . . . . . . . . . . . . . . . . . . . . . . . . . . . . . . . $ (7,200) $ (12,164) $ (19,364)
Other comprehensive (loss) income before reclassifications . . . . . . . . (6,119) 4,393 (1,726)Amounts reclassified from AOCL . . . . . . . . . . . . . . . . . . . . . . . . . . . . . 334 — 334
Net current period other comprehensive (loss) income . . . . . . . . . . . . . . . (5,785) 4,393 (1,392)Balance at December 30, 2017 . . . . . . . . . . . . . . . . . . . . . . . . . . . . . . . . . . . (12,985) (7,771) (20,756)
Other comprehensive income (loss) before reclassifications . . . . . . . . 237 (3,507) (3,270)Amounts reclassified from AOCL . . . . . . . . . . . . . . . . . . . . . . . . . . . . . 524 — 524
Net current period other comprehensive income (loss) . . . . . . . . . . . . . . . 761 (3,507) (2,746)Balance at December 29, 2018 . . . . . . . . . . . . . . . . . . . . . . . . . . . . . . . . . . . (12,224) (11,278) (23,502)
Other comprehensive (loss) income before reclassifications . . . . . . . . (13,187) 4,145 (9,042)Amounts reclassified from AOCL . . . . . . . . . . . . . . . . . . . . . . . . . . . . . 650 — 650
Net current period other comprehensive (loss) income . . . . . . . . . . . . . . . (12,537) 4,145 (8,392)Balance at December 28, 2019 . . . . . . . . . . . . . . . . . . . . . . . . . . . . . . . . . . . $ (24,761) $ (7,133) $ (31,894)
(10) Income Taxes
The components of income before income tax expense consist of the following (in thousands): Fiscal 2019 Fiscal 2018 Fiscal 2017 U.S. . . . . . . . . . . . . . . . . . . . . . . . . . . . . . . . . . . . . . . . . . . . . . . . . . . . . . . . . . $ 101,110 $ 217,044 $ 136,015 Foreign . . . . . . . . . . . . . . . . . . . . . . . . . . . . . . . . . . . . . . . . . . . . . . . . . . . . . . 4,582 5,233 12,047
Total . . . . . . . . . . . . . . . . . . . . . . . . . . . . . . . . . . . . . . . . . . . . . . . . . . . . . $ 105,692 $ 222,277 $ 148,062
Income tax expense (benefit) consists of the following (in thousands): Fiscal 2019 Fiscal 2018 Fiscal 2017 Current:
Federal . . . . . . . . . . . . . . . . . . . . . . . . . . . . . . . . . . . . . . . . . . . . . . . . . . . . $ 1,650 $ 41,583 $ 3,977 State . . . . . . . . . . . . . . . . . . . . . . . . . . . . . . . . . . . . . . . . . . . . . . . . . . . . . . 3,872 7,775 2,584 Foreign . . . . . . . . . . . . . . . . . . . . . . . . . . . . . . . . . . . . . . . . . . . . . . . . . . . 3,366 1,978 4,563
Current income tax expense . . . . . . . . . . . . . . . . . . . . . . . . . . . . . . . . . 8,888 51,336 11,124 Deferred:
Federal . . . . . . . . . . . . . . . . . . . . . . . . . . . . . . . . . . . . . . . . . . . . . . . . . . . . 19,541 3,508 (88,716)State . . . . . . . . . . . . . . . . . . . . . . . . . . . . . . . . . . . . . . . . . . . . . . . . . . . . . . 3,005 (3,190) 10,401 Foreign . . . . . . . . . . . . . . . . . . . . . . . . . . . . . . . . . . . . . . . . . . . . . . . . . . . (2,131) (1,812) (2,210)
Deferred income taxes . . . . . . . . . . . . . . . . . . . . . . . . . . . . . . . . . . . . . . 20,415 (1,494) (80,525)Income tax expense (benefit) . . . . . . . . . . . . . . . . . . . . . . . . . . . . . . . . $ 29,303 $ 49,842 $ (69,401)

B&G FOODS, INC. AND SUBSIDIARIES Notes to Consolidated Financial Statements (Continued)
December 28, 2019, December 29, 2018 and December 30, 2017
- 83 -
Income tax expense differs from the expected income tax expense (computed by applying the U.S. federal income tax rate of 21% for fiscal year 2019, 21% for fiscal year 2018 and 35% for fiscal year 2017 to income before income tax expense) as a result of the following: Fiscal 2019 Fiscal 2018 Fiscal 2017 Expected tax expense . . . . . . . . . . . . . . . . . . . . . . . . . . . . . . . . . . . . . . . . . 21.0 % 21.0 % 35.0 % Increase (decrease):
State income taxes, net of federal income tax benefit . . . . . . . . . . . . . 5.2 2.9 4.4 Impact on deferred taxes from changes in state tax rates . . . . . . . . . . 0.6 (1.6) 3.9 Foreign income taxes . . . . . . . . . . . . . . . . . . . . . . . . . . . . . . . . . . . . . . . 1.4 0.8 2.3 Impact on deferred taxes from U.S. Tax Act . . . . . . . . . . . . . . . . . . . . — 0.3 (90.0) Permanent differences . . . . . . . . . . . . . . . . . . . . . . . . . . . . . . . . . . . . . . 0.3 0.1 (0.4) Foreign tax credit . . . . . . . . . . . . . . . . . . . . . . . . . . . . . . . . . . . . . . . . . . (0.3) (0.1) (1.6) Other . . . . . . . . . . . . . . . . . . . . . . . . . . . . . . . . . . . . . . . . . . . . . . . . . . . . (0.5) (1.0) (0.5)
Total . . . . . . . . . . . . . . . . . . . . . . . . . . . . . . . . . . . . . . . . . . . . . . . . . . . 27.7 % 22.4 % (46.9) %
In the fourth quarter of 2017, as a result of the U.S. Tax Act, we remeasured our U.S. deferred tax assets and liabilities at the lower U.S. corporate income tax rate, which resulted in a discrete tax benefit of approximately $133.3 million. In fiscal 2019, 2018 and 2017, changes in state apportionments, state filings or state tax laws impacted our deferred blended state rate, resulting in a deferred state tax expense in fiscal 2019 of $0.8 million, a state tax benefit in fiscal 2018 of $3.5 million and state tax expense in fiscal 2017 of $5.8 million.
The tax effects of temporary differences that give rise to significant portions of the deferred tax assets and deferred tax liabilities are presented below (in thousands): December 28, December 29, 2019 2018 Deferred tax assets:
Accounts receivable, principally due to allowance . . . . . . . . . . . . . . . . . . . . . . . . . . . . . . . $ 25 $ 24 Inventories, principally due to additional costs capitalized for tax purposes . . . . . . . . . . . 2,611 2,090 Operating lease liabilities . . . . . . . . . . . . . . . . . . . . . . . . . . . . . . . . . . . . . . . . . . . . . . . . . . . . 10,277 — Accrued expenses and other liabilities . . . . . . . . . . . . . . . . . . . . . . . . . . . . . . . . . . . . . . . . . 12,809 8,512 Net operating losses and tax credit carryforwards . . . . . . . . . . . . . . . . . . . . . . . . . . . . . . . . 4,927 4,663 Interest expense deductions limitation . . . . . . . . . . . . . . . . . . . . . . . . . . . . . . . . . . . . . . . . . 7,427 —
Gross deferred tax assets . . . . . . . . . . . . . . . . . . . . . . . . . . . . . . . . . . . . . . . . . . . . . . . . . . . 38,076 15,289 Valuation allowances . . . . . . . . . . . . . . . . . . . . . . . . . . . . . . . . . . . . . . . . . . . . . . . . . . . . . . (1,702) (961)
Deferred tax assets, net . . . . . . . . . . . . . . . . . . . . . . . . . . . . . . . . . . . . . . . . . . . . . . . . . . . 36,374 14,328 Deferred tax liabilities:
Unrealized gains . . . . . . . . . . . . . . . . . . . . . . . . . . . . . . . . . . . . . . . . . . . . . . . . . . . . . . . . . . . (104) — Property, plant and equipment . . . . . . . . . . . . . . . . . . . . . . . . . . . . . . . . . . . . . . . . . . . . . . . . (24,054) (18,592)Goodwill and other intangible assets . . . . . . . . . . . . . . . . . . . . . . . . . . . . . . . . . . . . . . . . . . . (239,627) (217,811)Prepaid expenses and other assets . . . . . . . . . . . . . . . . . . . . . . . . . . . . . . . . . . . . . . . . . . . . . (9,939) (8,887)Operating lease right-of-use assets . . . . . . . . . . . . . . . . . . . . . . . . . . . . . . . . . . . . . . . . . . . . (9,618) —
Gross deferred tax liabilities . . . . . . . . . . . . . . . . . . . . . . . . . . . . . . . . . . . . . . . . . . . . . . . (283,342) (245,290)Net deferred tax liabilities. . . . . . . . . . . . . . . . . . . . . . . . . . . . . . . . . . . . . . . . . . . . . . . . $ (246,968) $ (230,962)
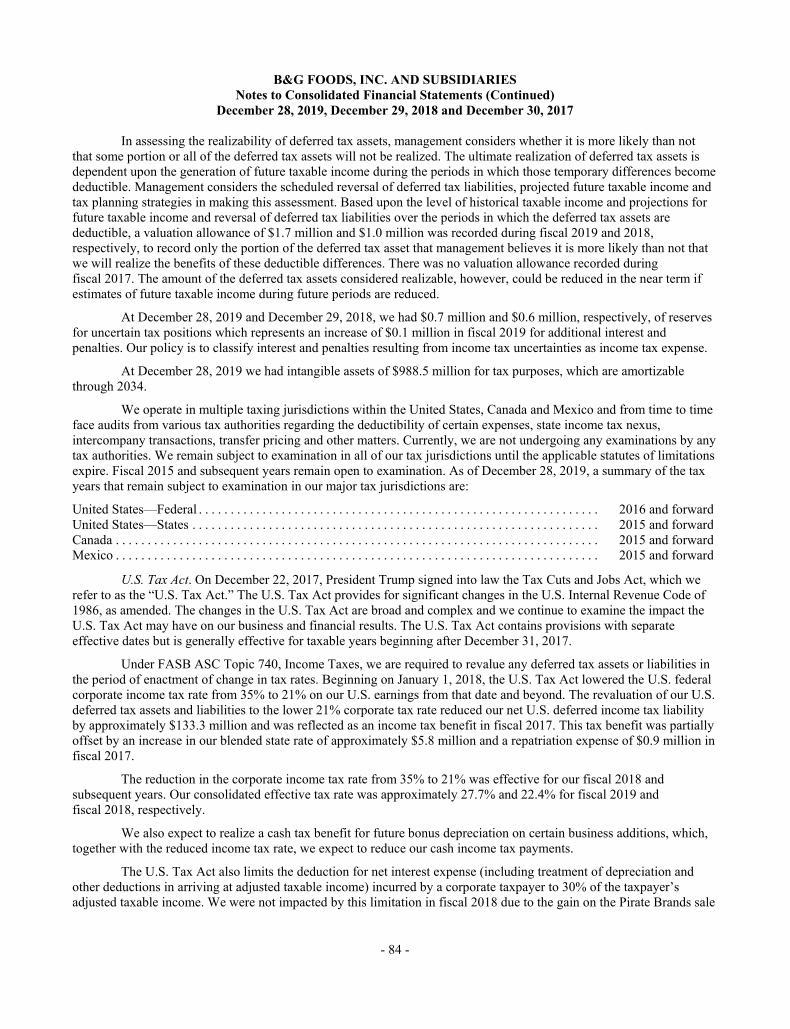
B&G FOODS, INC. AND SUBSIDIARIES Notes to Consolidated Financial Statements (Continued)
December 28, 2019, December 29, 2018 and December 30, 2017
- 84 -
In assessing the realizability of deferred tax assets, management considers whether it is more likely than not that some portion or all of the deferred tax assets will not be realized. The ultimate realization of deferred tax assets is dependent upon the generation of future taxable income during the periods in which those temporary differences become deductible. Management considers the scheduled reversal of deferred tax liabilities, projected future taxable income and tax planning strategies in making this assessment. Based upon the level of historical taxable income and projections for future taxable income and reversal of deferred tax liabilities over the periods in which the deferred tax assets are deductible, a valuation allowance of $1.7 million and $1.0 million was recorded during fiscal 2019 and 2018, respectively, to record only the portion of the deferred tax asset that management believes it is more likely than not that we will realize the benefits of these deductible differences. There was no valuation allowance recorded during fiscal 2017. The amount of the deferred tax assets considered realizable, however, could be reduced in the near term if estimates of future taxable income during future periods are reduced.
At December 28, 2019 and December 29, 2018, we had $0.7 million and $0.6 million, respectively, of reserves for uncertain tax positions which represents an increase of $0.1 million in fiscal 2019 for additional interest and penalties. Our policy is to classify interest and penalties resulting from income tax uncertainties as income tax expense.
At December 28, 2019 we had intangible assets of $988.5 million for tax purposes, which are amortizable through 2034.
We operate in multiple taxing jurisdictions within the United States, Canada and Mexico and from time to time face audits from various tax authorities regarding the deductibility of certain expenses, state income tax nexus, intercompany transactions, transfer pricing and other matters. Currently, we are not undergoing any examinations by any tax authorities. We remain subject to examination in all of our tax jurisdictions until the applicable statutes of limitations expire. Fiscal 2015 and subsequent years remain open to examination. As of December 28, 2019, a summary of the tax years that remain subject to examination in our major tax jurisdictions are:
United States—Federal . . . . . . . . . . . . . . . . . . . . . . . . . . . . . . . . . . . . . . . . . . . . . . . . . . . . . . . . . . . . . . . 2016 and forward United States—States . . . . . . . . . . . . . . . . . . . . . . . . . . . . . . . . . . . . . . . . . . . . . . . . . . . . . . . . . . . . . . . . 2015 and forward Canada . . . . . . . . . . . . . . . . . . . . . . . . . . . . . . . . . . . . . . . . . . . . . . . . . . . . . . . . . . . . . . . . . . . . . . . . . . . . 2015 and forward Mexico . . . . . . . . . . . . . . . . . . . . . . . . . . . . . . . . . . . . . . . . . . . . . . . . . . . . . . . . . . . . . . . . . . . . . . . . . . . . 2015 and forward
U.S. Tax Act. On December 22, 2017, President Trump signed into law the Tax Cuts and Jobs Act, which we refer to as the “U.S. Tax Act.” The U.S. Tax Act provides for significant changes in the U.S. Internal Revenue Code of 1986, as amended. The changes in the U.S. Tax Act are broad and complex and we continue to examine the impact the U.S. Tax Act may have on our business and financial results. The U.S. Tax Act contains provisions with separate effective dates but is generally effective for taxable years beginning after December 31, 2017.
Under FASB ASC Topic 740, Income Taxes, we are required to revalue any deferred tax assets or liabilities in the period of enactment of change in tax rates. Beginning on January 1, 2018, the U.S. Tax Act lowered the U.S. federal corporate income tax rate from 35% to 21% on our U.S. earnings from that date and beyond. The revaluation of our U.S. deferred tax assets and liabilities to the lower 21% corporate tax rate reduced our net U.S. deferred income tax liability by approximately $133.3 million and was reflected as an income tax benefit in fiscal 2017. This tax benefit was partially offset by an increase in our blended state rate of approximately $5.8 million and a repatriation expense of $0.9 million in fiscal 2017.
The reduction in the corporate income tax rate from 35% to 21% was effective for our fiscal 2018 and subsequent years. Our consolidated effective tax rate was approximately 27.7% and 22.4% for fiscal 2019 and fiscal 2018, respectively.
We also expect to realize a cash tax benefit for future bonus depreciation on certain business additions, which, together with the reduced income tax rate, we expect to reduce our cash income tax payments.
The U.S. Tax Act also limits the deduction for net interest expense (including treatment of depreciation and other deductions in arriving at adjusted taxable income) incurred by a corporate taxpayer to 30% of the taxpayer’s adjusted taxable income. We were not impacted by this limitation in fiscal 2018 due to the gain on the Pirate Brands sale
B&G FOODS, INC. AND SUBSIDIARIES Notes to Consolidated Financial Statements (Continued)
December 28, 2019, December 29, 2018 and December 30, 2017
- 85 -
which increased our adjusted taxable income. However, in fiscal 2019 this limitation resulted in an increase to our taxable income of $30.2 million and we accordingly established a deferred tax asset of $7.4 million without a valuation allowance. Although our interest expense exceeded 30% of our adjusted taxable income in fiscal 2019, at this time we do not believe this limitation has had, or will have, a material adverse impact on our business or financial results because any interest that is non-deductible may be carried forward indefinitely and we believe we have sufficient deferred tax liabilities to offset any deferred tax assets resulting from currently non-deductible interest expense.
The U.S. Treasury issued several regulations supplementing the U.S. Tax Act in 2018, including detailed guidance clarifying the calculation of the mandatory tax on previously unrepatriated earnings, application of the existing foreign tax credit rules to newly created categories and expanding details for application of the base erosion tax on affiliate payments. These regulations are to be applied retroactively and did not materially impact our 2018 or 2019 tax rates.
The ultimate impact of the U.S. Tax Act on our reported results in fiscal 2020 and beyond may differ from the estimates provided in this report, possibly materially, due to guidance that may be issued and other actions we may take as a result of the U.S. Tax Act different from that currently contemplated.
(11) Capital Stock
Voting Rights. The holders of our common stock are entitled to one vote per share with respect to each matter on which the holders of our common stock are entitled to vote. The holders of our common stock are not entitled to cumulate their votes in the election of our directors.
Dividends. The holders of our common stock are entitled to receive dividends, if any, as they may be lawfully declared from time to time by our board of directors, subject to any preferential rights of holders of any outstanding shares of preferred stock. In the event of any liquidation, dissolution or winding up of our company, common stockholders are entitled to share ratably in our assets available for distribution to the stockholders, subject to the prior rights of holders of any outstanding preferred stock. See Note 18, “Quarterly Financial Data (unaudited),” for dividends declared for each quarter of fiscal 2019 and 2018.
Additional Issuance of Our Authorized Common Stock and Preferred Stock. Additional shares of our authorized common stock and preferred stock may be issued, as determined by our board of directors from time to time, without approval of holders of our common stock, except as may be required by applicable law or the rules of any stock exchange or automated quotation system on which our securities may be listed or traded. Our board of directors has the authority by resolution to determine and fix, with respect to each series of preferred stock prior to the issuance of any shares of the series to which such resolution relates, the designations, powers, preferences and rights of the shares of preferred stock of such series and any qualifications, limitations or restrictions thereof.
Stock Repurchases. On March 13, 2018, our board of directors authorized a stock repurchase program for the repurchase of up to $50.0 million of our company’s common stock through March 15, 2019.
Under that authorization, we repurchased and retired 1,397,148 shares of common stock at an average price per share (excluding fees and commissions) of $26.41, or $36.9 million in the aggregate, including 694,749 shares of common stock at an average price per share (excluding fees and commissions) of $26.65, or $18.5 million in the aggregate, during the second quarter of 2018, 295,377 shares of common stock at an average price per share (excluding fees and commissions) of $28.39, or $8.4 million in the aggregate, during the fourth quarter of 2018 and 407,022 shares of common stock at an average price per share (excluding fees and commissions) of $24.55, or $10.0 million in the aggregate, during the first quarter of 2019.
On March 12, 2019, our board of directors authorized an extension of our stock repurchase program from March 15, 2019 to March 15, 2020. In extending the repurchase program, our board of directors also reset the repurchase authority to up to $50.0 million. Under the new authorization, we repurchased and retired 1,330,865 shares of common stock at an average price per share, excluding fees and commissions, of $18.55, or $24.7 million in the aggregate, during the third quarter of 2019. As of December 28, 2019, we had $25.3 million available for future repurchases of common
B&G FOODS, INC. AND SUBSIDIARIES Notes to Consolidated Financial Statements (Continued)
December 28, 2019, December 29, 2018 and December 30, 2017
- 86 -
stock under the stock repurchase program and we had 64,044,649 shares of common stock outstanding. We did not repurchase any shares of common stock during fiscal 2017.
Under the authorization, we may purchase shares of common stock from time to time in the open market or in privately negotiated transactions in compliance with the applicable rules and regulations of the SEC.
The timing and amount of future stock repurchases, if any, under the program will be at the discretion of management, and will depend on a variety of factors, including price, available cash, general business and market conditions and other investment opportunities. Therefore, we cannot assure you as to the number or aggregate dollar amount of additional shares, if any, that will be repurchased under the program. We may discontinue the program at any time. Any shares repurchased pursuant to the program will be retired.
See Note 12, “Pension Benefits,” for disclosure relating to shares of our company’s common stock purchased by our defined benefit pension plans.
(12) Pension Benefits
As of December 28, 2019, we had four company-sponsored defined benefit pension plans covering approximately 39.7% of our employees. The benefits are based on years of service and the employee’s compensation, as defined. Effective January 1, 2020, newly hired employees are no longer eligible to participate in our defined benefit pension plans.
The following table sets forth our defined benefit pension plans’ benefit obligation, fair value of plan assets and funded status recognized in the consolidated balance sheets. We used December 28, 2019 and December 29, 2018 measurement dates for fiscal 2019 and 2018, respectively, to calculate end of year benefit obligations, fair value of plan assets and annual net periodic benefit cost (in thousands): December 28, December 29, 2019 2018 Change in projected benefit obligation: Projected benefit obligation at beginning of year . . . . . . . . . . . . . . . . . . . . . . . . . . . . . . . . . . $ 138,152 $ 143,972 Actuarial loss (gain) . . . . . . . . . . . . . . . . . . . . . . . . . . . . . . . . . . . . . . . . . . . . . . . . . . . . . . . . . 28,038 (15,126)Service cost . . . . . . . . . . . . . . . . . . . . . . . . . . . . . . . . . . . . . . . . . . . . . . . . . . . . . . . . . . . . . . . . 7,140 7,710 Interest cost . . . . . . . . . . . . . . . . . . . . . . . . . . . . . . . . . . . . . . . . . . . . . . . . . . . . . . . . . . . . . . . . 5,734 5,064 Benefits paid . . . . . . . . . . . . . . . . . . . . . . . . . . . . . . . . . . . . . . . . . . . . . . . . . . . . . . . . . . . . . . . (3,700) (3,468)
Projected benefit obligation at end of year . . . . . . . . . . . . . . . . . . . . . . . . . . . . . . . . . . . . . . 175,364 138,152 Change in plan assets: Fair value of plan assets at beginning of year . . . . . . . . . . . . . . . . . . . . . . . . . . . . . . . . . . . . . 119,706 124,252 Actual return (loss) on plan assets . . . . . . . . . . . . . . . . . . . . . . . . . . . . . . . . . . . . . . . . . . . . . . 18,284 (6,678)Employer contributions . . . . . . . . . . . . . . . . . . . . . . . . . . . . . . . . . . . . . . . . . . . . . . . . . . . . . . . 5,000 5,600 Benefits paid . . . . . . . . . . . . . . . . . . . . . . . . . . . . . . . . . . . . . . . . . . . . . . . . . . . . . . . . . . . . . . . (3,701) (3,468)
Fair value of plan assets at end of year . . . . . . . . . . . . . . . . . . . . . . . . . . . . . . . . . . . . . . . . . 139,289 119,706 Net amount recognized: Other assets . . . . . . . . . . . . . . . . . . . . . . . . . . . . . . . . . . . . . . . . . . . . . . . . . . . . . . . . . . . . . . . . 534 805 Other long-term liabilities . . . . . . . . . . . . . . . . . . . . . . . . . . . . . . . . . . . . . . . . . . . . . . . . . . . . . (36,609) (19,251)
Funded status at the end of the year . . . . . . . . . . . . . . . . . . . . . . . . . . . . . . . . . . . . . . . . . . . (36,075) (18,446)Amount recognized in accumulated other comprehensive loss consists of: Prior service cost . . . . . . . . . . . . . . . . . . . . . . . . . . . . . . . . . . . . . . . . . . . . . . . . . . . . . . . . . . . . — — Actuarial loss . . . . . . . . . . . . . . . . . . . . . . . . . . . . . . . . . . . . . . . . . . . . . . . . . . . . . . . . . . . . . . . (36,430) (19,786)Deferred taxes . . . . . . . . . . . . . . . . . . . . . . . . . . . . . . . . . . . . . . . . . . . . . . . . . . . . . . . . . . . . . . 11,669 7,562
Accumulated other comprehensive loss . . . . . . . . . . . . . . . . . . . . . . . . . . . . . . . . . . . . . . . . $ (24,761) $ (12,224)
B&G FOODS, INC. AND SUBSIDIARIES Notes to Consolidated Financial Statements (Continued)
December 28, 2019, December 29, 2018 and December 30, 2017
- 87 -
The accumulated benefit obligations of these plans were $161.4 million and $129.4 million at December 28, 2019 and December 29, 2018, respectively. The following information is presented for those plans with an accumulated benefit obligation in excess of plan assets (in thousands): December 28, December 29, 2019 2018 Accumulated benefit obligation . . . . . . . . . . . . . . . . . . . . . . . . . . . . . . . . . . . . . . . . . . . . . . . . . $ 155,794 $ 54,601 Fair value of plan assets . . . . . . . . . . . . . . . . . . . . . . . . . . . . . . . . . . . . . . . . . . . . . . . . . . . . . . . $ 133,191 $ 40,935
The amounts in accumulated other comprehensive loss that are expected to be recognized as components of net periodic benefit cost in fiscal 2020 were as follows (in thousands): Fiscal 2020 Prior service cost . . . . . . . . . . . . . . . . . . . . . . . . . . . . . . . . . . . . . . . . . . . . . . . . . . . . . . . . . . . . . . . . . . . . . . . $ — Actuarial loss . . . . . . . . . . . . . . . . . . . . . . . . . . . . . . . . . . . . . . . . . . . . . . . . . . . . . . . . . . . . . . . . . . . . . . . . . . 1,586 Total . . . . . . . . . . . . . . . . . . . . . . . . . . . . . . . . . . . . . . . . . . . . . . . . . . . . . . . . . . . . . . . . . . . . . . . . . . . . . . . . . $ 1,586
The assumptions used in the measurement of our benefit obligation as of December 28, 2019 and December 29, 2018 are shown in the following table: December 28, December 29, 2019 2018 Discount rate . . . . . . . . . . . . . . . . . . . . . . . . . . . . . . . . . . . . . . . . . . . . . . . . . . . . . . 3.03 - 3.18 % 4.08 - 4.18 % Rate of compensation increase . . . . . . . . . . . . . . . . . . . . . . . . . . . . . . . . . . . . . . . . 3.00 % 3.00 % Expected long-term rate of return . . . . . . . . . . . . . . . . . . . . . . . . . . . . . . . . . . . . . 6.50 % 6.50 %
The discount rate used to determine year-end fiscal 2019 and fiscal 2018 pension benefit obligations was derived by matching the plans’ expected future cash flows to the corresponding yields from the FTSE Pension Discount Curve (formerly known as the Citigroup Pension Discount Curve). This yield curve has been constructed to represent the available yields on high-quality fixed-income investments across a broad range of future maturities.
The overall expected long-term rate of return on plan assets assumption is based upon a building-block method, whereby the expected rate of return on each asset class is broken down into the following components: (1) inflation; (2) the real risk-free rate of return (i.e., the long-term estimate of future returns on default-free U.S. government securities); and (3) the risk premium for each asset class (i.e., the expected return in excess of the risk-free rate).
All three components are based primarily on historical data, with modest adjustments to take into account additional relevant information that is currently available. For the inflation and risk-free return components, the most significant additional information is that provided by the market for nominal and inflation-indexed U.S. Treasury securities. That market provides implied forecasts of both the inflation rate and risk-free rate for the period over which currently available securities mature. The historical data on risk premiums for each asset class is adjusted to reflect any systemic changes that have occurred in the relevant markets; e.g., the higher current valuations for equities, as a multiple of earnings, relative to the longer-term average for such valuations.
Net periodic pension cost includes the following components (in thousands): Fiscal 2019 Fiscal 2018 Fiscal 2017 Service cost—benefits earned during the period . . . . . . . . . . . . . . . . . $ 7,140 $ 7,710 $ 6,334 Interest cost on projected benefit obligation . . . . . . . . . . . . . . . . . . . . 5,734 5,064 4,998 Expected return on plan assets . . . . . . . . . . . . . . . . . . . . . . . . . . . . . . . (7,750) (8,134) (7,041)Amortization of unrecognized prior service cost . . . . . . . . . . . . . . . . — 2 35 Amortization of unrecognized loss . . . . . . . . . . . . . . . . . . . . . . . . . . . 861 696 517
Net periodic pension cost . . . . . . . . . . . . . . . . . . . . . . . . . . . . . . . . . $ 5,985 $ 5,338 $ 4,843
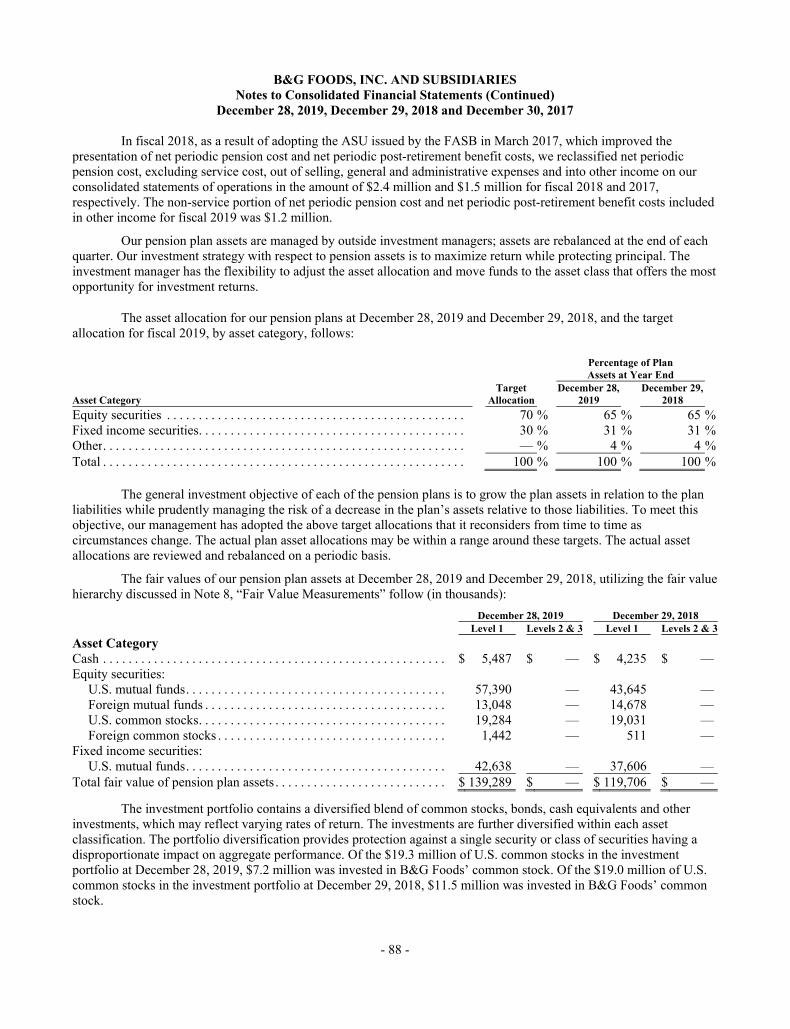
B&G FOODS, INC. AND SUBSIDIARIES Notes to Consolidated Financial Statements (Continued)
December 28, 2019, December 29, 2018 and December 30, 2017
- 88 -
In fiscal 2018, as a result of adopting the ASU issued by the FASB in March 2017, which improved the presentation of net periodic pension cost and net periodic post-retirement benefit costs, we reclassified net periodic pension cost, excluding service cost, out of selling, general and administrative expenses and into other income on our consolidated statements of operations in the amount of $2.4 million and $1.5 million for fiscal 2018 and 2017, respectively. The non-service portion of net periodic pension cost and net periodic post-retirement benefit costs included in other income for fiscal 2019 was $1.2 million.
Our pension plan assets are managed by outside investment managers; assets are rebalanced at the end of each quarter. Our investment strategy with respect to pension assets is to maximize return while protecting principal. The investment manager has the flexibility to adjust the asset allocation and move funds to the asset class that offers the most opportunity for investment returns.
The asset allocation for our pension plans at December 28, 2019 and December 29, 2018, and the target allocation for fiscal 2019, by asset category, follows:
Percentage of Plan Assets at Year End Target December 28, December 29, Asset Category Allocation 2019 2018 Equity securities . . . . . . . . . . . . . . . . . . . . . . . . . . . . . . . . . . . . . . . . . . . . . . . 70 % 65 % 65 % Fixed income securities . . . . . . . . . . . . . . . . . . . . . . . . . . . . . . . . . . . . . . . . . . 30 % 31 % 31 % Other . . . . . . . . . . . . . . . . . . . . . . . . . . . . . . . . . . . . . . . . . . . . . . . . . . . . . . . . . — % 4 % 4 % Total . . . . . . . . . . . . . . . . . . . . . . . . . . . . . . . . . . . . . . . . . . . . . . . . . . . . . . . . . 100 % 100 % 100 %
The general investment objective of each of the pension plans is to grow the plan assets in relation to the plan liabilities while prudently managing the risk of a decrease in the plan’s assets relative to those liabilities. To meet this objective, our management has adopted the above target allocations that it reconsiders from time to time as circumstances change. The actual plan asset allocations may be within a range around these targets. The actual asset allocations are reviewed and rebalanced on a periodic basis.
The fair values of our pension plan assets at December 28, 2019 and December 29, 2018, utilizing the fair value hierarchy discussed in Note 8, “Fair Value Measurements” follow (in thousands): December 28, 2019 December 29, 2018 Level 1 Levels 2 & 3 Level 1 Levels 2 & 3Asset Category Cash . . . . . . . . . . . . . . . . . . . . . . . . . . . . . . . . . . . . . . . . . . . . . . . . . . . . . . $ 5,487 $ — $ 4,235 $ — Equity securities:
U.S. mutual funds . . . . . . . . . . . . . . . . . . . . . . . . . . . . . . . . . . . . . . . . . 57,390 — 43,645 — Foreign mutual funds . . . . . . . . . . . . . . . . . . . . . . . . . . . . . . . . . . . . . . 13,048 — 14,678 — U.S. common stocks . . . . . . . . . . . . . . . . . . . . . . . . . . . . . . . . . . . . . . . 19,284 — 19,031 — Foreign common stocks . . . . . . . . . . . . . . . . . . . . . . . . . . . . . . . . . . . . 1,442 — 511 —
Fixed income securities: U.S. mutual funds . . . . . . . . . . . . . . . . . . . . . . . . . . . . . . . . . . . . . . . . . 42,638 — 37,606 —
Total fair value of pension plan assets . . . . . . . . . . . . . . . . . . . . . . . . . . . $ 139,289 $ — $ 119,706 $ —
The investment portfolio contains a diversified blend of common stocks, bonds, cash equivalents and other investments, which may reflect varying rates of return. The investments are further diversified within each asset classification. The portfolio diversification provides protection against a single security or class of securities having a disproportionate impact on aggregate performance. Of the $19.3 million of U.S. common stocks in the investment portfolio at December 28, 2019, $7.2 million was invested in B&G Foods’ common stock. Of the $19.0 million of U.S. common stocks in the investment portfolio at December 29, 2018, $11.5 million was invested in B&G Foods’ common stock.
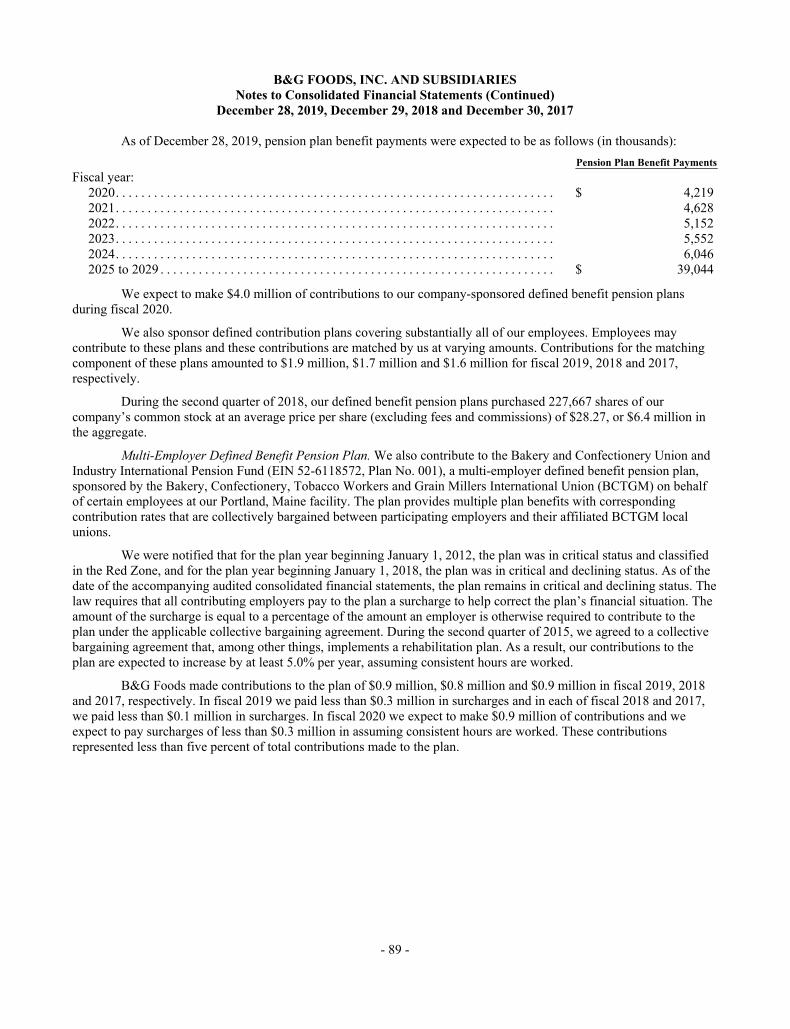
B&G FOODS, INC. AND SUBSIDIARIES Notes to Consolidated Financial Statements (Continued)
December 28, 2019, December 29, 2018 and December 30, 2017
- 89 -
As of December 28, 2019, pension plan benefit payments were expected to be as follows (in thousands): Pension Plan Benefit Payments Fiscal year:
2020 . . . . . . . . . . . . . . . . . . . . . . . . . . . . . . . . . . . . . . . . . . . . . . . . . . . . . . . . . . . . . . . . . . . . . $ 4,219 2021 . . . . . . . . . . . . . . . . . . . . . . . . . . . . . . . . . . . . . . . . . . . . . . . . . . . . . . . . . . . . . . . . . . . . . 4,628 2022 . . . . . . . . . . . . . . . . . . . . . . . . . . . . . . . . . . . . . . . . . . . . . . . . . . . . . . . . . . . . . . . . . . . . . 5,152 2023 . . . . . . . . . . . . . . . . . . . . . . . . . . . . . . . . . . . . . . . . . . . . . . . . . . . . . . . . . . . . . . . . . . . . . 5,552 2024 . . . . . . . . . . . . . . . . . . . . . . . . . . . . . . . . . . . . . . . . . . . . . . . . . . . . . . . . . . . . . . . . . . . . . 6,046 2025 to 2029 . . . . . . . . . . . . . . . . . . . . . . . . . . . . . . . . . . . . . . . . . . . . . . . . . . . . . . . . . . . . . . $ 39,044
We expect to make $4.0 million of contributions to our company-sponsored defined benefit pension plans during fiscal 2020.
We also sponsor defined contribution plans covering substantially all of our employees. Employees may contribute to these plans and these contributions are matched by us at varying amounts. Contributions for the matching component of these plans amounted to $1.9 million, $1.7 million and $1.6 million for fiscal 2019, 2018 and 2017, respectively.
During the second quarter of 2018, our defined benefit pension plans purchased 227,667 shares of our company’s common stock at an average price per share (excluding fees and commissions) of $28.27, or $6.4 million in the aggregate.
Multi-Employer Defined Benefit Pension Plan. We also contribute to the Bakery and Confectionery Union and Industry International Pension Fund (EIN 52-6118572, Plan No. 001), a multi-employer defined benefit pension plan, sponsored by the Bakery, Confectionery, Tobacco Workers and Grain Millers International Union (BCTGM) on behalf of certain employees at our Portland, Maine facility. The plan provides multiple plan benefits with corresponding contribution rates that are collectively bargained between participating employers and their affiliated BCTGM local unions.
We were notified that for the plan year beginning January 1, 2012, the plan was in critical status and classified in the Red Zone, and for the plan year beginning January 1, 2018, the plan was in critical and declining status. As of the date of the accompanying audited consolidated financial statements, the plan remains in critical and declining status. The law requires that all contributing employers pay to the plan a surcharge to help correct the plan’s financial situation. The amount of the surcharge is equal to a percentage of the amount an employer is otherwise required to contribute to the plan under the applicable collective bargaining agreement. During the second quarter of 2015, we agreed to a collective bargaining agreement that, among other things, implements a rehabilitation plan. As a result, our contributions to the plan are expected to increase by at least 5.0% per year, assuming consistent hours are worked.
B&G Foods made contributions to the plan of $0.9 million, $0.8 million and $0.9 million in fiscal 2019, 2018 and 2017, respectively. In fiscal 2019 we paid less than $0.3 million in surcharges and in each of fiscal 2018 and 2017, we paid less than $0.1 million in surcharges. In fiscal 2020 we expect to make $0.9 million of contributions and we expect to pay surcharges of less than $0.3 million in assuming consistent hours are worked. These contributions represented less than five percent of total contributions made to the plan.
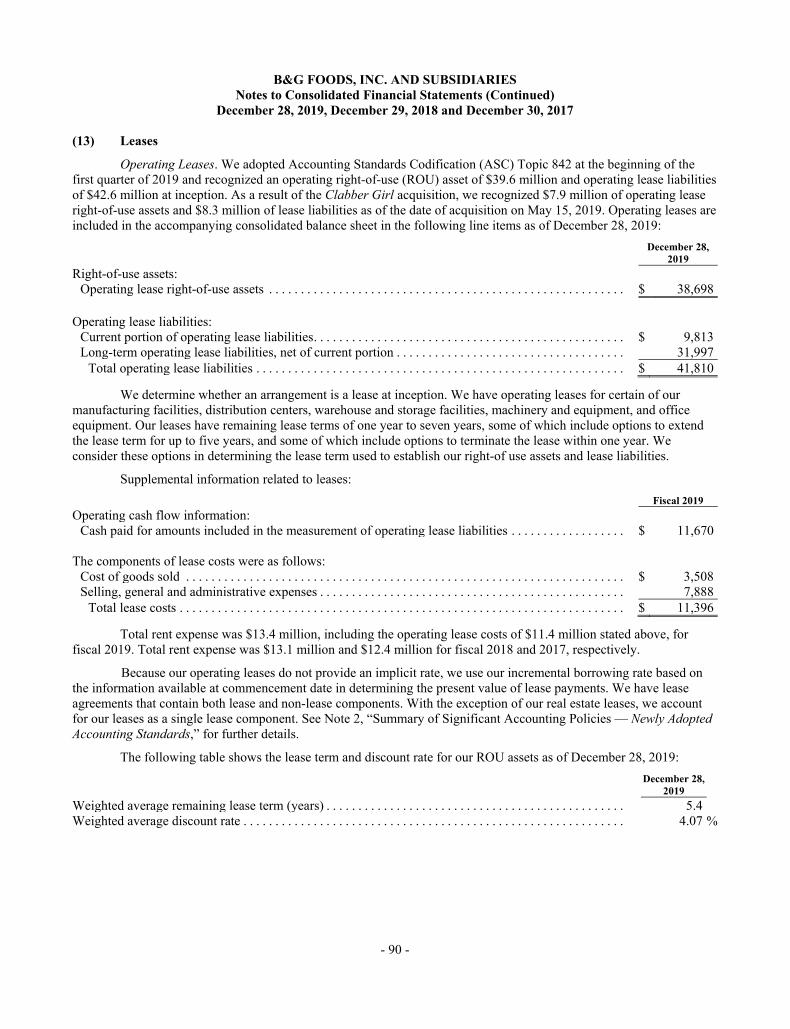
B&G FOODS, INC. AND SUBSIDIARIES Notes to Consolidated Financial Statements (Continued)
December 28, 2019, December 29, 2018 and December 30, 2017
- 90 -
(13) Leases
Operating Leases. We adopted Accounting Standards Codification (ASC) Topic 842 at the beginning of the first quarter of 2019 and recognized an operating right-of-use (ROU) asset of $39.6 million and operating lease liabilities of $42.6 million at inception. As a result of the Clabber Girl acquisition, we recognized $7.9 million of operating lease right-of-use assets and $8.3 million of lease liabilities as of the date of acquisition on May 15, 2019. Operating leases are included in the accompanying consolidated balance sheet in the following line items as of December 28, 2019: December 28, 2019 Right-of-use assets:
Operating lease right-of-use assets . . . . . . . . . . . . . . . . . . . . . . . . . . . . . . . . . . . . . . . . . . . . . . . . . . . . . . . . $ 38,698 Operating lease liabilities:
Current portion of operating lease liabilities . . . . . . . . . . . . . . . . . . . . . . . . . . . . . . . . . . . . . . . . . . . . . . . . . $ 9,813 Long-term operating lease liabilities, net of current portion . . . . . . . . . . . . . . . . . . . . . . . . . . . . . . . . . . . . 31,997
Total operating lease liabilities . . . . . . . . . . . . . . . . . . . . . . . . . . . . . . . . . . . . . . . . . . . . . . . . . . . . . . . . . . $ 41,810
We determine whether an arrangement is a lease at inception. We have operating leases for certain of our manufacturing facilities, distribution centers, warehouse and storage facilities, machinery and equipment, and office equipment. Our leases have remaining lease terms of one year to seven years, some of which include options to extend the lease term for up to five years, and some of which include options to terminate the lease within one year. We consider these options in determining the lease term used to establish our right-of use assets and lease liabilities.
Supplemental information related to leases: Fiscal 2019 Operating cash flow information:
Cash paid for amounts included in the measurement of operating lease liabilities . . . . . . . . . . . . . . . . . . $ 11,670 The components of lease costs were as follows:
Cost of goods sold . . . . . . . . . . . . . . . . . . . . . . . . . . . . . . . . . . . . . . . . . . . . . . . . . . . . . . . . . . . . . . . . . . . . . $ 3,508 Selling, general and administrative expenses . . . . . . . . . . . . . . . . . . . . . . . . . . . . . . . . . . . . . . . . . . . . . . . . 7,888
Total lease costs . . . . . . . . . . . . . . . . . . . . . . . . . . . . . . . . . . . . . . . . . . . . . . . . . . . . . . . . . . . . . . . . . . . . . . $ 11,396
Total rent expense was $13.4 million, including the operating lease costs of $11.4 million stated above, for fiscal 2019. Total rent expense was $13.1 million and $12.4 million for fiscal 2018 and 2017, respectively.
Because our operating leases do not provide an implicit rate, we use our incremental borrowing rate based on the information available at commencement date in determining the present value of lease payments. We have lease agreements that contain both lease and non-lease components. With the exception of our real estate leases, we account for our leases as a single lease component. See Note 2, “Summary of Significant Accounting Policies — Newly Adopted Accounting Standards,” for further details.
The following table shows the lease term and discount rate for our ROU assets as of December 28, 2019: December 28, 2019 Weighted average remaining lease term (years) . . . . . . . . . . . . . . . . . . . . . . . . . . . . . . . . . . . . . . . . . . . . . . . 5.4 Weighted average discount rate . . . . . . . . . . . . . . . . . . . . . . . . . . . . . . . . . . . . . . . . . . . . . . . . . . . . . . . . . . . . 4.07 %
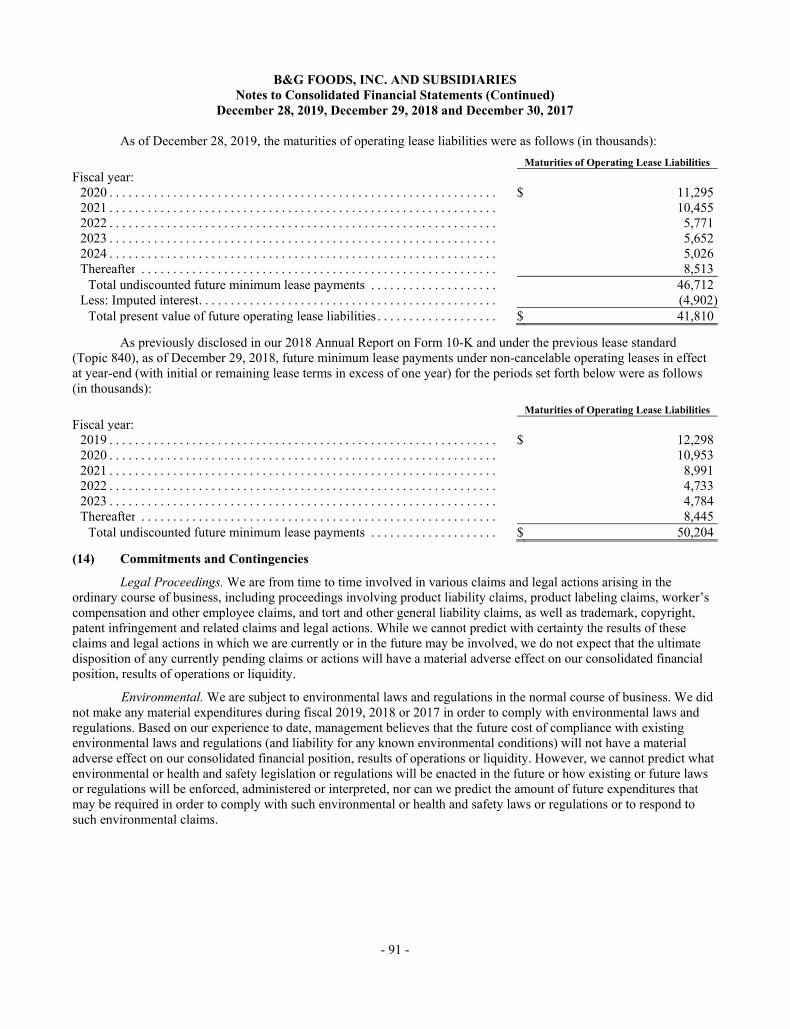
B&G FOODS, INC. AND SUBSIDIARIES Notes to Consolidated Financial Statements (Continued)
December 28, 2019, December 29, 2018 and December 30, 2017
- 91 -
As of December 28, 2019, the maturities of operating lease liabilities were as follows (in thousands): Maturities of Operating Lease Liabilities Fiscal year:
2020 . . . . . . . . . . . . . . . . . . . . . . . . . . . . . . . . . . . . . . . . . . . . . . . . . . . . . . . . . . . . . $ 11,295 2021 . . . . . . . . . . . . . . . . . . . . . . . . . . . . . . . . . . . . . . . . . . . . . . . . . . . . . . . . . . . . . 10,455 2022 . . . . . . . . . . . . . . . . . . . . . . . . . . . . . . . . . . . . . . . . . . . . . . . . . . . . . . . . . . . . . 5,771 2023 . . . . . . . . . . . . . . . . . . . . . . . . . . . . . . . . . . . . . . . . . . . . . . . . . . . . . . . . . . . . . 5,652 2024 . . . . . . . . . . . . . . . . . . . . . . . . . . . . . . . . . . . . . . . . . . . . . . . . . . . . . . . . . . . . . 5,026 Thereafter . . . . . . . . . . . . . . . . . . . . . . . . . . . . . . . . . . . . . . . . . . . . . . . . . . . . . . . . 8,513
Total undiscounted future minimum lease payments . . . . . . . . . . . . . . . . . . . . 46,712 Less: Imputed interest . . . . . . . . . . . . . . . . . . . . . . . . . . . . . . . . . . . . . . . . . . . . . . . (4,902)
Total present value of future operating lease liabilities . . . . . . . . . . . . . . . . . . . $ 41,810
As previously disclosed in our 2018 Annual Report on Form 10-K and under the previous lease standard (Topic 840), as of December 29, 2018, future minimum lease payments under non-cancelable operating leases in effect at year-end (with initial or remaining lease terms in excess of one year) for the periods set forth below were as follows (in thousands):
Maturities of Operating Lease Liabilities Fiscal year:
2019 . . . . . . . . . . . . . . . . . . . . . . . . . . . . . . . . . . . . . . . . . . . . . . . . . . . . . . . . . . . . . $ 12,298 2020 . . . . . . . . . . . . . . . . . . . . . . . . . . . . . . . . . . . . . . . . . . . . . . . . . . . . . . . . . . . . . 10,953 2021 . . . . . . . . . . . . . . . . . . . . . . . . . . . . . . . . . . . . . . . . . . . . . . . . . . . . . . . . . . . . . 8,991 2022 . . . . . . . . . . . . . . . . . . . . . . . . . . . . . . . . . . . . . . . . . . . . . . . . . . . . . . . . . . . . . 4,733 2023 . . . . . . . . . . . . . . . . . . . . . . . . . . . . . . . . . . . . . . . . . . . . . . . . . . . . . . . . . . . . . 4,784 Thereafter . . . . . . . . . . . . . . . . . . . . . . . . . . . . . . . . . . . . . . . . . . . . . . . . . . . . . . . . 8,445
Total undiscounted future minimum lease payments . . . . . . . . . . . . . . . . . . . . $ 50,204
(14) Commitments and Contingencies
Legal Proceedings. We are from time to time involved in various claims and legal actions arising in the ordinary course of business, including proceedings involving product liability claims, product labeling claims, worker’s compensation and other employee claims, and tort and other general liability claims, as well as trademark, copyright, patent infringement and related claims and legal actions. While we cannot predict with certainty the results of these claims and legal actions in which we are currently or in the future may be involved, we do not expect that the ultimate disposition of any currently pending claims or actions will have a material adverse effect on our consolidated financial position, results of operations or liquidity.
Environmental. We are subject to environmental laws and regulations in the normal course of business. We did not make any material expenditures during fiscal 2019, 2018 or 2017 in order to comply with environmental laws and regulations. Based on our experience to date, management believes that the future cost of compliance with existing environmental laws and regulations (and liability for any known environmental conditions) will not have a material adverse effect on our consolidated financial position, results of operations or liquidity. However, we cannot predict what environmental or health and safety legislation or regulations will be enacted in the future or how existing or future laws or regulations will be enforced, administered or interpreted, nor can we predict the amount of future expenditures that may be required in order to comply with such environmental or health and safety laws or regulations or to respond to such environmental claims.
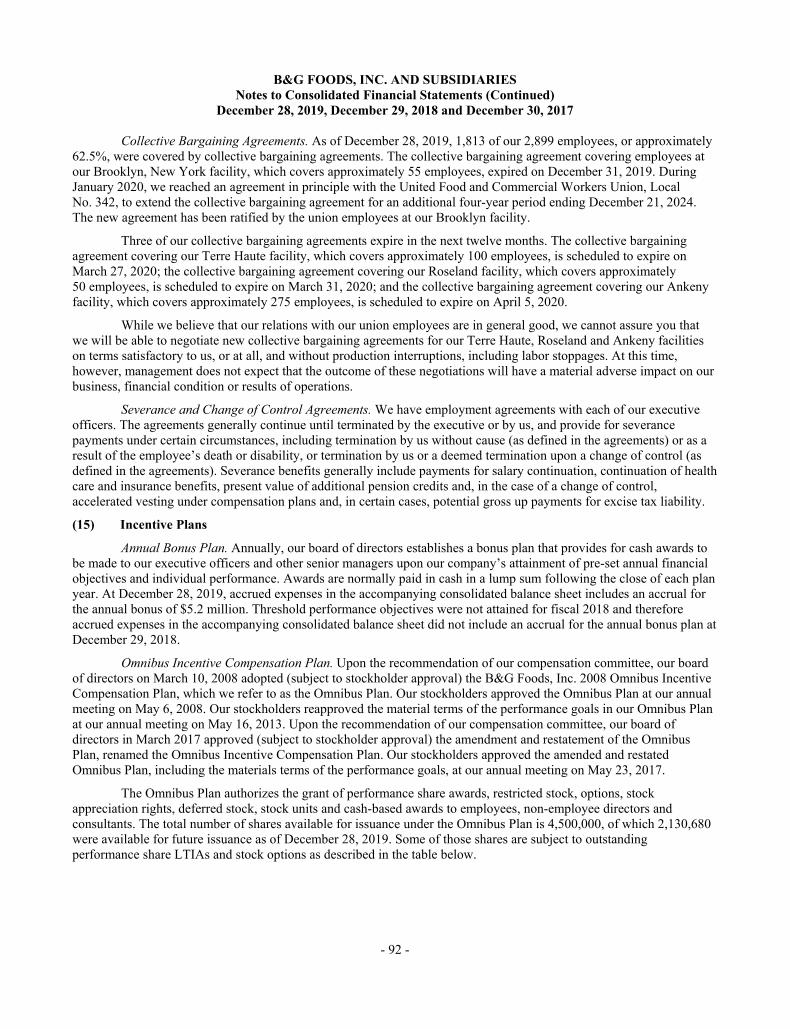
B&G FOODS, INC. AND SUBSIDIARIES Notes to Consolidated Financial Statements (Continued)
December 28, 2019, December 29, 2018 and December 30, 2017
- 92 -
Collective Bargaining Agreements. As of December 28, 2019, 1,813 of our 2,899 employees, or approximately 62.5%, were covered by collective bargaining agreements. The collective bargaining agreement covering employees at our Brooklyn, New York facility, which covers approximately 55 employees, expired on December 31, 2019. During January 2020, we reached an agreement in principle with the United Food and Commercial Workers Union, Local No. 342, to extend the collective bargaining agreement for an additional four-year period ending December 21, 2024. The new agreement has been ratified by the union employees at our Brooklyn facility.
Three of our collective bargaining agreements expire in the next twelve months. The collective bargaining agreement covering our Terre Haute facility, which covers approximately 100 employees, is scheduled to expire on March 27, 2020; the collective bargaining agreement covering our Roseland facility, which covers approximately 50 employees, is scheduled to expire on March 31, 2020; and the collective bargaining agreement covering our Ankeny facility, which covers approximately 275 employees, is scheduled to expire on April 5, 2020.
While we believe that our relations with our union employees are in general good, we cannot assure you that we will be able to negotiate new collective bargaining agreements for our Terre Haute, Roseland and Ankeny facilities on terms satisfactory to us, or at all, and without production interruptions, including labor stoppages. At this time, however, management does not expect that the outcome of these negotiations will have a material adverse impact on our business, financial condition or results of operations.
Severance and Change of Control Agreements. We have employment agreements with each of our executive officers. The agreements generally continue until terminated by the executive or by us, and provide for severance payments under certain circumstances, including termination by us without cause (as defined in the agreements) or as a result of the employee’s death or disability, or termination by us or a deemed termination upon a change of control (as defined in the agreements). Severance benefits generally include payments for salary continuation, continuation of health care and insurance benefits, present value of additional pension credits and, in the case of a change of control, accelerated vesting under compensation plans and, in certain cases, potential gross up payments for excise tax liability.
(15) Incentive Plans
Annual Bonus Plan. Annually, our board of directors establishes a bonus plan that provides for cash awards to be made to our executive officers and other senior managers upon our company’s attainment of pre-set annual financial objectives and individual performance. Awards are normally paid in cash in a lump sum following the close of each plan year. At December 28, 2019, accrued expenses in the accompanying consolidated balance sheet includes an accrual for the annual bonus of $5.2 million. Threshold performance objectives were not attained for fiscal 2018 and therefore accrued expenses in the accompanying consolidated balance sheet did not include an accrual for the annual bonus plan at December 29, 2018.
Omnibus Incentive Compensation Plan. Upon the recommendation of our compensation committee, our board of directors on March 10, 2008 adopted (subject to stockholder approval) the B&G Foods, Inc. 2008 Omnibus Incentive Compensation Plan, which we refer to as the Omnibus Plan. Our stockholders approved the Omnibus Plan at our annual meeting on May 6, 2008. Our stockholders reapproved the material terms of the performance goals in our Omnibus Plan at our annual meeting on May 16, 2013. Upon the recommendation of our compensation committee, our board of directors in March 2017 approved (subject to stockholder approval) the amendment and restatement of the Omnibus Plan, renamed the Omnibus Incentive Compensation Plan. Our stockholders approved the amended and restated Omnibus Plan, including the materials terms of the performance goals, at our annual meeting on May 23, 2017.
The Omnibus Plan authorizes the grant of performance share awards, restricted stock, options, stock appreciation rights, deferred stock, stock units and cash-based awards to employees, non-employee directors and consultants. The total number of shares available for issuance under the Omnibus Plan is 4,500,000, of which 2,130,680 were available for future issuance as of December 28, 2019. Some of those shares are subject to outstanding performance share LTIAs and stock options as described in the table below.
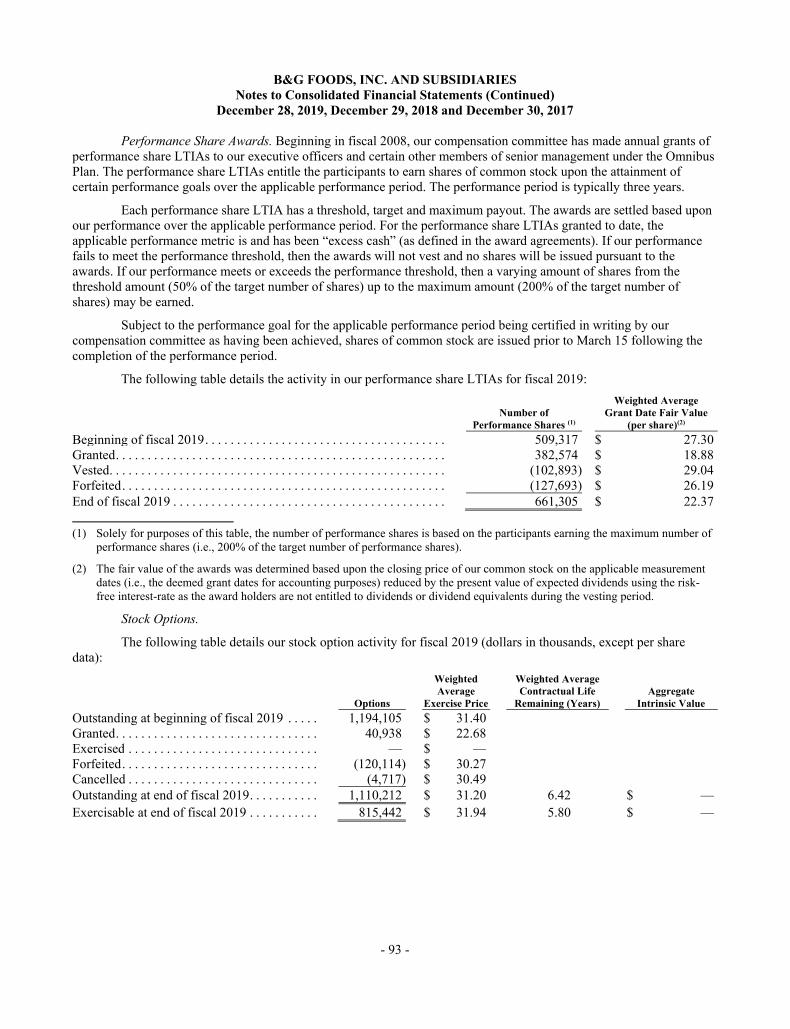
B&G FOODS, INC. AND SUBSIDIARIES Notes to Consolidated Financial Statements (Continued)
December 28, 2019, December 29, 2018 and December 30, 2017
- 93 -
Performance Share Awards. Beginning in fiscal 2008, our compensation committee has made annual grants of performance share LTIAs to our executive officers and certain other members of senior management under the Omnibus Plan. The performance share LTIAs entitle the participants to earn shares of common stock upon the attainment of certain performance goals over the applicable performance period. The performance period is typically three years.
Each performance share LTIA has a threshold, target and maximum payout. The awards are settled based upon our performance over the applicable performance period. For the performance share LTIAs granted to date, the applicable performance metric is and has been “excess cash” (as defined in the award agreements). If our performance fails to meet the performance threshold, then the awards will not vest and no shares will be issued pursuant to the awards. If our performance meets or exceeds the performance threshold, then a varying amount of shares from the threshold amount (50% of the target number of shares) up to the maximum amount (200% of the target number of shares) may be earned.
Subject to the performance goal for the applicable performance period being certified in writing by our compensation committee as having been achieved, shares of common stock are issued prior to March 15 following the completion of the performance period.
The following table details the activity in our performance share LTIAs for fiscal 2019: Weighted Average Number of Grant Date Fair Value Performance Shares (1) (per share)(2) Beginning of fiscal 2019 . . . . . . . . . . . . . . . . . . . . . . . . . . . . . . . . . . . . . . 509,317 $ 27.30 Granted . . . . . . . . . . . . . . . . . . . . . . . . . . . . . . . . . . . . . . . . . . . . . . . . . . . . 382,574 $ 18.88 Vested . . . . . . . . . . . . . . . . . . . . . . . . . . . . . . . . . . . . . . . . . . . . . . . . . . . . . (102,893) $ 29.04 Forfeited . . . . . . . . . . . . . . . . . . . . . . . . . . . . . . . . . . . . . . . . . . . . . . . . . . . (127,693) $ 26.19 End of fiscal 2019 . . . . . . . . . . . . . . . . . . . . . . . . . . . . . . . . . . . . . . . . . . . 661,305 $ 22.37
(1) Solely for purposes of this table, the number of performance shares is based on the participants earning the maximum number of
performance shares (i.e., 200% of the target number of performance shares).
(2) The fair value of the awards was determined based upon the closing price of our common stock on the applicable measurement dates (i.e., the deemed grant dates for accounting purposes) reduced by the present value of expected dividends using the risk-free interest-rate as the award holders are not entitled to dividends or dividend equivalents during the vesting period.
Stock Options.
The following table details our stock option activity for fiscal 2019 (dollars in thousands, except per share data): Weighted Weighted Average Average Contractual Life Aggregate Options Exercise Price Remaining (Years) Intrinsic Value Outstanding at beginning of fiscal 2019 . . . . . 1,194,105 $ 31.40 Granted . . . . . . . . . . . . . . . . . . . . . . . . . . . . . . . . 40,938 $ 22.68 Exercised . . . . . . . . . . . . . . . . . . . . . . . . . . . . . . — $ — Forfeited . . . . . . . . . . . . . . . . . . . . . . . . . . . . . . . (120,114) $ 30.27 Cancelled . . . . . . . . . . . . . . . . . . . . . . . . . . . . . . (4,717) $ 30.49 Outstanding at end of fiscal 2019 . . . . . . . . . . . 1,110,212 $ 31.20 6.42 $ — Exercisable at end of fiscal 2019 . . . . . . . . . . . 815,442 $ 31.94 5.80 $ —
B&G FOODS, INC. AND SUBSIDIARIES Notes to Consolidated Financial Statements (Continued)
December 28, 2019, December 29, 2018 and December 30, 2017
- 94 -
The fair value of the options was estimated on the date of grant using the Black-Scholes option-pricing model utilizing the following assumptions. Expected volatility was based on both historical and implied volatilities of our common stock over the estimated expected term of the award. The expected term of the options granted represents the period of time that options were expected to be outstanding and is based on the “simplified method” in accordance with accounting guidance. We utilized the simplified method to determine the expected term of the options as we do not have sufficient historical exercise data to provide a reasonable basis upon which to estimate expected term. The risk-free interest rate for the expected term of the option is based on the U.S. Treasury implied yield at the date of grant. The assumptions used in the Black-Scholes option-pricing model during fiscal 2019 and fiscal 2018 were as follows: Fiscal 2019 Fiscal 2018 Weighted average grant date fair value . . . . . . . . . . . . . . . . . . . . . $ 2.44 $ 3.74 Expected volatility. . . . . . . . . . . . . . . . . . . . . . . . . . . . . . . . . . . . . . 31.3% 30.6% - 31.7% Expected term . . . . . . . . . . . . . . . . . . . . . . . . . . . . . . . . . . . . . . . . . 5.5 years 5.5 - 6.5 years Risk-free interest rate . . . . . . . . . . . . . . . . . . . . . . . . . . . . . . . . . . . 1.9% 2.6% - 2.8% Dividend yield . . . . . . . . . . . . . . . . . . . . . . . . . . . . . . . . . . . . . . . . . 8.4% 6.7% - 8.1%
Non-Employee Director Grants. Each of our non-employee directors receives an annual grant of common stock as part of his or her non-employee director compensation. These shares fully vest when issued. In addition, each of our non-employee directors is given the option to receive all or a portion of his or her annual board service fee in cash or an equivalent amount of stock options. Such stock options are reflected in the information provided above under “Stock Options.”
The following table details the number of shares of common stock issued by our company during fiscal 2019, 2018 and 2017 upon the vesting of performance share long-term incentive awards and for non-employee director annual equity grants and other share-based compensation: Fiscal 2019 Fiscal 2018 Fiscal 2017 Number of performance shares vested . . . . . . . . . . . . . . . . . . . . . . . . . . . . . . . 102,893 150,255 110,528 Shares withheld to fund statutory minimum tax withholding . . . . . . . . . . . . (36,965) (57,298) (42,368)
Shares of common stock issued for performance share LTIAs . . . . . . . . . 65,928 92,957 68,160 Shares of common stock issued upon the exercise of stock options . . . . . — 1,787 4,011 Shares of common stock issued to non-employee directors for annual equity grants . . . . . . . . . . . . . . . . . . . . . . . . . . . . . . . . . . . . . . . . . . . . . . . . . 45,848 35,039 20,559 Shares of restricted common stock issued to employees . . . . . . . . . . . . . . 32,059 — —
Total shares of common stock issued . . . . . . . . . . . . . . . . . . . . . . . . . . . . . . . 143,835 129,783 92,730
The following table sets forth the compensation expense recognized for share-based payments (performance share LTIAs, stock options, non-employee director stock grants, restricted stock and other share-based payments) during the last three fiscal years and where that expense is reflected in our consolidated statements of operations (in thousands): Consolidated Statements of Operations Location Fiscal 2019 Fiscal 2018 Fiscal 2017 Compensation expense included in cost of goods sold . . . . . . . . . . . . . . . . . . . . . . . . . . . $ 307 $ 1,236 $ 1,203 Compensation expense included in selling, general and administrative expenses . . . . . 2,287 1,789 3,412
Total compensation expense for share-based payments . . . . . . . . . . . . . . . . . . . . . . . $ 2,594 $ 3,025 $ 4,615
During fiscal 2019, we extended the time period for two non-employee directors to exercise 48,727 vested options under existing option agreements following retirement, disability or death or any other separation from the board other than for cause from the existing 180 days and 90 days to the earlier of three years after the applicable separation date and the then current expiration date of the options. During fiscal 2019, we also extended the time period for 578,149 vested options and 31,384 unvested options held by three retired executive officers and one retiring executive officer from the existing 180 days to the earlier of three years after the applicable retirement date and the then current expiration date of the options. In connection with the option extensions, we recognized an additional $0.7 million of pre-tax share-based compensation expense in the second quarter of 2019, which is reflected in the table above.
B&G FOODS, INC. AND SUBSIDIARIES Notes to Consolidated Financial Statements (Continued)
December 28, 2019, December 29, 2018 and December 30, 2017
- 95 -
As of December 28, 2019, we currently do not have any unrecognized compensation expense related to performance share LTIAs, as threshold performance objectives were not attained for the 2017 to 2019 performance share LTIAs and are not expected to be attained for the 2018 to 2020 or the 2019 to 2021 performance share LTIAs.
As of December 28, 2019, there was $0.5 million of unrecognized compensation expense related to stock options, which is expected to be recognized during the upcoming fiscal year.
(16) Net Sales by Brand
The following table sets forth net sales by brand (in thousands): Fiscal 2019 Fiscal 2018 Fiscal 2017 Brand(1):
Green Giant - frozen . . . . . . . . . . . . . . . . . . . . . . . . . . . . . . . . . . . . . . . . . . . $ 363,240 $ 372,696 $ 330,004 Spices & Seasonings(2) . . . . . . . . . . . . . . . . . . . . . . . . . . . . . . . . . . . . . . . . . . 249,374 255,965 259,196 Ortega . . . . . . . . . . . . . . . . . . . . . . . . . . . . . . . . . . . . . . . . . . . . . . . . . . . . . . . 140,444 141,265 137,276 Green Giant - shelf stable(3) . . . . . . . . . . . . . . . . . . . . . . . . . . . . . . . . . . . . . . 124,706 107,476 120,541 Maple Grove Farms of Vermont . . . . . . . . . . . . . . . . . . . . . . . . . . . . . . . . . . 70,557 68,048 67,987 Back to Nature(4) . . . . . . . . . . . . . . . . . . . . . . . . . . . . . . . . . . . . . . . . . . . . . . . 60,947 69,704 20,283 Cream of Wheat . . . . . . . . . . . . . . . . . . . . . . . . . . . . . . . . . . . . . . . . . . . . . . . 59,893 62,520 60,833 Mrs. Dash . . . . . . . . . . . . . . . . . . . . . . . . . . . . . . . . . . . . . . . . . . . . . . . . . . . . 58,781 58,676 59,816 Clabber Girl(5) . . . . . . . . . . . . . . . . . . . . . . . . . . . . . . . . . . . . . . . . . . . . . . . . 53,638 — — Pirate Brands(6) . . . . . . . . . . . . . . . . . . . . . . . . . . . . . . . . . . . . . . . . . . . . . . . . — 74,853 87,705 All other brands . . . . . . . . . . . . . . . . . . . . . . . . . . . . . . . . . . . . . . . . . . . . . . . 478,834 489,561 502,746
Total . . . . . . . . . . . . . . . . . . . . . . . . . . . . . . . . . . . . . . . . . . . . . . . . . . . . . . . $ 1,660,414 $ 1,700,764 $ 1,646,387
(1) Table includes net sales for each of our brands whose fiscal 2019 or fiscal 2018 net sales equaled or exceeded 3% of our total fiscal 2019 or total fiscal 2018 net sales and for all other brands in the aggregate. Net sales for each brand includes branded net sales and, if applicable, any private label and foodservice net sales attributable to the brand.
(2) Includes net sales for multiple brands acquired as part of the spices & seasonings acquisition that we completed on November 21, 2016. Does not include net sales for Mrs. Dash and our other legacy spices & seasonings brands.
(3) Does not include net sales of the Le Sueur brand. Net sales of the Le Sueur brand are included below in “All other brands.” (4) We completed the Back to Nature acquisition on October 2, 2017. See Note 3, “Acquisitions and Divestitures.” (5) We completed the Clabber Girl acquisition on May 15, 2019. See Note 3, “Acquisitions and Divestitures.” (6) We completed the Pirate Brands sale on October 17, 2018. See Note 3, “Acquisitions and Divestitures.”
(17) Workforce Reduction and Retirement Expenses
Workforce Reduction Expenses. During fiscal 2019, we implemented a reduction in workforce. During fiscal 2019, we recorded charges of $2.4 million related to the workforce reduction. Substantially all of these charges have resulted or will result in cash payments, $1.5 million of which were made during fiscal 2019 and approximately $0.9 million of which will continue through 2020.
Retirement Expenses. As previously disclosed, we entered into retirement agreements with two of our executive vice presidents during the first quarter of 2019. The retirement and other benefits payable under the agreements are included in the estimated charges set forth above.
There were no workforce reduction or retirement expenses during fiscal 2017 or 2018.
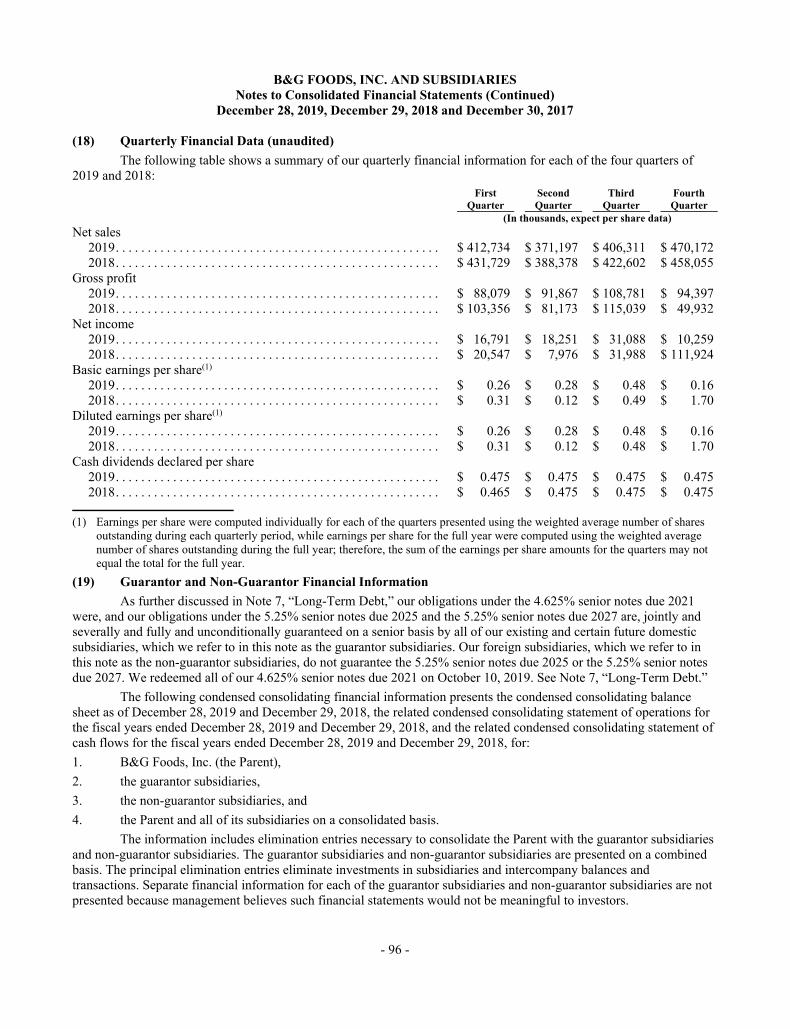
B&G FOODS, INC. AND SUBSIDIARIES Notes to Consolidated Financial Statements (Continued)
December 28, 2019, December 29, 2018 and December 30, 2017
- 96 -
(18) Quarterly Financial Data (unaudited) The following table shows a summary of our quarterly financial information for each of the four quarters of
2019 and 2018: First Second Third Fourth Quarter Quarter Quarter Quarter (In thousands, expect per share data) Net sales
2019 . . . . . . . . . . . . . . . . . . . . . . . . . . . . . . . . . . . . . . . . . . . . . . . . . . . $ 412,734 $ 371,197 $ 406,311 $ 470,172 2018 . . . . . . . . . . . . . . . . . . . . . . . . . . . . . . . . . . . . . . . . . . . . . . . . . . . $ 431,729 $ 388,378 $ 422,602 $ 458,055
Gross profit 2019 . . . . . . . . . . . . . . . . . . . . . . . . . . . . . . . . . . . . . . . . . . . . . . . . . . . $ 88,079 $ 91,867 $ 108,781 $ 94,397 2018 . . . . . . . . . . . . . . . . . . . . . . . . . . . . . . . . . . . . . . . . . . . . . . . . . . . $ 103,356 $ 81,173 $ 115,039 $ 49,932
Net income 2019 . . . . . . . . . . . . . . . . . . . . . . . . . . . . . . . . . . . . . . . . . . . . . . . . . . . $ 16,791 $ 18,251 $ 31,088 $ 10,259 2018 . . . . . . . . . . . . . . . . . . . . . . . . . . . . . . . . . . . . . . . . . . . . . . . . . . . $ 20,547 $ 7,976 $ 31,988 $ 111,924
Basic earnings per share(1) 2019 . . . . . . . . . . . . . . . . . . . . . . . . . . . . . . . . . . . . . . . . . . . . . . . . . . . $ 0.26 $ 0.28 $ 0.48 $ 0.16 2018 . . . . . . . . . . . . . . . . . . . . . . . . . . . . . . . . . . . . . . . . . . . . . . . . . . . $ 0.31 $ 0.12 $ 0.49 $ 1.70
Diluted earnings per share(1) 2019 . . . . . . . . . . . . . . . . . . . . . . . . . . . . . . . . . . . . . . . . . . . . . . . . . . . $ 0.26 $ 0.28 $ 0.48 $ 0.16 2018 . . . . . . . . . . . . . . . . . . . . . . . . . . . . . . . . . . . . . . . . . . . . . . . . . . . $ 0.31 $ 0.12 $ 0.48 $ 1.70
Cash dividends declared per share 2019 . . . . . . . . . . . . . . . . . . . . . . . . . . . . . . . . . . . . . . . . . . . . . . . . . . . $ 0.475 $ 0.475 $ 0.475 $ 0.475 2018 . . . . . . . . . . . . . . . . . . . . . . . . . . . . . . . . . . . . . . . . . . . . . . . . . . . $ 0.465 $ 0.475 $ 0.475 $ 0.475
(1) Earnings per share were computed individually for each of the quarters presented using the weighted average number of shares
outstanding during each quarterly period, while earnings per share for the full year were computed using the weighted average number of shares outstanding during the full year; therefore, the sum of the earnings per share amounts for the quarters may not equal the total for the full year.
(19) Guarantor and Non-Guarantor Financial Information As further discussed in Note 7, “Long-Term Debt,” our obligations under the 4.625% senior notes due 2021
were, and our obligations under the 5.25% senior notes due 2025 and the 5.25% senior notes due 2027 are, jointly and severally and fully and unconditionally guaranteed on a senior basis by all of our existing and certain future domestic subsidiaries, which we refer to in this note as the guarantor subsidiaries. Our foreign subsidiaries, which we refer to in this note as the non-guarantor subsidiaries, do not guarantee the 5.25% senior notes due 2025 or the 5.25% senior notes due 2027. We redeemed all of our 4.625% senior notes due 2021 on October 10, 2019. See Note 7, “Long-Term Debt.”
The following condensed consolidating financial information presents the condensed consolidating balance sheet as of December 28, 2019 and December 29, 2018, the related condensed consolidating statement of operations for the fiscal years ended December 28, 2019 and December 29, 2018, and the related condensed consolidating statement of cash flows for the fiscal years ended December 28, 2019 and December 29, 2018, for: 1. B&G Foods, Inc. (the Parent), 2. the guarantor subsidiaries, 3. the non-guarantor subsidiaries, and 4. the Parent and all of its subsidiaries on a consolidated basis.
The information includes elimination entries necessary to consolidate the Parent with the guarantor subsidiaries and non-guarantor subsidiaries. The guarantor subsidiaries and non-guarantor subsidiaries are presented on a combined basis. The principal elimination entries eliminate investments in subsidiaries and intercompany balances and transactions. Separate financial information for each of the guarantor subsidiaries and non-guarantor subsidiaries are not presented because management believes such financial statements would not be meaningful to investors.
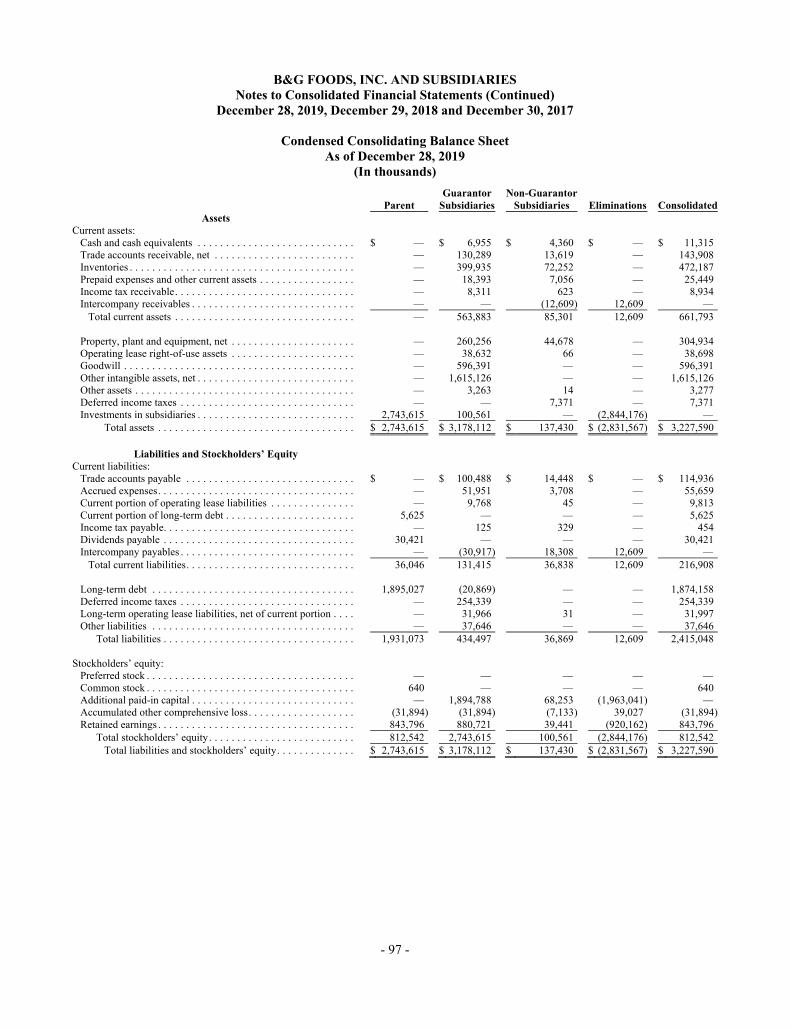
B&G FOODS, INC. AND SUBSIDIARIES Notes to Consolidated Financial Statements (Continued)
December 28, 2019, December 29, 2018 and December 30, 2017
- 97 -
Condensed Consolidating Balance Sheet As of December 28, 2019
(In thousands) Guarantor Non-Guarantor Parent Subsidiaries Subsidiaries Eliminations Consolidated
Assets Current assets:
Cash and cash equivalents . . . . . . . . . . . . . . . . . . . . . . . . . . . . $ — $ 6,955 $ 4,360 $ — $ 11,315 Trade accounts receivable, net . . . . . . . . . . . . . . . . . . . . . . . . . — 130,289 13,619 — 143,908 Inventories . . . . . . . . . . . . . . . . . . . . . . . . . . . . . . . . . . . . . . . . — 399,935 72,252 — 472,187 Prepaid expenses and other current assets . . . . . . . . . . . . . . . . . — 18,393 7,056 — 25,449 Income tax receivable . . . . . . . . . . . . . . . . . . . . . . . . . . . . . . . . — 8,311 623 — 8,934 Intercompany receivables . . . . . . . . . . . . . . . . . . . . . . . . . . . . . — — (12,609) 12,609 —
Total current assets . . . . . . . . . . . . . . . . . . . . . . . . . . . . . . . . — 563,883 85,301 12,609 661,793
Property, plant and equipment, net . . . . . . . . . . . . . . . . . . . . . . — 260,256 44,678 — 304,934 Operating lease right-of-use assets . . . . . . . . . . . . . . . . . . . . . . — 38,632 66 — 38,698 Goodwill . . . . . . . . . . . . . . . . . . . . . . . . . . . . . . . . . . . . . . . . . — 596,391 — — 596,391 Other intangible assets, net . . . . . . . . . . . . . . . . . . . . . . . . . . . . — 1,615,126 — — 1,615,126 Other assets . . . . . . . . . . . . . . . . . . . . . . . . . . . . . . . . . . . . . . . — 3,263 14 — 3,277 Deferred income taxes . . . . . . . . . . . . . . . . . . . . . . . . . . . . . . . — — 7,371 — 7,371 Investments in subsidiaries . . . . . . . . . . . . . . . . . . . . . . . . . . . . 2,743,615 100,561 — (2,844,176) —
Total assets . . . . . . . . . . . . . . . . . . . . . . . . . . . . . . . . . . . $ 2,743,615 $ 3,178,112 $ 137,430 $ (2,831,567) $ 3,227,590
Liabilities and Stockholders’ Equity Current liabilities:
Trade accounts payable . . . . . . . . . . . . . . . . . . . . . . . . . . . . . . $ — $ 100,488 $ 14,448 $ — $ 114,936 Accrued expenses . . . . . . . . . . . . . . . . . . . . . . . . . . . . . . . . . . . — 51,951 3,708 — 55,659 Current portion of operating lease liabilities . . . . . . . . . . . . . . . — 9,768 45 — 9,813 Current portion of long-term debt . . . . . . . . . . . . . . . . . . . . . . . 5,625 — — — 5,625 Income tax payable . . . . . . . . . . . . . . . . . . . . . . . . . . . . . . . . . . — 125 329 — 454 Dividends payable . . . . . . . . . . . . . . . . . . . . . . . . . . . . . . . . . . 30,421 — — — 30,421 Intercompany payables . . . . . . . . . . . . . . . . . . . . . . . . . . . . . . . — (30,917) 18,308 12,609 —
Total current liabilities . . . . . . . . . . . . . . . . . . . . . . . . . . . . . . 36,046 131,415 36,838 12,609 216,908
Long-term debt . . . . . . . . . . . . . . . . . . . . . . . . . . . . . . . . . . . . 1,895,027 (20,869) — — 1,874,158 Deferred income taxes . . . . . . . . . . . . . . . . . . . . . . . . . . . . . . . — 254,339 — — 254,339 Long-term operating lease liabilities, net of current portion . . . . — 31,966 31 — 31,997 Other liabilities . . . . . . . . . . . . . . . . . . . . . . . . . . . . . . . . . . . . — 37,646 — — 37,646
Total liabilities . . . . . . . . . . . . . . . . . . . . . . . . . . . . . . . . . . 1,931,073 434,497 36,869 12,609 2,415,048 Stockholders’ equity:
Preferred stock . . . . . . . . . . . . . . . . . . . . . . . . . . . . . . . . . . . . . — — — — — Common stock . . . . . . . . . . . . . . . . . . . . . . . . . . . . . . . . . . . . . 640 — — — 640 Additional paid-in capital . . . . . . . . . . . . . . . . . . . . . . . . . . . . . — 1,894,788 68,253 (1,963,041) — Accumulated other comprehensive loss . . . . . . . . . . . . . . . . . . . (31,894) (31,894) (7,133) 39,027 (31,894)Retained earnings . . . . . . . . . . . . . . . . . . . . . . . . . . . . . . . . . . . 843,796 880,721 39,441 (920,162) 843,796
Total stockholders’ equity . . . . . . . . . . . . . . . . . . . . . . . . . . 812,542 2,743,615 100,561 (2,844,176) 812,542 Total liabilities and stockholders’ equity . . . . . . . . . . . . . . $ 2,743,615 $ 3,178,112 $ 137,430 $ (2,831,567) $ 3,227,590
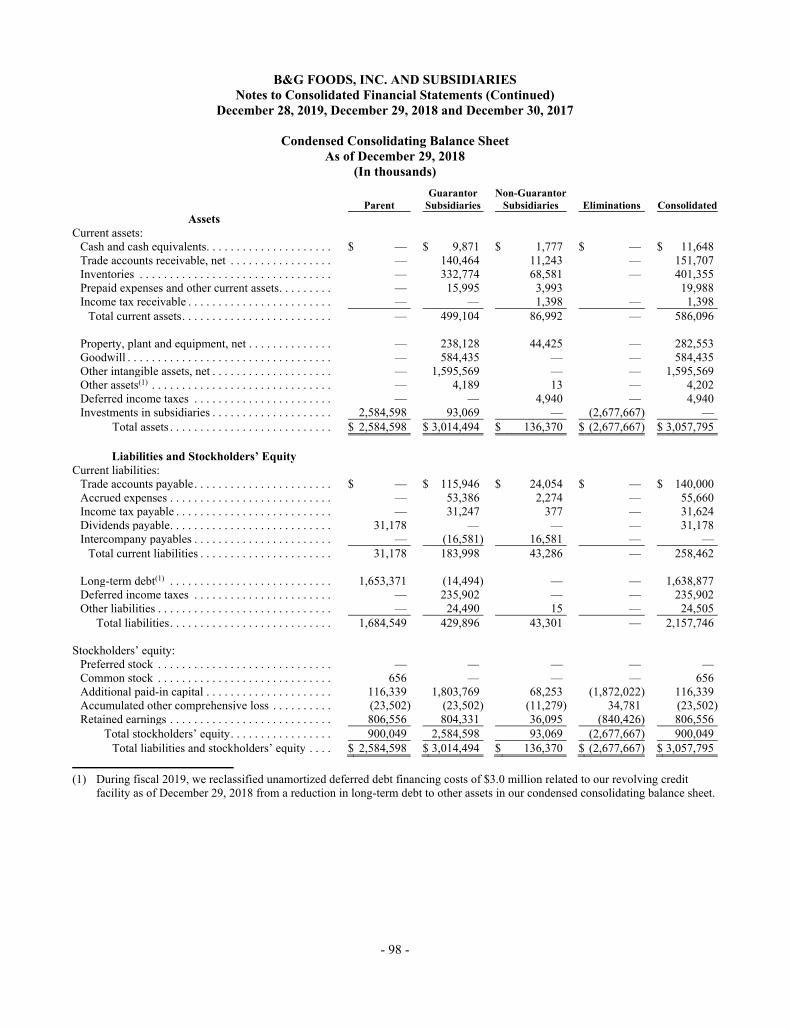
B&G FOODS, INC. AND SUBSIDIARIES Notes to Consolidated Financial Statements (Continued)
December 28, 2019, December 29, 2018 and December 30, 2017
- 98 -
Condensed Consolidating Balance Sheet As of December 29, 2018
(In thousands) Guarantor Non-Guarantor Parent Subsidiaries Subsidiaries Eliminations Consolidated
Assets Current assets:
Cash and cash equivalents . . . . . . . . . . . . . . . . . . . . . $ — $ 9,871 $ 1,777 $ — $ 11,648 Trade accounts receivable, net . . . . . . . . . . . . . . . . . — 140,464 11,243 — 151,707 Inventories . . . . . . . . . . . . . . . . . . . . . . . . . . . . . . . . — 332,774 68,581 — 401,355 Prepaid expenses and other current assets . . . . . . . . . — 15,995 3,993 19,988 Income tax receivable . . . . . . . . . . . . . . . . . . . . . . . . — — 1,398 — 1,398
Total current assets . . . . . . . . . . . . . . . . . . . . . . . . . — 499,104 86,992 — 586,096
Property, plant and equipment, net . . . . . . . . . . . . . . — 238,128 44,425 — 282,553 Goodwill . . . . . . . . . . . . . . . . . . . . . . . . . . . . . . . . . . — 584,435 — — 584,435 Other intangible assets, net . . . . . . . . . . . . . . . . . . . . — 1,595,569 — — 1,595,569 Other assets(1) . . . . . . . . . . . . . . . . . . . . . . . . . . . . . . — 4,189 13 — 4,202 Deferred income taxes . . . . . . . . . . . . . . . . . . . . . . . — — 4,940 — 4,940 Investments in subsidiaries . . . . . . . . . . . . . . . . . . . . 2,584,598 93,069 — (2,677,667) —
Total assets . . . . . . . . . . . . . . . . . . . . . . . . . . . $ 2,584,598 $ 3,014,494 $ 136,370 $ (2,677,667) $ 3,057,795
Liabilities and Stockholders’ Equity Current liabilities:
Trade accounts payable . . . . . . . . . . . . . . . . . . . . . . . $ — $ 115,946 $ 24,054 $ — $ 140,000 Accrued expenses . . . . . . . . . . . . . . . . . . . . . . . . . . . — 53,386 2,274 — 55,660 Income tax payable . . . . . . . . . . . . . . . . . . . . . . . . . . — 31,247 377 — 31,624 Dividends payable . . . . . . . . . . . . . . . . . . . . . . . . . . . 31,178 — — — 31,178 Intercompany payables . . . . . . . . . . . . . . . . . . . . . . . — (16,581) 16,581 — —
Total current liabilities . . . . . . . . . . . . . . . . . . . . . . 31,178 183,998 43,286 — 258,462
Long-term debt(1) . . . . . . . . . . . . . . . . . . . . . . . . . . . 1,653,371 (14,494) — — 1,638,877 Deferred income taxes . . . . . . . . . . . . . . . . . . . . . . . — 235,902 — — 235,902 Other liabilities . . . . . . . . . . . . . . . . . . . . . . . . . . . . . — 24,490 15 — 24,505
Total liabilities . . . . . . . . . . . . . . . . . . . . . . . . . . . 1,684,549 429,896 43,301 — 2,157,746 Stockholders’ equity:
Preferred stock . . . . . . . . . . . . . . . . . . . . . . . . . . . . . — — — — — Common stock . . . . . . . . . . . . . . . . . . . . . . . . . . . . . 656 — — — 656 Additional paid-in capital . . . . . . . . . . . . . . . . . . . . . 116,339 1,803,769 68,253 (1,872,022) 116,339 Accumulated other comprehensive loss . . . . . . . . . . (23,502) (23,502) (11,279) 34,781 (23,502)Retained earnings . . . . . . . . . . . . . . . . . . . . . . . . . . . 806,556 804,331 36,095 (840,426) 806,556
Total stockholders’ equity . . . . . . . . . . . . . . . . . 900,049 2,584,598 93,069 (2,677,667) 900,049 Total liabilities and stockholders’ equity . . . . $ 2,584,598 $ 3,014,494 $ 136,370 $ (2,677,667) $ 3,057,795
(1) During fiscal 2019, we reclassified unamortized deferred debt financing costs of $3.0 million related to our revolving credit
facility as of December 29, 2018 from a reduction in long-term debt to other assets in our condensed consolidating balance sheet.
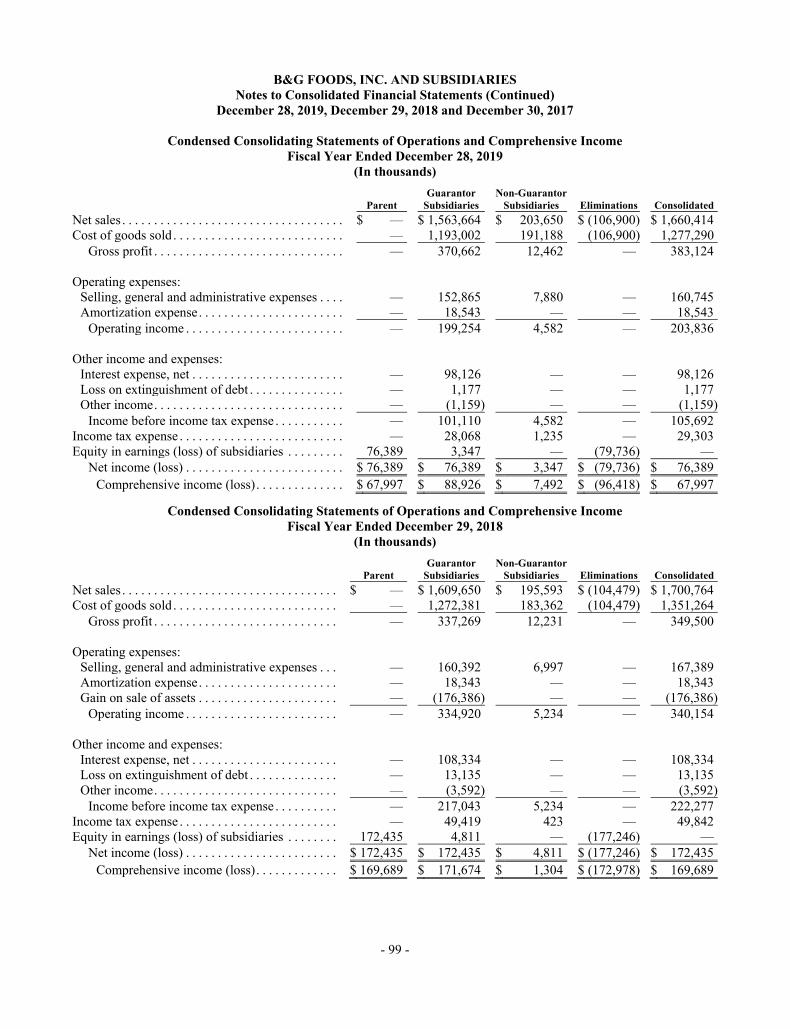
B&G FOODS, INC. AND SUBSIDIARIES Notes to Consolidated Financial Statements (Continued)
December 28, 2019, December 29, 2018 and December 30, 2017
- 99 -
Condensed Consolidating Statements of Operations and Comprehensive Income Fiscal Year Ended December 28, 2019
(In thousands) Guarantor Non-Guarantor Parent Subsidiaries Subsidiaries Eliminations Consolidated Net sales . . . . . . . . . . . . . . . . . . . . . . . . . . . . . . . . . . . $ — $ 1,563,664 $ 203,650 $ (106,900) $ 1,660,414 Cost of goods sold . . . . . . . . . . . . . . . . . . . . . . . . . . . — 1,193,002 191,188 (106,900) 1,277,290
Gross profit . . . . . . . . . . . . . . . . . . . . . . . . . . . . . . — 370,662 12,462 — 383,124 Operating expenses:
Selling, general and administrative expenses . . . . — 152,865 7,880 — 160,745 Amortization expense . . . . . . . . . . . . . . . . . . . . . . . — 18,543 — — 18,543
Operating income . . . . . . . . . . . . . . . . . . . . . . . . . — 199,254 4,582 — 203,836 Other income and expenses:
Interest expense, net . . . . . . . . . . . . . . . . . . . . . . . . — 98,126 — — 98,126 Loss on extinguishment of debt . . . . . . . . . . . . . . . — 1,177 — — 1,177 Other income . . . . . . . . . . . . . . . . . . . . . . . . . . . . . . — (1,159) — — (1,159)
Income before income tax expense . . . . . . . . . . . — 101,110 4,582 — 105,692 Income tax expense . . . . . . . . . . . . . . . . . . . . . . . . . . — 28,068 1,235 — 29,303 Equity in earnings (loss) of subsidiaries . . . . . . . . . 76,389 3,347 — (79,736) —
Net income (loss) . . . . . . . . . . . . . . . . . . . . . . . . . $ 76,389 $ 76,389 $ 3,347 $ (79,736) $ 76,389 Comprehensive income (loss) . . . . . . . . . . . . . . $ 67,997 $ 88,926 $ 7,492 $ (96,418) $ 67,997
Condensed Consolidating Statements of Operations and Comprehensive Income Fiscal Year Ended December 29, 2018
(In thousands) Guarantor Non-Guarantor Parent Subsidiaries Subsidiaries Eliminations Consolidated Net sales . . . . . . . . . . . . . . . . . . . . . . . . . . . . . . . . . . $ — $ 1,609,650 $ 195,593 $ (104,479) $ 1,700,764 Cost of goods sold . . . . . . . . . . . . . . . . . . . . . . . . . . — 1,272,381 183,362 (104,479) 1,351,264
Gross profit . . . . . . . . . . . . . . . . . . . . . . . . . . . . . — 337,269 12,231 — 349,500 Operating expenses:
Selling, general and administrative expenses . . . — 160,392 6,997 — 167,389 Amortization expense . . . . . . . . . . . . . . . . . . . . . . — 18,343 — — 18,343 Gain on sale of assets . . . . . . . . . . . . . . . . . . . . . . — (176,386) — — (176,386)
Operating income . . . . . . . . . . . . . . . . . . . . . . . . — 334,920 5,234 — 340,154 Other income and expenses:
Interest expense, net . . . . . . . . . . . . . . . . . . . . . . . — 108,334 — — 108,334 Loss on extinguishment of debt . . . . . . . . . . . . . . — 13,135 — — 13,135 Other income . . . . . . . . . . . . . . . . . . . . . . . . . . . . . — (3,592) — — (3,592)
Income before income tax expense . . . . . . . . . . — 217,043 5,234 — 222,277 Income tax expense . . . . . . . . . . . . . . . . . . . . . . . . . — 49,419 423 — 49,842 Equity in earnings (loss) of subsidiaries . . . . . . . . 172,435 4,811 — (177,246) —
Net income (loss) . . . . . . . . . . . . . . . . . . . . . . . . $ 172,435 $ 172,435 $ 4,811 $ (177,246) $ 172,435 Comprehensive income (loss) . . . . . . . . . . . . . $ 169,689 $ 171,674 $ 1,304 $ (172,978) $ 169,689

B&G FOODS, INC. AND SUBSIDIARIES Notes to Consolidated Financial Statements (Continued)
December 28, 2019, December 29, 2018 and December 30, 2017
- 100 -
Condensed Consolidating Statement of Cash Flows Fiscal Year Ended December 28, 2019
(In thousands) Guarantor Non-Guarantor Parent Subsidiaries Subsidiaries Eliminations Consolidated Net cash provided by operating activities . . . . . . . . . . . . . . . . . . . $ — $ 54,269 $ (7,765) $ — $ 46,504 Cash flows from investing activities:
Capital expenditures . . . . . . . . . . . . . . . . . . . . . . . . . . . . . . . . . . . — (38,134) (4,221) — (42,355)Proceeds from sale of assets . . . . . . . . . . . . . . . . . . . . . . . . . . . . . — — 46 — 46 Payments for acquisition of businesses, net of cash acquired . . . . . — (82,430) — — (82,430)
Net cash used in investing activities . . . . . . . . . . . . . . . . . . . . . . — (120,564) (4,175) — (124,739) Cash flows from financing activities:
Repayments of long-term debt . . . . . . . . . . . . . . . . . . . . . . . . . . . (700,000) — — — (700,000)
Proceeds from issuance of long-term debt . . . . . . . . . . . . . . . . . . .
1,000,000 — — — 1,000,000 Repayments of borrowings under revolving credit facility . . . . . . . (645,000) — — — (645,000)Borrowings under revolving credit facility . . . . . . . . . . . . . . . . . . 595,000 — — — 595,000 Proceeds from issuance of common stock, net . . . . . . . . . . . . . . . . — — — — — Dividends paid . . . . . . . . . . . . . . . . . . . . . . . . . . . . . . . . . . . . . . . (123,669) — — — (123,669)Payments for the repurchase of common stock, net . . . . . . . . . . . . (34,713) — — — (34,713)Payments of tax withholding on behalf of employees for net share settlement of share-based compensation . . . . . . . . . . . . . . . . — (905) — — (905)Payments of debt financing costs . . . . . . . . . . . . . . . . . . . . . . . . . — (13,000) — — (13,000)Intercompany transactions . . . . . . . . . . . . . . . . . . . . . . . . . . . . . . (91,618) 77,284 14,334 — —
Net cash provided by financing activities . . . . . . . . . . . . . . . . . . — 63,379 14,334 — 77,713 Effect of exchange rate fluctuations on cash and cash equivalents . — — 189 — 189 Net (decrease) increase in cash and cash equivalents . . . . . . . . . . . — (2,916) 2,583 — (333)Cash and cash equivalents at beginning of year . . . . . . . . . . . . . . . — 9,871 1,777 — 11,648 Cash and cash equivalents at end of year . . . . . . . . . . . . . . . . . . . . $ — $ 6,955 $ 4,360 $ — $ 11,315
Condensed Consolidating Statement of Cash Flows Fiscal Year Ended December 29, 2018
(In thousands) Guarantor Non-Guarantor Parent Subsidiaries Subsidiaries Eliminations Consolidated Net cash provided by operating activities . . . . . . . . . . . . . . . . . . . . . $ — $ 197,094 $ 12,362 $ — $ 209,456 Cash flows from investing activities:
Capital expenditures . . . . . . . . . . . . . . . . . . . . . . . . . . . . . . . . . . . . . — (34,503) (7,124) — (41,627)Proceeds from sale of assets . . . . . . . . . . . . . . . . . . . . . . . . . . . . . . . — 420,002 — — 420,002 Payments for acquisition of businesses, net of cash acquired . . . . . . . — (30,787) — — (30,787)
Net cash provided by (used in) investing activities . . . . . . . . . . . . . — 354,712 (7,124) — 347,588 Cash flows from financing activities:
Repayments of long-term debt . . . . . . . . . . . . . . . . . . . . . . . . . . . . . (650,110) — — — (650,110)Repayments of borrowings under revolving credit facility . . . . . . . . . (170,000) — — — (170,000)Borrowings under revolving credit facility . . . . . . . . . . . . . . . . . . . . 220,000 — — — 220,000 Proceeds from issuance of common stock, net . . . . . . . . . . . . . . . . . . 60 — — — 60 Dividends paid . . . . . . . . . . . . . . . . . . . . . . . . . . . . . . . . . . . . . . . . . (124,524) — — — (124,524)Payments for the repurchase of common stock, net . . . . . . . . . . . . . . (26,920) — — — (26,920)Payments of tax withholding on behalf of employees for net share settlement of share-based compensation . . . . . . . . . . . . . . . . . . . . . . — (1,833) — — (1,833)
Intercompany transactions . . . . . . . . . . . . . . . . . . . . . . . . . . . . . . . . 751,494 (744,918) (6,576) — — Net cash used in financing activities . . . . . . . . . . . . . . . . . . . . . . . . — (746,751) (6,576) — (753,327)
Effect of exchange rate fluctuations on cash and cash equivalents . . . . . — — 1,425 — 1,425 Net (decrease) increase in cash and cash equivalents . . . . . . . . . . . . . — (194,945) 87 — (194,858)Cash and cash equivalents at beginning of year . . . . . . . . . . . . . . . . . — 204,816 1,690 — 206,506 Cash and cash equivalents at end of year . . . . . . . . . . . . . . . . . . . . . . $ — $ 9,871 $ 1,777 $ — $ 11,648

B&G FOODS, INC. AND SUBSIDIARIES Notes to Consolidated Financial Statements (Continued)
December 28, 2019, December 29, 2018 and December 30, 2017
- 101 -
(20) Subsequent Event
Farmwise Acquisition. On February 19, 2020, we acquired Farmwise LLC, maker of Farmwise Veggie Fries®, Farmwise Veggie Tots® and Farmwise Veggie Rings®. We funded the acquisition with cash on hand.
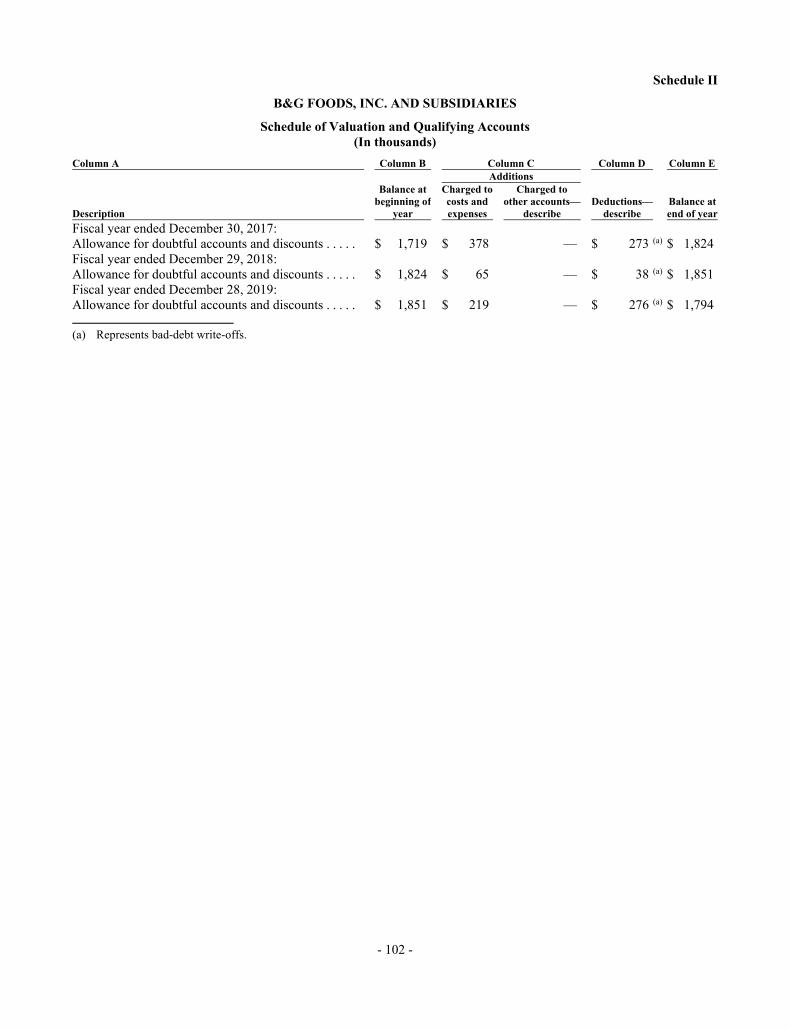
- 102 -
Schedule II
B&G FOODS, INC. AND SUBSIDIARIES
Schedule of Valuation and Qualifying Accounts (In thousands)
Column A Column B Column C Column D Column E Additions Balance at Charged to Charged to beginning of costs and other accounts— Deductions— Balance at Description year expenses describe describe end of yearFiscal year ended December 30, 2017: Allowance for doubtful accounts and discounts . . . . . $ 1,719 $ 378 — $ 273 (a) $ 1,824 Fiscal year ended December 29, 2018: Allowance for doubtful accounts and discounts . . . . . $ 1,824 $ 65 — $ 38 (a) $ 1,851 Fiscal year ended December 28, 2019: Allowance for doubtful accounts and discounts . . . . . $ 1,851 $ 219 — $ 276 (a) $ 1,794
(a) Represents bad-debt write-offs.
- 103 -
Item 9. Changes in and Disagreement with Accountants on Accounting and Financial Disclosure.
None.
Item 9A. Controls and Procedures.
Evaluation of Disclosure Controls and Procedures.
As required by Rule 13a-15(b) under the Securities Exchange Act of 1934, as amended, our management, including our chief executive officer and our chief financial officer, conducted an evaluation of the effectiveness of the design and operation of our disclosure controls and procedures as of the end of the period covered by this report. As defined in Rules 13a-15(e) and 15d-15(e) under the Exchange Act, disclosure controls and procedures are controls and other procedures that we use that are designed to ensure that information required to be disclosed by us in the reports we file or submit under the Exchange Act is recorded, processed, summarized and reported, within the time periods specified in the SEC’s rules and forms. Disclosure controls and procedures include, without limitation, controls and procedures designed to ensure that information required to be disclosed by us in the reports we file or submit under the Exchange Act is accumulated and communicated to our management, including our chief executive officer and our chief financial officer, as appropriate, to allow timely decisions regarding required disclosure.
Based on that evaluation, our chief executive officer and our chief financial officer concluded that our disclosure controls and procedures were effective as of the end of the period covered by this report.
Management’s Report on Internal Control over Financial Reporting.
Our management is responsible for establishing and maintaining adequate internal control over financial reporting, as such term is defined in Rules 13a-15(f) and 15d-15(f) under the Exchange Act. Our management, including our chief executive officer and our chief financial officer, conducted an evaluation of our internal control over financial reporting based on the framework in Internal Control—Integrated Framework (2013) issued by the Committee of Sponsoring Organizations of the Treadway Commission.
Based on our evaluation under the framework of Internal Control—Integrated Framework (2013), our management concluded that our internal control over financial reporting was effective at December 28, 2019. The effectiveness of our internal control over financial reporting as of December 28, 2019 was audited by KPMG LLP, an independent registered public accounting firm, as stated in their report which is included in Part II, Item 8, “Financial Statements and Supplementary Data” of this report.
Our internal control system is designed to provide reasonable assurance to our management and board of directors regarding the preparation and fair presentation of published consolidated financial statements in accordance with GAAP. All internal control systems, no matter how well designed, have inherent limitations. Therefore, even those systems determined to be effective can provide only reasonable assurance with respect to financial statement preparation and presentation and may not prevent or detect misstatements. Also, projections of any evaluation of effectiveness to future periods are subject to the risk that controls may become inadequate because of changes in conditions, or that the degree of compliance with the policies or procedures may deteriorate.
We completed the Clabber Girl acquisition on May 15, 2019 and we have excluded the Clabber Girl business from our evaluation of internal control over financial reporting as of December 28, 2019 because we acquired the business during 2019. The total assets and total net sales of the Clabber Girl business represent approximately 2.9% and 3.2%, respectively, of the related consolidated financial statement amounts as of and for fiscal 2019.
Changes in Internal Control over Financial Reporting.
As required by Rule 13a-15(d) under the Exchange Act, our management, including our chief executive officer and our chief financial officer, also conducted an evaluation of our internal control over financial reporting to determine whether any change in our internal control over financial reporting occurred during the last quarter of fiscal 2019 that has materially affected, or is reasonably likely to materially affect, our internal control over financial reporting. Based on that evaluation, our chief executive officer and our chief financial officer concluded that there has been no change in our internal control over financial reporting during the last quarter of fiscal 2019 that has materially affected, or is reasonably likely to materially affect, our internal control over financial reporting.
- 104 -
We transitioned the spices & seasonings business that we acquired in late 2016 to a new enterprise resource planning (ERP) system during the third quarter of 2017. Since then, we have been planning for and working on the transition of the remainder of our business to that new ERP system. Implementation, integration and transition efforts for the remainder of our business (other than our Mexican operations) continued during fiscal 2019 and was substantially completed during the second quarter of 2019. We plan to implement additional modules to the ERP system during fiscal 2020 and we plan to transition our Mexican operations to the new ERP system by the end of 2021. In connection with the implementation, integration and transition, and resulting business process changes, we continue to review and enhance the design and documentation of our internal control over financial reporting processes to maintain effective controls over our financial reporting following the completion of the implementation, integration and transition. To date, the implementation, integration and transition have not materially affected and, upon completion we do not expect the implementation, integration and transition to have any material effect on, our internal control over financial reporting.
Inherent Limitations on Effectiveness of Controls.
Our company’s management, including the chief executive officer and chief financial officer, does not expect that our disclosure controls or our internal control over financial reporting will prevent or detect all errors and all fraud. A control system, no matter how well designed and operated, can provide only reasonable, not absolute, assurance that the control system’s objectives will be met. The design of a control system must reflect the fact that there are resource constraints, and the benefits of controls must be considered relative to their costs. Further, because of the inherent limitations in all control systems, no evaluation of controls can provide absolute assurance that misstatements due to error or fraud will not occur or that all control issues and instances of fraud, if any, within our company have been detected. These inherent limitations include the realities that judgments in decision-making can be faulty and that breakdowns can occur because of simple error or mistake. Controls can also be circumvented by the individual acts of some persons, by collusion of two or more people, or by management override of the controls. The design of any system of controls is based in part on certain assumptions about the likelihood of future events, and there can be no assurance that any design will succeed in achieving its stated goals under all potential future conditions. Projections of any evaluation of controls effectiveness to future periods are subject to risks. Over time, controls may become inadequate because of changes in conditions or deterioration in the degree of compliance with policies or procedures.
Item 9B. Other Information.
None.
PART III
Item 10. Directors, Executive Officers and Corporate Governance.
With the exception of the information relating to our Code of Business Conduct and Ethics that is presented in Part I, Item 1 of this report under the heading “Available Information,” the information required by this Item will appear in the sections entitled “Corporate Governance,” “Proposal 1—Election of Directors,” “Our Management” and “Section 16(a) Beneficial Ownership Reporting Compliance” included in our definitive proxy statement to be filed on or before April 27, 2020, relating to the 2020 annual meeting of stockholders, which information is incorporated herein by reference.
Item 11. Executive Compensation.
The information required by this item will appear in the section entitled “Executive Compensation,” “Compensation Discussion and Analysis,” “Compensation Committee Interlocks and Insider Participation” and “Report of the Compensation Committee” included in our definitive proxy statement to be filed on or before April 27, 2020, relating to the 2020 annual meeting of stockholders, which information is incorporated herein by reference.
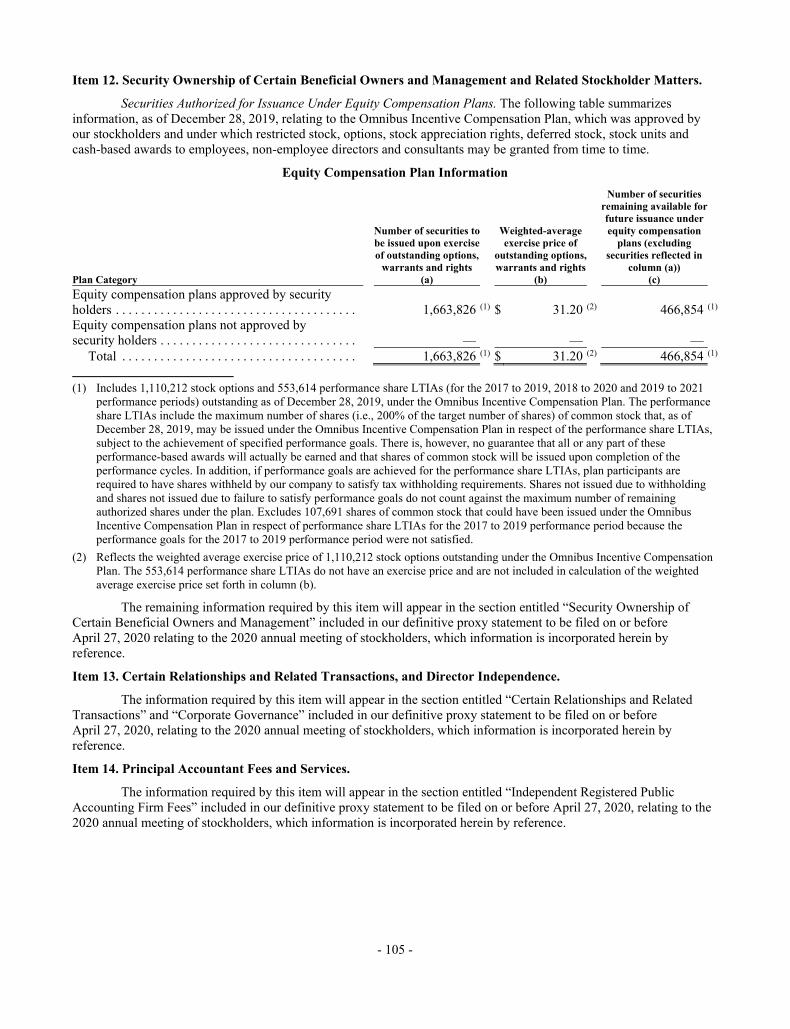
- 105 -
Item 12. Security Ownership of Certain Beneficial Owners and Management and Related Stockholder Matters.
Securities Authorized for Issuance Under Equity Compensation Plans. The following table summarizes information, as of December 28, 2019, relating to the Omnibus Incentive Compensation Plan, which was approved by our stockholders and under which restricted stock, options, stock appreciation rights, deferred stock, stock units and cash-based awards to employees, non-employee directors and consultants may be granted from time to time.
Equity Compensation Plan Information Number of securities
remaining available for future issuance under Number of securities to Weighted-average equity compensation be issued upon exercise exercise price of plans (excluding of outstanding options, outstanding options, securities reflected in warrants and rights warrants and rights column (a)) Plan Category (a) (b) (c) Equity compensation plans approved by security holders . . . . . . . . . . . . . . . . . . . . . . . . . . . . . . . . . . . . . . 1,663,826 (1) $ 31.20 (2) 466,854 (1)
Equity compensation plans not approved by security holders . . . . . . . . . . . . . . . . . . . . . . . . . . . . . . . — — —
Total . . . . . . . . . . . . . . . . . . . . . . . . . . . . . . . . . . . . . 1,663,826 (1) $ 31.20 (2) 466,854 (1)
(1) Includes 1,110,212 stock options and 553,614 performance share LTIAs (for the 2017 to 2019, 2018 to 2020 and 2019 to 2021
performance periods) outstanding as of December 28, 2019, under the Omnibus Incentive Compensation Plan. The performance share LTIAs include the maximum number of shares (i.e., 200% of the target number of shares) of common stock that, as of December 28, 2019, may be issued under the Omnibus Incentive Compensation Plan in respect of the performance share LTIAs, subject to the achievement of specified performance goals. There is, however, no guarantee that all or any part of these performance-based awards will actually be earned and that shares of common stock will be issued upon completion of the performance cycles. In addition, if performance goals are achieved for the performance share LTIAs, plan participants are required to have shares withheld by our company to satisfy tax withholding requirements. Shares not issued due to withholding and shares not issued due to failure to satisfy performance goals do not count against the maximum number of remaining authorized shares under the plan. Excludes 107,691 shares of common stock that could have been issued under the Omnibus Incentive Compensation Plan in respect of performance share LTIAs for the 2017 to 2019 performance period because the performance goals for the 2017 to 2019 performance period were not satisfied.
(2) Reflects the weighted average exercise price of 1,110,212 stock options outstanding under the Omnibus Incentive Compensation Plan. The 553,614 performance share LTIAs do not have an exercise price and are not included in calculation of the weighted average exercise price set forth in column (b).
The remaining information required by this item will appear in the section entitled “Security Ownership of Certain Beneficial Owners and Management” included in our definitive proxy statement to be filed on or before April 27, 2020 relating to the 2020 annual meeting of stockholders, which information is incorporated herein by reference.
Item 13. Certain Relationships and Related Transactions, and Director Independence.
The information required by this item will appear in the section entitled “Certain Relationships and Related Transactions” and “Corporate Governance” included in our definitive proxy statement to be filed on or before April 27, 2020, relating to the 2020 annual meeting of stockholders, which information is incorporated herein by reference.
Item 14. Principal Accountant Fees and Services.
The information required by this item will appear in the section entitled “Independent Registered Public Accounting Firm Fees” included in our definitive proxy statement to be filed on or before April 27, 2020, relating to the 2020 annual meeting of stockholders, which information is incorporated herein by reference.
- 106 -
PART IV
Item 15. Exhibits, Financial Statement Schedules.
(a) The following documents are filed as part of this report: (1) Consolidated Financial Statements: The following consolidated financial statements are included in Part II,
Item 8 of this report: Page
Reports of Independent Registered Public Accounting Firm . . . . . . . . . . . . . . . . . . . . . . . . . . . . . . 54 Consolidated Balance Sheets as of December 28, 2019 and December 29, 2018 . . . . . . . . . . . . . 58 Consolidated Statements of Operations for the fiscal years ended December 28, 2019,
December 29, 2018 and December 30, 2017 . . . . . . . . . . . . . . . . . . . . . . . . . . . . . . . . . . . . . . . . . . 59
Consolidated Statements of Comprehensive Income for the fiscal years ended
December 28, 2019, December 29, 2018 and December 30, 2017 . . . . . . . . . . . . . . . . . . . . . . . . . 60
Consolidated Statements of Changes in Stockholders’ Equity for the fiscal years ended
December 28, 2019, December 29, 2018 and December 30, 2017 . . . . . . . . . . . . . . . . . . . . . . . . 61
Consolidated Statements of Cash Flows for the fiscal years ended December 28, 2019,
December 29, 2018 and December 30, 2017 . . . . . . . . . . . . . . . . . . . . . . . . . . . . . . . . . . . . . . . . . . 62
Notes to Consolidated Financial Statements . . . . . . . . . . . . . . . . . . . . . . . . . . . . . . . . . . . . . . . . . . . 63
(2) Financial Statement Schedule. The following financial statement schedule is included
in Part II, Item 8 of this report: Schedule II—Schedule of Valuation and Qualifying Accounts . . . . . . . . . . . . . . . . . . . . . . . . . . . 102 (3) Exhibits
- 107 -
EXHIBIT NO. DESCRIPTION
2.1
Asset Purchase Agreement, dated as of September 12, 2018, among B&G Foods, Inc., B&G Foods North America, Inc., Pirate Brands, LLC and The Hershey Company (Filed as Exhibit 2.1 to B&G Foods’ Current Report on Form 8‑K filed on September 13, 2018, and incorporated by reference herein)
3.1
Second Amended and Restated Certificate of Incorporation of B&G Foods, Inc. (Filed as Exhibit 3.1 to B&G Foods’ Current Report on Form 8-K filed on August 13, 2010, and incorporated by reference herein)
3.2
Bylaws of B&G Foods, Inc., as amended and restated through February 27, 2013 (Filed as Exhibit 3.1 to B&G Foods’ Current Report on Form 8-K filed on March 4, 2013, and incorporated by reference herein)
4.1
Description of the securities of B&G Foods, Inc. registered pursuant to Section 12 of the Securities Exchange Act of 1934
4.2
Form of stock certificate for common stock (Filed as Exhibit 4.1 to B&G Foods’ Current Report on Form 8-K filed on August 13, 2010, and incorporated by reference herein)
4.3
Indenture, dated as of June 4, 2013, between B&G Foods, Inc. and The Bank of New York Mellon Trust Company, N.A., as trustee (Filed as Exhibit 4.1 to B&G Foods’ Current Report on Form 8-K filed on June 4, 2013, and incorporated by reference herein)
4.4
Seventh Supplemental Indenture, dated as of April 3, 2017, among B&G Foods, Inc., the Guarantors (as defined therein), and The Bank of New York Mellon Trust Company, N.A., as trustee, relating to the 5.25% senior notes due 2025 (Filed as Exhibit 4.1 to B&G Foods’ Current Report on Form 8-K filed April 4, 2017, and incorporated by reference herein)
4.5
Form of 5.25% Senior Note due 2025 (Filed as Exhibit 4.2 to B&G Foods’ Current Report on Form 8-K filed on September 26, 2019, and incorporated by reference herein)
4.6
Tenth Supplemental Indenture, dated as of September 26, 2019, among B&G Foods, Inc., the Guarantors (as defined therein), and The Bank of New York Mellon Trust Company, N.A., as trustee, relating to the 5.25% senior notes due 2027 (Filed as Exhibit 4.1 to B&G Foods’ Current Report on Form 8-K filed on September 26, 2019, and incorporated by reference herein)
4.7
Form of 5.25% Senior Note due 2027 (Filed as Exhibit 4.2 to B&G Foods’ Current Report on Form 8-K filed on September 26, 2019, and incorporated by reference herein)
10.1
Third Amendment to Credit Agreement, dated as of October 10, 2019, to the Amended and Restated Credit Agreement, dated as of October 2, 2015, among B&G Foods, Inc., as borrower, the several banks and other financial institutions or entities from time to time party thereto as lenders and Barclays Bank PLC, as administrative agent for the lenders and as collateral agent for the secured parties (Filed as Exhibit 10.1 to B&G Foods’ Current Report on Form 8-K filed on October 11, 2019, and incorporated by reference herein)
10.2
Guarantee and Collateral Agreement, dated as of June 5, 2014, among B&G Foods, Inc., B&G Foods North America, Inc., B&G Foods Snacks, Inc., BCCK Holdings, Inc., Bear Creek Country Kitchens, LLC, Pirate Brands, LLC, Rickland Orchards LLC, Specialty Brands of America, Inc. and William Underwood Company, and each other subsidiary of B&G Foods, Inc. party thereto from time to time, and Credit Suisse AG, as collateral agent (Filed as Exhibit 10.2 to B&G Foods’ Current Report on Form 8-K filed on June 9, 2014, and incorporated by reference herein)
10.3
Second Amended and Restated Employment Agreement, dated as of December 11, 2014, between Robert C. Cantwell and B&G Foods, Inc. (Filed as Exhibit 10.1 to B&G Foods’ Current Report on Form 8-K filed on December 16, 2014, and incorporated by reference herein)
- 108 -
EXHIBIT NO. DESCRIPTION
10.4
Amended and Restated Employment Agreement by and between Vanessa E. Maskal and B&G Foods, Inc., dated as of December 31, 2008 (Filed as Exhibit 10.3 to B&G Foods’ Current Report on Form 8-K filed on January 6, 2009, and incorporated by reference herein)
10.5
Amended and Restated Employment Agreement by and between Scott E. Lerner and B&G Foods, Inc., dated as of December 31, 2008 (Filed as Exhibit 10.5 to B&G Foods’ Current Report on Form 8-K filed on January 6, 2009, and incorporated by reference herein)
10.6
Employment Agreement, dated as of August 6, 2009, between William F. Herbes and B&G Foods, Inc. (Filed as Exhibit 10.2 to B&G Foods’ Current Report on Form 8-K filed on August 10, 2009, and incorporated by reference herein)
10.7
Employment Agreement, dated as of January 4, 2016, between Eric H. Hart and B&G Foods, Inc. (filed as Exhibit 10.9 to B&G Foods’ Annual Report on Form 10-K filed on March 2, 2016, and incorporated by reference herein)
10.8
Employment Agreement, dated as of August 1, 2017, between Bruce C. Wacha and B&G Foods, Inc. (Filed as Exhibit 10.1 to B&G Foods Quarterly Report on Form 10-Q filed on November 3, 2017, and incorporated herein by reference)
10.9
First Amendment to Employment Agreement, dated as of November 6, 2017, between, Bruce C. Wacha and B&G Foods, Inc. (Filed as Exhibit 10.1 to B&G Foods’ Current Report on Form 8-K filed on November 7, 2017, and incorporated by reference herein)
10.10
Offer Letter, dated as of October 19, 2018, between Michael D. Adasczik and B&G Foods, Inc. (Filed as Exhibit 10.1 to B&G Foods’ Current Report on Form 8‑K filed on November 16, 2018, and incorporated by reference herein)
10.11
B&G Foods, Inc. Omnibus Incentive Compensation Plan, as amended and restated on May 23, 2017 (filed as Annex A to B&G Foods’ Definitive Proxy Statement on Schedule 14A, filed on April 6, 2017, and incorporated by reference herein)
10.12
Amended and Restated Employment Agreement, dated as of February 26, 2019, between Kenneth G. Romanzi and B&G Foods, Inc. (Filed as Exhibit 10.1 to B&G Foods’ Current Report on Form 8-K filed on January 29, 2019 and amended on March 1, 2019, and incorporated by reference herein)
10.13
Consulting Agreement, dated as of February 26, 2019, between Robert C. Cantwell and B&G Foods, Inc. (Filed as Exhibit 10.2 to B&G Foods’ Current Report on Form 8-K filed on March 1, 2019, and incorporated by reference herein)
10.14
Retirement Agreement and General Release, dated as of February 26, 2019, between Vanessa E. Maskal and B&G Foods, Inc. (Filed as Exhibit 10.1 to B&G Foods’ Current Report on Form 8-K filed on March 1, 2019, and incorporated by reference herein)
10.15
Employment Agreement, dated as of February 26, 2019, between Erich A. Fritz and B&G Foods, Inc. (Filed as Exhibit 10.2 to B&G Foods’ Current Report on Form 8-K filed on March 1, 2019, and incorporated by reference herein)
10.16
Employment Agreement, dated as of February 26, 2019, between Jordan E. Greenberg and B&G Foods, Inc. (Filed as Exhibit 10.3 to B&G Foods’ Current Report on Form 8-K filed on March 1, 2019, and incorporated by reference herein)
- 109 -
EXHIBIT NO. DESCRIPTION
10.17
Employment Agreement, dated as of February 26, 2019, between Ellen M. Schum and B&G Foods, Inc. (Filed as Exhibit 10.4 to B&G Foods’ Current Report on Form 8-K filed on March 1, 2019, and incorporated by reference herein)
10.18
Retirement Agreement and General Release, dated as of March 18, 2019, between William F. Herbes and B&G Foods, Inc. (Filed as Exhibit 10.1 to B&G Foods’ Current Report on Form 8-K filed on March 18, 2019, and incorporated by reference herein)
10.19
Form of B&G Foods, Inc. Performance Share Long-Term Incentive Award Agreement (Filed as Exhibit 10.1 to B&G Foods’ Quarterly Report on Form 10-Q filed on May 7, 2019, and incorporated by reference herein)
10.20
Form of B&G Foods, Inc. Stock Option Agreement (Non-Qualified Stock Option) (Filed as Exhibit 10.2 to B&G Foods’ Quarterly Report on Form 10-Q filed on May 7, 2019, and incorporated by reference herein)
10.21
Form of B&G Foods, Inc. Non-Employee Director Stock Option Agreement (Non-Qualified Stock Option) (Filed as Exhibit 10.3 to B&G Foods’ Quarterly Report on Form 10-Q filed on May 7, 2019, and incorporated by reference herein)
10.22
Form of B&G Foods, Inc. Restricted Stock Award Agreement (Filed as Exhibit 10.4 to B&G Foods’ Quarterly Report on Form 10-Q filed on May 7, 2019, and incorporated by reference herein)
21.1 Subsidiaries of B&G Foods, Inc.
23.1 Consent of KPMG LLP
31.1
Certification pursuant to Rule 13a-14(a) or Rule 15d-14(a) of the Securities Exchange Act of 1934 of the Chief Executive Officer
31.2
Certification pursuant to Rule 13a-14(a) or Rule 15d-14(a) of the Securities Exchange Act of 1934 of the Chief Financial Officer
32.1
Certification pursuant to 18 U.S.C. Section 1350, as adopted pursuant to Section 906 of the Sarbanes-Oxley Act of 2002, of the Chief Executive Officer and Chief Financial Officer
101
The following financial information from B&G Foods’ Annual Report for the fiscal year ended December 28, 2019, formatted in iXBRL (Inline eXtensible Business Reporting Language): (i) the Consolidated Balance Sheets, (ii) the Consolidated Statements of Operations, (iii) the Consolidated Statements of Comprehensive Income, (iv) the Consolidated Statements of Changes in Stockholders’ Equity, (v) the Consolidated Statements of Cash Flows, (vi) Notes to Consolidated Financial Statements and (vii) document and entity information
104
The cover page from the Company’s Annual Report on Form 10-K for the year ended December 28, 2019, formatted in iXBRL and contained in Exhibit 101
Item 16. Form 10-K Summary.
None.
- 110 -
SIGNATURES
Pursuant to the requirements of the Securities Exchange Act of 1934, the registrant has duly caused this report to be signed on its behalf by the undersigned thereunto duly authorized.
Dated: February 26, 2020 B&G FOODS, INC. By: /s/ Bruce C. Wacha Bruce C. Wacha Executive Vice President of Finance and Chief Financial Officer (Principal Financial Officer and Duly Authorized
Officer)
Pursuant to the requirements of the Securities Exchange Act of 1934, this report has been signed below by the following persons on behalf of the registrant and in the capacities and on the dates indicated.
NAME TITLE DATE /s/ Stephen C. Sherrill Chairman of the Board of Directors February 26, 2020
Stephen C. Sherrill
/s/ Kenneth G. Romanzi President, Chief Executive Officer and Director February 26, 2020 Kenneth G. Romanzi (Principal Executive Officer)
/s/ Bruce C. Wacha Executive Vice President of Finance and Chief Financial Officer February 26, 2020 Bruce C. Wacha (Principal Financial Officer)
/s/ Michael D. Adasczik Vice President of Finance and Chief Accounting Officer February 26, 2020
Michael D. Adasczik (Principal Accounting Officer) /s/ DeAnn L. Brunts Director February 26, 2020
DeAnn L. Brunts /s/ Charles F. Marcy Director February 26, 2020
Charles F. Marcy
/s/ Robert D. Mills Director February 26, 2020 Robert D. Mills
/s/ Dennis M. Mullen Director February 26, 2020
Dennis M. Mullen /s/ Cheryl M. Palmer Director February 26, 2020
Cheryl M. Palmer
/s/ Alfred Poe Director February 26, 2020 Alfred Poe
/s/ David L. Wenner Director February 26, 2020
David L. Wenner
Exhibit 31.1
CERTIFICATION BY CHIEF EXECUTIVE OFFICER
I, Kenneth G. Romanzi, certify that:
1. I have reviewed this annual report on Form 10-K of B&G Foods, Inc.;
2. Based on my knowledge, this report does not contain any untrue statement of a material fact or omit to state a material fact necessary to make the statements made, in light of the circumstances under which such statements were made, not misleading with respect to the period covered by this report;
3. Based on my knowledge, the financial statements, and other financial information included in this report, fairly present in all material respects the financial condition, results of operations and cash flows of the registrant as of, and for, the periods presented in this report;
4. The registrant’s other certifying officer and I are responsible for establishing and maintaining disclosure controls and procedures (as defined in Exchange Act Rules 13a-15(e) and 15d-15(e)) and internal control over financial reporting (as defined in Exchange Act Rules 13a-15(f) and 15d-15(f)) for the registrant and have:
a) designed such disclosure controls and procedures, or caused such disclosure controls and procedures to be designed under our supervision, to ensure that material information relating to the registrant, including its consolidated subsidiaries, is made known to us by others within those entities, particularly during the period in which this report is being prepared;
b) designed such internal control over financial reporting, or caused such internal control over financial reporting to be designed under our supervision, to provide reasonable assurance regarding the reliability of financial reporting and the preparation of financial statements for external purposes in accordance with generally accepted accounting principles;
c) evaluated the effectiveness of the registrant’s disclosure controls and procedures and presented in this report our conclusions about the effectiveness of the disclosure controls and procedures, as of the end of the period covered by this report based on such evaluation; and
d) disclosed in this report any change in the registrant’s internal control over financial reporting that occurred during the registrant’s most recent fiscal quarter (the registrant’s fourth fiscal quarter in the case of an annual report) that has materially affected, or is reasonably likely to materially affect, the registrant’s internal control over financial reporting; and
5. The registrant’s other certifying officer and I have disclosed, based on our most recent evaluation of internal control over financial reporting, to the registrant’s auditors and the audit committee of the registrant’s board of directors (or persons performing the equivalent functions):
a) all significant deficiencies and material weaknesses in the design or operation of internal control over financial reporting which are reasonably likely to adversely affect the registrant’s ability to record, process, summarize and report financial information; and
b) any fraud, whether or not material, that involves management or other employees who have a significant role in the registrant’s internal control over financial reporting.
Date: February 26, 2020
/s/ KENNETH G. ROMANZI Kenneth G. Romanzi Chief Executive Officer

Exhibit 31.2
CERTIFICATION BY CHIEF FINANCIAL OFFICER
I, Bruce C. Wacha, certify that:
1. I have reviewed this annual report on Form 10-K of B&G Foods, Inc.;
2. Based on my knowledge, this report does not contain any untrue statement of a material fact or omit to state a material fact necessary to make the statements made, in light of the circumstances under which such statements were made, not misleading with respect to the period covered by this report;
3. Based on my knowledge, the financial statements, and other financial information included in this report, fairly present in all material respects the financial condition, results of operations and cash flows of the registrant as of, and for, the periods presented in this report;
4. The registrant’s other certifying officer and I are responsible for establishing and maintaining disclosure controls and procedures (as defined in Exchange Act Rules 13a-15(e) and 15d-15(e)) and internal control over financial reporting (as defined in Exchange Act Rules 13a-15(f) and 15d-15(f)) for the registrant and have:
a) designed such disclosure controls and procedures, or caused such disclosure controls and procedures to be designed under our supervision, to ensure that material information relating to the registrant, including its consolidated subsidiaries, is made known to us by others within those entities, particularly during the period in which this report is being prepared;
b) designed such internal control over financial reporting, or caused such internal control over financial reporting to be designed under our supervision, to provide reasonable assurance regarding the reliability of financial reporting and the preparation of financial statements for external purposes in accordance with generally accepted accounting principles;
c) evaluated the effectiveness of the registrant’s disclosure controls and procedures and presented in this report our conclusions about the effectiveness of the disclosure controls and procedures, as of the end of the period covered by this report based on such evaluation; and
d) disclosed in this report any change in the registrant’s internal control over financial reporting that occurred during the registrant’s most recent fiscal quarter (the registrant’s fourth fiscal quarter in the case of an annual report) that has materially affected, or is reasonably likely to materially affect, the registrant’s internal control over financial reporting; and
5. The registrant’s other certifying officer and I have disclosed, based on our most recent evaluation of internal control over financial reporting, to the registrant’s auditors and the audit committee of the registrant’s board of directors (or persons performing the equivalent functions):
a) all significant deficiencies and material weaknesses in the design or operation of internal control over financial reporting which are reasonably likely to adversely affect the registrant’s ability to record, process, summarize and report financial information; and
b) any fraud, whether or not material, that involves management or other employees who have a significant role in the registrant’s internal control over financial reporting.
Date: February 26, 2020
/s/ BRUCE C. WACHA Bruce C. Wacha Chief Financial Officer
Exhibit 32.1
CERTIFICATION PURSUANT TO 18 U.S.C. SECTION 1350,
AS ADOPTED PURSUANT TO SECTION 906 OF THE SARBANES-OXLEY ACT OF 2002
In connection with the Annual Report of B&G Foods, Inc. (the “Company”) on Form 10-K for the period ended December 28, 2019 as filed with the Securities and Exchange Commission on the date hereof (the “Report”), I, Kenneth G. Romanzi, Chief Executive Officer of the Company and I, Bruce C. Wacha, Chief Financial Officer of the Company, certify, pursuant to 18 U.S.C. §1350, as adopted pursuant to §906 of the Sarbanes-Oxley Act of 2002, that to my knowledge:
(1) The Report fully complies with the requirements of Section 13(a) or 15(d) of the Securities Exchange Act of 1934; and
(2) The information contained in the Report fairly presents, in all material respects, the financial condition and results of operations of the Company.
/s/ KENNETH G. ROMANZI Kenneth G. Romanzi Chief Executive Officer February 26, 2020 /s/ BRUCE C. WACHA Bruce C. Wacha Chief Financial Officer February 26, 2020 A signed original of this written statement required by Section 906 has been provided to the Company and will be retained by the Company and furnished to the Securities and Exchange Commission or its staff upon request.

(This page has been left blank intentionally.)
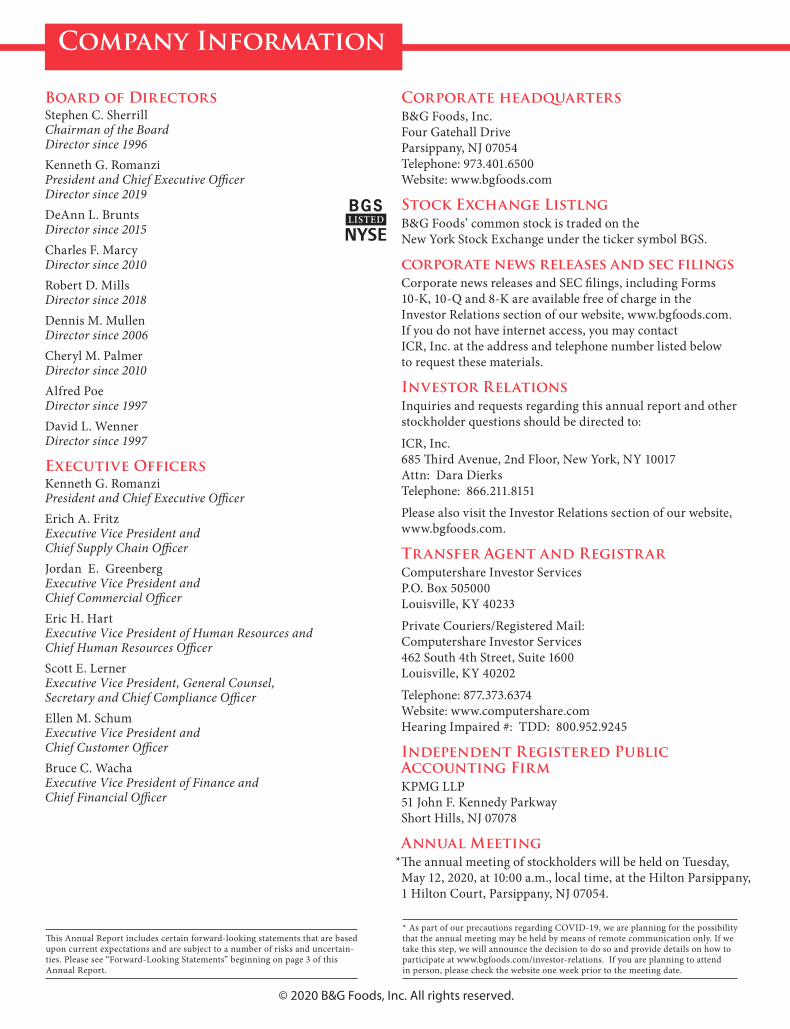
© 2020 B&G Foods, Inc. All rights reserved.
�is Annual Report includes certain forward-looking statements that are basedupon current expectations and are subject to a number of risks and uncertain-ties. Please see “Forward-Looking Statements” beginning on page 3 of this Annual Report.
* As part of our precautions regarding COVID-19, we are planning for the possibilitythat the annual meeting may be held by means of remote communication only. If wetake this step, we will announce the decision to do so and provide details on how toparticipate at www.bgfoods.com/investor-relations. If you are planning to attendin person, please check the website one week prior to the meeting date.
Company Information
Board of DirectorsStephen C. SherrillChairman of the BoardDirector since 1996Kenneth G. RomanziPresident and Chief Executive O�cerDirector since 2019DeAnn L. BruntsDirector since 2015Charles F. MarcyDirector since 2010Robert D. MillsDirector since 2018Dennis M. MullenDirector since 2006Cheryl M. PalmerDirector since 2010Alfred PoeDirector since 1997David L. WennerDirector since 1997
Executive OfficersKenneth G. RomanziPresident and Chief Executive O�cerErich A. FritzExecutive Vice President and Chief Supply Chain O�cerJordan E. GreenbergExecutive Vice President and Chief Commercial O�cerEric H. HartExecutive Vice President of Human Resources andChief Human Resources O�cerScott E. LernerExecutive Vice President, General Counsel, Secretary and Chief Compliance O�cerEllen M. SchumExecutive Vice President and Chief Customer O�cerBruce C. WachaExecutive Vice President of Finance andChief Financial O�cer
Corporate headquartersB&G Foods, Inc.Four Gatehall DriveParsippany, NJ 07054Telephone: 973.401.6500Website: www.bgfoods.com
Stock Exchange ListlngB&G Foods’ common stock is traded on theNew York Stock Exchange under the ticker symbol BGS.
corporate news releases and sec filingsCorporate news releases and SEC �lings, including Forms 10-K, 10-Q and 8-K are available free of charge in theInvestor Relations section of our website, www.bgfoods.com. If you do not have internet access, you may contactICR, Inc. at the address and telephone number listed below to request these materials.
Investor RelationsInquiries and requests regarding this annual report and other stockholder questions should be directed to:
ICR, Inc.685 �ird Avenue, 2nd Floor, New York, NY 10017 Attn: Dara Dierks Telephone: 866.211.8151
Please also visit the Investor Relations section of our website, www.bgfoods.com.
Transfer Agent and RegistrarComputershare Investor ServicesP.O. Box 505000Louisville, KY 40233
Private Couriers/Registered Mail: Computershare Investor Services 462 South 4th Street, Suite 1600Louisville, KY 40202
Telephone: 877.373.6374Website: www.computershare.com Hearing Impaired #: TDD: 800.952.9245
Independent Registered Public Accounting FirmKPMG LLP51 John F. Kennedy Parkway Short Hills, NJ 07078
Annual Meeting�e annual meeting of stockholders will be held on Tuesday,May 12, 2020, at 10:00 a.m., local time, at the Hilton Parsippany,1 Hilton Court, Parsippany, NJ 07054.
*
Adjusted EBITDA is a “non-GAAP (Generally Accepted Accounting Principles) financial measure.” Please see the discussion within the footnotes to Item 6, “Selected Financial Data” in the following Annual Report for a more detailed discussion of adjusted EBITDA and a reconciliation of adjusted EBITDA with the most directly comparable GAAP measures for fiscal 2019, 2018, 2017, 2016 and 2015, along with the components of adjusted EBITDA.
*
FISCAL YEAR 2019 2018 2017 2016 2015
(Dollars in millions)
Net Sales $ 1,660.4 $ 1,700.8 $ 1,646.4 $ 1,372.3 $ 958.9 Net Income $76.4 $ 172.4 $ 217.5 $ 109.4 $ 69.1 Adjusted EBITDA* $302.5 $ 314.2 $ 333.2 $ 322.0 $ 217.8
15 16 17 18 19
$ 30
2.5
$ 31
4.2
$ 21
7.8
$ 33
3.2
$ 32
2.0
15 16 17 18 19
$ 76
.4
$ 17
2.4
$ 69
.1
$ 21
7.5
$ 10
9.4
15 16 17 18 19
$ 1,
660.
4
$ 1,
700.
8
$ 95
8.9
$ 1,
646.
4
$ 1,
372.
3
Net Sales Net Income Adjusted EBITDA*
Financial Highlights
2944_Cover.indd 22944_Cover.indd 2 3/25/20 6:22 PM3/25/20 6:22 PM

™
™
2944_Cover.indd 12944_Cover.indd 1 3/25/20 2:46 PM3/25/20 2:46 PM