Embed Size (px)
Citation preview

Submitted 9 May 2017Accepted 19 June 2017Published 10 July 2017
Corresponding authorBenjamin J. Tully, [email protected]
Academic editorNikos Kyrpides
Additional Information andDeclarations can be found onpage 12
DOI 10.7717/peerj.3558
Copyright2017 Tully et al.
Distributed underCreative Commons CC-BY 4.0
OPEN ACCESS
290 metagenome-assembled genomesfrom the Mediterranean Sea: a resourcefor marine microbiologyBenjamin J. Tully1, Rohan Sachdeva2, Elaina D. Graham2 andJohn F. Heidelberg1,2
1Center for Dark Energy Biosphere Investigations, University of Southern California, Los Angeles, CA, USA2Department of Biological Sciences, University of Southern California, Los Angeles, CA,United States of America
ABSTRACTThe Tara Oceans Expedition has provided large, publicly-accessible microbial metage-nomic datasets from a circumnavigation of the globe. Utilizing several size fractionsfrom the samples originating in the Mediterranean Sea, we have used current assemblyand binning techniques to reconstruct 290 putative draft metagenome-assembledbacterial and archaeal genomes, with an estimated completion of ≥50%, and anadditional 2,786 bins, with estimated completion of 0–50%. We have submitted ourresults, including initial taxonomic and phylogenetic assignments, for the putative draftgenomes to open-access repositories for the scientific community to use in ongoingresearch.
Subjects Bioinformatics, Marine Biology, MicrobiologyKeywords Metagenomics, Metagenome-assembled genomes, Mediterranean sea, Bacteria,Archaea, Tara oceans
INTRODUCTIONMicroorganisms are a major constituent of the biology within the world’s oceansand act as important linchpins in all major global biogeochemical cycles (Falkowski,Fenchel & DeLong, 2008). Marine microbiology is among the disciplines at the forefrontin understanding how microorganisms respond to and impact local and large-scaleenvironments. An estimated 1029 Bacteria and Archaea (Whitman, Coleman &Wiebe,1998) reside in the oceans and represent an immense amount of poorly constrained, andever evolving genetic diversity.
The Tara Oceans Expedition (2003–2010) was a major endeavor to add to the body ofknowledge collected during previous global ocean surveys to sample the genetic potentialof microorganisms (Karsenti et al., 2011). To accomplish this goal, Tara Oceans sampledplanktonic organisms (viruses to fish larvae) at two major depths, the surface ocean andthe mesopelagic. The amount of data collected was expansive and included 35,000 samplesfrom 210 ecosystems (Karsenti et al., 2011). The Tara Oceans Expedition generated andpublically released 7.2 Tbp of metagenomic data from 243 ocean samples from throughoutthe global ocean, specifically targeting the smallest members of the ocean biosphere, theviruses, Bacteria and Archaea, and picoeukaryotes (Sunagawa et al., 2015). Initial work
How to cite this article Tully et al. (2017), 290 metagenome-assembled genomes from the Mediterranean Sea: a resource for marine mi-crobiology. PeerJ 5:e3558; DOI 10.7717/peerj.3558
007GirusProt
009GirusProt
018Bact
023BactProt
025Bact
030BactProt
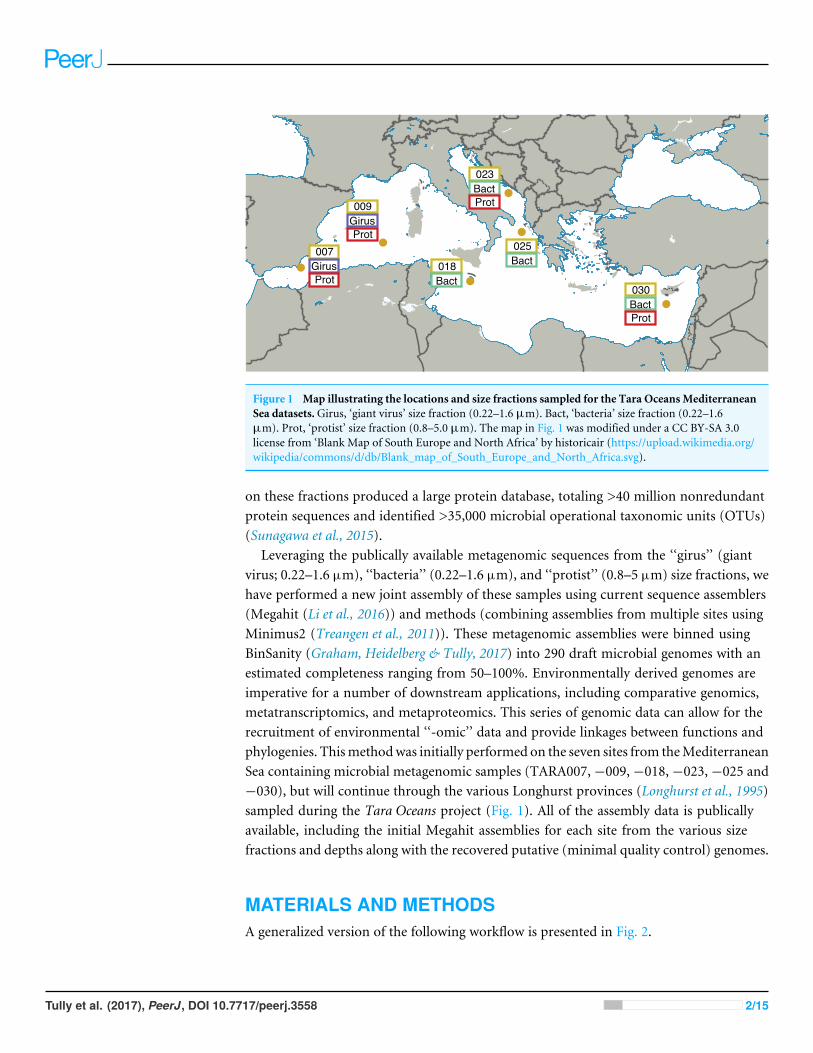
Figure 1 Map illustrating the locations and size fractions sampled for the Tara Oceans MediterraneanSea datasets.Girus, ‘giant virus’ size fraction (0.22–1.6 µm). Bact, ‘bacteria’ size fraction (0.22–1.6µm). Prot, ‘protist’ size fraction (0.8–5.0 µm). The map in Fig. 1 was modified under a CC BY-SA 3.0license from ‘Blank Map of South Europe and North Africa’ by historicair (https://upload.wikimedia.org/wikipedia/commons/d/db/Blank_map_of_South_Europe_and_North_Africa.svg).
on these fractions produced a large protein database, totaling >40 million nonredundantprotein sequences and identified >35,000 microbial operational taxonomic units (OTUs)(Sunagawa et al., 2015).
Leveraging the publically available metagenomic sequences from the ‘‘girus’’ (giantvirus; 0.22–1.6 µm), ‘‘bacteria’’ (0.22–1.6 µm), and ‘‘protist’’ (0.8–5 µm) size fractions, wehave performed a new joint assembly of these samples using current sequence assemblers(Megahit (Li et al., 2016)) and methods (combining assemblies from multiple sites usingMinimus2 (Treangen et al., 2011)). These metagenomic assemblies were binned usingBinSanity (Graham, Heidelberg & Tully, 2017) into 290 draft microbial genomes with anestimated completeness ranging from 50–100%. Environmentally derived genomes areimperative for a number of downstream applications, including comparative genomics,metatranscriptomics, and metaproteomics. This series of genomic data can allow for therecruitment of environmental ‘‘-omic’’ data and provide linkages between functions andphylogenies. Thismethodwas initially performed on the seven sites from theMediterraneanSea containing microbial metagenomic samples (TARA007,−009,−018,−023,−025 and−030), but will continue through the various Longhurst provinces (Longhurst et al., 1995)sampled during the Tara Oceans project (Fig. 1). All of the assembly data is publicallyavailable, including the initial Megahit assemblies for each site from the various sizefractions and depths along with the recovered putative (minimal quality control) genomes.
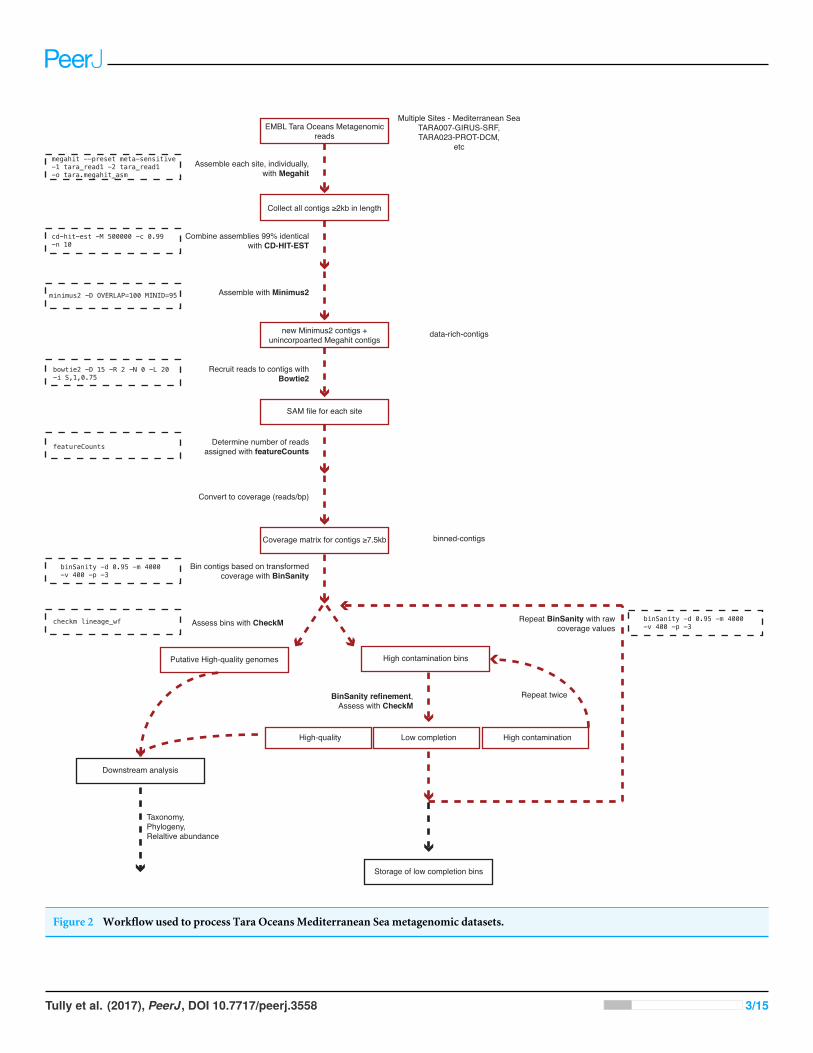
MATERIALS AND METHODSA generalized version of the following workflow is presented in Fig. 2.
Tully et al. (2017), PeerJ, DOI 10.7717/peerj.3558 2/15
EMBL Tara Oceans Metagenomic reads
Multiple Sites - Mediterranean SeaTARA007-GIRUS-SRF,TARA023-PROT-DCM,
etc
Assemble each site, individually, with Megahit
Collect all contigs ≥2kb in length
Combine assemblies 99% identical with CD-HIT-EST
Assemble with Minimus2
new Minimus2 contigs + unincorpoarted Megahit contigs
data-rich-contigs
Recruit reads to contigs with Bowtie2
SAM file for each site
Determine number of reads assigned with featureCounts
Convert to coverage (reads/bp)
Coverage matrix for contigs ≥7.5kb binned-contigs
Taxonomy,Phylogeny,Relaltive abundance
Putative High-quality genomes
Assess bins with CheckM
High contamination bins
BinSanity refinement,Assess with CheckM
High contamination Low completionHigh-quality
Repeat twice
Repeat BinSanity with raw coverage values
Downstream analysis
Storage of low completion bins
megahit --preset meta-sensitive-1 tara_read1 -2 tara_read1 -o tara.megahit_asm
cd-hit-est -M 500000 -c 0.99 -n 10
minimus2 -D OVERLAP=100 MINID=95
bowtie2 -D 15 -R 2 -N 0 -L 20 -i S,1,0.75
featureCounts
checkm lineage_wf
Bin contigs based on transformed coverage with BinSanity
binSanity -d 0.95 -m 4000 -v 400 -p -3
binSanity -d 0.95 -m 4000 -v 400 -p -3
Figure 2 Workflow used to process Tara Oceans Mediterranean Sea metagenomic datasets.
Tully et al. (2017), PeerJ, DOI 10.7717/peerj.3558 3/15
Sequence retrieval and assemblyAll sequences for the reverse and forward reads from each sampled site and depth within theMediterranean Sea were accessed from European Molecular Biology Laboratory-EuropeanBioinformatics Institute (EMBL-EBI) utilizing their FTP service (Table 1). Paired-end readsfrom different filter sizes from each site and depth (e.g., TARA0007, girus filter fraction,sampled at the deep chlorophyll maximum) were assembled using Megahit (Li et al.,2016) (v1.0.3; parameters: -preset, meta-sensitive). To keep consistent with TARA samplenomenclature, ‘‘bacteria’’ or ‘‘BACT’’ will be used to encompass the size fraction 0.22–1.6µm. Megahit assemblies ≥2 kb in length from all samples were pooled and combinedbased on ≥99% semi-global identity using CD-HIT-EST (Fu et al., 2012) (v4.6; -c 0.99) inorder to reduce the number of redundant contigs for the downstream assembly step. Thereduced set of contiguous DNA fragments (contigs) was then cross-assembled based on aminimum of 100 bp overlaps with 95% nucleotide identity using Minimus2 (Treangen etal., 2011) (AMOS v3.1.0; parameters: -D OVERLAP = 100 MINID = 95). This assemblymethod is available on Protocols.io at https://dx.doi.org/10.17504/protocols.io.hfqb3mw.
Metagenome-assembled genomesDue to memory limitations during the binning step, contigs ≥7.5 kb in length generatedduring the two-step assembly process (includes Minimus2 contigs and unincorporatedMegahit contigs) were used to recruit sequence reads from each of the Tara samples usingBowtie2 (Langmead & Salzberg, 2012) (v4.1.2; default parameters). Read counts for eachcontig were determined using featureCounts (Liao, Smyth & Shi, 2014) (v1.5.0; defaultparameters). Coverage was determined for all contigs by dividing the number of recruitedreads by the length of the contig (reads/bp). Due to the low coverage nature of the samples,in order to effectively delineate between contig coverage patterns, the coverage values weretransformed by multiplying by five (determined through manual tuning). Transformedcoverage values were then utilized to cluster contigs into bins utilizing BinSanity (Graham,Heidelberg & Tully, 2017) based on a preference value of −3 to be run for a maximum of4,000 iterations with completion if convergence is achieved for 400 consecutive iterationsand a damping value of 0.9 (parameters: -p -3, -m 4,000, -v 400, -d 0.9). Bins were assessedfor the presence of putative microbial genomes using the lineage workflow in CheckM(Parks et al., 2015) (v1.0.3; parameters: lineage_wf). Bins were split in to three categories:(1) putative draft genomes (≥50% complete and ≤10% cumulative redundancy (%contamination—(% contamination ×% strain heterogeneity ÷ 100))); (2) draft genomeswith high contamination (≥50% complete and ≥10% cumulative redundancy); and (3)low completion bins (<50% complete).
The high contamination bins containing approximately two genomes, three genomes,or≥4 genomes used BinSanity (Binsanity; -m 2000, -v 200, -d 0.9) with variable preferencevalues (-p) of −1,000, −500, and −100, respectively. The resulting bins were added toone of the three categories: putative draft genomes, high contamination bins, and lowcompletion bins. The high contamination bins were processed for a third time with theBinsanity-refine utilizing a preference of −100 (-p −100). These bins were given finalassignments as either putative draft genomes or low completion bins.
Tully et al. (2017), PeerJ, DOI 10.7717/peerj.3558 4/15

Table 1 Statistics for Megahit contigs, recruitment to data-rich-contigs, and relative abundance of draft genome results for each sample.
TARAsamplesite
Sizefraction(Girus,Bacteria,or Protist)
Depth(SurfaceorDCMa)
No. of reads No. ofinitialMegahitassembly
N50c (bp;initial Megahitassembly)
LongestinitialMegahitassembly (bp)
Recruitment(% data-rich-contigs)
Relativeabundancec ofdraft genomes(%)
Relativeabundancec
of ten mostabundantgenomes (% )
TARA007 Girus DCM 178,519,830 1,318,470 828 220,754 72.84 14.64 6.35TARA007 Girus Surface 221,166,612 1,308,847 861 211,946 81.74 14.83 6.12TARA007 Protist DCM 744,458,992 4,667,618 654 188,635 19.45 8.60 3.18TARA007 Protist Surface 265,432,098 2,590,120 564 18,444 25.58 1.57 0.61TARA009 Girus DCM 416,553,274 2,796,841 831 1,643,839 69.48 14.16 6.32TARA009 Girus Surface 489,617,426 1,787,467 929 1,142,851 68.85 12.29 4.76TARA009 Protist DCM 329,036,110 1,938,636 613 95,724 22.07 13.35 4.20TARA009 Protist Surface 370,813,078 1,700,350 588 292,050 22.53 15.97 6.17TARA018 Bacteria DCM 408,021,182 2,520,645 840 1,573,060 76.22 11.49 3.18TARA018 Bacteria Surface 414,976,308 2,604,031 816 2,086,508 75.80 11.03 3.02TARA023 Bacteria DCM 147,400,552 1,273,576 830 213,456 76.08 13.29 4.09TARA023 Bacteria Surface 149,566,010 1,237,617 825 134,179 75.98 13.82 4.01TARA023 Protist DCM 508,610,652 2,707,801 734 336,689 28.23 25.07 7.83TARA023 Protist Surface 397,044,232 2,246,571 593 397,140 23.00 25.16 10.31TARA025 Bacteria DCM 386,627,816 2,516,865 806 388,546 69.77 14.55 5.35TARA025 Bacteria Surface 457,560,422 2,326,838 857 330,773 75.57 10.99 3.18TARA030 Bacteria DCM 346,837,034 1,968,945 1,097 508,775 80.16 10.31 2.57TARA030 Bacteria Surface 478,785,582 1,639,697 1,194 204,976 77.70 7.26 2.64TARA030 Protist DCM 426,896,616 1,620,343 616 478,892 15.12 17.83 5.13TARA030 Protist Surface 430,029,974 1,838,588 628 287,782 22.36 17.60 6.73
Notes.aDCM—deep chlorophyll maximum.bN50—length of DNA sequence above which 50% of the total is contained.cRelative abundance—determined using the reads recruited data-rich-contigs.
Tullyetal.(2017),PeerJ,D
OI10.7717/peerj.3558
5/15

Any contigs not assigned to putative draft genomes were assessed using BinSanityusing raw coverage values. Two additional rounds of refinement were performed withthe first round of refinement using preference values based on the estimated number ofcontaminating genomes (as above) and the second round using a set preference of −10(-p −10). Following this binning phase, contigs were assigned to draft genome bins (e.g.,Tara Mediterranean genome 1, referred to as TMED1, etc.), low completion bins with atleast five contigs (0–50% complete; TMEDlc1, etc. lc, low completion), or were not placedin a bin (Supplemental Informations S1 and S2).
Taxonomic and phylogenetic assignment of draft genomesThe bins representing the draft genomes were assessed for taxonomy and phylogenyusing multiple methods to provide a quick reference for selecting genomes of interest.Taxonomy was assigned using the putative placement provided via CheckM during thepplacer (Matsen, Kodner & Armbrust, 2010) step of the analysis to the lowest taxonomicplacement (parameters: tree_qa -o 2). This step was also performed for all low completionbins.
Two separate attempts weremade to assign the draft genomes a phylogenetic assignment.Draft genomes were searched for the presence of the full-length 16S rRNA gene sequenceusing RNAmmer (Lagesen et al., 2007) (v1.2; parameters: -S bac -m ssu). All full-lengthsequences were aligned to the SILVA SSU reference database (Ref123) using the SINAweb portal aligner (Pruesse, Peplies & Glöckner, 2012) (https://www.arb-silva.de/aligner/).These alignments were loaded in to ARB (Ludwig et al., 2004) (v6.0.3), manually assessed,and added to the non-redundant 16S rRNA gene database (SSURef123 NR99) using ARBParsimony (Quick) tool (parameters: default). A selection of the nearest neighbors to theTara genome sequences were selected and used to construct a 16S rRNA phylogenetic tree.Genome-identified 16S rRNA sequences and SILVA reference sequences were aligned usingthe SINA web portal aligner (Supplemental Information 4). An approximately-maximum-likelihood tree with Shimodaira–Hasegawa local support values (Shimodaira & Hasegawa,1999) was constructed using FastTree (Price, Dehal & Arkin, 2010) using the generalizedtime reversible and discrete gamma models (Yang) (v2.1.3; parameters: -nt -gtr -gamma;Fig. 3; Supplemental Information 5).
Draft genomes were assessed for the presence of the 16 ribosomal markers genes usedin Hug et al. (2016). Putative CDSs were determined using Prodigal (v2.6.3; parameters:-m -p meta) and were searched using HMMs for each marker using HMMER (Finn,Clements & Eddy, 2011) with matches based on an e-value cutoff of 1× 10⁻³ (v3.1b2;parameters: hmmsearch -E 1E −10). If a genome had multiple copies of any single markergene, neither was considered, and only genomes with ≥8 markers were used to construct aphylogenetic tree. Markers identified from the draft genomes were combined with markersfrom 6,080 reference genomes accessed from NCBI GenBank (Supplemental Information6) that represent the major bacterial phylogenetic groups. Each marker gene was alignedusing MUSCLE (Edgar, 2004) (parameters: -maxiters 8) and automatically trimmed usingtrimAL (Capella-Gutiérrez, Silla-Martínez & Gabaldón, 2009) (v1.2rev59; parameters:-automated1). Automated trimming results were manually curated in Geneious (Kearse
Tully et al. (2017), PeerJ, DOI 10.7717/peerj.3558 6/15

AACY020525321KF234354
TMED105 FJ973596HQ692020
JQ426667JQ428103
FJ152887GQ263758
KJ754664JQ800731
JN177656
TMED32 FQ032830
GT235095
EF573122EF573486
EF572020 M58792
HM161878
DQ660388ET570843
KJ754636EF061974
KC000876
TMED39 ET283511
ET934238
HM127539
KJ094286
GT451479
FN435254GQ349699
JQ347420
KC000359
AM279204
AM279161
AM279197
AB476256
FQ032816
FR683798
KC682604
JX015701
EF016485
JN986299
JX016051
JX016221
JX015984
JX016122
JX016284
JQ515083
TMED114
JQ515046
EF574855
EF575268GT230412
TMED123
ET703390HM129619
ET703446
ET803717
ET801285ET703392
ET802089
ET801225
ET703418 FJ612256ET800535
FJ820442
JN119209
KF596556ET801403
ET801251
FN433355
AACY020259437
TMED14
ET799463
ET801426
ET802220 E
T802019ET799413
FJ628310
KJ465940
GQ850555
GQ111893
ET592353
EF471579
EF471577
TMED115
KC000309
AY948357
AY948359
GQ340303 G
Q390232
CT926479
AB355058
KF427966CT918341
ET104254
HQ672089 E
T491735
FJ626884
TMED270
GQ350624
ET802868
EF573463
ET805394 GT061506
AF382139
KJ589766
KJ480297
CAOS01000004
KF500027
JN166345
GQ348788
HQ673908
JN166319
KJ589921
ET795217
EF572850ET802816
EF574581
TMED154
JF747624
KC836759
JQ844338
JQ844337
HE817802
JQ844348
APGO01000272
AQPC01000005
KF286195
KP005026
TMED15
JN532725
HQ674351
HQ673510 ET919817
DQ071098 TMED231
EF574227
GT940759
KF786951
JX530444
HQ674443
KF786935
AB698042
GT305807
AF418950
GT940767
EF575009 TMED24
FJ516780
KC896682
JN487393FJ205243
AM997823
AM997703
JX227042
FJ205240
AY627529
JN515584
JN535993
JN536125
JN531871
JN523715
JN537880
JN517084
FJ416101
ET373
999
FJ6268
86
JX5042
95 JN177
961
DQ396
110
ET2363
63
DQ372
846
EF5731
03 TMED1
38
JN8743
28
FN8222
05
JX5249
93
GQ4528
82
KF78644
1GT3
62997
HQ15393
2
ET249952
DQ396077
ET048667
ET919760 TMED
10
HM798666
DQ396265
HQ673330
GT362996
KC631451
ET491341GQ246416
JN672626 GT363004 HM445938
HQ163355AF468236
JN441968
TMED11JN452804
JN428149EF589351EF589352HQ845500ANOH01000401FJ624355HQ153836DQ351810GT119490EF591885GQ346796FN822131
TMED283JQ579975ET236306AB694399
FJ873319FN822207
JF748734
ET617890DQ811902KC682754GQ348014
TMED53
KF786393GT119223
TMED181
JX016834
GT180185
JN493226
HQ671908
JN832946AY534087GQ337221
AY907820TMED230TMED70
AF406538
HQ242356ET799242
KC872852
ET802629
AACY020068177
JN443694
CAGM02001594HQ672119
TMED76
AB331889
AB331890
KF799062
KF786824
KF786937
KF786948
GT567992
JN986504TMED18
GQ349915
FJ545502
TMED218
HQ673145
HQ672489
JX529012
DQ396079
JX525642
GQ346535
HQ163262
GQ348836
CP003730
AB294932
HG004192
KF756255
KF756202KC
122613
KP214628ET695219
ET695218
HF968439H
Q672108
AM747382
FJ744842JQ269287
FR683981
EF506945GCIB01034586
JX945378
TMED67
ET802747HQ671966
GQ348022
ET686594AACY020222384
AY907765
EF573230
TMED58
GQ350073
JX016791EF646119JX526223
TMED88
FJ999600
JPID01000014
FJ873264
FJ999595
EF409832
KJ742377
GQ339576
APMI01014340
X15435
APJO
01001223
HQ418451
FJ744961
FJ745099
FJ744890
FX532111FX534292
FX533220
FX527310
GT941026
HQ672230
TMED66
GT940773
TMED32
TMED32
GQ222227
FJ612269
TMED223
ATZY01000070
HQ163711
HQ729995
ET805003
EF573580
KJ589710
TMED144
AACY020553637HQ673270
AB193918
HQ673196
KJ589871
KJ589945
KP005036
GT940987
TMED190
HQ674365
KJ589913
HQ721336
TMED6
HQ163771HQ673421
FJ825999
JN245720
HQ692000
JN433154
JN448080
KC873417
TMED27
DQ395844
KM200021
FJ203515
JN470252
JN447496
GT369888
HQ154002
GT369924
KC682829
AB981835AB
476180
AB981859
AY102327
AY102
325AY820
744AY820
749AY820
751
HQ132
385KP142
352GQ157
433KP1423
20EF2054
44
AGWX01
000001
TMED4
JQ8555
19KC6776
15FJ802297
FJ745150ET80
2577JQ753183
JN591805
JN166133HM057812AF406
520
TMED25
FJ615110
HQ673657
HQ673159
JN166296GT567970FJ154966AACY02044
3294GQ348045HQ672036TMED23HQ242253ET799766HQ672203
0.1
Planctomycetes
Firmicutes
Chloroflexi
Verrucomicrobia
Gammaproteobacteria
Chloroplast
Deltaproteobacteria
Marinimicrobia
Mitochondria
Alphaproteobacteria
Bacteroidetes
DeltaproteobacteriaActinobacteria
Figure 3 FastTree approximate maximum-likelihood phylogenetic tree constructed with 37 and 40616S rRNA genes from putative draft genomes and references, respectively. Sequence alignment is avail-able in Supplemental Information 4. Phylogenetic tree with Shimodaira–Hasegawa local support values asavailable in Newick format in Supplemental Information 5.
et al., 2012) (Supplemental Information 7). Final alignments were concatenated and usedto construct an approximately-maximum-likelihood tree using the LG (Le & Gascuel,2008) and Gamma models with Shimodaira–Hasegawa local support values with FastTree(v2.1.10; parameters: -lg -gamma; Fig. 4; Supplemental Information 8). A separate tree wasconstructed using the same concatenated alignments and tree-building parameters for the210 draft genomes, without the reference genomes (Fig. 4).
Tully et al. (2017), PeerJ, DOI 10.7717/peerj.3558 7/15

TMED279TMED141TMED103TMED252
TMED99
TMED248
TMED132
TMED255
TMED192
TMED164
TMED129
TMED97
TMED230
TMED70
TMED185
TMED169
TMED155
TMED19
TMED90
TMED66
TMED187
TMED20
TMED205
TMED223
TMED115
TMED98
TMED210
TMED244
TMED189
TMED224
TMED77
TMED130
TMED15
TMED53
TMED9
TMED151
TMED24
TMED11
TMED10
TMED138
TMED76
TMED18
TMED86
TMED137
TMED158
TMED71
TMED56
TMED175
TMED44
TMED60
TMED40
TMED149
TMED73 T
MED67
TMED102
TMED266
TMED6
TMED198
TMED274
TMED46
TMED217
TMED80
TMED108
TMED144
TMED105
TMED214
TMED152
TMED32
TMED39
TMED114
TMED45
TMED209
TMED16
TMED135
TMED84
TMED123
TMED113
TMED191
TMED14
TMED121
TMED212
TMED42
TMED120
TMED48
TMED68
TMED179
TMED147
TMED208
TMED116
TMED220
TMED206
TMED96
TMED23
8
TMED81
TMED204
TMED12
TMED145
TMED58
TMED126
TMED88
TMED281
TMED218
TMED22TMED82TMED156TMED41TMED100TMED139TMED107TMED260TMED47TMED49TMED148TMED122TMED21TMED157TMED79TMED33TMED59TMED91TMED243
TMED30TMED92TMED34TMED50
TMED182
TMED95TMED133
TMED180
TMED119
TMED69
TMED282
TMED61
TMED257
TMED78
TMED36
TMED159
TMED222
TMED219
TMED112
TMED236
TMED186
TMED225
TMED234
TMED226
TMED278
TMED242
TMED237
TMED259
TMED258
TMED142
TMED166
TMED196
TMED203
TMED197
TMED263
TMED128T
MED153
TMED253
TMED286
TMED272
TMED165
TMED202
TMED64
TMED106
TMED239
TMED273
TMED118
TMED275
TMED195
TMED65
TMED13
TMED109
TMED93
TMED62
TMED194
TMED63
TMED8
TMED26
TMED37
TMED55
TMED52
TMED213
TMED176
TMED245
TMED199
TMED54
TMED27
TMED2
TMED87
TMED271TM
ED3
TMED38
TMED111TM
ED5TM
ED31TME
D17TMED4TME
D74TMED28TMED25TMED
227TMED168
TMED94
TMED162TMED143
TMED83TMED29TMED85
Euryarchaeota
Cyanobacteria
Actinobacteria
Alphaproteobacteria
Deltaproteobacteria
PlanctomycetesVerrucomicrobia
NC10
Kiritimatiellaeota
Bacteroidetes
Betaproteobacteria
Pelagibacteraceae
Gammaproteobacteria
Figure 4 Cladogram of a FastTree approximate maximum-likelihood phylogenetic tree constructedusing 16 syntenic, single-copy marker genes for 210 draft genomes. Support for internal nodes were de-termined based on the Shimodaira–Hasegawa test (white ≥0.500, gray ≥0.750, black ≥0.950). Sequencealignment for the draft genomes and the reference genomes used for phylogenetic assignment is availablein Supplemental Information 7. Phylogenetic tree of the draft genomes and the reference genomes usedfor phylogenetic assignment is available in Newick format in Supplemental Information 8.
Relative abundance of draft genomesTo set-up a baseline that could approximate the ‘‘microbial’’ community (Bacteria, Archaeaand viruses) present in the variousTarametagenomes,which included filter sizes specificallytargeting both protists and giruses, reads were recruited against all contigs generated fromthe Minimus2 and Megahit assemblies ≥2 kb using Bowtie2 (default parameters). Thecontigs <2 kb in length likely constitute low abundance bacteria and archaea, bacteria andarchaea with high degrees of repeats resulting in poor assembly, fragmented picoeukaryoticgenomes, and problematic read sequences (low quality, sequencing artefacts, etc.) andwere not included in further analysis. All relative abundance measures are relative to thenumber of reads recruited to the assemblies ≥2 kb. Read counts were determined usingfeatureCounts (as above). Length-normalized relative abundance values were determinedfor each draft genome for each sample:
Readsbp per genome∑ Readsbp all genomes
×
∑Recruited reads to genomes∑
Recruited reads to all contigs(≥2 kb)×100.
Tully et al. (2017), PeerJ, DOI 10.7717/peerj.3558 8/15

Table 2 Assembly statistics at various steps during processing.
Contig grouping No. of contigs N50a Total sequence(bp)
Megahit assemblies 200–499 bp 24,999,285 n.d. 9,293,098,676Megahit assemblies 500–1,999 bp 16,103,221 n.d. 13,382,057,993Megahit assemblies ≥2 kb 1,517,360 4,658 6,691,877,664Megahit assemblies ≥2 kb (post-CD-HIT-EST) 1,126,975 4,520 4,894,479,496Minimus2 contigs 158,414 15,394 1,727,079,865Minimus2+ unincorporated Megahit contigs ≥2 kb (data-rich-contigs) 660,937 5,466 3,612,405,904Minimus2+ unincorporated Megahit contigs ≥7.5 kb (binned-contigs) 95,506 20,556 1,725,063,313
Notes.aN50—length of DNA sequence above which 50% of the total is contained.
RESULTSAssemblyThe initialMegahit assembly was performed on the publicly available reads forTara stations007, 009, 018, 023, 025, 030. Starting with 147–744 million reads per sample, the Megahitassembly process generated 1.2–4.6 million contigs with a mean N 50 and longest contig of785 bp and 537 kb, respectively (Table 1). In general, the contigs generated from the Tarasamples targeting the protist size fraction (0.8–5 µm) had a shorter N 50 value than thebacteria size fractions (mean: 554 bp vs 892 bp, respectively). Contigs from the Megahitassembly process were pooled and separated by length. Of the 42.6million contigs generatedduring the first assembly, 1.5 million were≥2 kb in length (Table 2). Several attempts weremade to assemble the shorter contigs, but publicly available overlap-consensus assemblers(Newbler (454 Life Sciences), cap3 (Huang & Madan, 1999), and MIRA (Chevreux et al.,2004)) failed on multiple attempts. Processing the ≥2 kb contigs from all of the samplesthrough CD-HIT-EST reduced the total to 1.1 million contigs. This group of contigs wassubjected to the secondary assembly through Minimus2, generating 158,414 new contigs(all ≥2 kb). The secondary contigs were combined with the Megahit contigs that were notassembled by Minimus2. This provided a contig dataset consisting of 660,937 contigs, all≥2 kb in length (Table 2; further referred to as data-rich-contigs).
BinningThe set of data-rich-contigs was used to recruit the metagenomic reads from each sampleusing Bowtie2. The data-rich-contigs recruited 15–81% of the reads depending on thesample. In general, the protist size fraction recruited substantially fewer reads than thegirus and bacteria size fractions (mean: 19.8% vs 75.0%, respectively) (Table 1). For theprotist size fraction, the ‘‘missing’’ data for these recruitments likely results from the poorassembly of more complex and larger eukaryotic genomes. The fraction of the reads thatdo not recruit in the girus and bacterial size fraction samples could be accounted for by thelarge number of low quality assemblies (200–500 bp) and reads that could not be assembleddue to low abundance or high complexity (Table 2).
Unsupervised binning was performed using both transformed and raw coverage valuesfor a subset of 95,506 contigs from the data-rich-contigs that were ≥7.5 kb (referred to
Tully et al. (2017), PeerJ, DOI 10.7717/peerj.3558 9/15

further as binned-contigs). Binning using the transformed coverage data generated 237putative draft genomes containing 15,032 contigs (Supplemental Information 1). Contigsnot in putative genomes were re-binned based on raw coverage values, generating 53additional putative draft genomes encompassing 3,348 contigs. In total, 290 putative draftgenomes were generated with 50–100% completion (mean: 69%) with a mean length andnumber of putative CDS of 1.7Mbp and 1,699, respectively (Supplemental Information 1).In analyzing the quality of generated draft genomes, 31 of the genomes had a contaminationvalue >10%, but had a cumulative redundancy value <10%, while an additional 12genomes had a cumulative redundancy value >10% (genomes highlighted in SupplementalInformation 1). For instances where the predicted strain heterogeneity is high and sharplyreduces the calculated cumulative redundancy value (e.g., TMED1), downstream analysisof these genomes may offer opportunities to examine within strain variation, if the genecontent varies between contigs, or identify duplicate contigs that can be removed to rectifycontamination issues. For instances where cumulative redundancy values remain high(e.g., TMED20 or TMED106), downstream analysis utilizing composition signatures, forexample within Anvi’o (Eren et al., 2015), should be able to identify problematic contigsand reduce the overall contamination reported for the genome.
All other contigs were grouped into bins with at least five contigs, but with estimatedcompletion of 0–50% (2,786 low completion bins; 74,358 contigs; SupplementalInformation 2) or did not bin (2,732 contigs). Nearly a quarter of the 2,786 low completionbins (24.7%) have an estimated completion of 0%. These bins may be good candidates forexploring small double-stranded viral genomes or episomal genetic elements.
Taxonomy, phylogeny, & potential organisms of interestThe 290 putative draft genomes had a taxonomy assigned to it via CheckM during thepplacer step. All of the genomes, except for 20, had an assignment to at least the Phylumlevel, and 83% of the genomes had an assignment to at least the Class level (SupplementalInformation 1).
Phylogenetic information was determined for as many genomes as possible. Genomeswere assessed for the presence of full-length 16S rRNA genes. In total, 37 16S rRNA geneswere detected in 35 genomes. 16S rRNA genes can prove to be problematic during theassembly steps due to the high level of conservation that can break contigs (Miller, Koren &Sutton, 2010) (Fig. 3). The conserved regions of the 16S rRNA, depending on the situation,can over- or under-recruit reads, resulting in coverage variations that can misplace contigsinto the incorrect genome. As such, most of the 16S rRNA phylogenetic placementssupport the taxonomic assignments, while eight of the assignments were contradictoryin nature (denoted in Supplemental Information 1). An example of this nonconformityof 16S rRNA assignment would be TMED32. A Bacteroidetes, TMED32 is assigned tothe Order Cytophagales via CheckM and the ribosomal marker tree and contains three16S rRNA sequences. One of the 16S rRNA sequences is conformational, with placementin the Family Flammeovirgaceae, while the remaining two 16S rRNA are assigned to theMitochondria. For future research purposes, contigs with contradictory 16S rRNA orincongruent phylogenetic/taxonomic signatures should be removed. Downstream analysis
Tully et al. (2017), PeerJ, DOI 10.7717/peerj.3558 10/15

should allow for the determination of the most parsimonious result in any draft genomewith contradictory phylogenetic assignments.
Beyond the 16S rRNA gene, genomes were searched for 16 conserved, syntenic ribosomalmarkers. Sufficient markers (≥8) were identified in 210 of the genomes (72%) andplaced on a tree with 6,080 reference sequences and used to assign a putative phylogeny(Supplemental Information 1). Phylogenies were then assigned to the lowest taxonomiclevel that could be confidently determined (Fig. 4). These putative results reveal a numberof genomes were generated that representmultiple clades for which environmental genomicinformation remains limited, including: Planctomycetes, Verrucomicrobia, Cyanobacteria,and uncultured groups within the Alpha- and Gammaproteobacteria.
Relative abundanceA length-normalized relative abundance value was determined for each genome ineach sample based on the number of reads recruited to the data-rich-contigs. Therelative abundance for the individual genomes was determined based on this portionof the dataset (Supplemental Information 3). In general, the genomes had low relativeabundance (maximum relative abundance= 1.9% for TMED155 a putative Cyanobacteriaat site TARA023 from the protistan size fraction sampled at the surface; SupplementalInformation 1). The draft genomes accounted for 1.57–25.16% of the approximatemicrobial community as determined by the data-rich-contigs (mean = 13.69%), withthe ten most abundant genomes in a sample representing 0.61–10.31% (Table 1).
CONCLUDING STATEMENTThe goal of this project was to provided preliminary putative genomes from theTara Oceansmicrobial metagenomic datasets. The 290 putative draft genomes and 2,786 low completionbins were created using the 20 samples and six stations from the Mediterranean Sea.
Initial assessment of the phylogeny of these metagenomic-assembled genomes basedon concatenated ribosomal markers indicates several new genomes from environmentallyrelevant organisms, including approximately 10 new Cyanobacteria genomes within thegenera Prochlorococcus and Synechococcus and 22 new SAR11 genomes. Additionally, thereare putative genomes from the marine Euryarchaeota (n= 13), Verrucomicrobia (n= 15),and Planctomycetes (n= 7). Additionally, the low completion bins may house distinctviral genomes. Of particular interest may be the 40 bins with 0% completion (based onsingle-copy marker genes), but that contain >500 kb of genetic material (including 3 binswith >1 Mb). These large bins lacking markers may be good candidates for research in tothe marine ‘‘giant viruses’’ and episomal DNA sources (plasmids, etc.).
It should be noted, researchers using this dataset should be aware that all of the genomesgenerated from these samples should be used as a resource with some skepticism towardsthe results being an absolute. Like all results for metagenome-assembled genomes, thesegenomes represent a best-guess approximation of a taxon from the environment (Sharon &Banfield, 2013). Researchers are encouraged to confirm all claims through various genomicanalyses and accuracy may require the removal of conflicting sequences.
Tully et al. (2017), PeerJ, DOI 10.7717/peerj.3558 11/15
ACKNOWLEDGEMENTSWe are indebted to the Tara Oceans project and team for their commitment to open-accessdata that allows data aficionados to indulge in the data and attempt to add to the body ofscience contained within. This is C-DEBI Contribution 333.
ADDITIONAL INFORMATION AND DECLARATIONS
FundingFunding was provided by the Center for Dark Energy Biosphere Investigations (C-DEBI)to BJT and JFH (OCE-0939654). The funders had no role in study design, data collectionand analysis, decision to publish, or preparation of the manuscript.
Grant DisclosuresThe following grant information was disclosed by the authors:Center for Dark Energy Biosphere Investigations (C-DEBI): OCE-0939654.
Competing InterestsThe authors declare there are no competing interests.
Author Contributions• Benjamin J. Tully conceived and designed the experiments, performed the experiments,analyzed the data, wrote the paper, prepared figures and/or tables, reviewed drafts of thepaper.• Rohan Sachdeva reviewed drafts of the paper, provided origins of assembly workflow.• Elaina D. Graham performed the experiments, reviewed drafts of the paper.• John F. Heidelberg contributed reagents/materials/analysis tools, reviewed drafts of thepaper.
Data AvailabilityThe following information was supplied regarding data availability:
This project has been deposited at DDBJ/ENA/GenBank under the BioProject accessionno. PRJNA385857 and drafts of genomes are available with accession no. NHBG00000000–NHMJ00000000. All contigs generated using Megahit from each sample are availablethrough iMicrobe (http://data.imicrobe.us/project/view/261). TARA Oceans has depositedthe reads in the NCBI Sequence Read Archive (SRA) with accessions ERS488346,ERS488330, ERS477998, ERS477979, ERS488509, ERS488486, ERS478040, ERS477953,ERS477931, ERS488147, ERS488119, and ERS478017.
Additional files have been provided and are available through FigShare, such as: allcontigs from Minimus2 +Megahit output used for binning and community assessment;contig read counts per sample; the putative genome contigs and Prodigal-predictednucleotide and protein putative CDS FASTA files; the ribosomal marker HMM profiles;reference genome markers; draft genome markers; low completion bins, and contigswithout a bin.
Tully et al. (2017), PeerJ, DOI 10.7717/peerj.3558 12/15
Tully, Benjamin; Sachdeva, Rohan; Graham, Elaina; Heidelberg, John (2017): 290Genomes from the Mediterranean Sea: Supplemental Data. figshare. https://doi.org/10.6084/m9.figshare.3545330.v3.
Supplemental InformationSupplemental information for this article can be found online at http://dx.doi.org/10.7717/peerj.3558#supplemental-information.
REFERENCESCapella-Gutiérrez S, Silla-Martínez JM, Gabaldón T. 2009. trimAl: a tool for auto-
mated alignment trimming in large-scale phylogenetic analyses. Bioinformatics25:1972–1973 DOI 10.1093/bioinformatics/btp348.
Chevreux B, Pfisterer T, Drescher B, Driesel AJ, MüllerWEG,Wetter T, Suhai S.2004. Using the miraEST assembler for reliable and automated mRNA transcriptassembly and SNP detection in sequenced ESTs. Genome Research 14:1147–1159DOI 10.1101/gr.1917404.
Edgar RC. 2004.MUSCLE: multiple sequence alignment with high accuracy and highthroughput. Nucleic Acids Research 32:1792–1797 DOI 10.1093/nar/gkh340.
Eren AM, Esen ÖC, Quince C, Vineis JH, Morrison HG, SoginML, Delmont TO.2015. Anvio: an advanced analysis and visualization platform for omics data. PeerJ3:e1319 DOI 10.7717/peerj.1319.
Falkowski PG, Fenchel T, DeLong EF. 2008. The microbial engines that drive earth’sbiogeochemical cycles. Science 320:1034–1039 DOI 10.1126/science.1153213.
Finn RD, Clements J, Eddy SR. 2011.HMMER web server: interactive sequencesimilarity searching. Nucleic Acids Research 39:W29–W37 DOI 10.1093/nar/gkr367.
Fu L, Niu B, Zhu Z,Wu S, LiW. 2012. CD-HIT: accelerated for clustering the next-generation sequencing data. Bioinformatics 28:3150–3152DOI 10.1093/bioinformatics/bts565.
Graham ED, Heidelberg JF, Tully BJ. 2017. BinSanity: unsupervised clustering ofenvironmental microbial assemblies using coverage and affinity propagation. PeerJ5:e3035–19 DOI 10.7717/peerj.3035.
Huang X, Madan A. 1999. CAP3: a DNA sequence assembly program. Genome Research9:868–877 DOI 10.1101/gr.9.9.868.
Hug LA, Baker BJ, Anantharaman K, Brown CT, Probst AJ, Castelle CJ, ButterfieldCN, Hernsdorf AW, Amano Y, Ise K, Suzuki Y, Dudek N, Relman DA, Finstad KM,Amundson R, Thomas BC, Banfield JF. 2016. A new view of the tree of life. NatureMicrobiology 1(5):16048 DOI 10.1038/nmicrobiol.2016.48.
Karsenti E, Acinas SG, Bork P, Bowler C, De Vargas C, Raes J, SullivanM, Arendt D,Benzoni F, Claverie J-M, FollowsM, Gorsky G, Hingamp P, Iudicone D, JaillonO, Kandels-Lewis S, Krzic U, Not F, Ogata H, Pesant S, Reynaud EG, SardetC, Sieracki ME, Speich S, Velayoudon D,Weissenbach J, Wincker P. 2011. Aholistic approach to marine eco-systems biology. PLOS Biology 9:e1001177–5DOI 10.1371/journal.pbio.1001177.
Tully et al. (2017), PeerJ, DOI 10.7717/peerj.3558 13/15

Kearse M, Moir R,Wilson A, Stones-Havas S, CheungM, Sturrock S, Buxton S,Cooper A, Markowitz S, Duran C, Thierer T, Ashton B, Mentjies P, DrummondA. 2012. Geneious basic: an integrated and extendable desktop software platformfor the organization and analysis of sequence data. Bioinformatics 28:1647–1649DOI 10.1093/bioinformatics/bts199.
Lagesen K, Hallin P, Rødland EA, Staerfeldt H-H, Rognes T, Ussery DW. 2007.RNAmmer: consistent and rapid annotation of ribosomal RNA genes. Nucleic AcidsResearch 35:3100–3108 DOI 10.1093/nar/gkm160.
Langmead B, Salzberg SL. 2012. Fast gapped-read alignment with Bowtie 2. NatureMethods 9:357–359 DOI 10.1038/nmeth.1923.
Le SQ, Gascuel O. 2008. An improved general amino acid replacement matrix.MolecularBiology and Evolution 25:1307–1320 DOI 10.1093/molbev/msn067.
Li D, Luo R, Liu C-M, Leung C-M, Ting H-F, Sadakane K, Yamashita H, Lam T-W. 2016.MEGAHIT v1.0: a fast and scalable metagenome assembler drivenby advanced methodologies and community practices.Methods 102:3–11DOI 10.1016/j.ymeth.2016.02.020.
Liao Y, Smyth GK, ShiW. 2014. featureCounts: an efficient general purpose programfor assigning sequence reads to genomic features. Bioinformatics 30:923–930DOI 10.1093/bioinformatics/btt656.
Longhurst A, Sathyendranath S, Platt T, Caverhill C. 1995. An estimate of globalprimary production in the ocean from satellite radiometer data. Journal of PlanktonResearch 17:1245–1271 DOI 10.1093/plankt/17.6.1245.
LudwigW, Strunk O,Westram R, Richter L, Meier H, Yadhukumar, Buchner A, Lai T,Steppi S, Jobb G, FörsterW, Brettske I, Gerber S, Ginhart AW, Gross O, GrumannS, Hermann S, Jost R, König A, Liss T, Lüssmann R, MayM, Nonhoff B, ReichelB, Strehlow R, Stamatakis A, Stuckmann N, Vilbig A, LenkeM, Ludwig T, Bode A,Schleifer K-H. 2004. ARB: a software environment for sequence data. Nucleic AcidsResearch 32:1363–1371 DOI 10.1093/nar/gkh293.
Matsen FA, Kodner RB, Armbrust EV. 2010. pplacer: linear time maximum-likelihoodand Bayesian phylogenetic placement of sequences onto a fixed reference tree. BMCBioinformatics 11:538 DOI 10.1186/1471-2105-11-538.
Miller JR, Koren S, Sutton G. 2010. Assembly algorithms for next-generation sequencingdata. Genomics 95:315–327 DOI 10.1016/j.ygeno.2010.03.001.
Parks DH, Imelfort M, Skennerton CT, Hugenholtz P, Tyson GW. 2015. CheckM:assessing the quality of microbial genomes recovered from isolates, single cells, andmetagenomes. Genome Research 25:1043–1055 DOI 10.1101/gr.186072.114.
Price MN, Dehal PS, Arkin AP. 2010. FastTree 2—approximately maximum-likelihoodtrees for large alignments. PLOS ONE 5:e9490 DOI 10.1371/journal.pone.0009490.
Pruesse E, Peplies J, Glöckner FO. 2012. SINA: accurate high-throughput multiplesequence alignment of ribosomal RNA genes. Bioinformatics 28:1823–1829DOI 10.1093/bioinformatics/bts252.
Sharon I, Banfield JF. 2013.Microbiology. Genomes from metagenomics. Science342:1057–1058 DOI 10.1126/science.1247023.
Tully et al. (2017), PeerJ, DOI 10.7717/peerj.3558 14/15

Shimodaira H, HasegawaM. 1999.Multiple comparisons of log-likelihoods with appli-cations to phylogenetic inference.Molecular Biology and Evolution 16:1114–1116DOI 10.1093/oxfordjournals.molbev.a026201.
Sunagawa S, Coelho LP, Chaffron S, Kultima JR, Labadie K, Salazar G, DjahanschiriB, Zeller G, Mende DR, Alberti A, Cornejo-Castillo FM, Costea PI, Cruaud C,D’Ovidio F, Engelen S, Ferrera I, Gasol JM, Guidi L, Hildebrand F, Kokoszka F,Lepoivre C, Lima-Mendez G, Poulain J, Poulos BT, Royo-LlonchM, Sarmento H,Vieira-Silva S, Dimier C, Picheral M, Searson S, Kandels-Lewis S, Tara OceansCoordinators, Bowler C, De Vargas C, Gorsky G, Grimsley N, Hingamp P,Iudicone D, Jaillon O, Not F, Ogata H, Pesant S, Speich S, Stemmann L, SullivanMB,Weissenbach J, Wincker P, Karsenti E, Raes J, Acinas SG, Bork P. 2015.Ocean plankton. Structure and function of the global ocean microbiome. Science348:1261359–1261359 DOI 10.1126/science.1261359.
Treangen TJ, Sommer DD, Angly FE, Koren S, PopM. 2011. Next generation sequenceassembly with AMOS. Current Protocols in Bioinformatics Chapter: Unit 11.8DOI 10.1002/0471250953.bi1108s33.
WhitmanWB, Coleman DC,WiebeWJ. 1998. Prokaryotes: the unseen majority.Proceedings of the National Academy of Sciences of the United States of America95:6578–6583 DOI 10.1073/pnas.95.12.6578.
Yang Z.Maximum likelihood phylogenetic estimation from DNA sequences withvariable rates over sites: approximate methods. Journal of Molecular Evolution39:306–314 DOI 10.1007/BF00160154.
Tully et al. (2017), PeerJ, DOI 10.7717/peerj.3558 15/15