Embed Size (px)
Citation preview
DEM Corporate Office: 1401-1411, 44" Floor, Logix City Center,
Sector-32, Noida-201301 (U.P.)
Tel. : 0120- 6013232 / 7290935048
29"July, 2021
BSE LimitedPhiroze Jeejeebhoy Towers,Dalal Street, Fort,
Mumbai — 400 001
Scrip Code: 519588
National Stock Exchange of India Ltd. (NSE)
Exchange Plaza,
Bandra Kurla Complex, Bandra (E),
Mumbai — 400 051
Symbol: DFMFOODS
Dear Sir/Madam,
Sub: Quarterly update
Please find enclosed herewith Quarterly update-Q1 FY 2021-22.
Thanking you.
Yours,faithfully,
For DFM Foods Limited
(R. S./Tomer)
ComppnySecretary
Encl: As above
ae
Regd. Office :8377, Roshanara Road, Delhi-110007 Tel. : 23826445 E-mail : [email protected]
CIN : L15311DL1993PLC052624

DFM Foods Quarterly Update – Q1FY22
29th Jul 2021

DFM: At a Glance
2
INR ~60 B1
~25% CAGR
#1
in Extruded Snacks2
#1 in Weighted Reach Pan India
for Extruded Snacks2
1.3M Retailers2
~ 30%3
Negative ~25 Days4
20+
Avg. Years of Experience
with Top Mgmt. Team
Note: 1) Extruded market estimate based on Nielsen Data (Pre covid) 2) Nielsen Data 3) RoCE is for FY21 and calculated as (Adjusted EBITDA - D&A) / Average Capital Employed; Capital Employed = Net fixed assets (Ex-RoU) + Inventory +
Receivables – Trade Payables; RoU refers to Right of Use assets created as per Ind As 116 4) Median Net Working Capital Days
Large Market with Strong
Growth
Leading Brand in Extruded
Snacks Best in Class Reach
Attractive RoCE Negative Working Capital
Cycle
Professional Management
Team

Product Portfolio Evolution
Rings
‒ Extruded
‒ Corn-based rings; loop
them around your fingers
‒ Kids focused; comes with a
fun toy in 7 flavors
Natkhat
‒ Range of traditional
namkeens
‒ Extruded
‒ Crunchy wheat
puff
Curls
‒ Extruded
‒ Corn-based soft
textured snack; melts in
the mouth
‒ Comes in may flavors
Cheese Balls
‒ Extruded
‒ Light and crispy
balls with a rich
taste of cheese
Fritts
‒ Extruded
‒ Light and crispy
sticks made of corn
and potatoes
‒ 5 flavors
Pasta Crunch
‒ Pellets
‒ Crunchy taste with
a unique Chinese
Tadka flavor
‒ 2 flavors
Launched in 1984
Namkeen
Launched in 2017 Launched in 2018 Launched in 2019
4
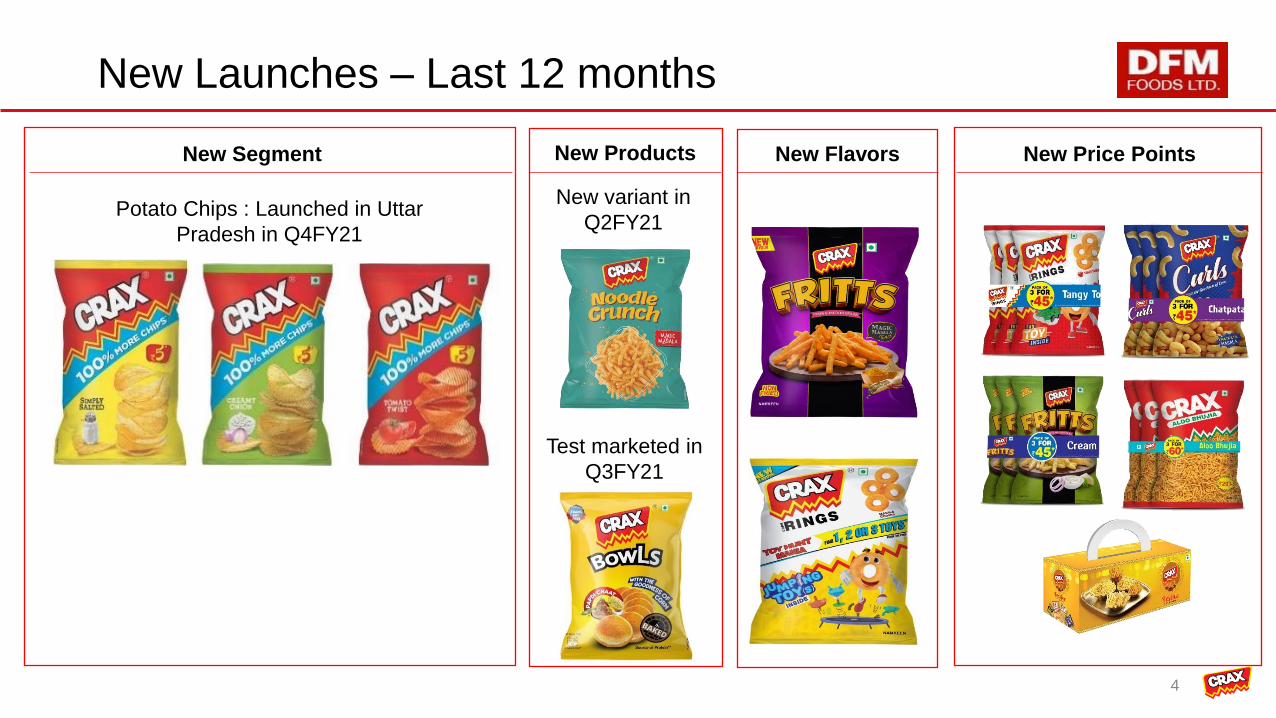
New Launches – Last 12 months
4
New Segment New Flavors New Price Points
Test marketed in
Q3FY21
New variant in
Q2FY21 Potato Chips : Launched in Uttar
Pradesh in Q4FY21
New Products
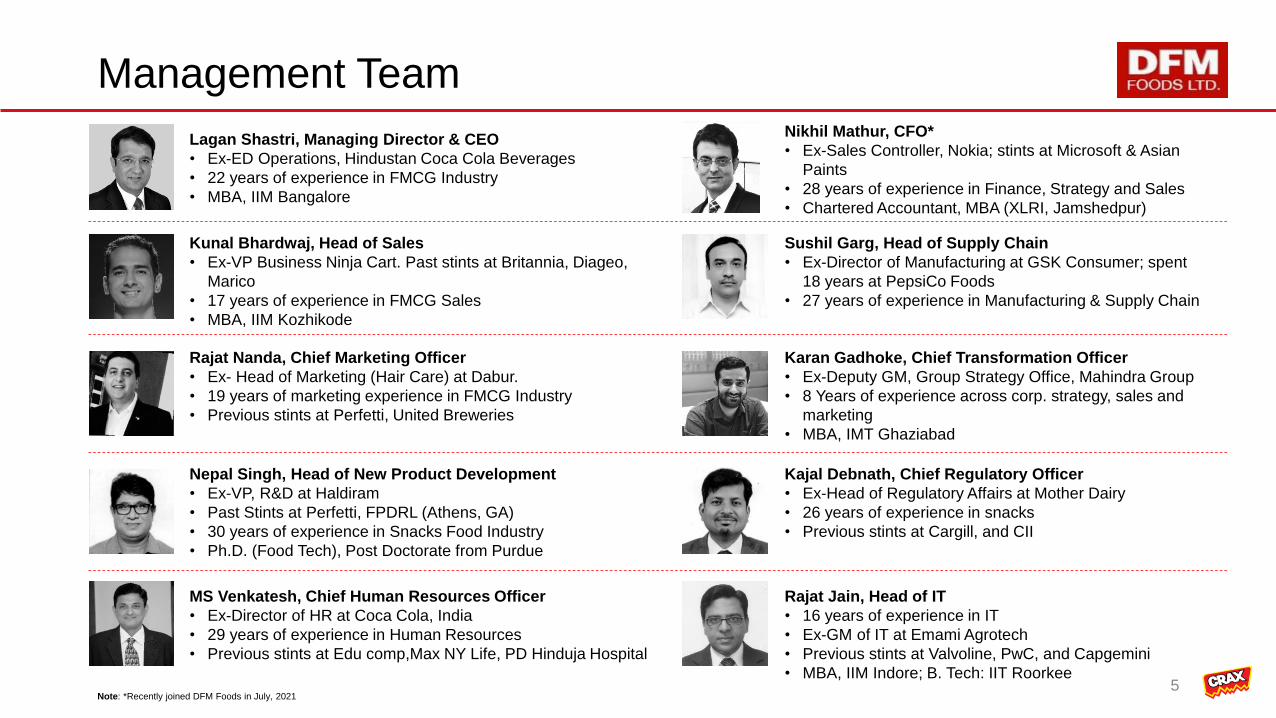
Management Team
Lagan Shastri, Managing Director & CEO
• Ex-ED Operations, Hindustan Coca Cola Beverages
• 22 years of experience in FMCG Industry
• MBA, IIM Bangalore
Nikhil Mathur, CFO*
• Ex-Sales Controller, Nokia; stints at Microsoft & Asian
Paints
• 28 years of experience in Finance, Strategy and Sales
• Chartered Accountant, MBA (XLRI, Jamshedpur)
Kunal Bhardwaj, Head of Sales
• Ex-VP Business Ninja Cart. Past stints at Britannia, Diageo,
Marico
• 17 years of experience in FMCG Sales
• MBA, IIM Kozhikode
Sushil Garg, Head of Supply Chain
• Ex-Director of Manufacturing at GSK Consumer; spent
18 years at PepsiCo Foods
• 27 years of experience in Manufacturing & Supply Chain
Karan Gadhoke, Chief Transformation Officer
• Ex-Deputy GM, Group Strategy Office, Mahindra Group
• 8 Years of experience across corp. strategy, sales and
marketing
• MBA, IMT Ghaziabad
Nepal Singh, Head of New Product Development
• Ex-VP, R&D at Haldiram
• Past Stints at Perfetti, FPDRL (Athens, GA)
• 30 years of experience in Snacks Food Industry
• Ph.D. (Food Tech), Post Doctorate from Purdue
Rajat Nanda, Chief Marketing Officer
• Ex- Head of Marketing (Hair Care) at Dabur.
• 19 years of marketing experience in FMCG Industry
• Previous stints at Perfetti, United Breweries
Kajal Debnath, Chief Regulatory Officer
• Ex-Head of Regulatory Affairs at Mother Dairy
• 26 years of experience in snacks
• Previous stints at Cargill, and CII
MS Venkatesh, Chief Human Resources Officer
• Ex-Director of HR at Coca Cola, India
• 29 years of experience in Human Resources
• Previous stints at Edu comp,Max NY Life, PD Hinduja Hospital
Rajat Jain, Head of IT
• 16 years of experience in IT
• Ex-GM of IT at Emami Agrotech
• Previous stints at Valvoline, PwC, and Capgemini
• MBA, IIM Indore; B. Tech: IIT Roorkee 5
Note: *Recently joined DFM Foods in July, 2021

Board of Directors
6
Manu Anand, Non-Executive Director
• Ex-President, Mondelez, AMEA; Ex-Chairman & CEO,
PepsiCo India
• 35+ years of experience in FMCG Industry
• Credited with building the food business at PepsiCo.
virtually from scratch; Built PepsiCo into India’s #1 snacks
brand (“Lays”, “Uncle Chipps”, “Kurkure”)
VL Rajesh, Non-Executive Director
• Ex-CEO, ITC Foods
• 30+ years of experience in FMCG Industry
• Part of founding team which identified and set up the ITC
foods business and scaled it into India’s #3 player; built
multiple brands e.g. “Ashirvaad”, “Sunfeast”, “Yippee”;
created “Bingo” into India’s #2 snacks brand with a pan-
India presence across multiple salty snacks categories
Hemant Nerurkar, Independent Non-Executive Director,
Chairman of the Board
• Ex-MD, Tata Steel India
• 35+ years of experience in Steel Industry
Anil Chanana, Independent Non-Executive Director
Chairman of the Audit Committee
• Ex-CFO, HCL Technologies
• 30+ years of experience in Finance
Sahil Dalal, Non-Executive Director
• Managing Director, Advent India
• 15+ years of experience in Private Equity / Finance
Dipali Sheth, Independent Non-Executive Director
• Ex-Country Head of Human Resources at Royal Bank of
Scotland, India
• 23+ years of experience in Human Resources
Lagan Shastri, Managing Director & CEO
• Ex-ED Operations, Hindustan Coca Cola Beverages
• 22 years of experience in FMCG Industry
• MBA, IIM Bangalore

Strategic Roadmap
7
Portfolio
Excellence
Brand
Excellence
Go To Market
Excellence
Operational
Excellence
Stakeholder Value Creation
Technology
Excellence
Execution Excellence
People
Excellence
Personal Leadership & Courage
Integrity, Transparency, Empathy
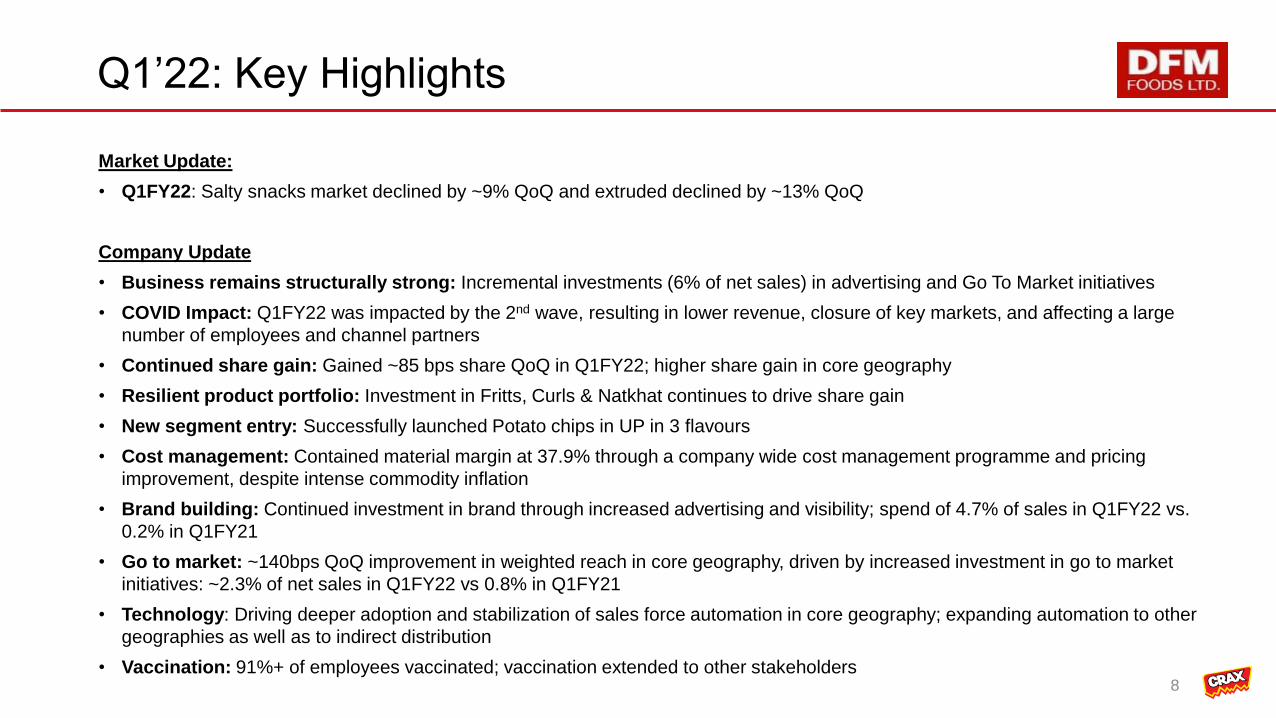
Q1’22: Key Highlights
8
Market Update:
• Q1FY22: Salty snacks market declined by ~9% QoQ and extruded declined by ~13% QoQ
Company Update
• Business remains structurally strong: Incremental investments (6% of net sales) in advertising and Go To Market initiatives
• COVID Impact: Q1FY22 was impacted by the 2nd wave, resulting in lower revenue, closure of key markets, and affecting a large
number of employees and channel partners
• Continued share gain: Gained ~85 bps share QoQ in Q1FY22; higher share gain in core geography
• Resilient product portfolio: Investment in Fritts, Curls & Natkhat continues to drive share gain
• New segment entry: Successfully launched Potato chips in UP in 3 flavours
• Cost management: Contained material margin at 37.9% through a company wide cost management programme and pricing
improvement, despite intense commodity inflation
• Brand building: Continued investment in brand through increased advertising and visibility; spend of 4.7% of sales in Q1FY22 vs.
0.2% in Q1FY21
• Go to market: ~140bps QoQ improvement in weighted reach in core geography, driven by increased investment in go to market
initiatives: ~2.3% of net sales in Q1FY22 vs 0.8% in Q1FY21
• Technology: Driving deeper adoption and stabilization of sales force automation in core geography; expanding automation to other
geographies as well as to indirect distribution
• Vaccination: 91%+ of employees vaccinated; vaccination extended to other stakeholders

Q1’22: Financial Update – Quarterly P&L
9
Abridged Quarterly Financials
Note: a) One-time expenses incurred in Q1FY22 for expenses related to i) write off in Capital Work in Progress due to cancellation of an unused lease (INR 15.9m), and ii) provision created for at risk inventory due to COVID (INR 14.8m); One-time
expenses in Q4FY21 for expenses towards land conversion.
Key Highlights
• 2nd wave of COVID and ensuing lockdowns substantially impacted the category and the company in Q1FY22; resulting in revenue decline of ~4% YoY
• Despite intense commodity inflation, DFM Foods contained material margins at 37.9% through pricing improvement and a company wide cost management programme
• Advertising spend increased to 4.7% of sales in Q1FY22 vs. 0.2% of net sales in Q1FY21
• Investment in go to market expansion increased to ~2.3% of net sales in Q1FY22 vs 0.8% of net sales in Q1FY21
• Increase in Other Expenses primarily due to one-time expenses, such as CWIP write off and Covid related provisions
• EBITDA (adjusted for ESAR and one-time expenses) declined largely due to increased investments in brand building and go to market expansion
INR M Jun-20 Jun-21 YoY Gr. Mar-21
Net Sales 1,149.3 1,104.5 (3.9%) 1,324.8
Less: COGS 698.7 685.6 (1.9%) 780.9
Material Margin 450.6 418.9 (7.0%) 543.9
% of Net Revenue 39.2% 37.9% 41.1%
Less:
Employee Cost 132.0 134.2 1.7% 137.1
Advertising 1.8 51.4 na 94.2
Investment in GTM Expansion 9.3 25.9 178.5% 21.3
Other Expenses 159.6 195.3 22.4% 226.4
Reported EBITDA 147.9 12.1 (91.8%) 64.9
% of Net Revenue 12.9% 1.1% 4.9%
Less:
D&A 31.4 38.8 23.6% 37.6
Reported EBIT 116.5 (26.7) (122.9%) 27.3
% of Net Revenue 10.1% (2.4%) 2.1%
Less: Finance Cost 30.1 27.1 (10.0%) 25.9
Add: Other Income 19.3 31.6 63.7% 12.3
Reported PBT 105.7 (22.2) (121.0%) 13.7
% of Net Revenue 9.2% (2.0%) 1.0%
Less: Taxes 25.7 (4.9) 4.7
Reported PAT 80.0 (17.3) (121.6%) 9.0
% of Net Revenue 7.0% (1.6%) 0.7%
Reported EBITDA 147.9 12.1 (91.8%) 64.9
Add:
ESAR Expenses 3.4 9.9 190.4% 13.1
One time expensesa - 30.7 9.5
Adjusted EBITDA 151.3 52.7 (65.2%) 87.5
% of Net Revenue 13.2% 4.8% 6.6%
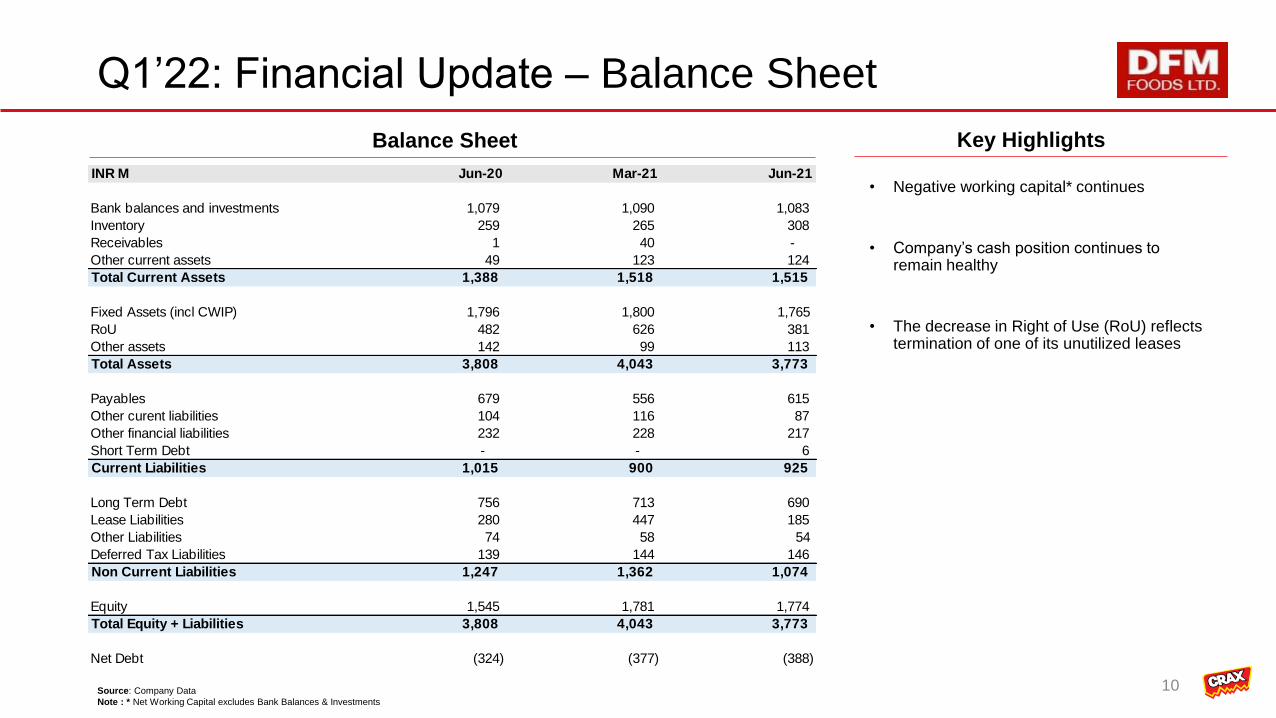
Q1’22: Financial Update – Balance Sheet
10
Balance Sheet
Source: Company Data
Note : * Net Working Capital excludes Bank Balances & Investments
Key Highlights
• Negative working capital* continues
• Company’s cash position continues to remain healthy
• The decrease in Right of Use (RoU) reflects termination of one of its unutilized leases
INR M Jun-20 Mar-21 Jun-21
Bank balances and investments 1,079 1,090 1,083
Inventory 259 265 308
Receivables 1 40 -
Other current assets 49 123 124
Total Current Assets 1,388 1,518 1,515
Fixed Assets (incl CWIP) 1,796 1,800 1,765
RoU 482 626 381
Other assets 142 99 113
Total Assets 3,808 4,043 3,773
Payables 679 556 615
Other curent liabilities 104 116 87
Other financial liabilities 232 228 217
Short Term Debt - - 6
Current Liabilities 1,015 900 925
Long Term Debt 756 713 690
Lease Liabilities 280 447 185
Other Liabilities 74 58 54
Deferred Tax Liabilities 139 144 146
Non Current Liabilities 1,247 1,362 1,074
Equity 1,545 1,781 1,774
Total Equity + Liabilities 3,808 4,043 3,773
Net Debt (324) (377) (388)

Q1’22: Financial Update – Cash Flow
11
Cash Flow
Source: Company Data
Key Highlights
• Company’s cash position continues to remain healthy
• Debt repayment of INR 23M in Q1FY22
• Capex of INR 17M in Q1FY22 for investment in capacity addition and automation
QUARTER
INR M Jun-20 Jun-21
Reported EBITDA 148 12
Change in WC 115 9
Income tax paid (21) (1)
Capex (8) (17)
Interest paid (22) (12)
Interest received 5 9
Others 11 17
FCFF 229 16
Debt issued / (paid) (75) (23)
Equity raised/option exercised 8 -
Net Cash generated 162 (7)
Opening Bank Balances and Investments 918 1,090
Closing Bank balances and Investments 1,079 1,083

Q1’22: Financial Update – Key Ratios
12
Material Margin1
39.2% 41.1% 37.9%
0.0%
10.0%
20.0%
30.0%
40.0%
50.0%
60.0%
70.0%
Jun-20 Mar-21 Jun-21
Adjusted EBITDA Margin2 Adjusted PAT Margin3
13.2%
6.6% 4.8%
0.0%
5.0%
10.0%
15.0%
20.0%
25.0%
Jun-20 Mar-21 Jun-21
7.2%
2.0% 1.3%
0.0%
2.0%
4.0%
6.0%
8.0%
10.0%
12.0%
Jun-20 Mar-21 Jun-21
Note: Methodology for calculating Net Debt/EBITDA, RoCE, RoE has been changed compared to last quarter. Earlier methodology was based on annualizing EBITDA, EBIT, and PAT for the current quarter, whereas, Current methodology is based on
using LTM EBITDA, EBIT, and PAT 1) Material Margin is defined as (Net Revenue less COGS)/Net Revenue 2) Adjusted EBITDA is calculated by adding back ESAR & one time expenses to Reported EBITDA 3) Adjusted PAT is calculated by adjusting
PBT for ESAR & one time expenses and applying the average tax rate (4) Net Debt/Adjusted EBITDA is calculated as Net Debt/LTM Adjusted EBITDA; 5) RoCE is calculated on (LTM Adjusted EBITDA – LTM D&A) / Average Capital Employed; Capital
Employed = Net fixed assets (Ex-RoU) + Inventory + Receivables – Trade payables; RoU refers to Right of Use assets created as per Ind As 116. 6) RoE is calculated as LTM Adjusted PAT /Average Shareholder’s Equity
Net Debt / Adj. EBITDAx4 RoCE5 RoE6
-0.6x -0.6x
-0.8x
-1.0x
-0.8x
-0.6x
-0.4x
-0.2x
0.0x
Jun-20 Mar-21 Jun-21
21.7% 19.5% 13.9%
0.0%
10.0%
20.0%
30.0%
40.0%
Jun-20 Mar-21 Jun-21
30.1% 30.1% 23.6%
0.0%
10.0%
20.0%
30.0%
40.0%
Jun-20 Mar-21 Jun-21

13
Thank you