Embed Size (px)
DESCRIPTION
29 July 2008 “ Towards a More Economically Sustainable Blue Mountains ”. Key Directions:. 25 Year Vision for the City Towards a more sustainable Blue Mountains. Working and Learning. Outcomes:. The local economy is strengthened and diversified. Blue Mountains is a model for - PowerPoint PPT Presentation
Citation preview
29 July 2008 “Towards a More Economically Sustainable Blue Mountains”
Key Directions:
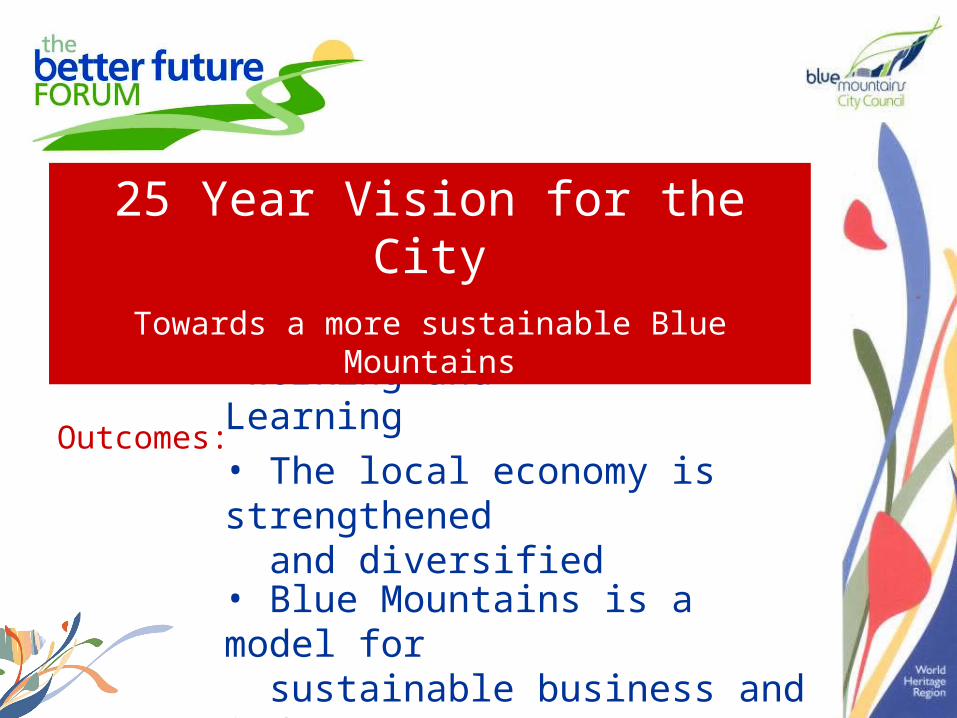
•Working and Learning
• The local economy is strengthened and diversified
Outcomes:
• Blue Mountains is a model for sustainable business and industry
25 Year Vision for the CityTowards a more sustainable Blue Mountains
“I think of the Mountains as a place I leave. I leave to go to uni, I leave to go out at night, I leave to go shopping, I’ll have to leave to get a job and I will probably have to leave to buy a house. What I would hope for the younger people of 2025 is a place where they can stay in to do more things.”
Young Blue Mountains Resident
What is Needed to Develop a Better Economic Future?
•Identify appropriate strategies to create economical development & jobs
•Strategies need to be resourced
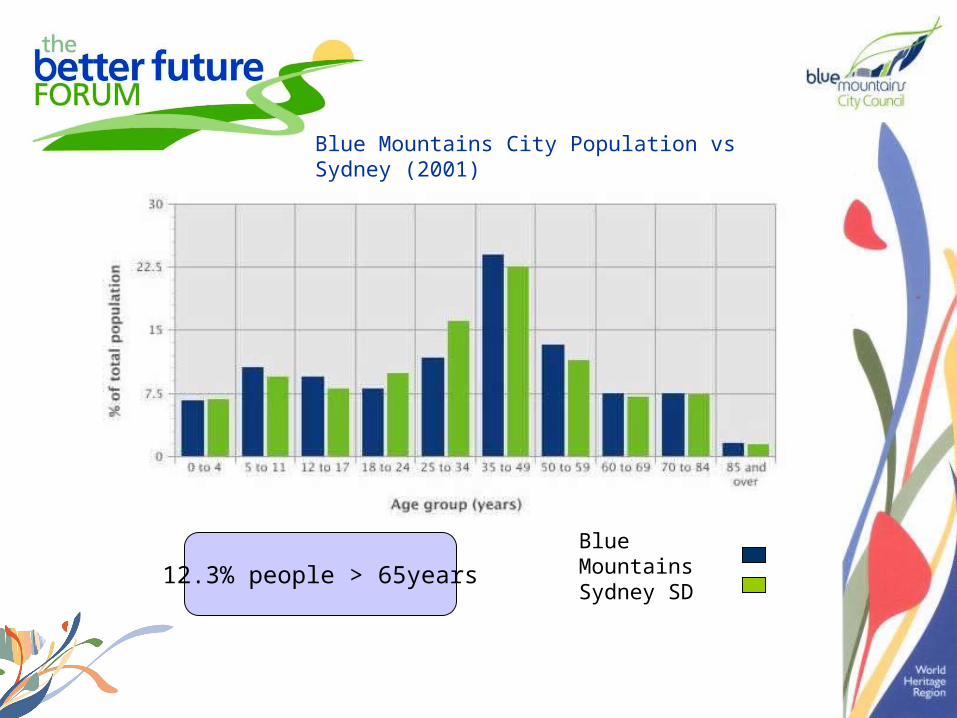
Blue Mountains City Population vs Sydney (2001)
Blue MountainsSydney SD12.3% people > 65years
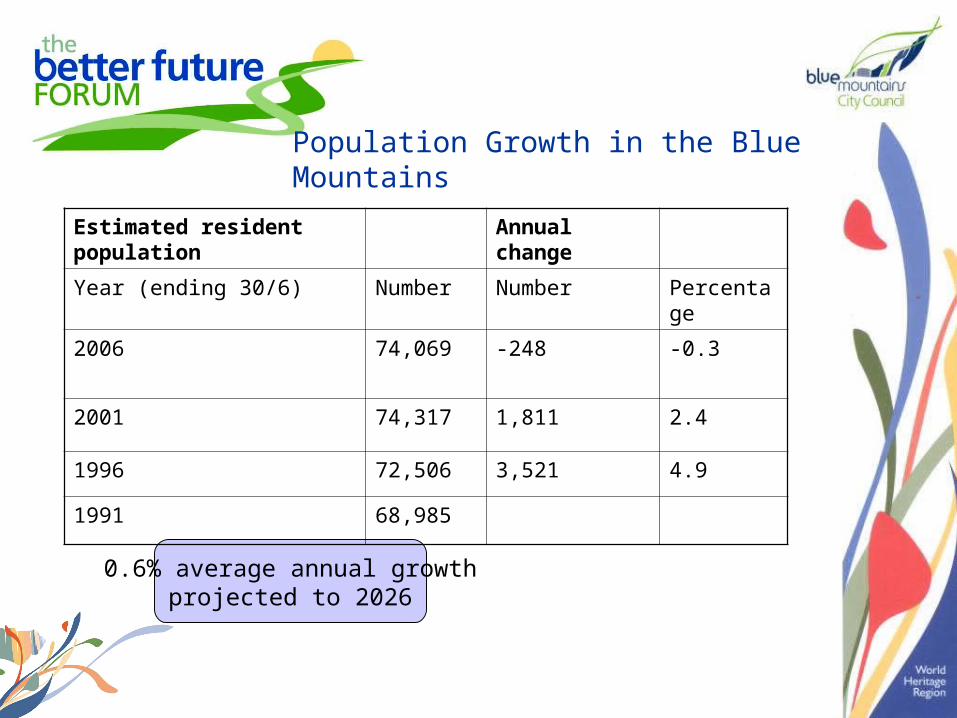
0.6% average annual growthprojected to 2026
Estimated resident population Annual change
Year (ending 30/6) Number Number Percentage
2006 74,069 -248 -0.3
2001 74,317 1,811 2.4
1996 72,506 3,521 4.9
1991 68,985
Population Growth in the Blue Mountains
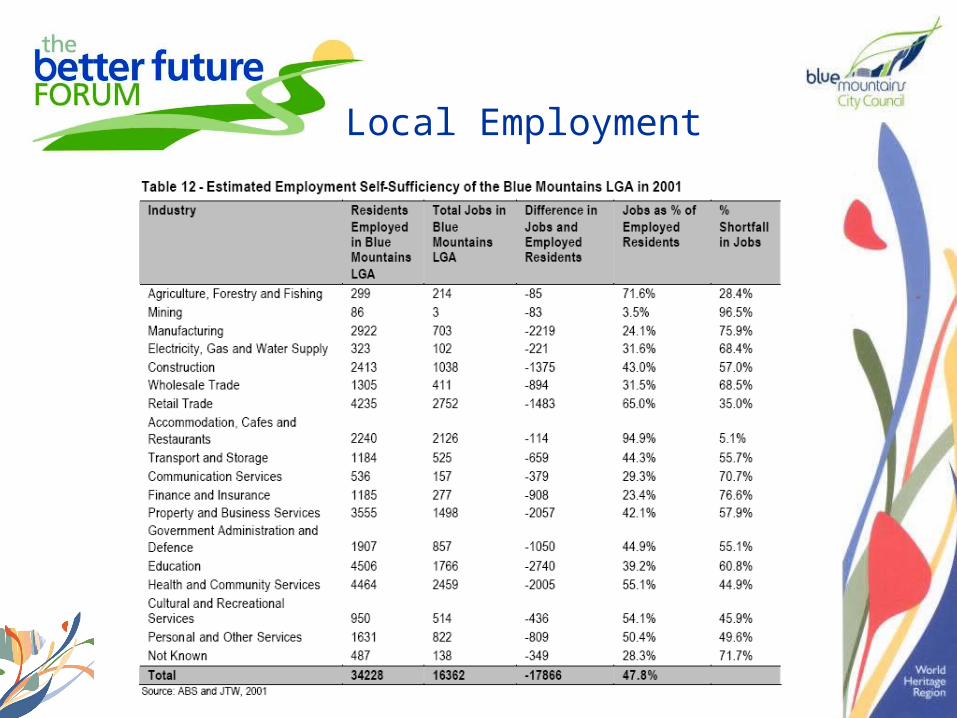
Local Employment
Source: Lawrence Consulting
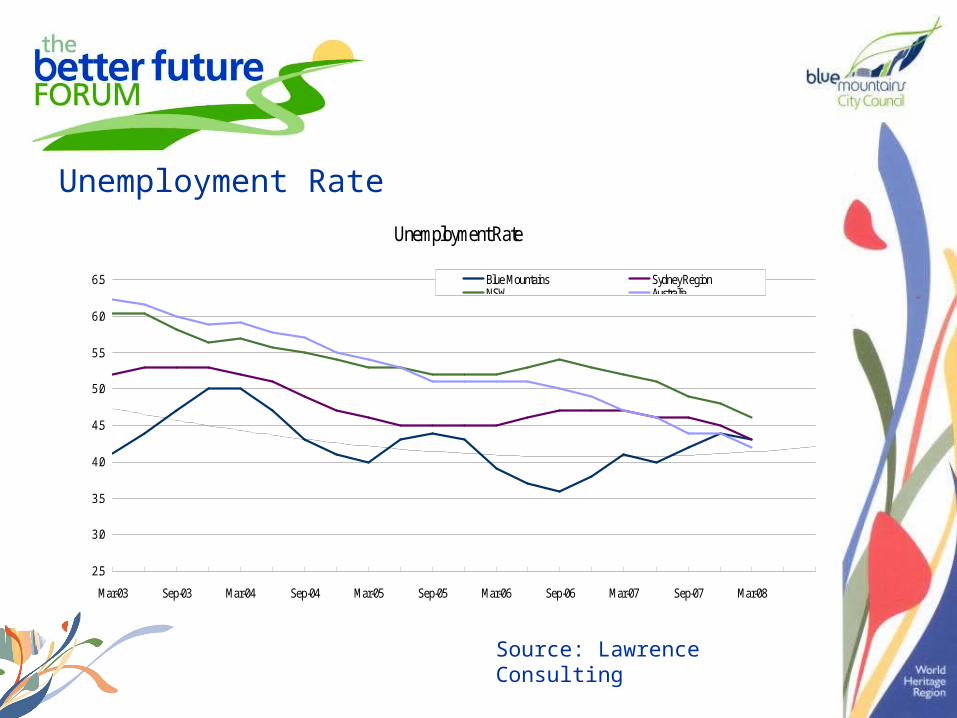
Unemployment RateUnemployment Rate
2.5
3.0
3.5
4.0
4.5
5.0
5.5
6.0
6.5
Mar-03 Sep-03 Mar-04 Sep-04 Mar-05 Sep-05 Mar-06 Sep-06 Mar-07 Sep-07 Mar-08
Blue Mountains Sydney RegionNSW AustraliaPoly. (Blue Mountains)
%
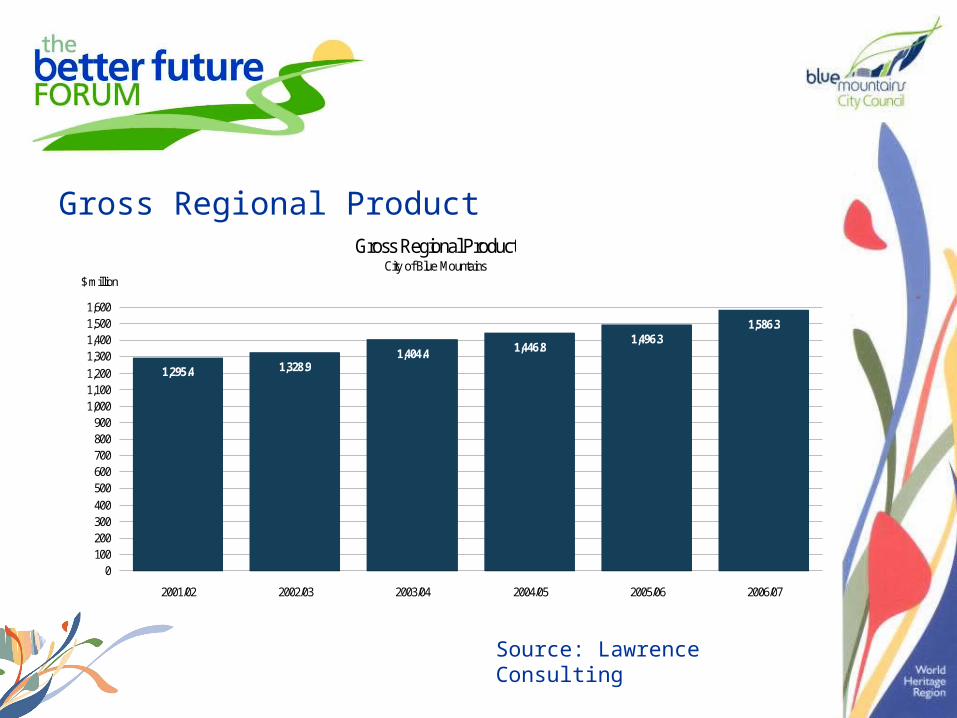
Gross Regional Product City of Blue Mountains
1,295.4 1,328.91,404.4 1,446.8
1,496.31,586.3
0100200300400500600700800900
1,0001,1001,2001,3001,4001,5001,600
2001/02 2002/03 2003/04 2004/05 2005/06 2006/07
$ million
Source: Lawrence Consulting
Gross Regional Product
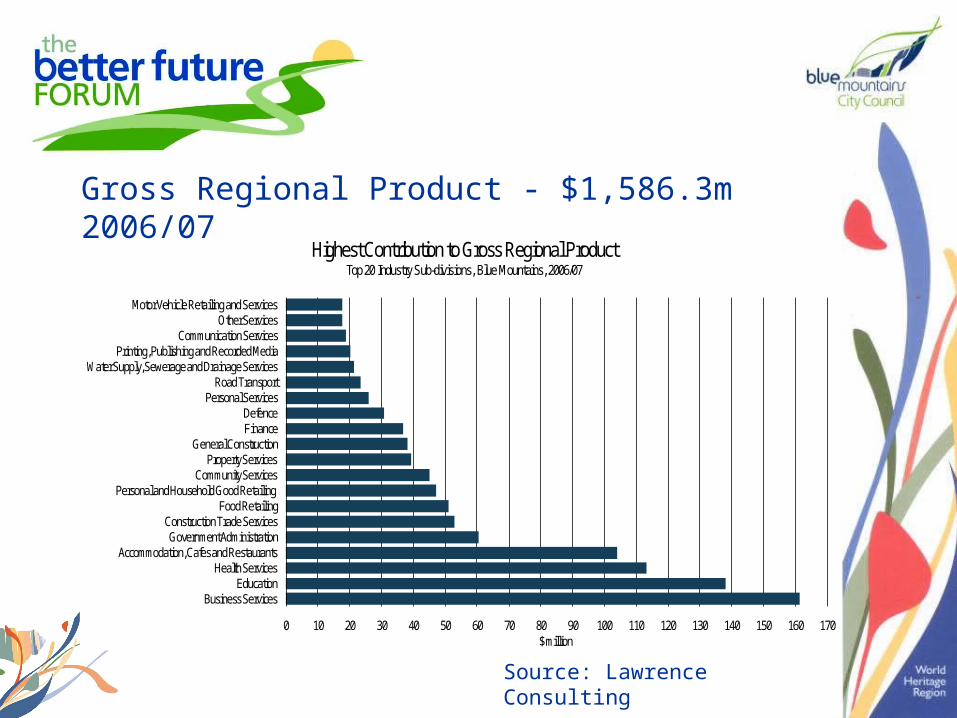
0 10 20 30 40 50 60 70 80 90 100 110 120 130 140 150 160 170
Business ServicesEducation
Health ServicesAccommodation, Cafes and Restaurants
Government AdministrationConstruction Trade Services
Food RetailingPersonal and Household Good Retailing
Community ServicesProperty Services
General ConstructionFinanceDefence
Personal ServicesRoad Transport
Water Supply, Sewerage and Drainage ServicesPrinting, Publishing and Recorded Media
Communication ServicesOther Services
Motor Vehicle Retailing and Services
$ million
Highest Contribution to Gross Regional Product Top 20 Industry Sub-divisions, Blue Mountains, 2006/07
Source: Lawrence Consulting
Gross Regional Product - $1,586.3m 2006/07
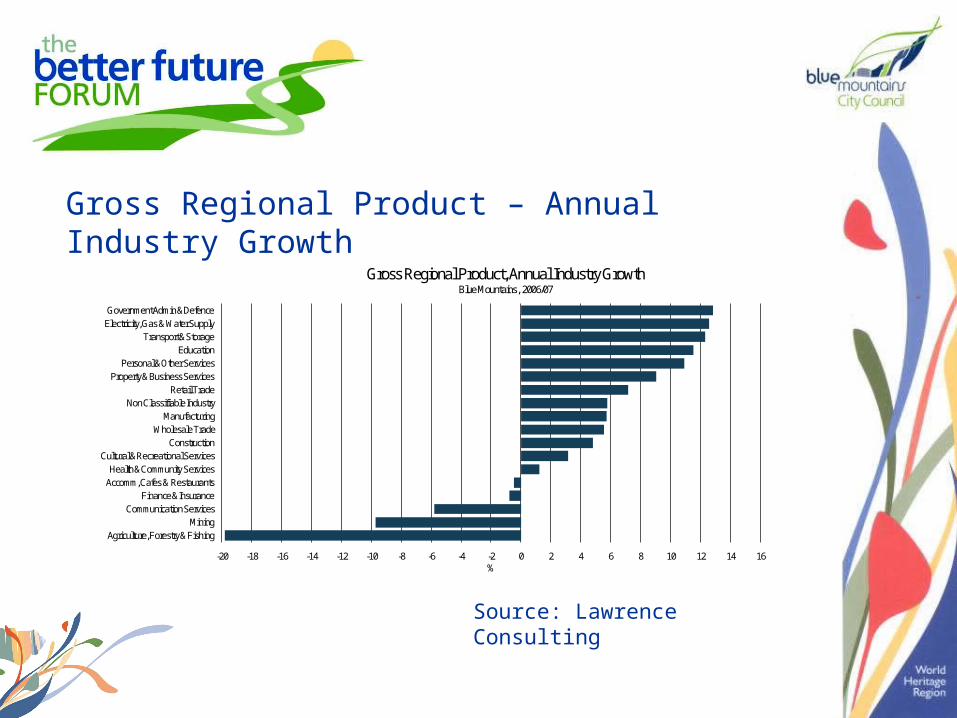
-20 -18 -16 -14 -12 -10 -8 -6 -4 -2 0 2 4 6 8 10 12 14 16
Agriculture, Forestry & FishingMining
Communication ServicesFinance & Insurance
Accomm, Cafes & RestaurantsHealth & Community Services
Cultural & Recreational ServicesConstruction
Wholesale TradeManufacturing
Non Classifiable IndustryRetail Trade
Property & Business ServicesPersonal & Other Services
EducationTransport & Storage
Electricity, Gas & Water SupplyGovernment Admin & Defence
%
Gross Regional Product, Annual Industry Growth Blue Mountains, 2006/07
Source: Lawrence Consulting
Gross Regional Product – Annual Industry Growth
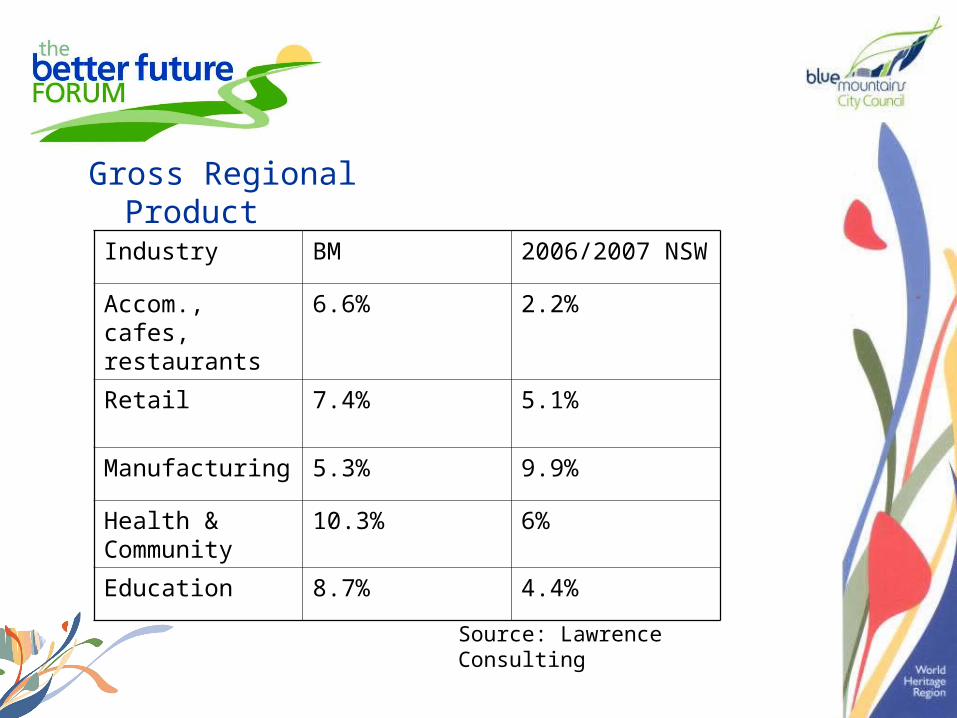
Gross Regional Product
Industry BM 2006/2007 NSW
Accom., cafes, restaurants
6.6% 2.2%
Retail 7.4% 5.1%
Manufacturing 5.3% 9.9%
Health & Community
10.3% 6%
Education 8.7% 4.4%
Source: Lawrence Consulting
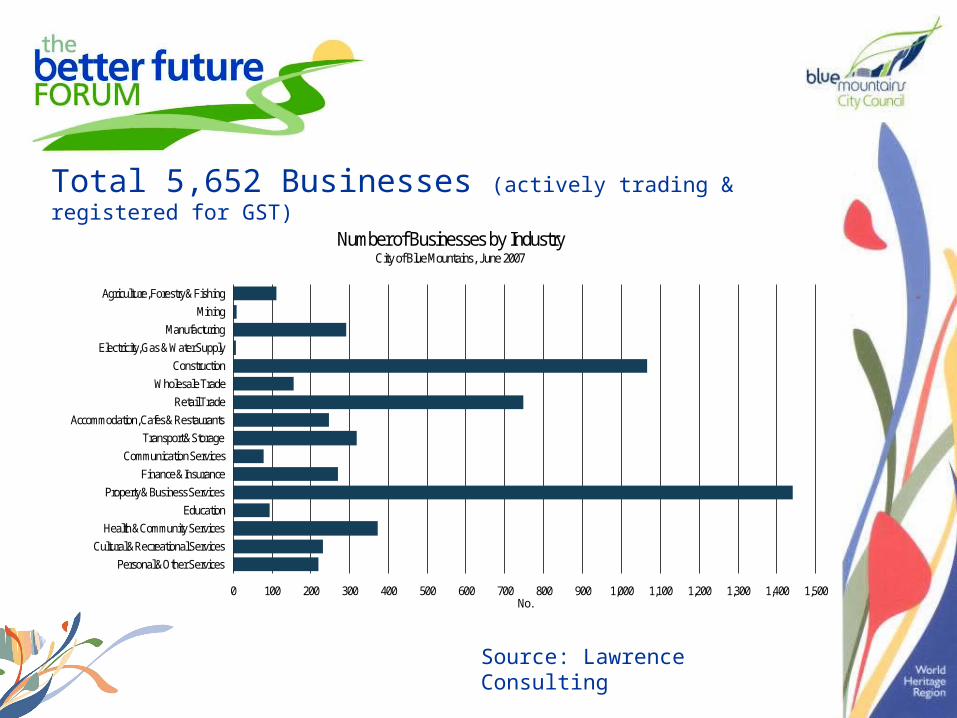
0 100 200 300 400 500 600 700 800 900 1,000 1,100 1,200 1,300 1,400 1,500
Personal & Other ServicesCultural & Recreational Services
Health & Community ServicesEducation
Property & Business ServicesFinance & Insurance
Communication ServicesTransport & Storage
Accommodation, Cafes & RestaurantsRetail Trade
Wholesale TradeConstruction
Electricity, Gas & Water SupplyManufacturing
MiningAgriculture, Forestry & Fishing
No.
Number of Businesses by Industry City of Blue Mountains, June 2007
Total 5,652 Businesses (actively trading & registered for GST)
Source: Lawrence Consulting
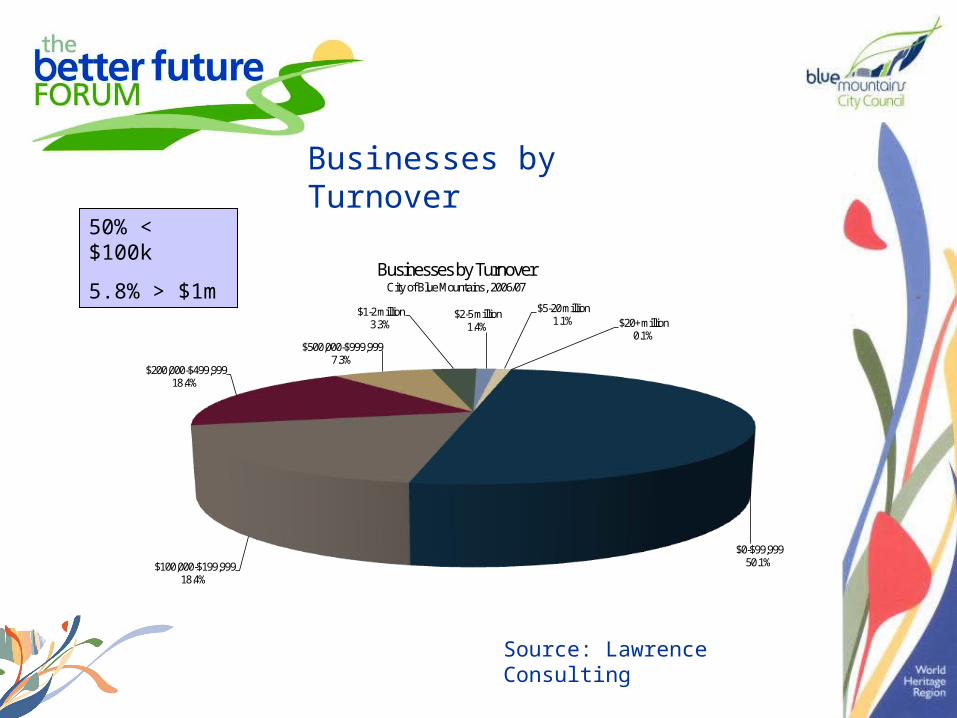
$0-$99,99950.1%$100,000-$199,999
18.4%
$200,000-$499,99918.4%
$500,000-$999,9997.3%
$1-2 million3.3%
$2-5 million1.4%
$5-20 million1.1% $20+ million
0.1%
Businesses by Turnover City of Blue Mountains, 2006/07
Source: Lawrence Consulting
Businesses by Turnover
50% < $100k
5.8% > $1m
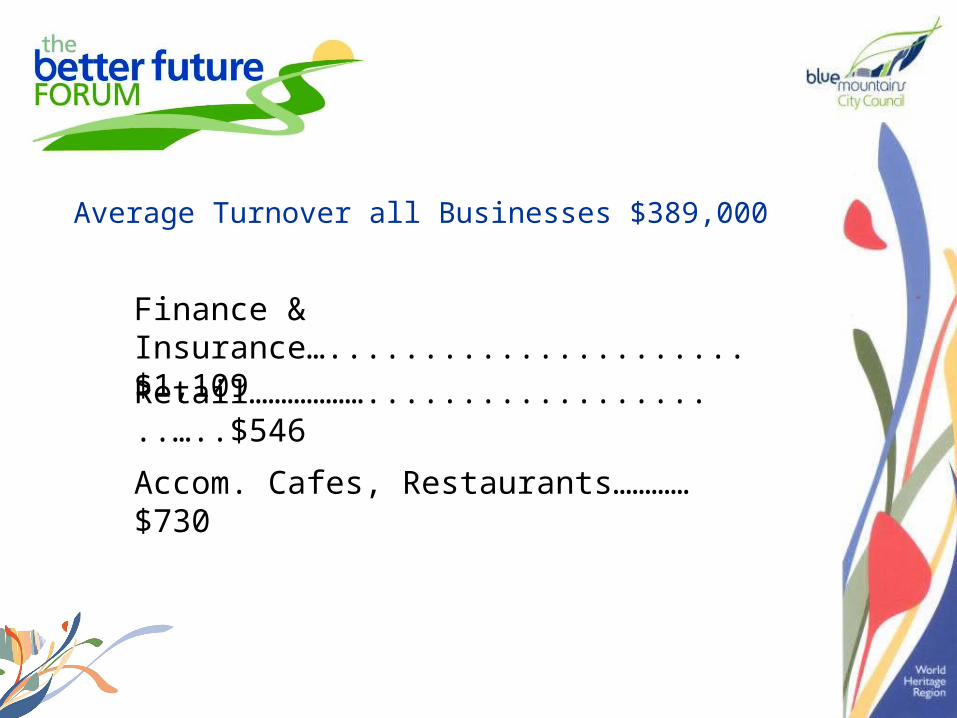
Average Turnover all Businesses $389,000
Finance & Insurance…......................$1,109
Retail………………....................…..$546
Accom. Cafes, Restaurants…………$730
Non employing59.3%
0-428.6%
5-199.6%
20-49 1.7%
50-990.6%
100-199 0.2% 200+
0.1%
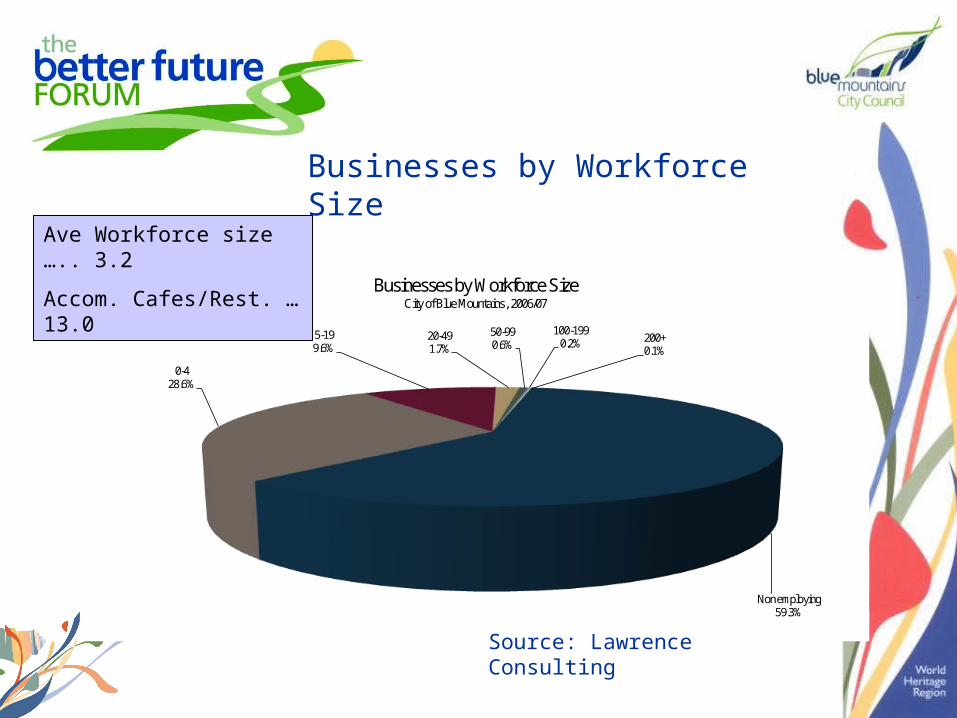
Businesses by Workforce Size City of Blue Mountains, 2006/07
Source: Lawrence Consulting
Businesses by Workforce Size
Ave Workforce size ….. 3.2
Accom. Cafes/Rest. …13.0
0.992
0.905
0.875
0.830
0.745
0.725
0.717
0.716
0.701
0.692
0.670
0.639
0.630
0.509
0.487
0.474
0.148
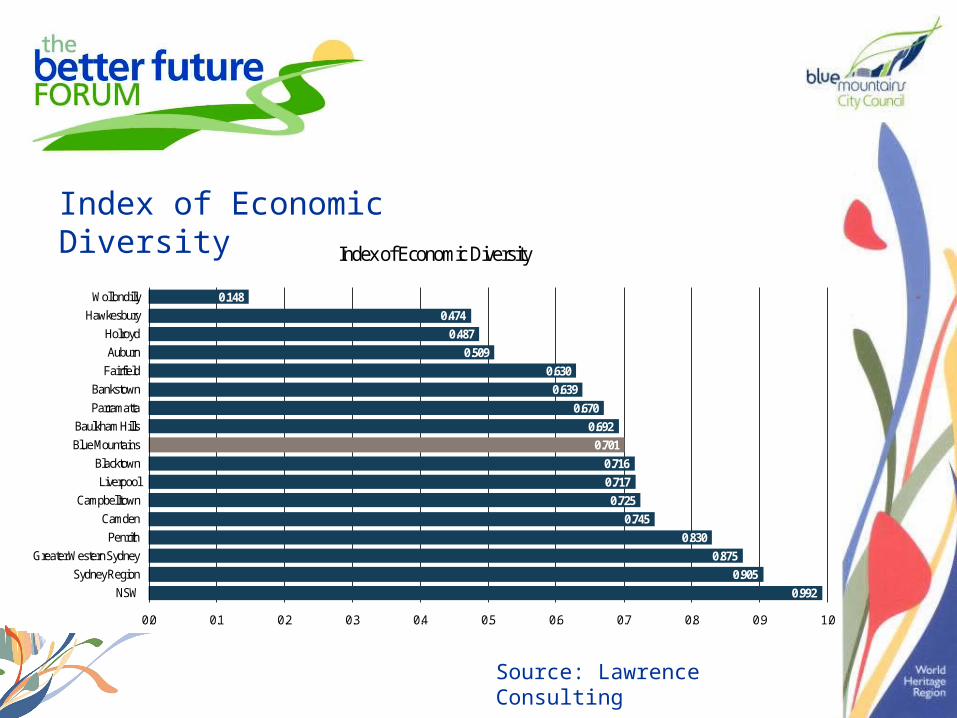
0.0 0.1 0.2 0.3 0.4 0.5 0.6 0.7 0.8 0.9 1.0
NSWSydney Region
Greater Western SydneyPenrith
CamdenCampbelltown
LiverpoolBlacktown
Blue MountainsBaulkham Hills
ParramattaBankstown
FairfieldAuburnHolroyd
HawkesburyWollondilly
Index of Economic Diversity
Source: Lawrence Consulting
Index of Economic Diversity
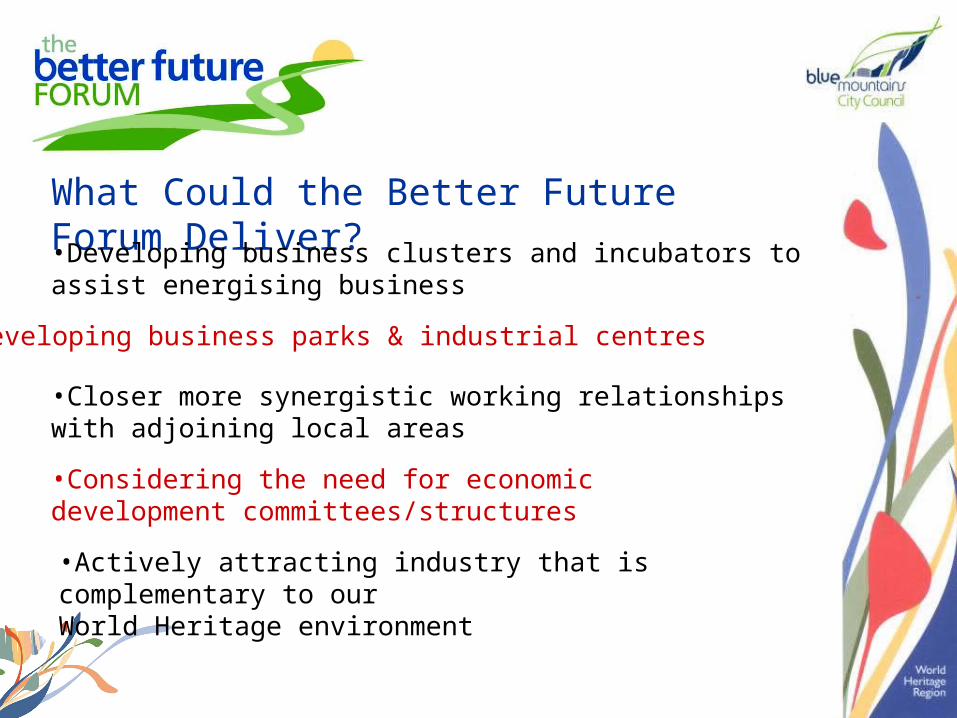
What Could the Better Future Forum Deliver?
•Developing business parks & industrial centres
•Closer more synergistic working relationships with adjoining local areas
•Actively attracting industry that is complementary to ourWorld Heritage environment
•Developing business clusters and incubators to assist energising business
•Considering the need for economic development committees/structures
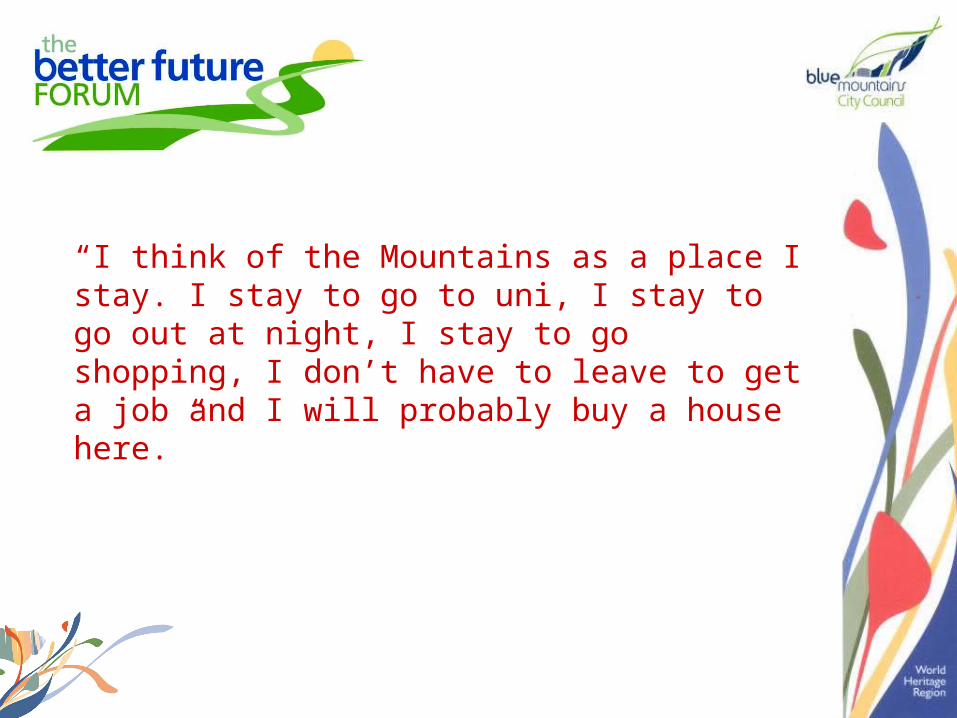
“I think of the Mountains as a place I stay. I stay to go to uni, I stay to go out at night, I stay to go shopping, I don’t have to leave to get a job and I will probably buy a house here.”