Embed Size (px)
Citation preview
28th
Financial Analysts &
Institutional Investors Meet
21st August 2018
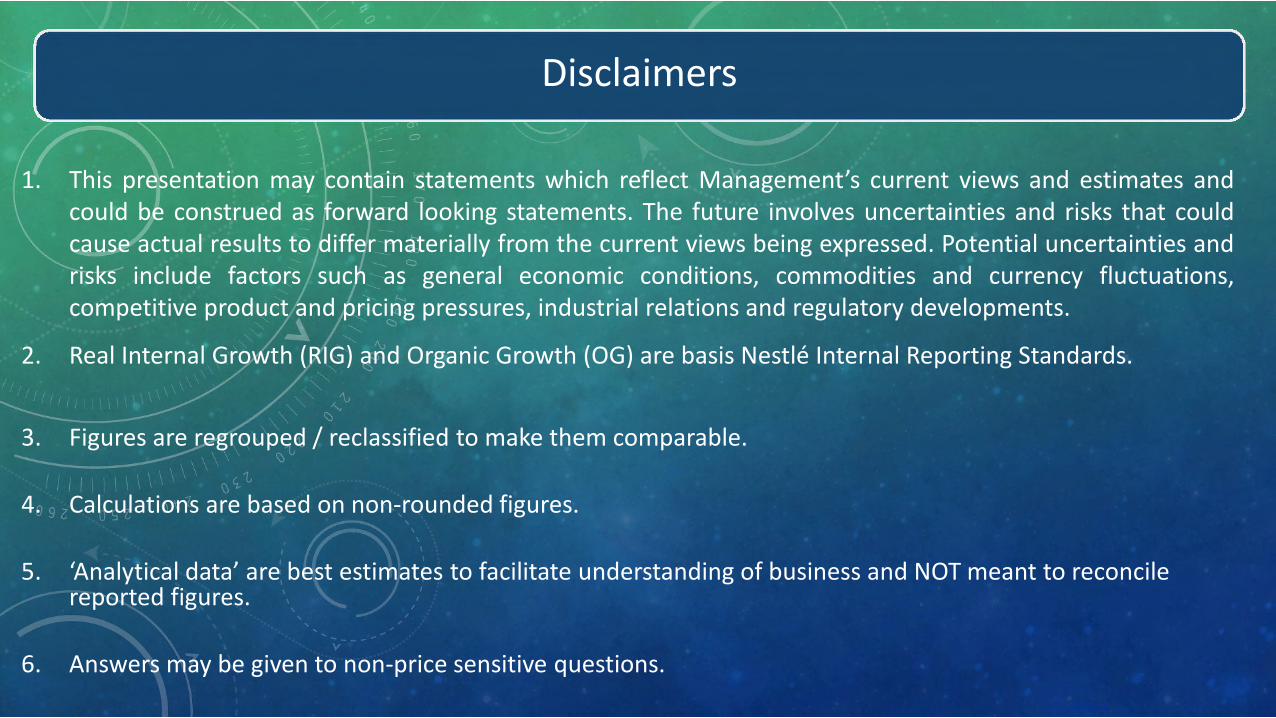
Disclaimers
1. This presentation may contain statements which reflect Management’s current views and estimates and could be construed as forward looking statements. The future involves uncertainties and risks that could cause actual results to differ materially from the current views being expressed. Potential uncertainties and risks include factors such as general economic conditions, commodities and currency fluctuations, competitive product and pricing pressures, industrial relations and regulatory developments.
2. Real Internal Growth (RIG) and Organic Growth (OG) are basis Nestlé Internal Reporting Standards.
3. Figures are regrouped / reclassified to make them comparable.
4. Calculations are based on non-rounded figures.
5. ‘Analytical data’ are best estimates to facilitate understanding of business and NOT meant to reconcile reported figures.
6. Answers may be given to non-price sensitive questions. Slide 2

Committed to a Healthier Future (15:30 hrs): Suresh Narayanan
Financial Highlights & Nestlé Business Excellence (16:20 hrs): Shobinder Duggal
Q&A (17:00 – 17:45 hrs)
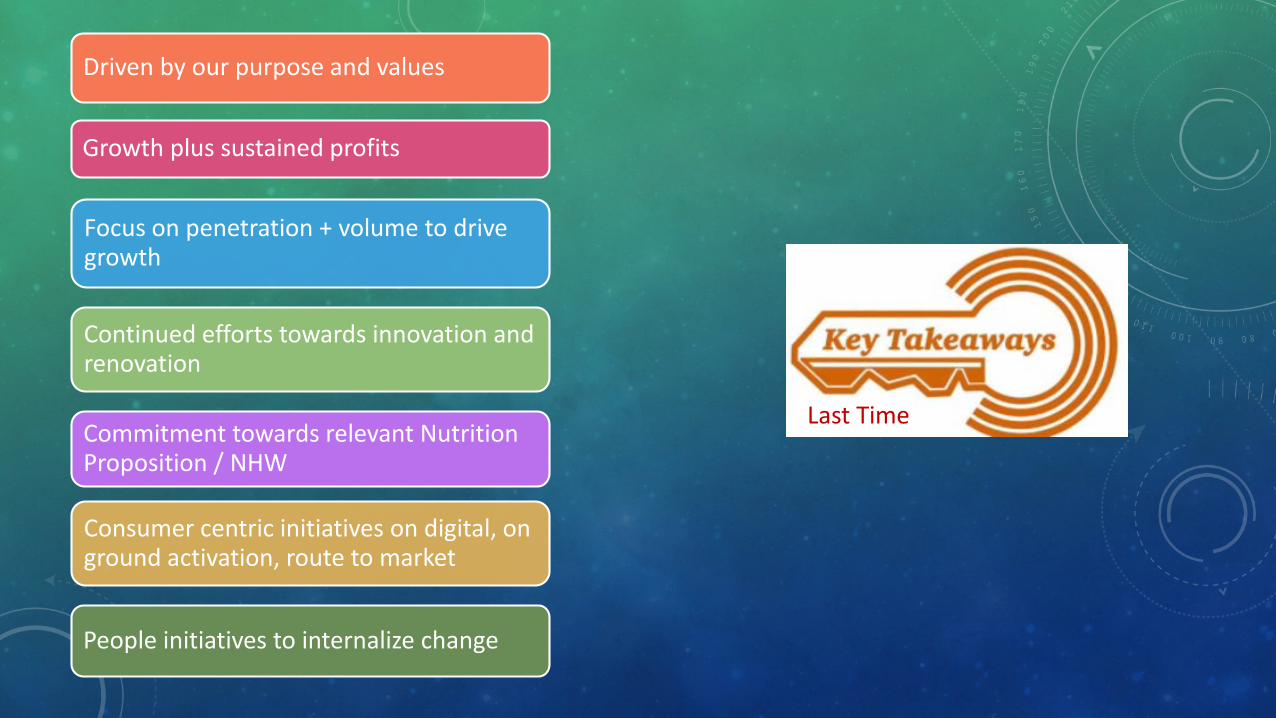
Last Time
Driven by our purpose and values
Growth plus sustained profits
Focus on penetration + volume to drive growth
Continued efforts towards innovation and renovation
Consumer centric initiatives on digital, on ground activation, route to market
Commitment towards relevant Nutrition Proposition / NHW
People initiatives to internalize change
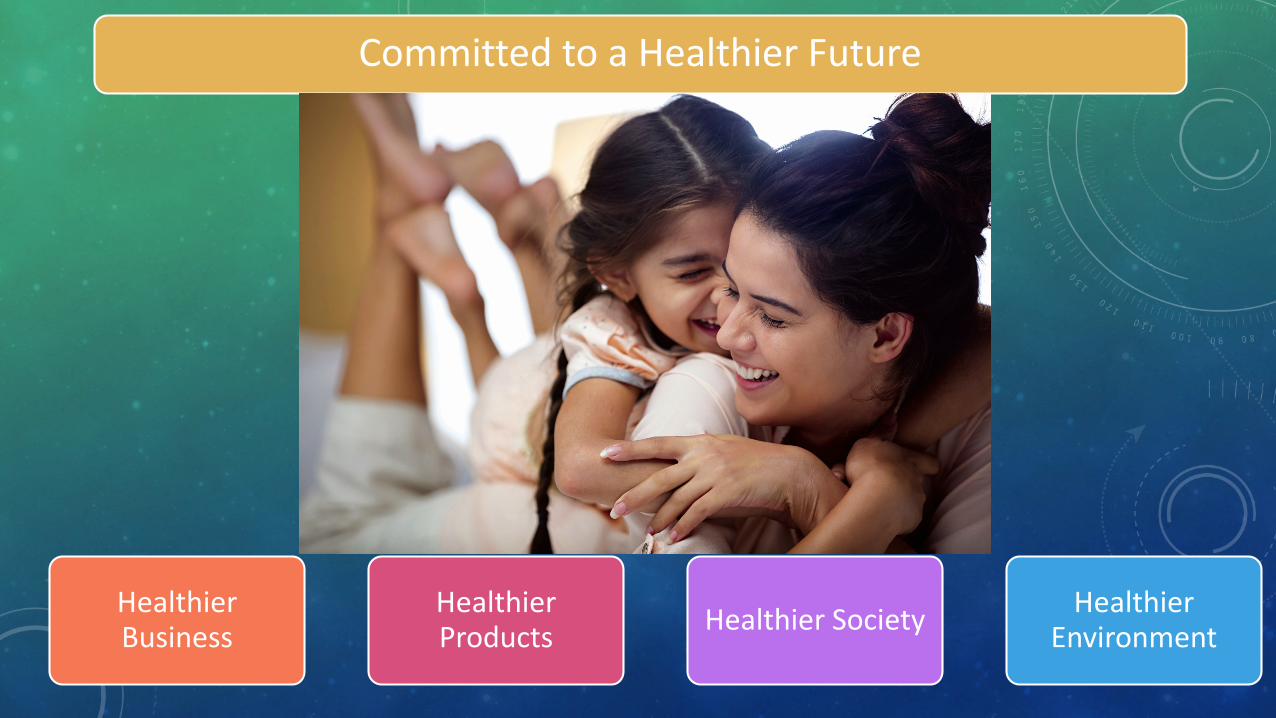
Healthier Business
Healthier Products Healthier Society Healthier
Environment
Committed to a Healthier Future
Healthier Business and Healthier
Products

Where Are We Today?
Largest listed F&B
Company in India
Third Largest
FMCG by Market Cap
Innovation As a strong GROWTH
foundation
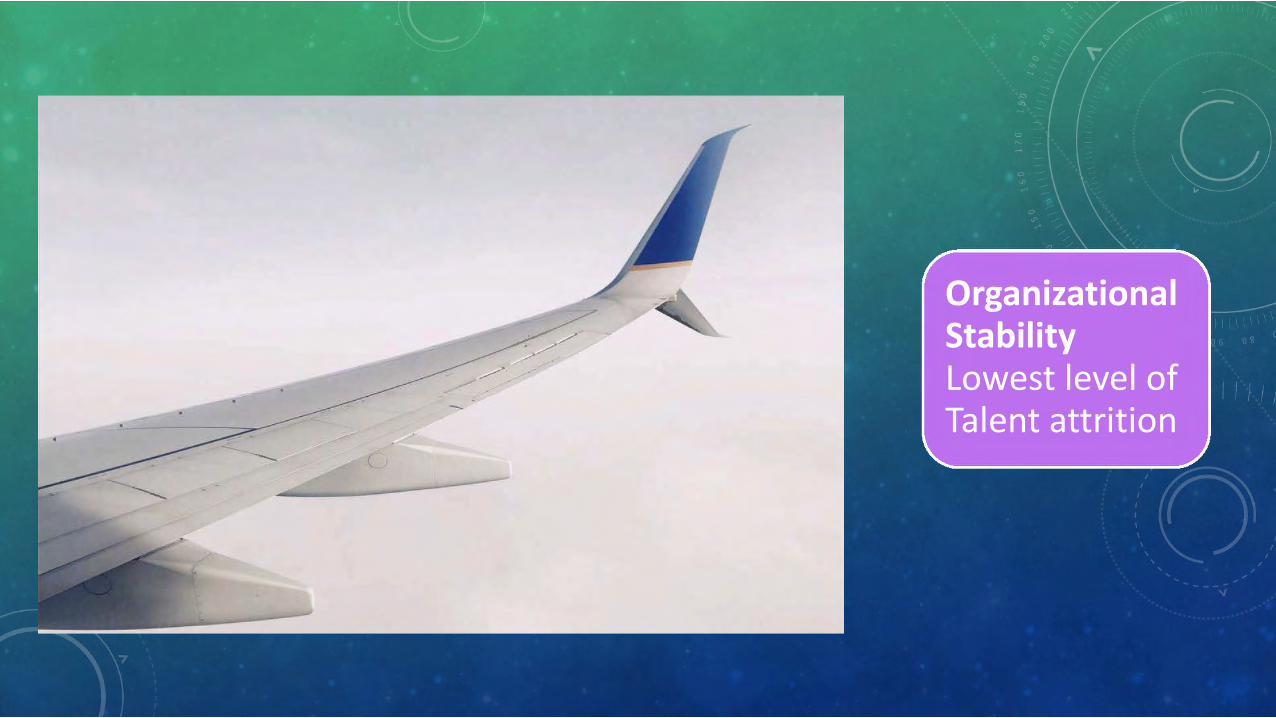
Organizational Stability Lowest level of Talent attrition
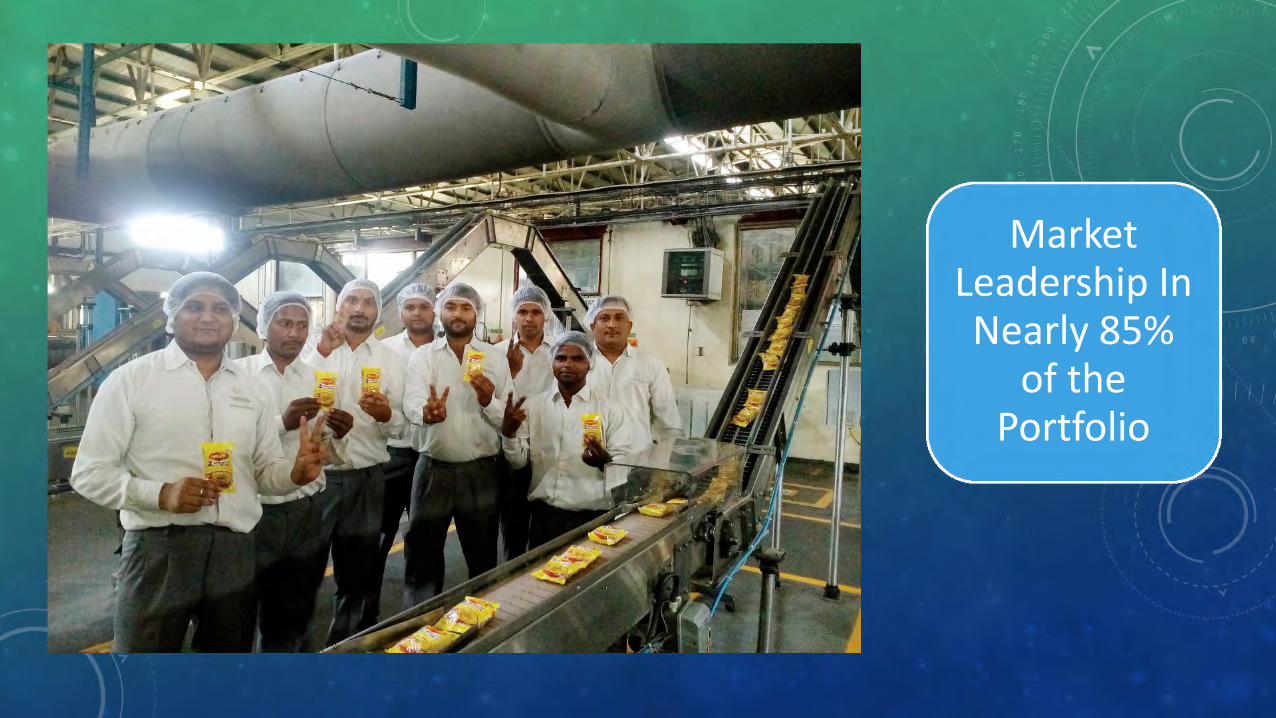
Market Leadership In Nearly 85%
of the Portfolio
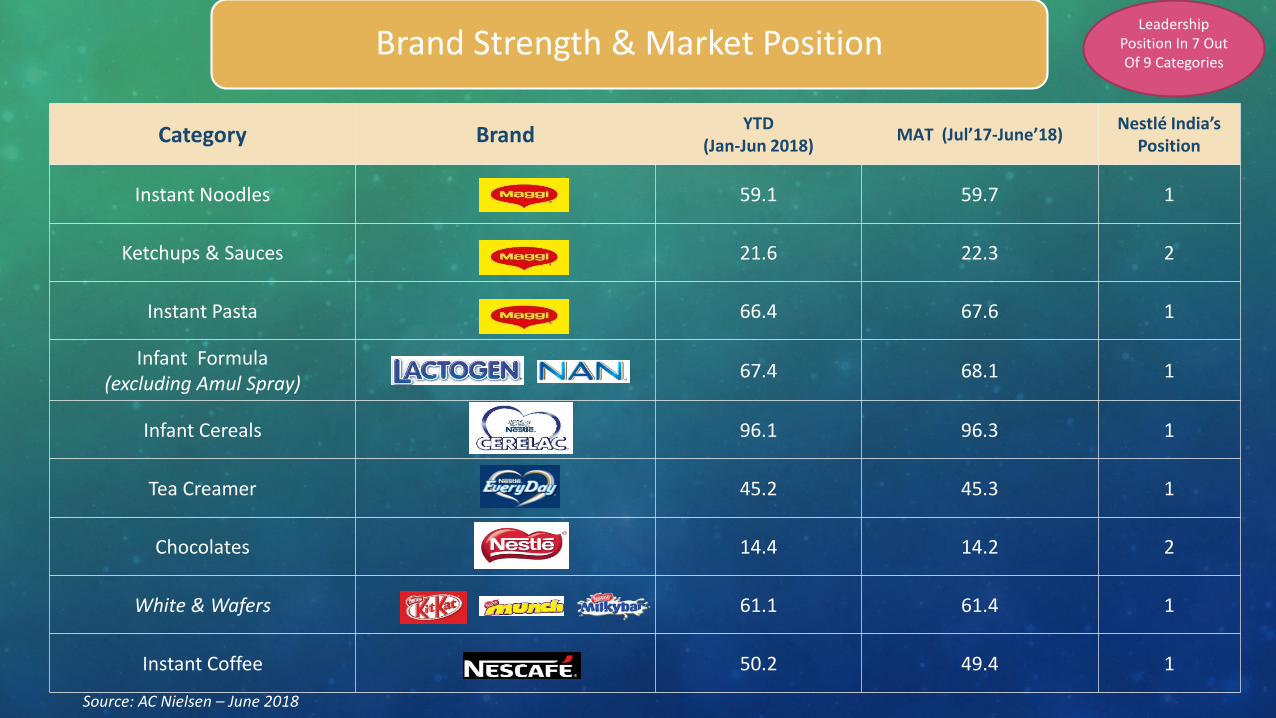
Category Brand YTD (Jan-Jun 2018) MAT (Jul’17-June’18) Nestlé India’s
Position
Instant Noodles 59.1 59.7 1
Ketchups & Sauces 21.6 22.3 2
Instant Pasta 66.4 67.6 1
Infant Formula (excluding Amul Spray) 67.4 68.1 1
Infant Cereals 96.1 96.3 1
Tea Creamer 45.2 45.3 1
Chocolates 14.4 14.2 2
White & Wafers 61.1 61.4 1
Instant Coffee 50.2 49.4 1
Brand Strength & Market Position
Source: AC Nielsen – June 2018
Leadership Position In 7 Out Of 9 Categories
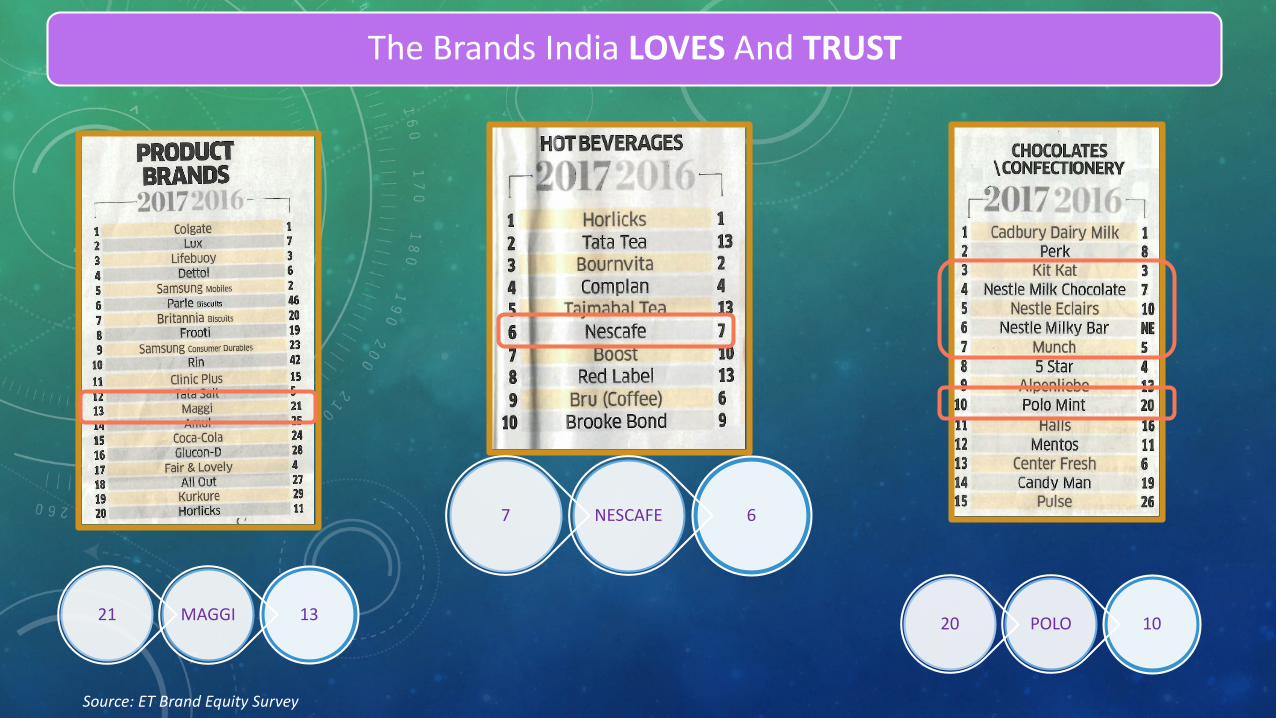
The Brands India LOVES And TRUST
13MAGGI21
6NESCAFE7
10POLO20
Source: ET Brand Equity Survey
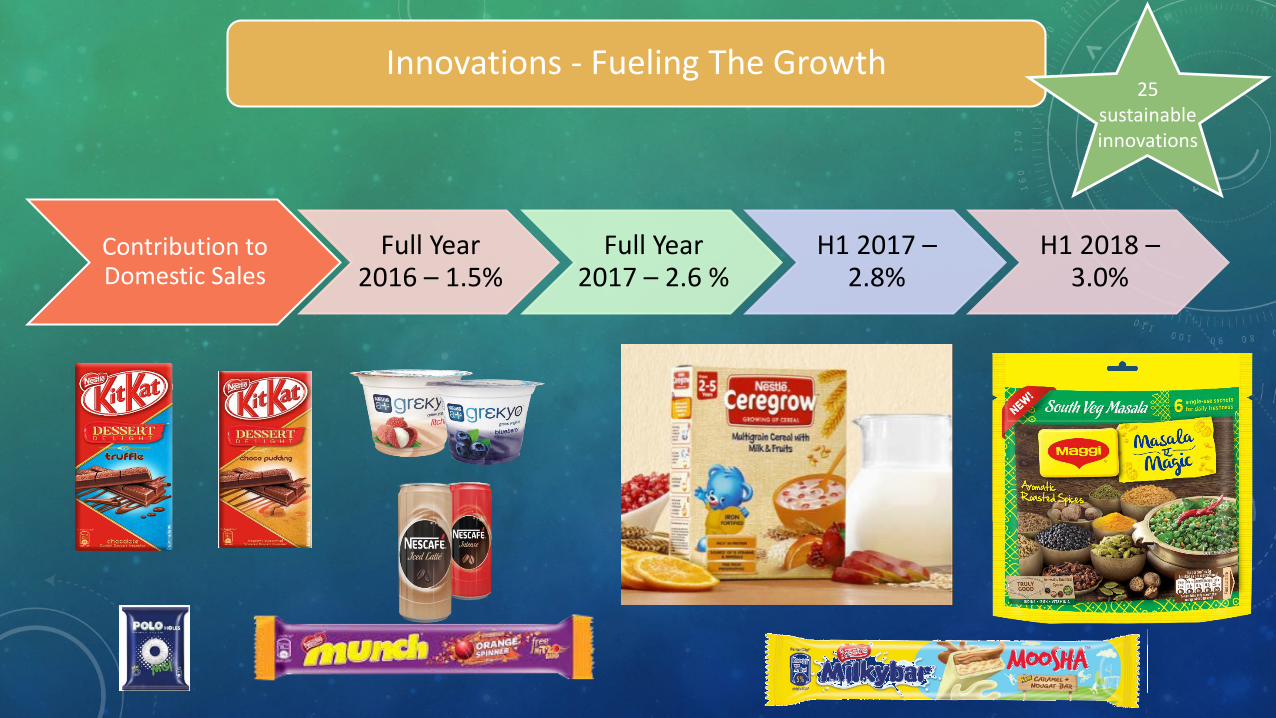
Innovations - Fueling The Growth
Contribution to Domestic Sales
Full Year 2016 – 1.5%
Full Year 2017 – 2.6 %
H1 2017 –2.8%
H1 2018 –3.0%
25 sustainable innovations
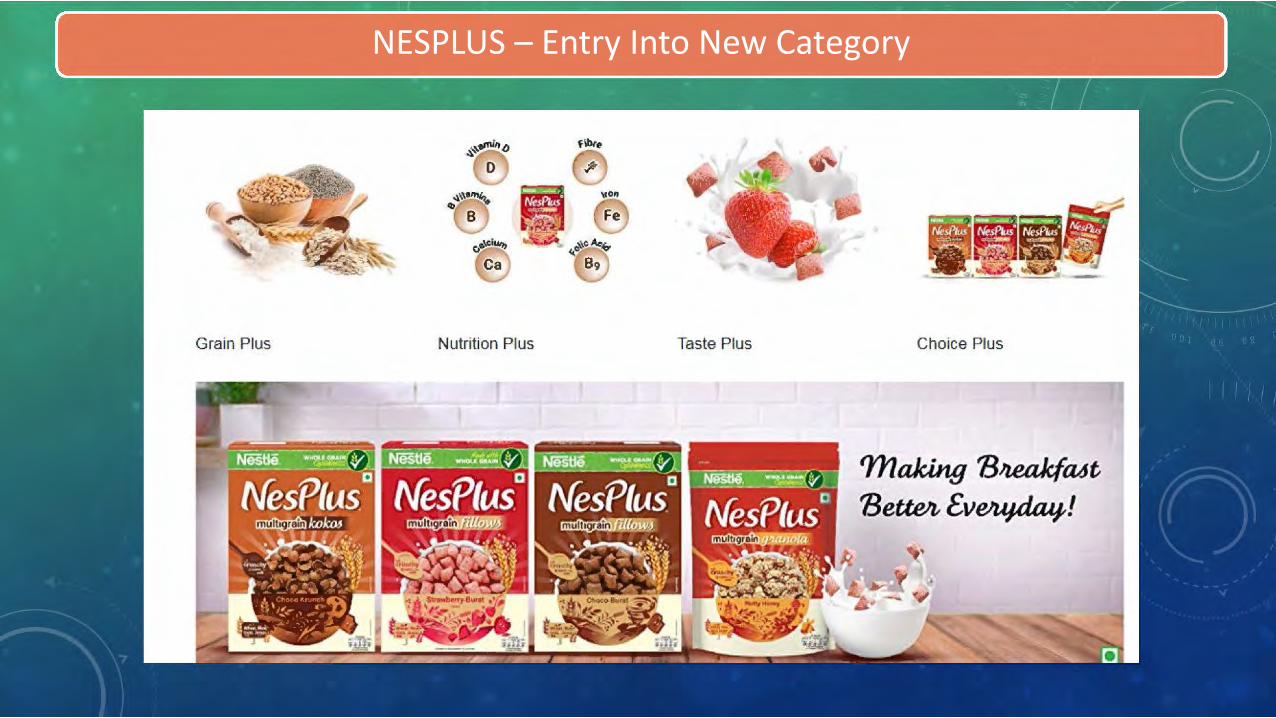
NESPLUS – Entry Into New Category
Grain Pfus Nutrition Plus Taste Pl:us Choice Plus
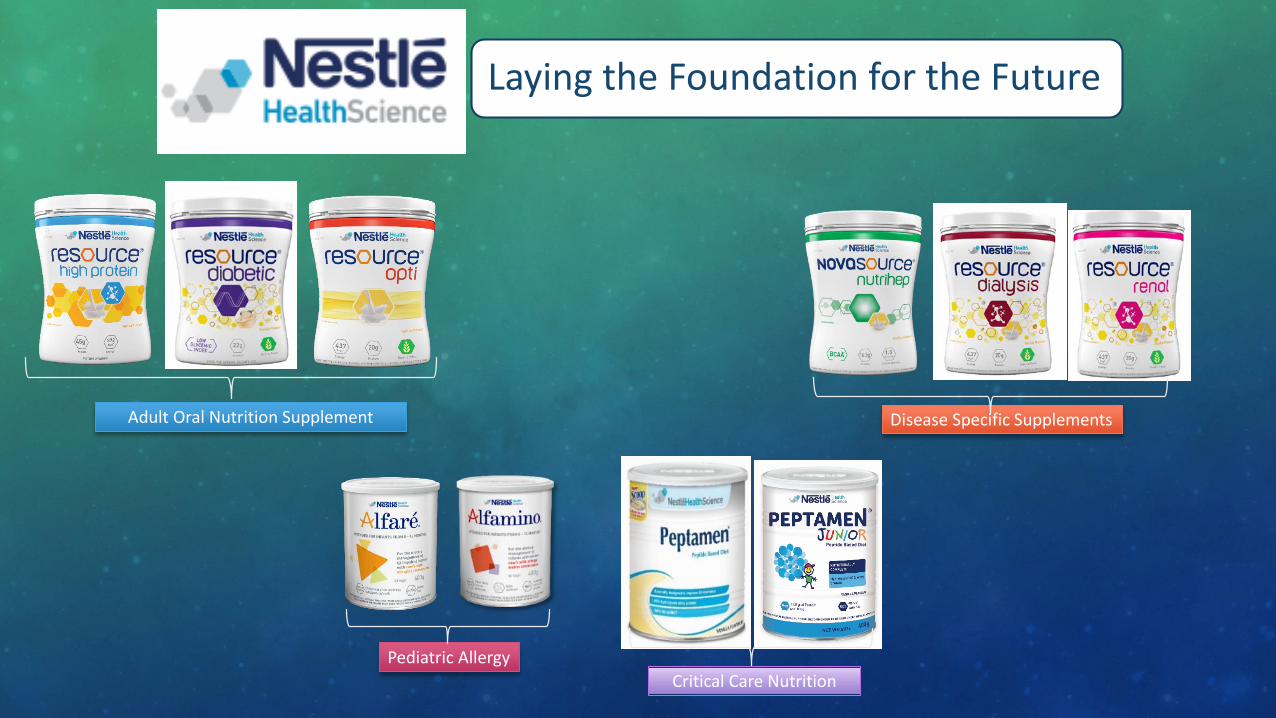
Critical Care Nutrition
Adult Oral Nutrition Supplement
Pediatric Allergy
Disease Specific Supplements
Laying the Foundation for the Future
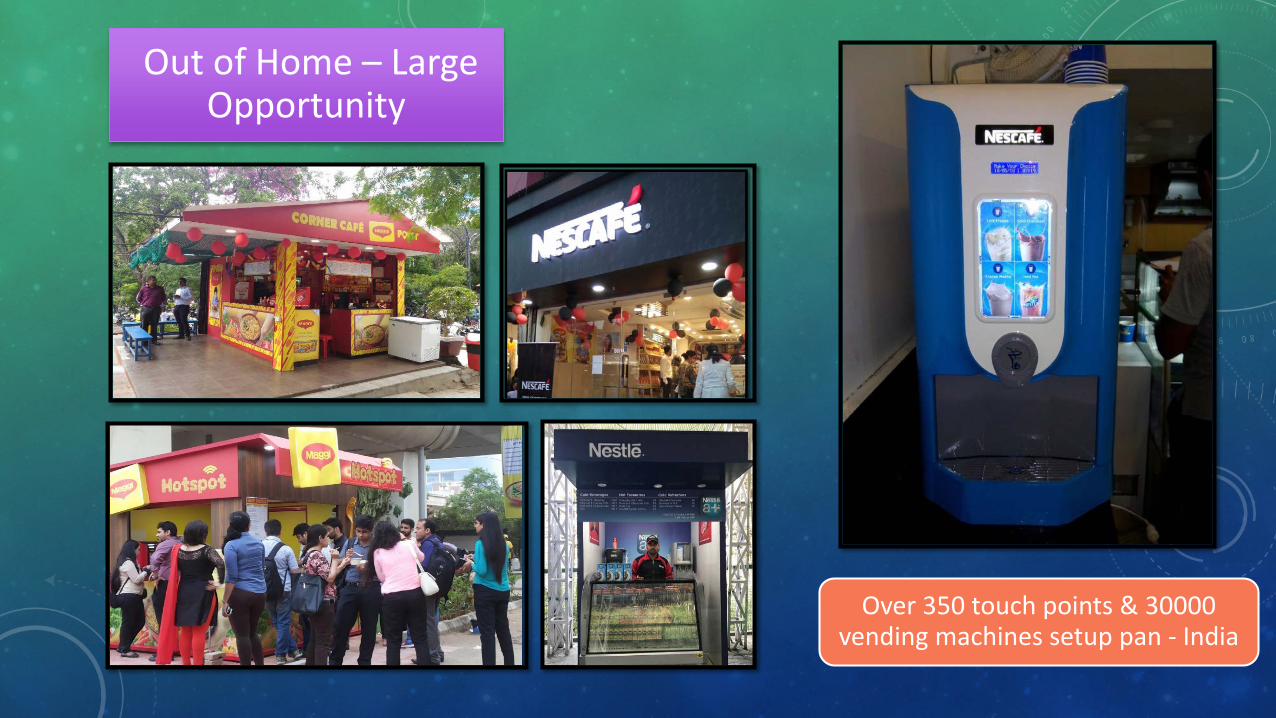
Out of Home – Large Opportunity
Over 350 touch points & 30000 vending machines setup pan - India
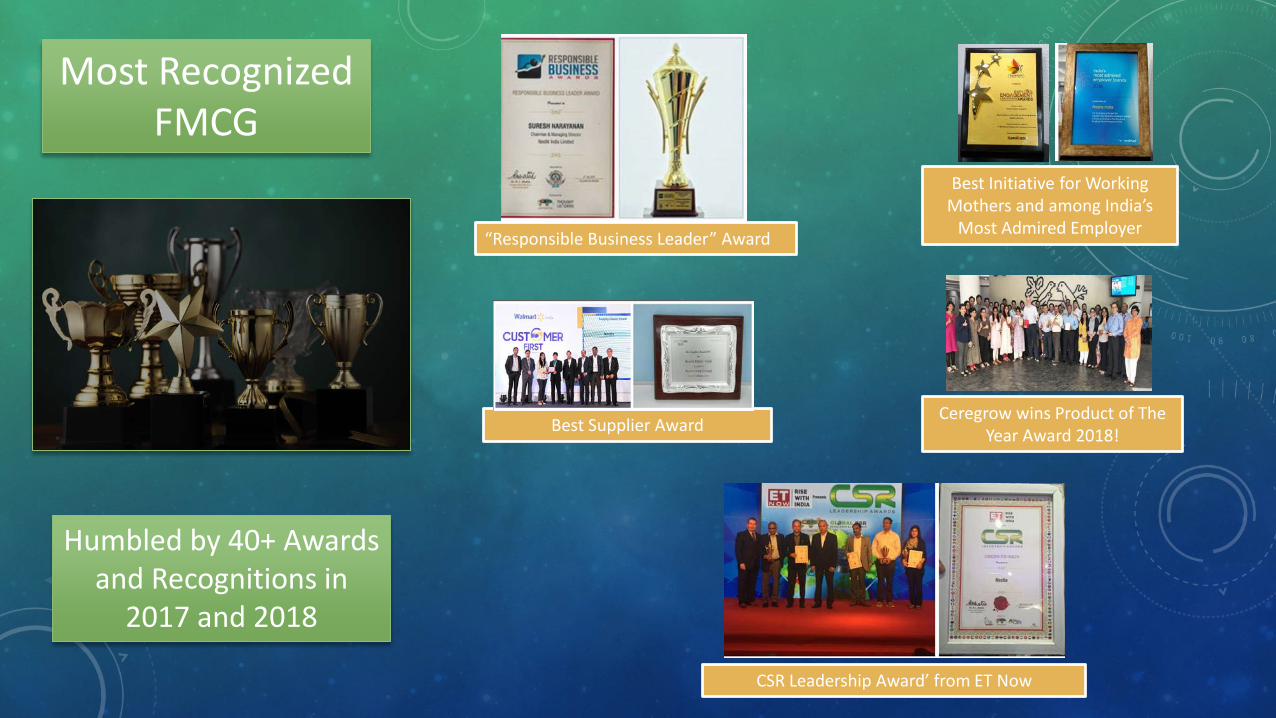
Ceregrow wins Product of The Year Award 2018!
Best Initiative for Working Mothers and among India’s
Most Admired Employer
Best Supplier Award
Most Recognized FMCG
Humbled by 40+ Awards and Recognitions in
2017 and 2018
“Responsible Business Leader” Award
CSR Leadership Award’ from ET Now

Double Digit Growth
SUN
. (,) "
::,... MON
f-. / TUE / -WED 1H CALENDAR
- _,_ I -~IJ FRI J • 2 1. I - - - I ~T I
- ·f- 3 ~ - -1
r ] 8 I -1- 4 / I ,j, , -- - '- - 9 I -...;_,t--.l 1 _..,.
- 1 10 ' ......... I !4-l. 15 I - 1" - - ,, . 12 I L
~ 1 16 I • -
21 I - ; .JJ 18 J- 22
2 ,g ,
- 3 1 I 24 1- 25
30 --
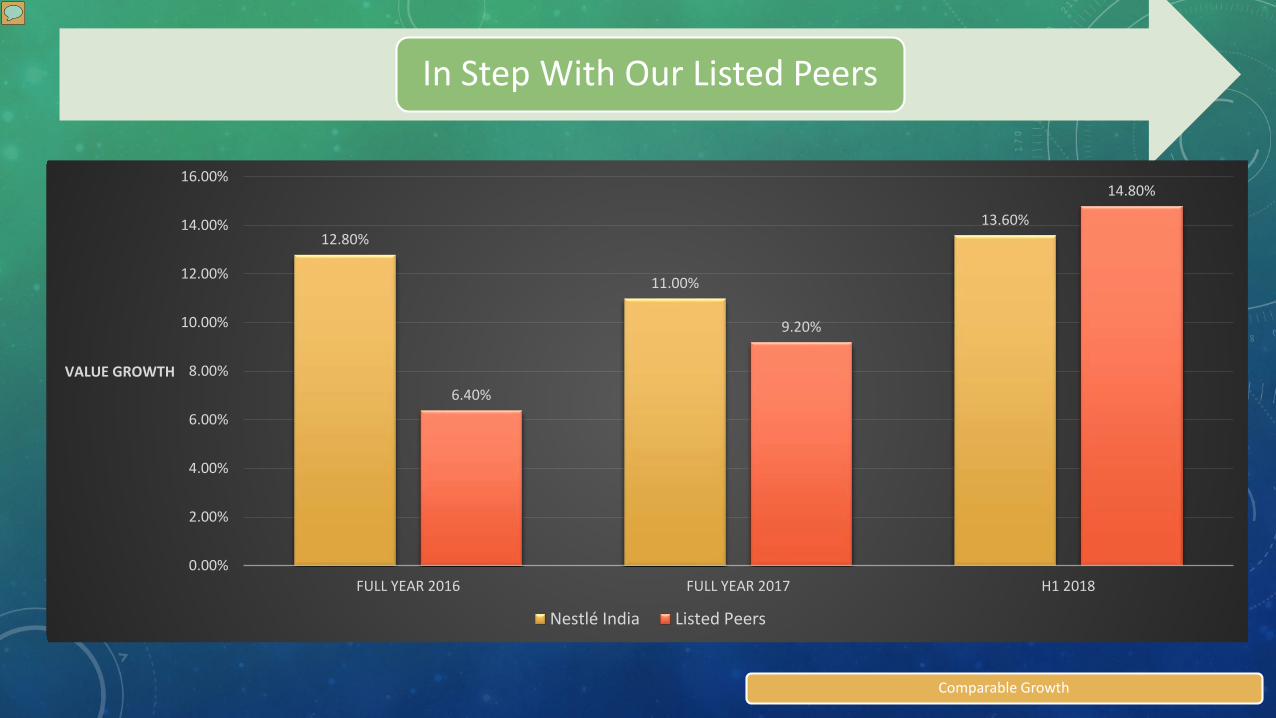
In Step With Our Listed Peers
12.80%
11.00%
13.60%
6.40%
9.20%
14.80%
0.00%
2.00%
4.00%
6.00%
8.00%
10.00%
12.00%
14.00%
16.00%
FULL YEAR 2016 FULL YEAR 2017 H1 2018
VALUE GROWTH
Nestlé India Listed Peers
Comparable Growth
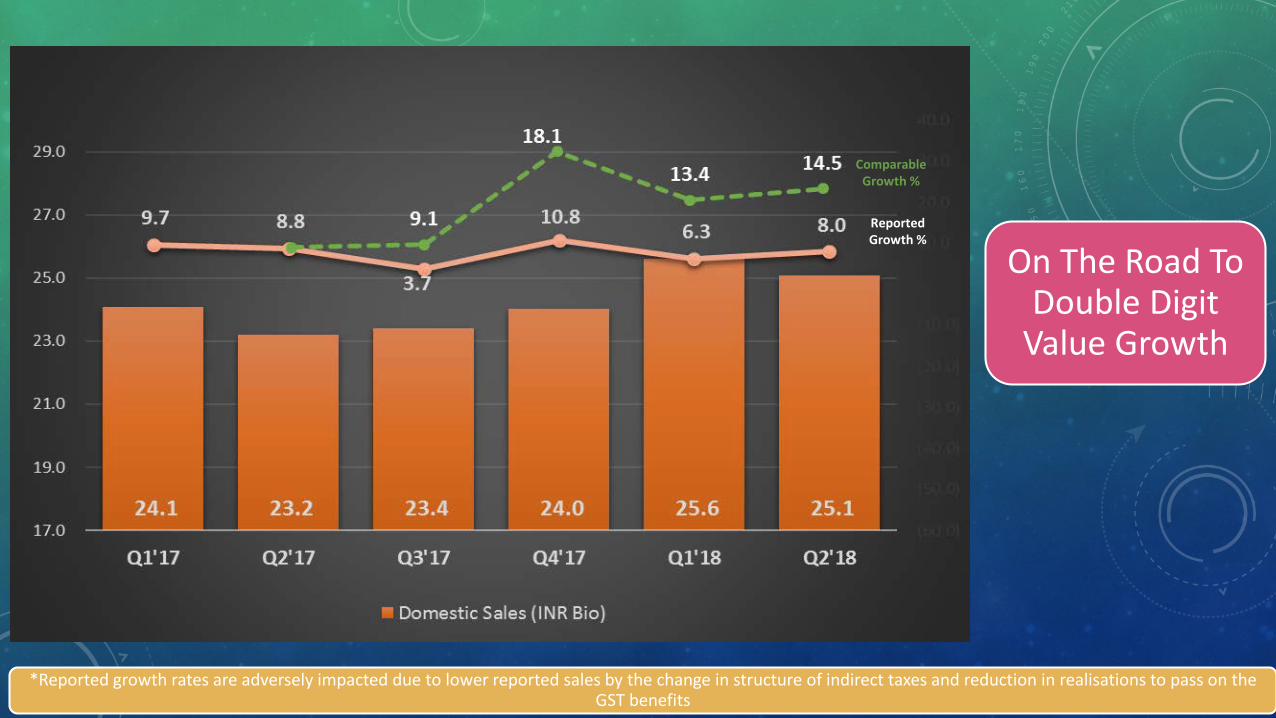
On The Road To Double Digit
Value Growth
*Reported growth rates are adversely impacted due to lower reported sales by the change in structure of indirect taxes and reduction in realisations to pass on the GST benefits
Reported Growth %
Comparable Growth %
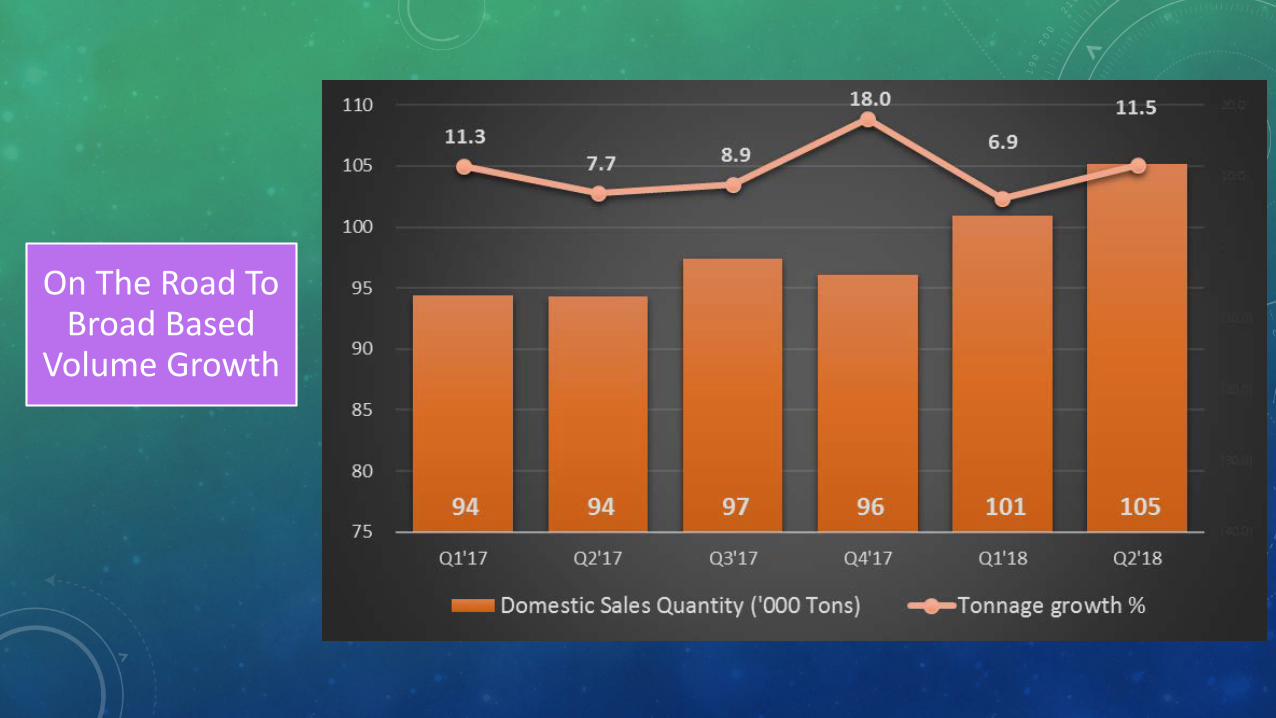
On The Road To Broad Based
Volume Growth
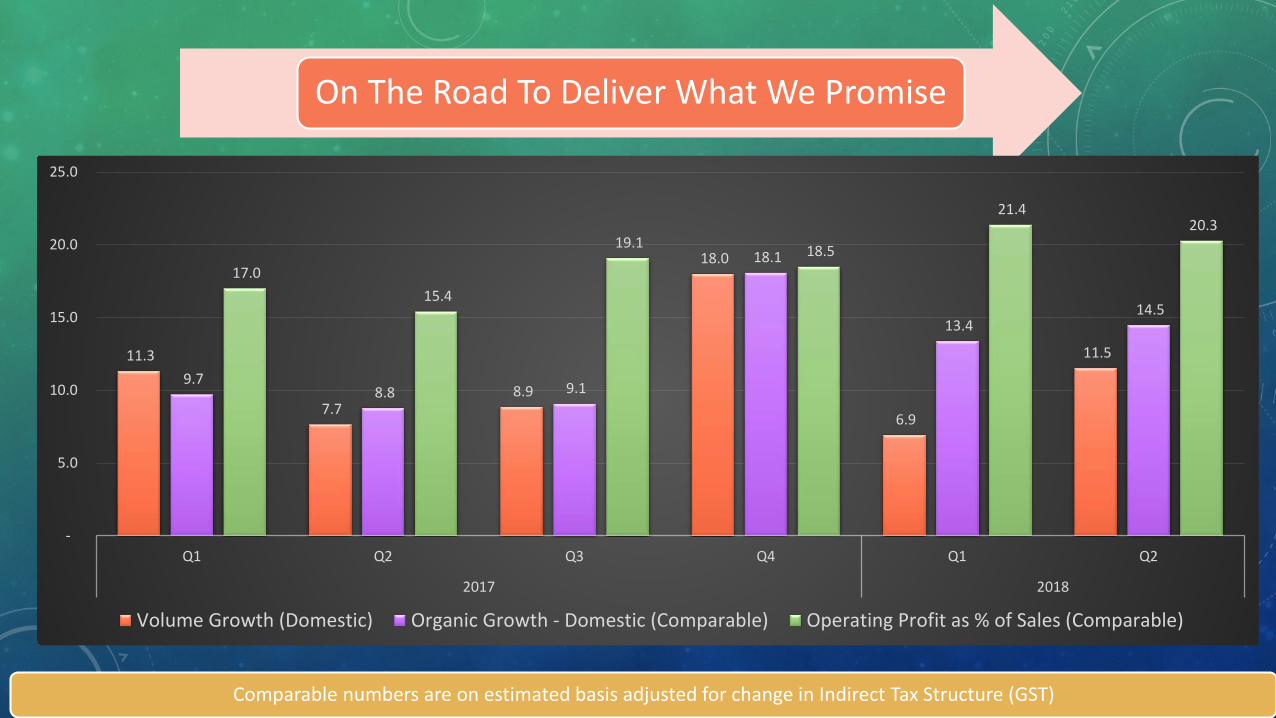
On The Road To Deliver What We Promise
Comparable numbers are on estimated basis adjusted for change in Indirect Tax Structure (GST)
11.3
7.7 8.9
18.0
6.9
11.5
9.7 8.8 9.1
18.1
13.4 14.5
17.0 15.4
19.1 18.5
21.4 20.3
-
5.0
10.0
15.0
20.0
25.0
Q1 Q2 Q3 Q4 Q1 Q2
2017 2018
Volume Growth (Domestic) Organic Growth - Domestic (Comparable) Operating Profit as % of Sales (Comparable)
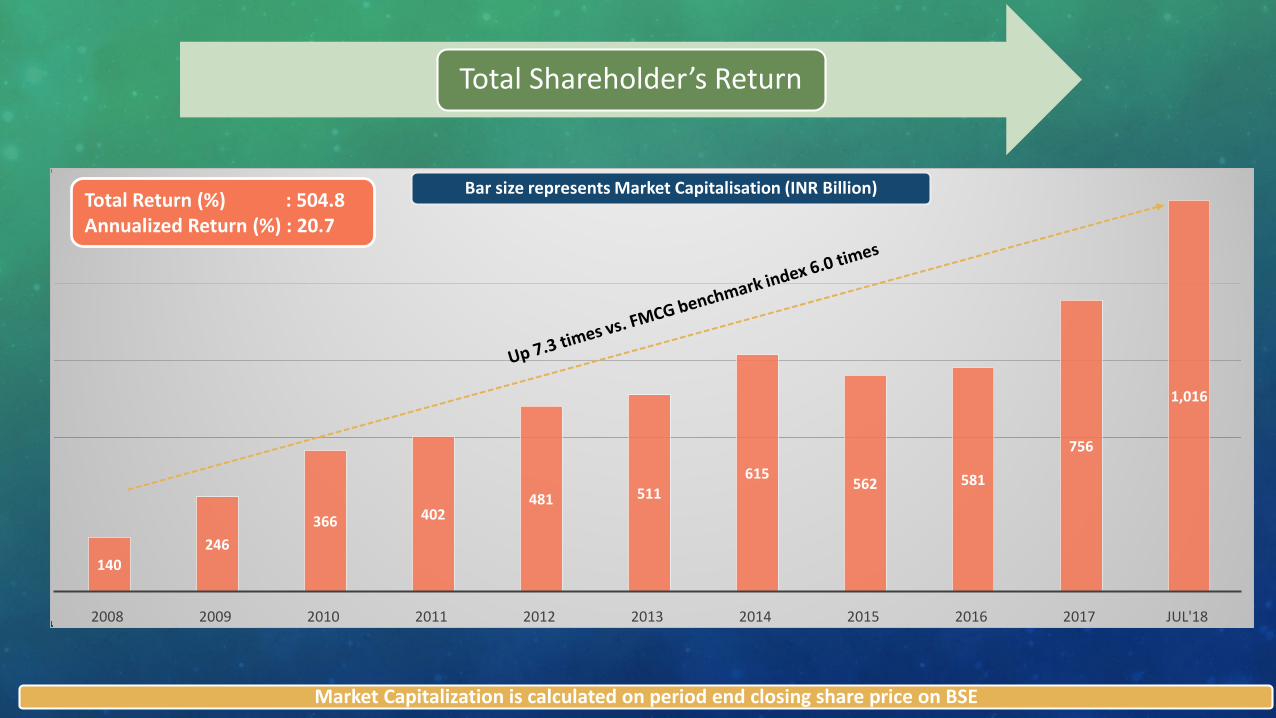
140246
366 402481 511
615562 581
756
1,016
2008 2009 2010 2011 2012 2013 2014 2015 2016 2017 JUL'18
Bar size represents Market Capitalisation (INR Billion)
Market Capitalization is calculated on period end closing share price on BSE
Total Return (%) : 504.8Annualized Return (%) : 20.7
Total Shareholder’s Return

ENCORE
ONCE MORE !

MakingIt Happen
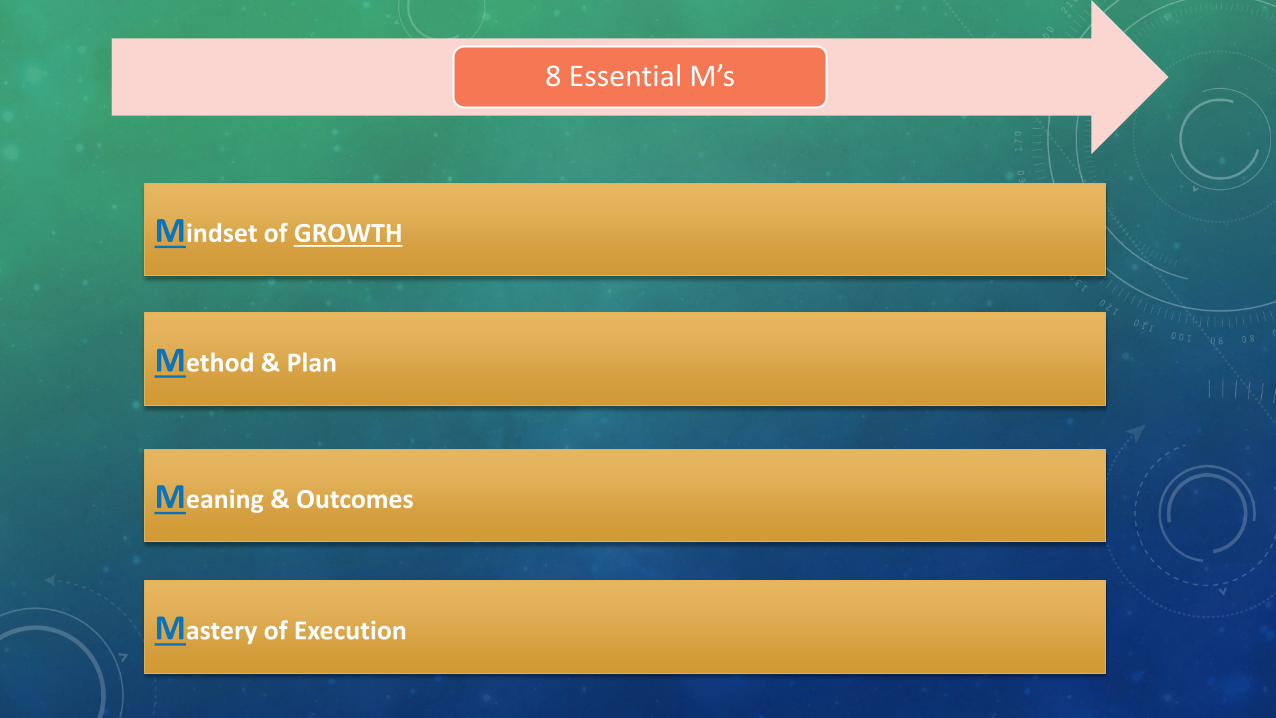
Method & Plan
Mindset of GROWTH
Meaning & Outcomes
Mastery of Execution
8 Essential M’s
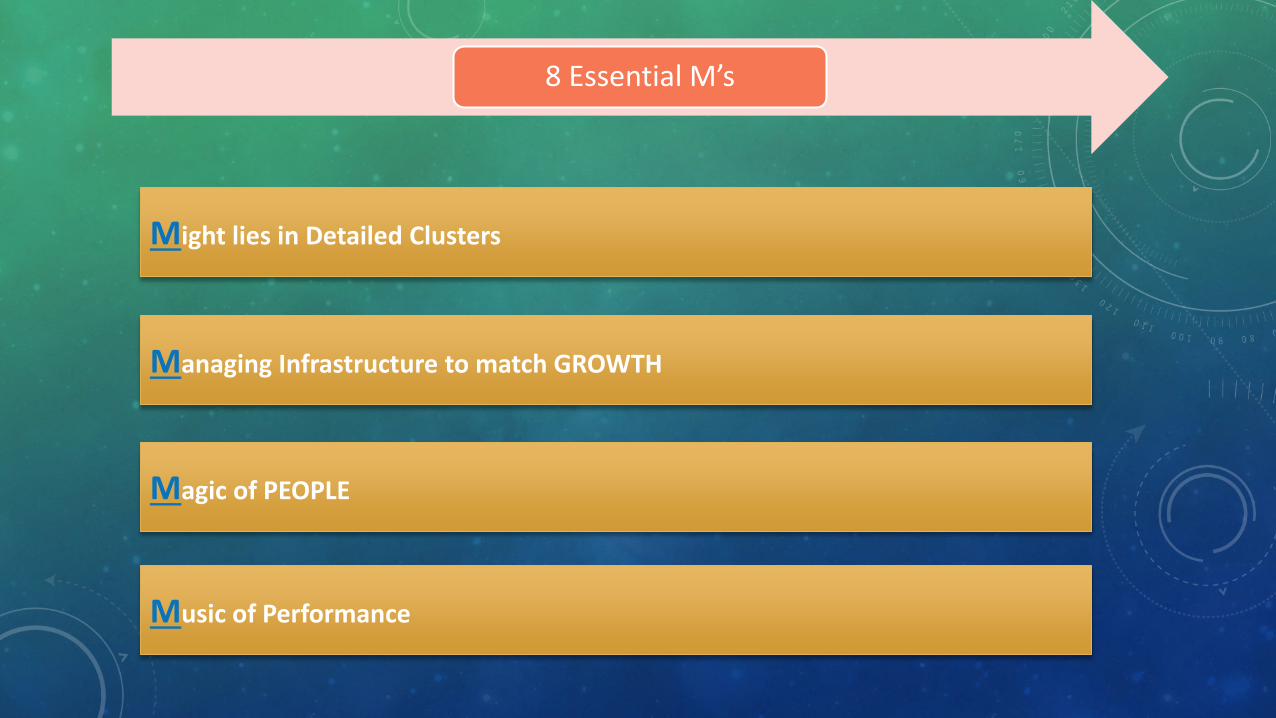
Managing Infrastructure to match GROWTH
Might lies in Detailed Clusters
Magic of PEOPLE
Music of Performance
8 Essential M’s
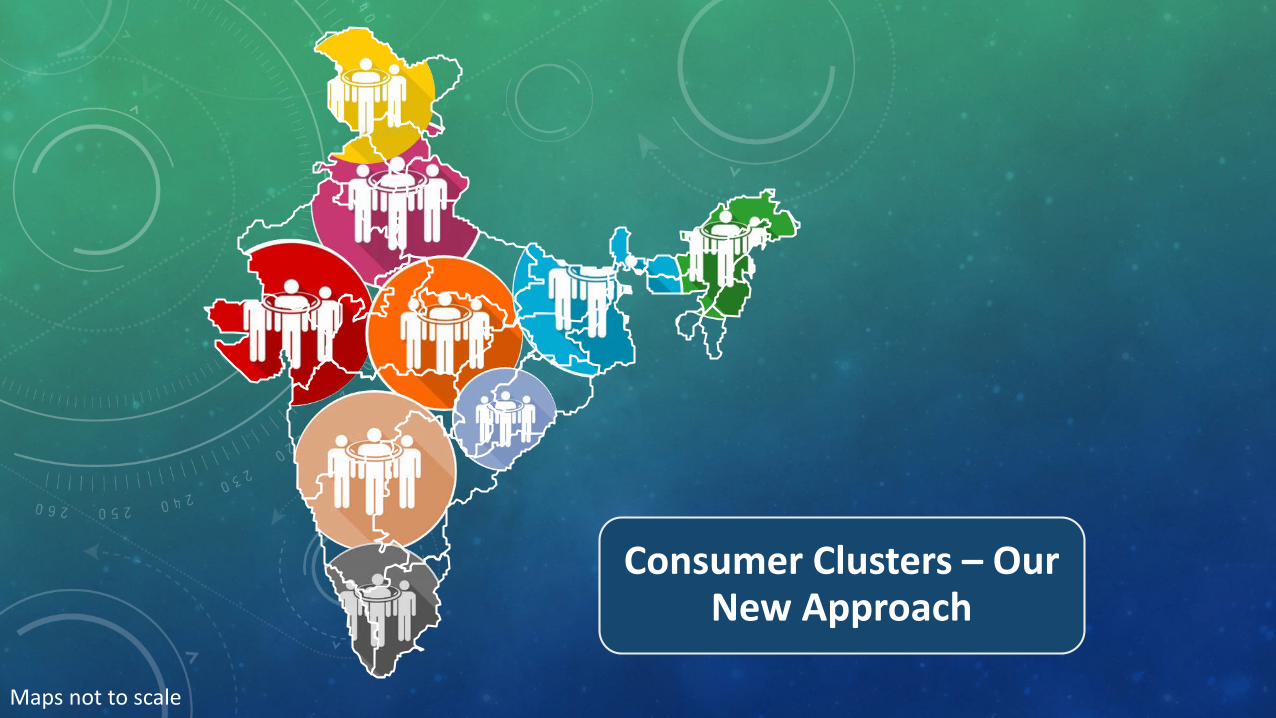
Consumer Clusters – Our New Approach
Maps not to scale
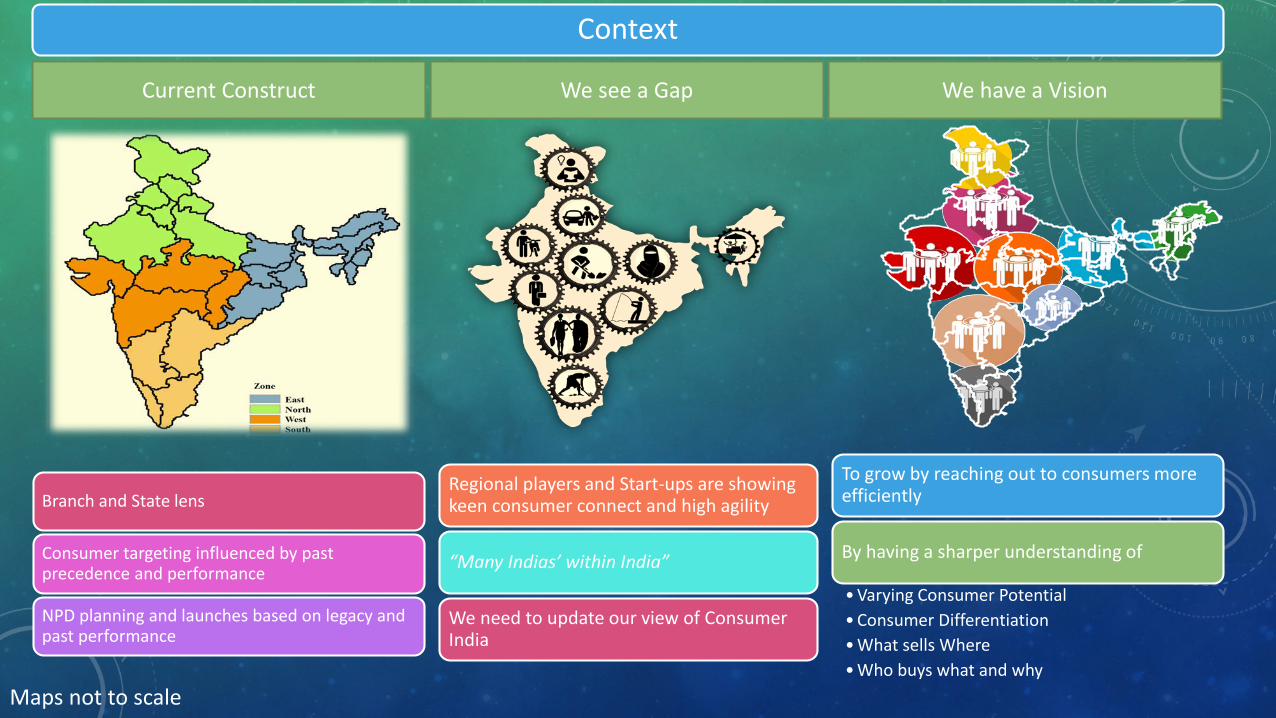
Context
Regional players and Start-ups are showing keen consumer connect and high agility
“Many Indias’ within India”
We need to update our view of Consumer India
We see a GapCurrent Construct
Branch and State lens
Consumer targeting influenced by past precedence and performance
NPD planning and launches based on legacy and past performance
To grow by reaching out to consumers more efficiently
By having a sharper understanding of
• Varying Consumer Potential • Consumer Differentiation• What sells Where• Who buys what and why
We have a Vision
Maps not to scale
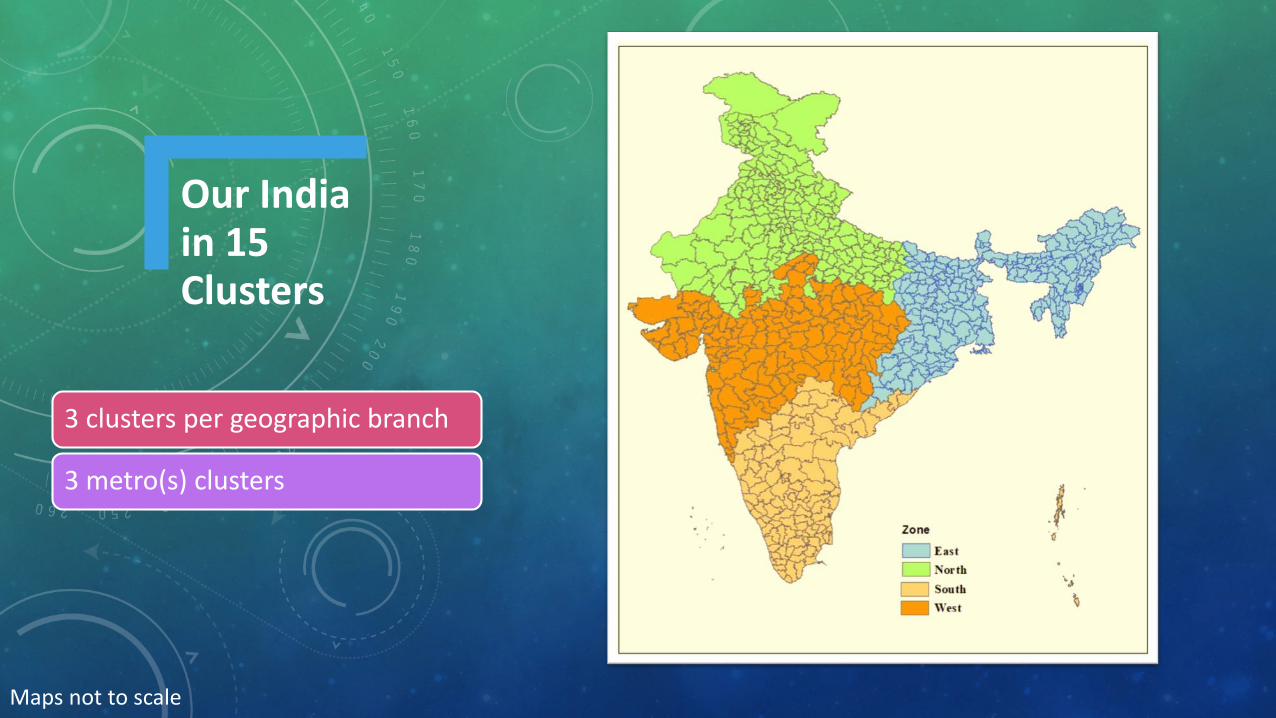
Our India in 15 Clusters
3 clusters per geographic branch
3 metro(s) clusters
Maps not to scale
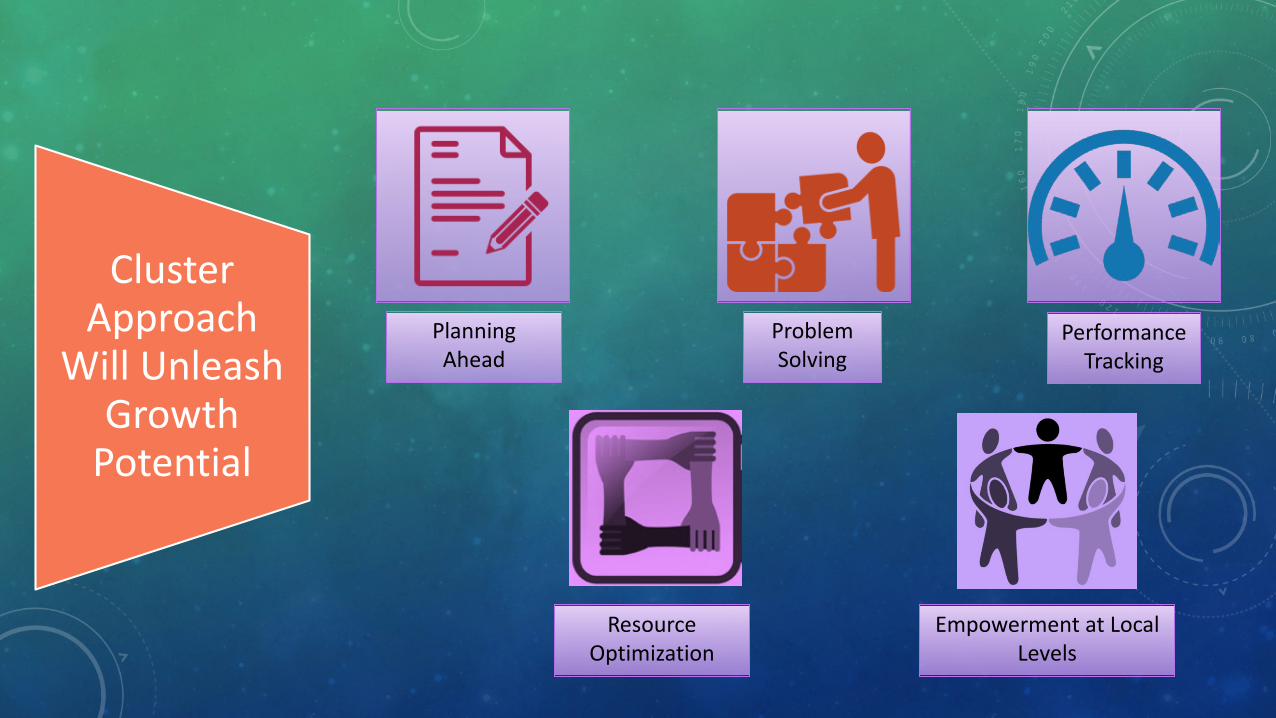
Cluster Approach
Will Unleash Growth
Potential
PlanningAhead
PerformanceTracking
ProblemSolving
Resource Optimization
Empowerment at Local Levels
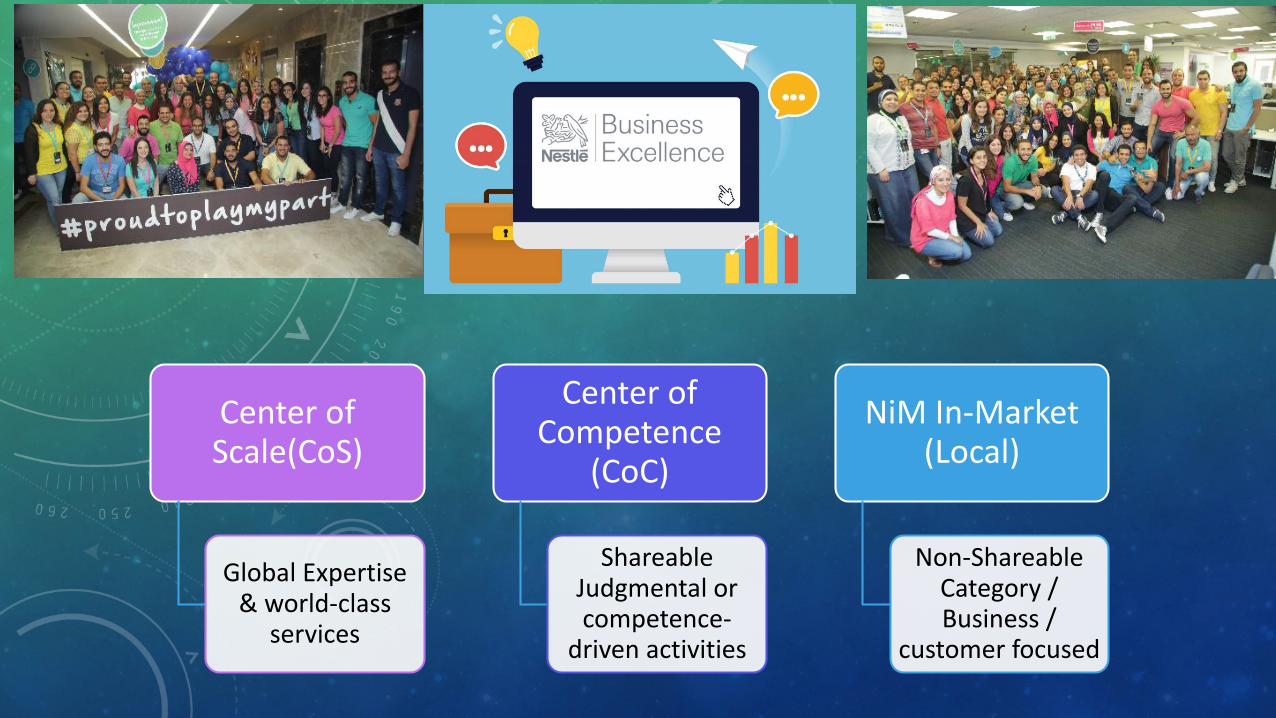
Center of Scale(CoS)
Global Expertise & world-class
services
Center of Competence
(CoC)
Shareable Judgmental or competence-
driven activities
NiM In-Market (Local)
Non-Shareable Category / Business /
customer focused
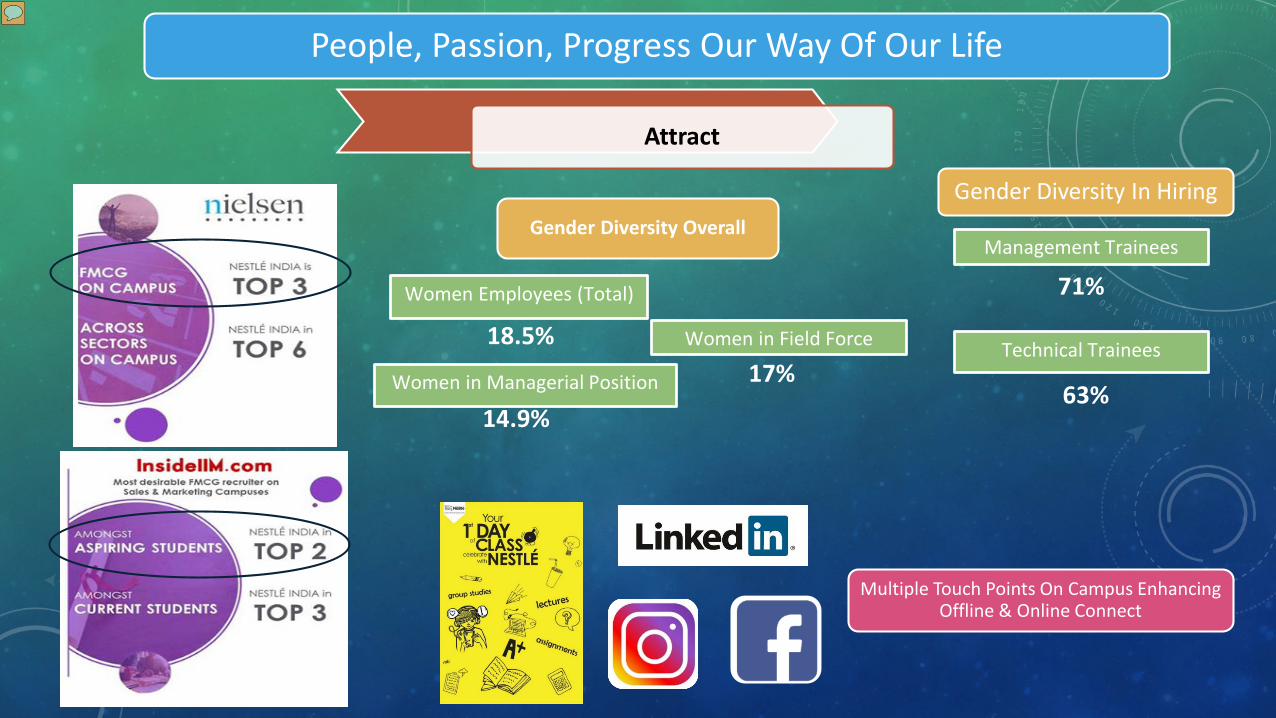
Attract
Management Trainees
Technical Trainees
Gender Diversity In Hiring
Multiple Touch Points On Campus Enhancing Offline & Online Connect
71%
63%
People, Passion, Progress Our Way Of Our Life
Women Employees (Total)
18.5%
Gender Diversity Overall
Women in Managerial Position
14.9%
Women in Field Force
17%
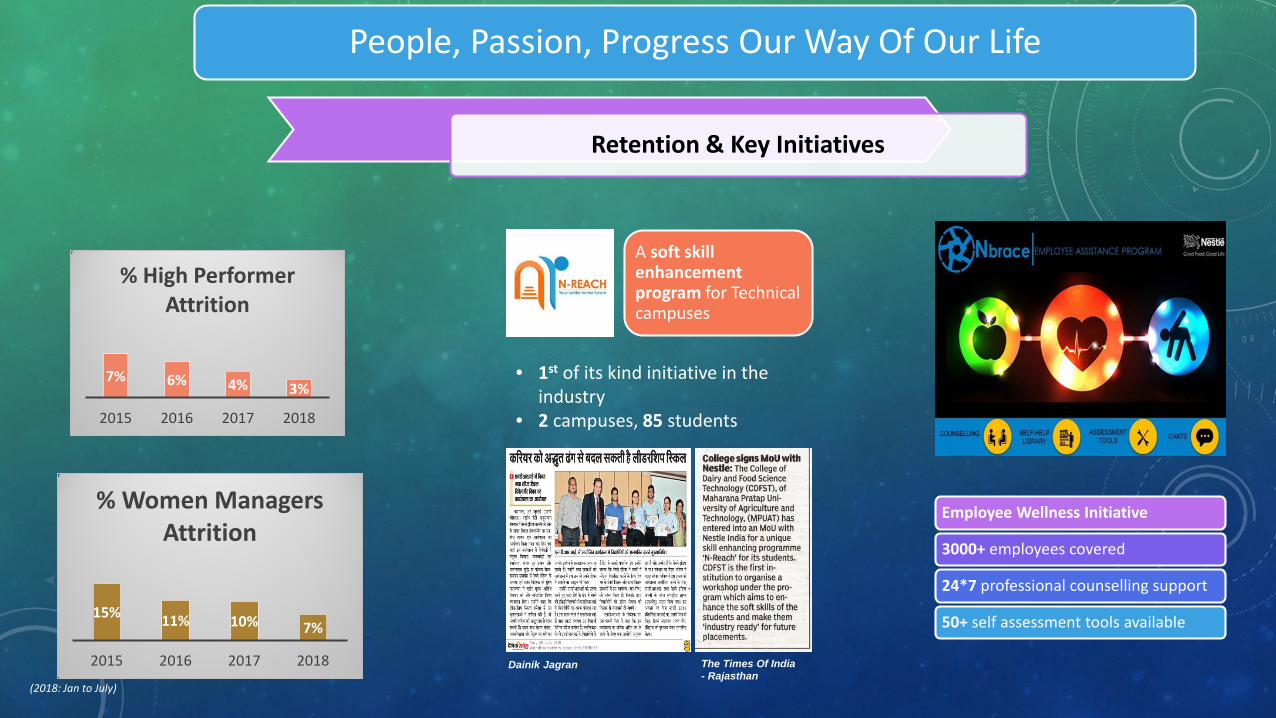
Retention & Key Initiatives
A soft skill enhancement program for Technical campuses
Employee Wellness Initiative
3000+ employees covered
24*7 professional counselling support
50+ self assessment tools available
• 1st of its kind initiative in the industry
• 2 campuses, 85 students
7% 6% 4% 3%
2015 2016 2017 2018
% High Performer Attrition
15% 11% 10% 7%
2015 2016 2017 2018
% Women Managers Attrition
The Times Of India - Rajasthan
Dainik Jagran
(2018: Jan to July)
People, Passion, Progress Our Way Of Our Life
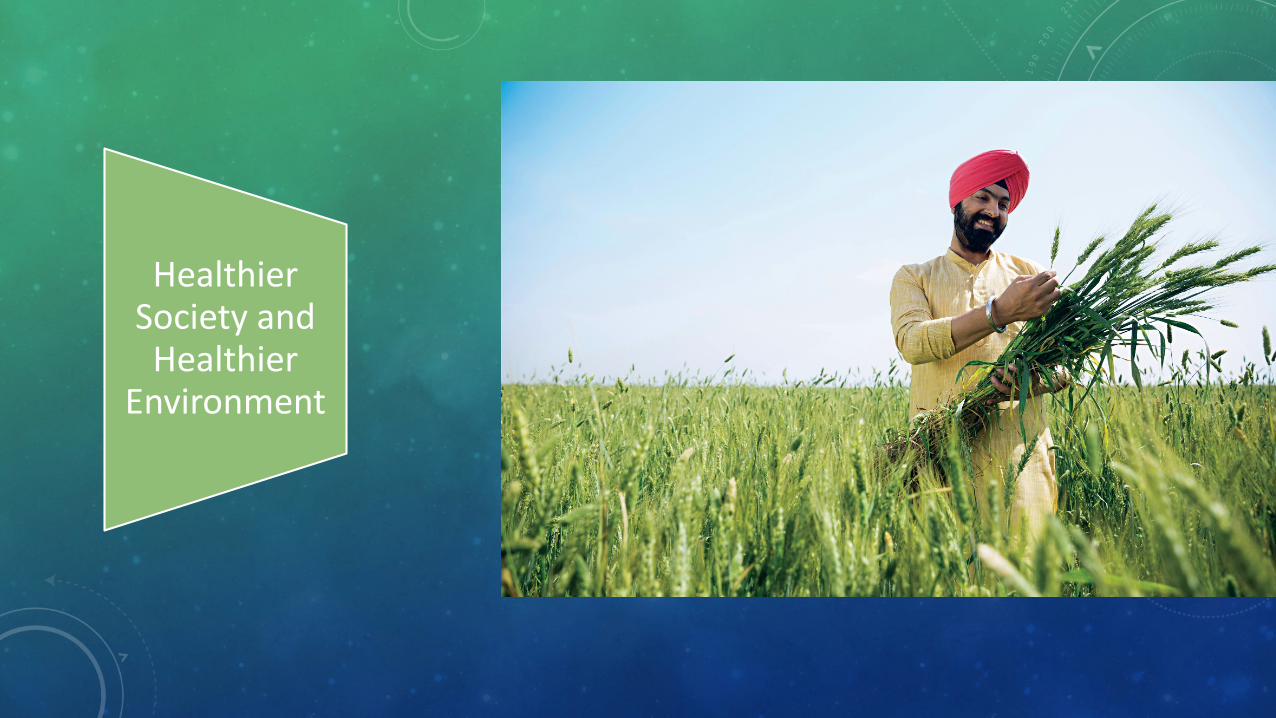
Healthier Society and Healthier
Environment
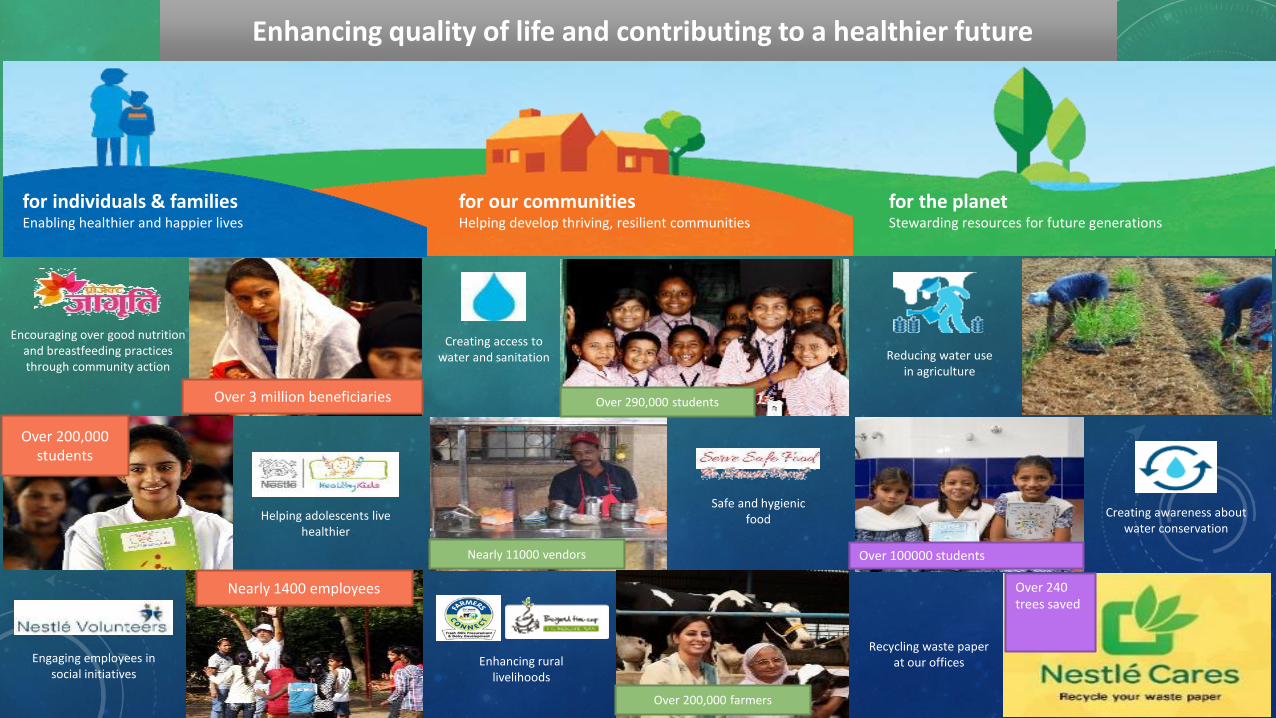
Enhancing quality of life and contributing to a healthier future
for individuals & familiesEnabling healthier and happier lives
for our communitiesHelping develop thriving, resilient communities
for the planetStewarding resources for future generations
Encouraging over good nutrition and breastfeeding practices through community action
Helping adolescents live healthier
Engaging employees in social initiatives
Creating access to water and sanitation
Safe and hygienic food
Enhancing rural livelihoods
Reducing water use in agriculture
Creating awareness about water conservation
Recycling waste paper at our offices
Over 3 million beneficiaries
Over 200,000students
Nearly 1400 employees
Over 290,000 students
Nearly 11000 vendors
Over 200,000 farmers
Over 100000 students
Over 240 trees saved
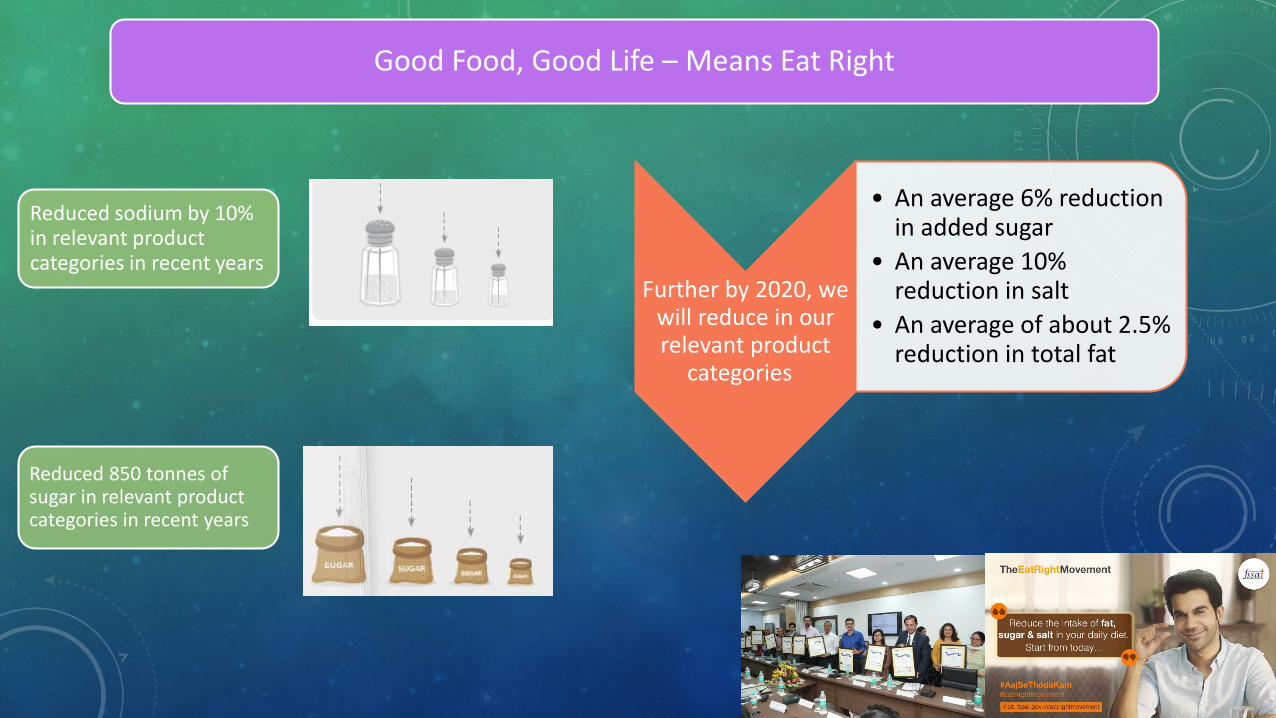
Good Food, Good Life – Means Eat Right
Further by 2020, we will reduce in our relevant product
categories
• An average 6% reduction in added sugar
• An average 10% reduction in salt
• An average of about 2.5% reduction in total fat
Reduced sodium by 10% in relevant product categories in recent years
Reduced 850 tonnes of sugar in relevant product categories in recent years
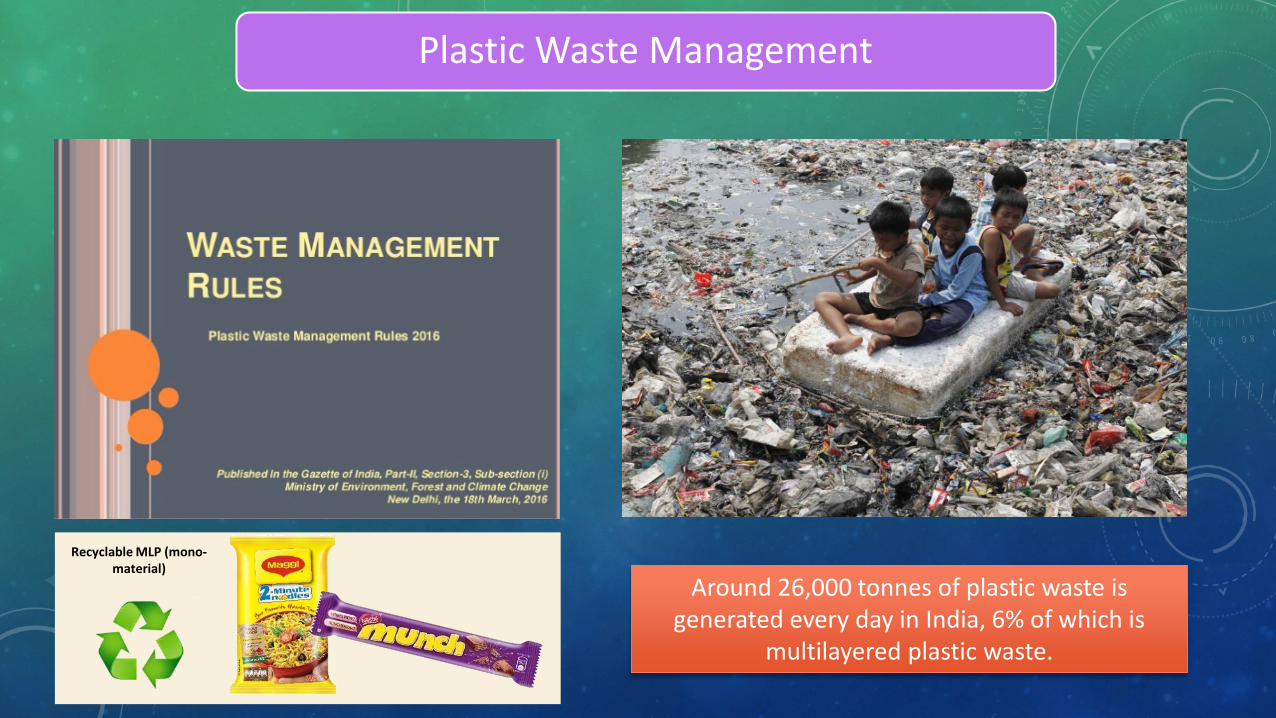
Plastic Waste Management
Around 26,000 tonnes of plastic waste is generated every day in India, 6% of which is
multilayered plastic waste.
Recyclable MLP (mono-material)
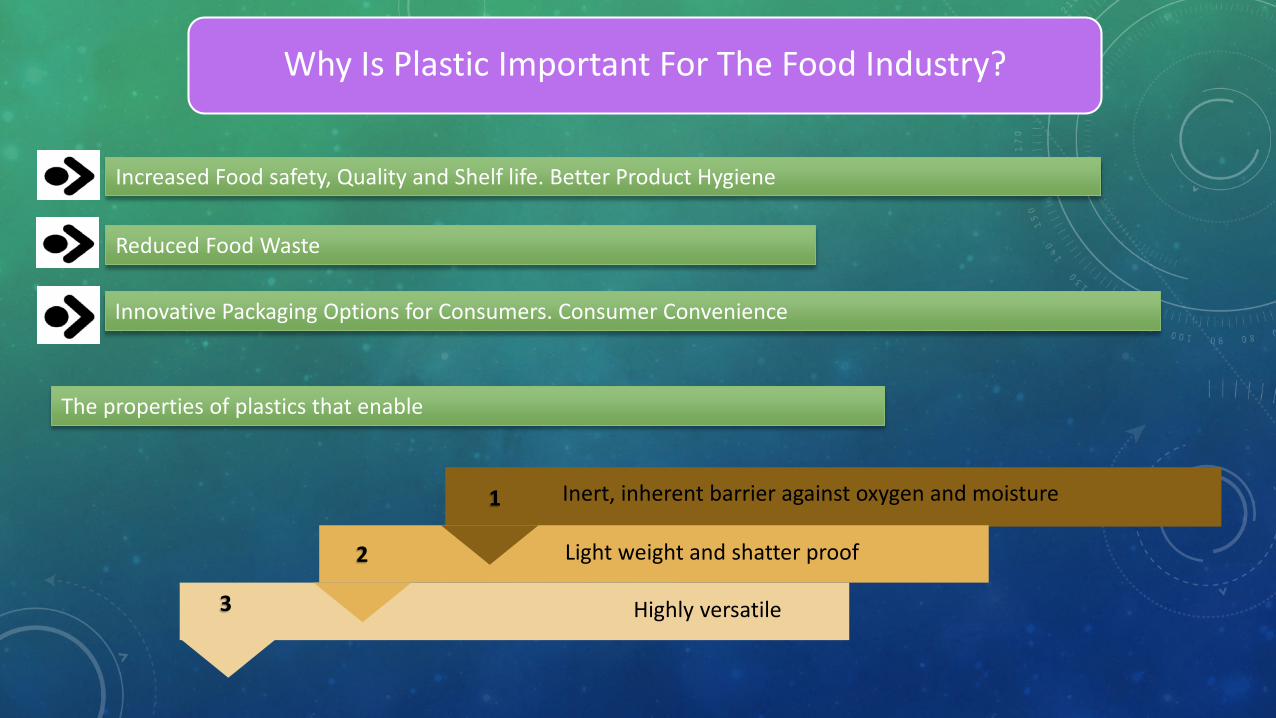
Increased Food safety, Quality and Shelf life. Better Product Hygiene
Innovative Packaging Options for Consumers. Consumer Convenience
The properties of plastics that enable
1
2
3 Highly versatile
Light weight and shatter proof
Inert, inherent barrier against oxygen and moisture
Reduced Food Waste
Why Is Plastic Important For The Food Industry?
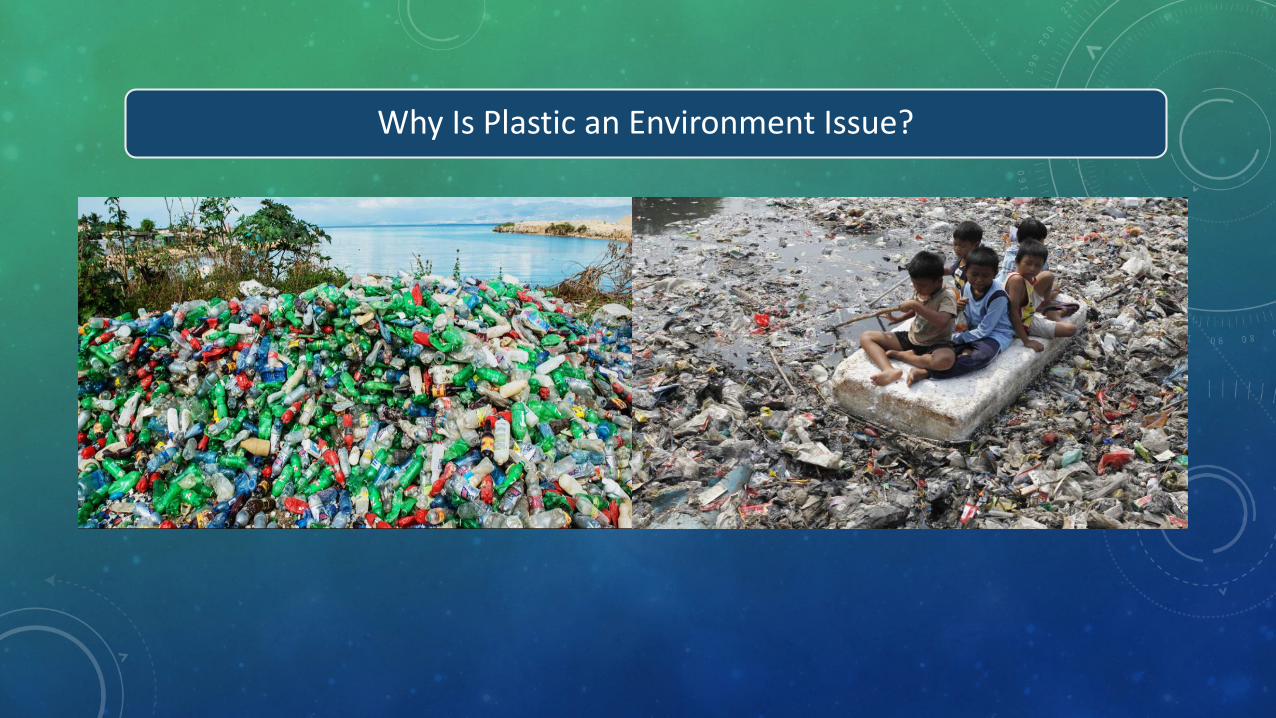
Why Is Plastic an Environment Issue?
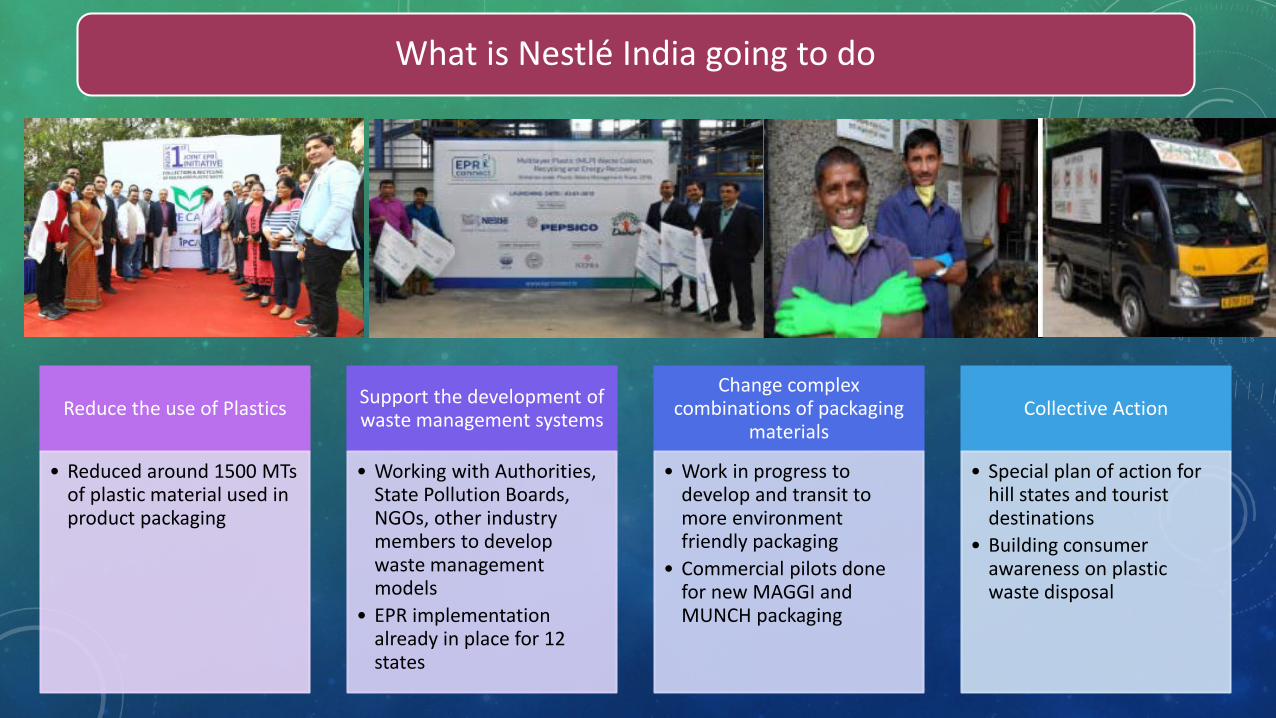
What is Nestlé India going to do
Reduce the use of Plastics
• Reduced around 1500 MTs of plastic material used in product packaging
Support the development of waste management systems
• Working with Authorities, State Pollution Boards, NGOs, other industry members to develop waste management models
• EPR implementation already in place for 12 states
Change complex combinations of packaging
materials
• Work in progress to develop and transit to more environment friendly packaging
• Commercial pilots done for new MAGGI and MUNCH packaging
Collective Action
• Special plan of action for hill states and tourist destinations
• Building consumer awareness on plastic waste disposal
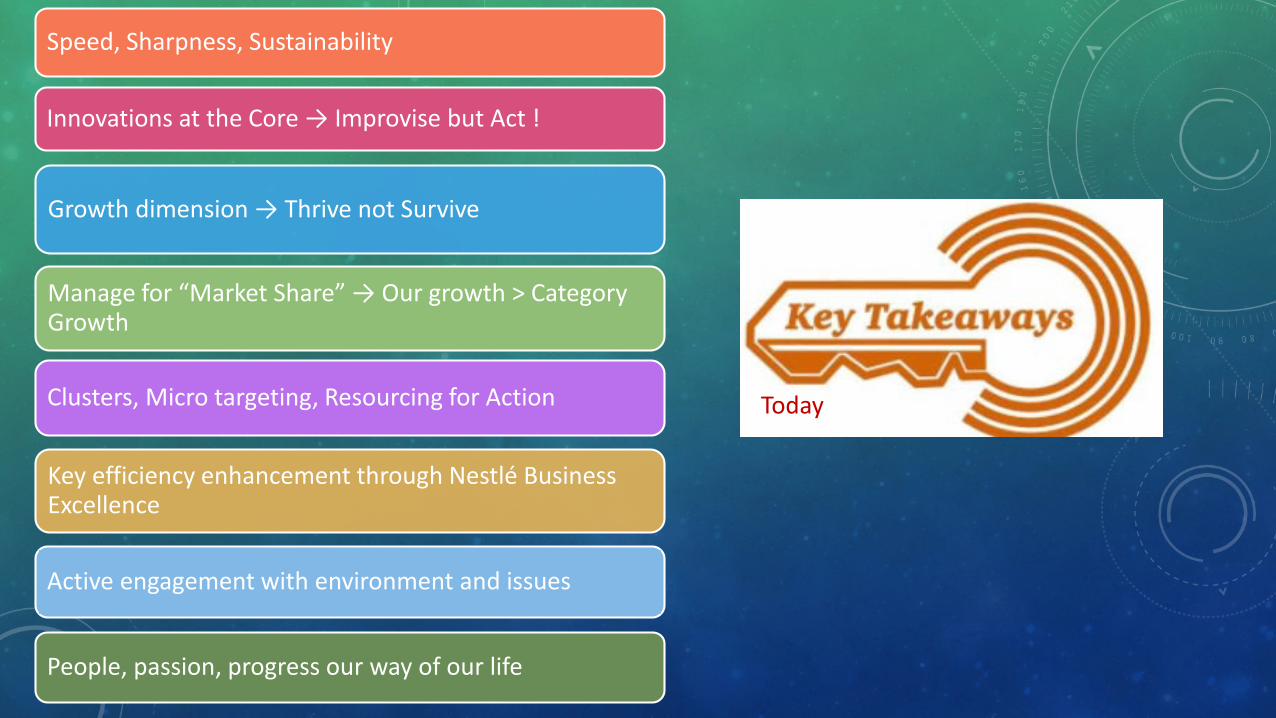
Today
Speed, Sharpness, Sustainability
Innovations at the Core → Improvise but Act !
Growth dimension → Thrive not Survive
Manage for “Market Share” → Our growth > Category Growth
Key efficiency enhancement through Nestlé Business Excellence
Clusters, Micro targeting, Resourcing for Action
People, passion, progress our way of our life
Active engagement with environment and issues
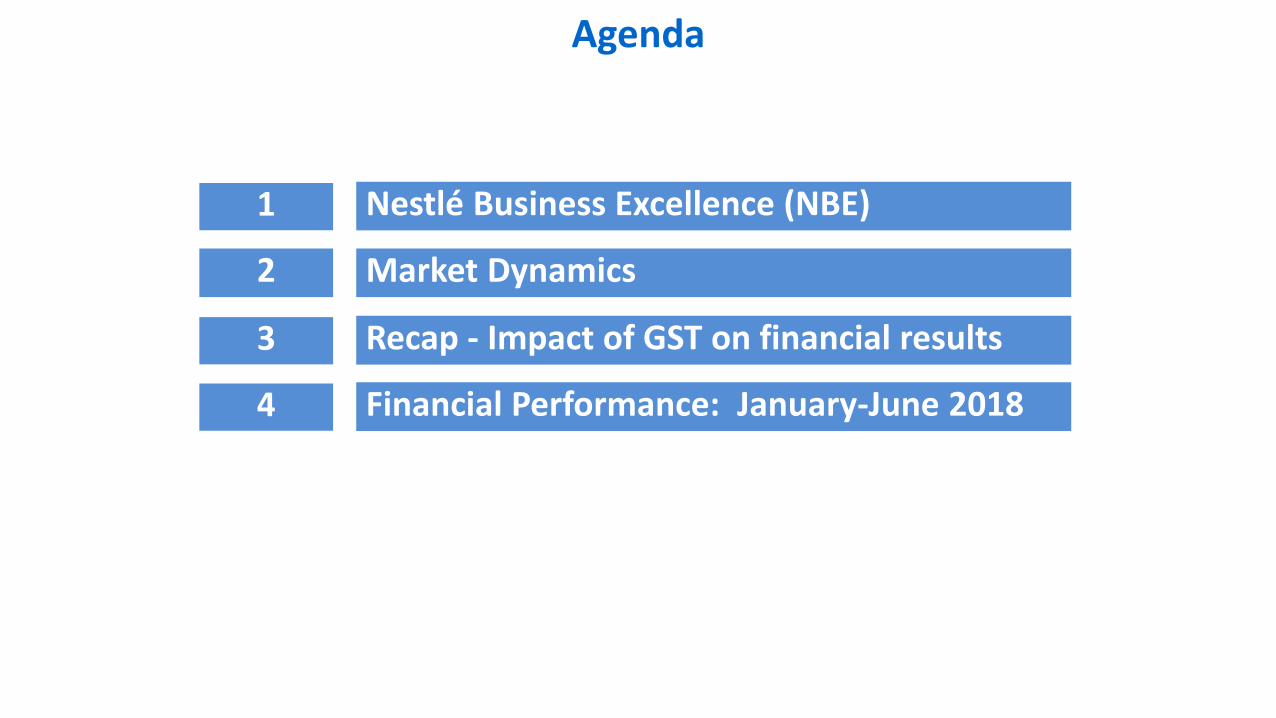
Agenda
Recap - Impact of GST on financial results
Market Dynamics
3
2
Nestlé Business Excellence (NBE)1
Financial Performance: January-June 20184
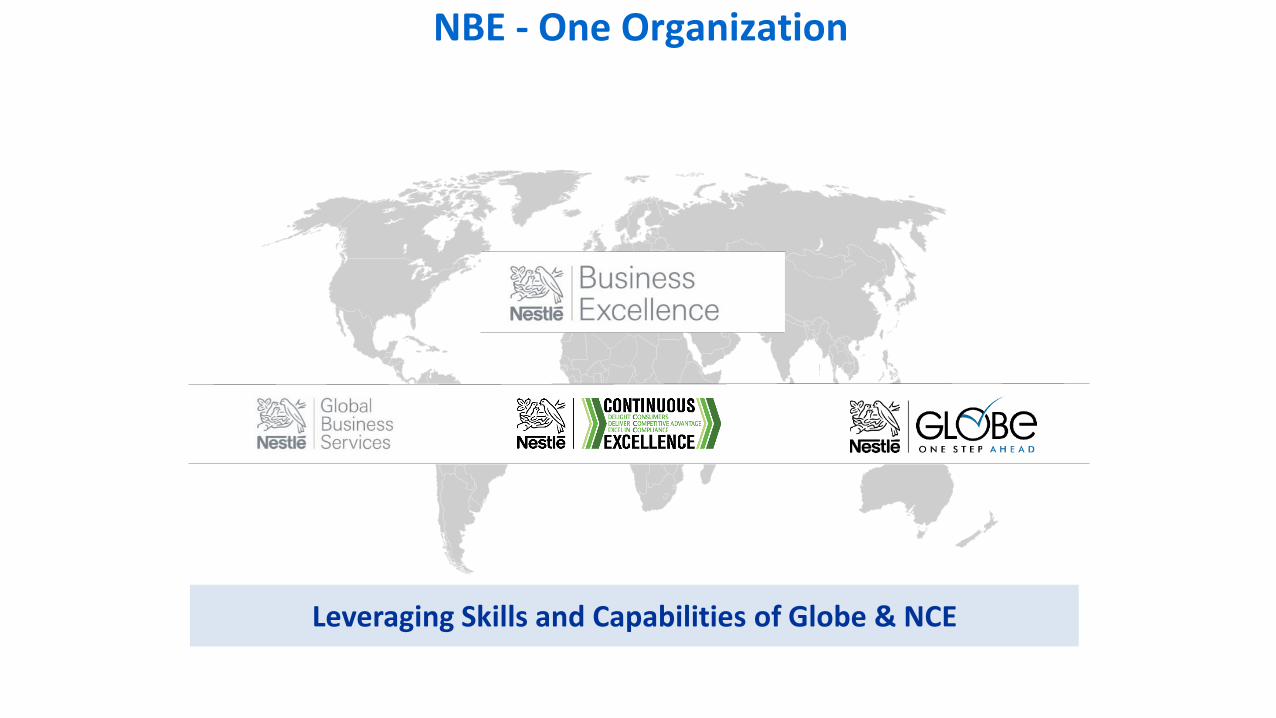
NBE - One Organization
Leveraging Skills and Capabilities of Globe & NCE
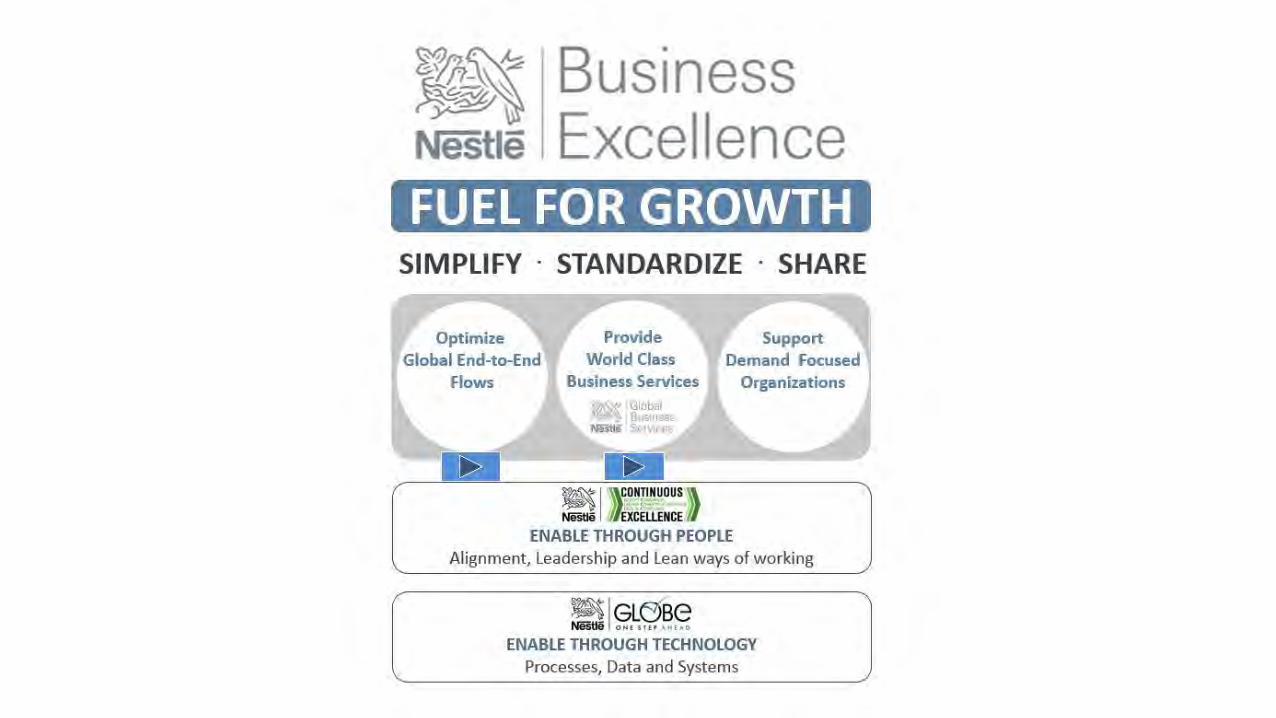
~1n~ 1 Business ~~ Nestle I Excellence FUEL FOR GROWTH
SIMPLIFY · STANDARDIZE · SHARE
/
'
Optimize Provide Support Global End-to-End World Class Demand Focused
Flows Business Services Organizations ~ Global ~~ Business Nestle Services
~ I '\\~~O,~ UO~S)\ NisUi /~EXCEil.ENCE /~
ENABLE THROUGH PEOPLE Alignment, Leadership and Lean ways of working
~I§.~~~~ ENABLE THROUGH TECHNOLOGY
Processes, Data and Systems
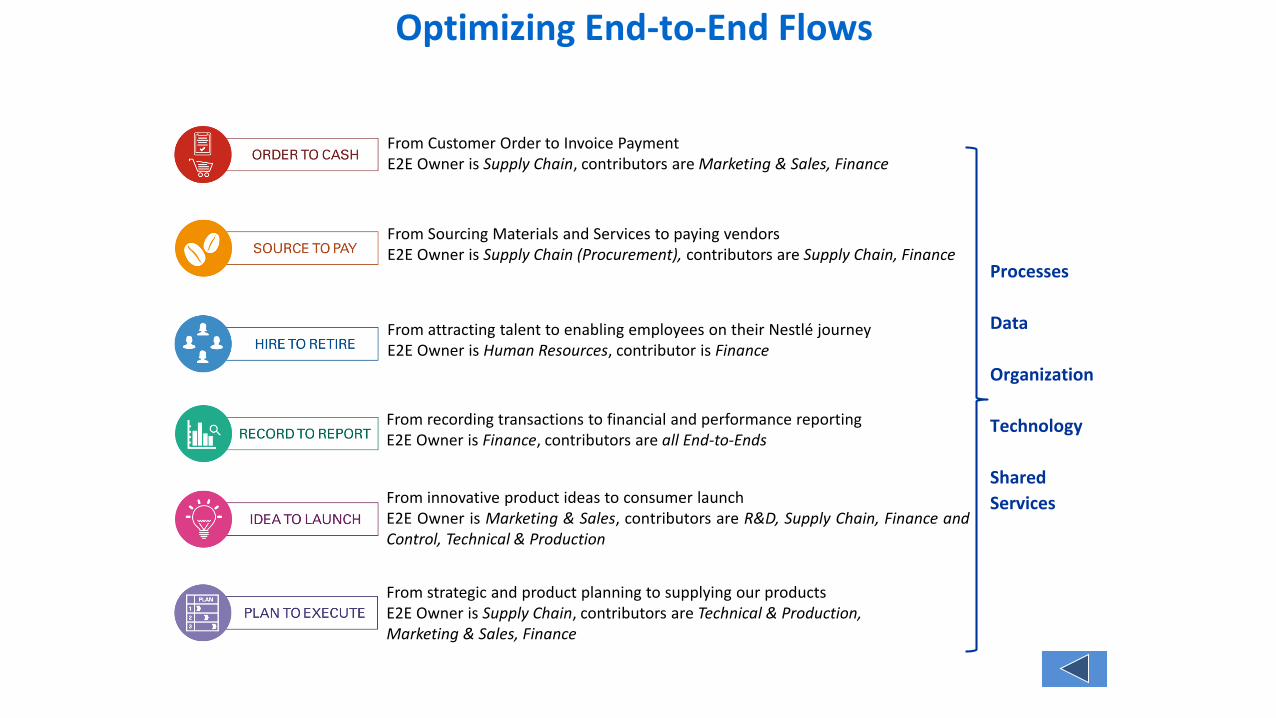
From Customer Order to Invoice PaymentE2E Owner is Supply Chain, contributors are Marketing & Sales, Finance
From Sourcing Materials and Services to paying vendorsE2E Owner is Supply Chain (Procurement), contributors are Supply Chain, Finance
From attracting talent to enabling employees on their Nestlé journeyE2E Owner is Human Resources, contributor is Finance
From recording transactions to financial and performance reportingE2E Owner is Finance, contributors are all End-to-Ends
From innovative product ideas to consumer launchE2E Owner is Marketing & Sales, contributors are R&D, Supply Chain, Finance andControl, Technical & Production
From strategic and product planning to supplying our productsE2E Owner is Supply Chain, contributors are Technical & Production,Marketing & Sales, Finance
Processes
Data
Organization
Technology
Shared
Services
Optimizing End-to-End Flows
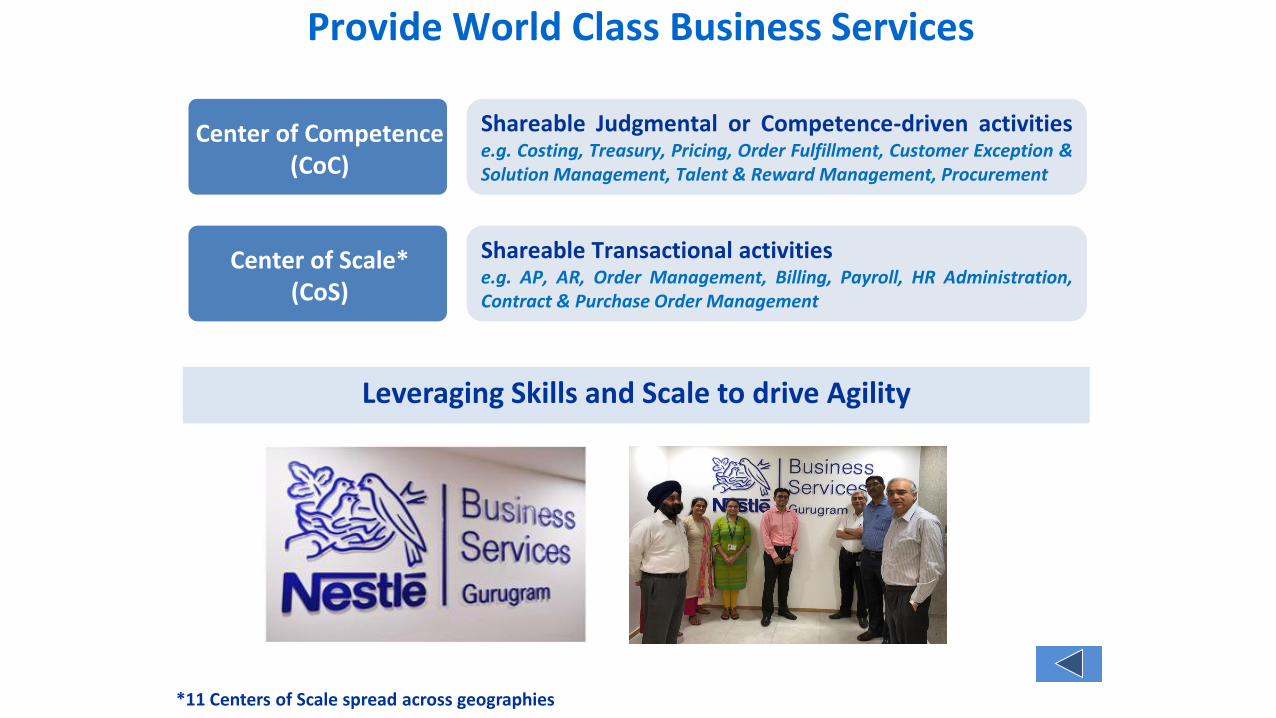
Center of Competence(CoC)
Center of Scale*(CoS)
*11 Centers of Scale spread across geographies
Provide World Class Business Services
Leveraging Skills and Scale to drive Agility
Shareable Transactional activities e.g. AP, AR, Order Management, Billing, Payroll, HR Administration,Contract & Purchase Order Management
Shareable Judgmental or Competence-driven activitiese.g. Costing, Treasury, Pricing, Order Fulfillment, Customer Exception &Solution Management, Talent & Reward Management, Procurement
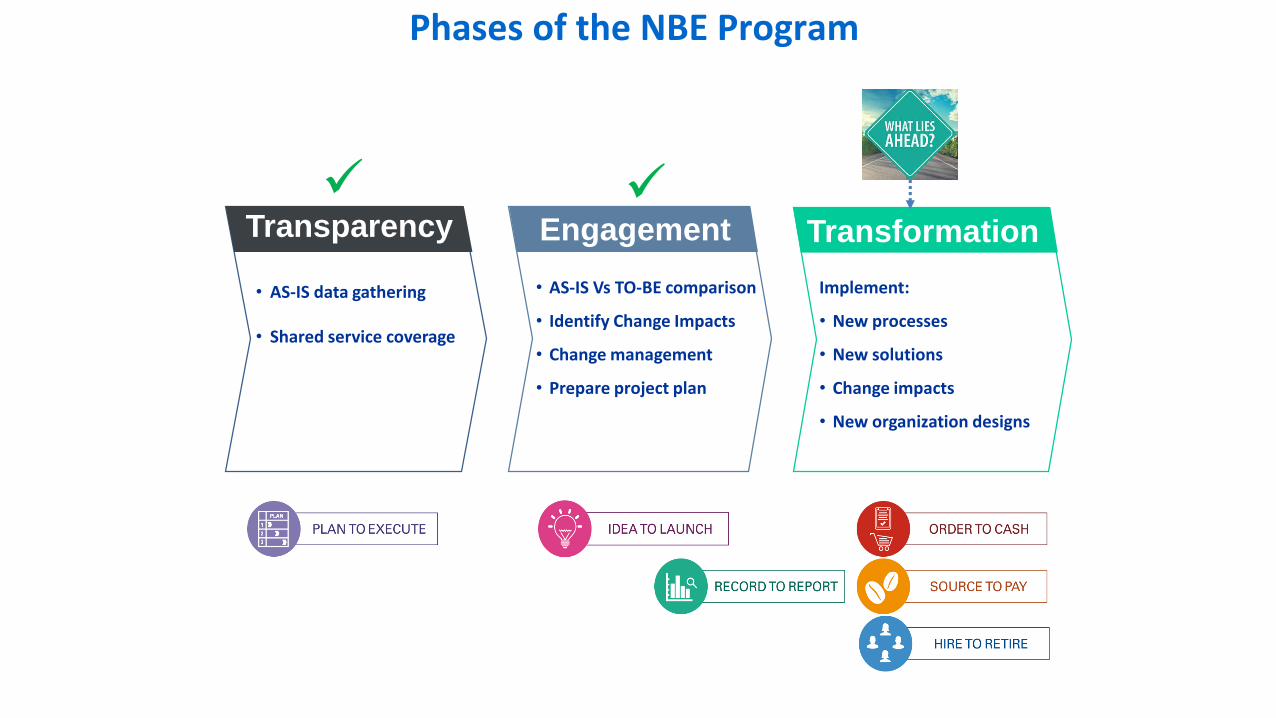
• AS-IS data gathering
• Shared service coverage
Transparency
• AS-IS Vs TO-BE comparison
• Identify Change Impacts
• Change management
• Prepare project plan
Engagement
Implement:
• New processes
• New solutions
• Change impacts
• New organization designs
Transformation
7
Phases of the NBE Program
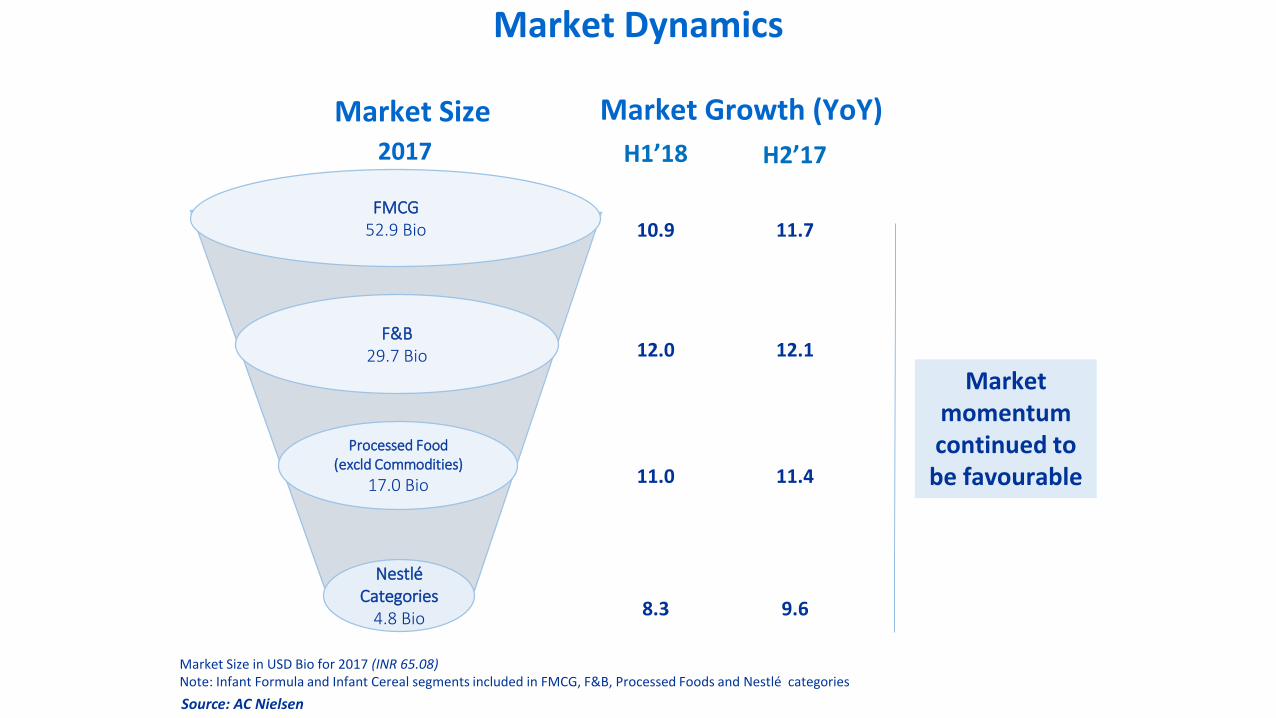
FMCG 52.9 Bio
F&B29.7 Bio
Processed Food (excld Commodities)
17.0 Bio
Nestlé Categories
4.8 Bio
Market Size
Market Size in USD Bio for 2017 (INR 65.08)Note: Infant Formula and Infant Cereal segments included in FMCG, F&B, Processed Foods and Nestlé categories
Market Growth (YoY)
2017
10.9
12.0
11.0
8.3
Market momentum continued to
be favourable
H1’18
Source: AC Nielsen
H2’17
11.7
12.1
11.4
9.6
Market Dynamics
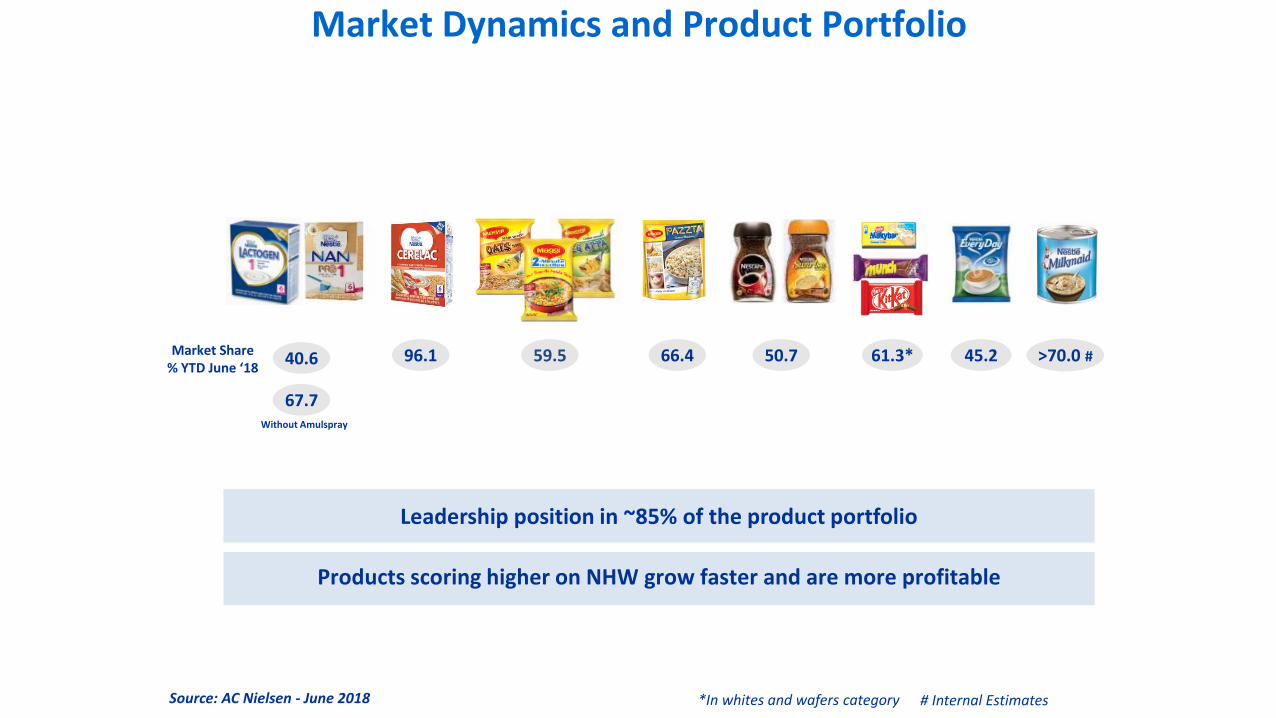
Market Dynamics and Product Portfolio
59.5 66.4
67.7
96.1 61.3*50.7
*In whites and wafers category
45.2Market Share % YTD June ‘18
Source: AC Nielsen - June 2018
>70.0 #
# Internal Estimates
Products scoring higher on NHW grow faster and are more profitable
Leadership position in ~85% of the product portfolio
Without Amulspray
40.6
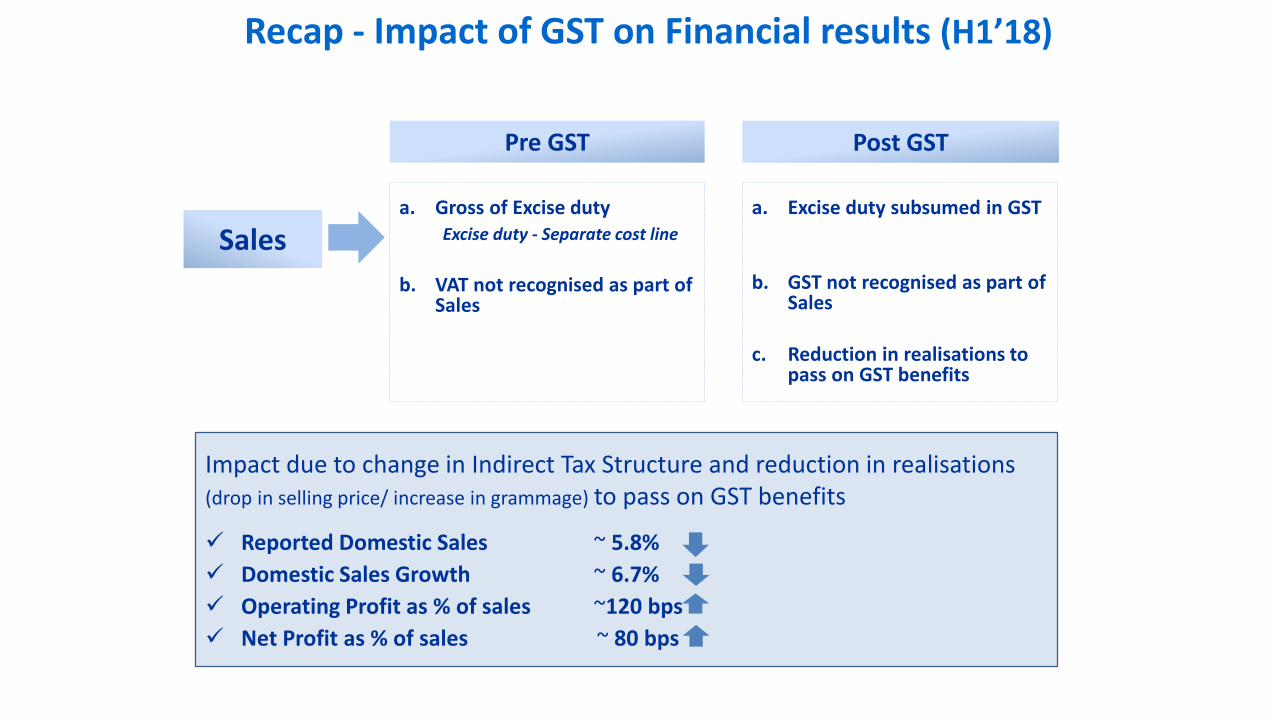
Impact due to change in Indirect Tax Structure and reduction in realisations (drop in selling price/ increase in grammage) to pass on GST benefits
Reported Domestic Sales ~ 5.8%
Domestic Sales Growth ~ 6.7%
Operating Profit as % of sales ~120 bps
Net Profit as % of sales ~ 80 bps
a. Gross of Excise duty Excise duty - Separate cost line
b. VAT not recognised as part of Sales
Sales
Pre GST Post GST
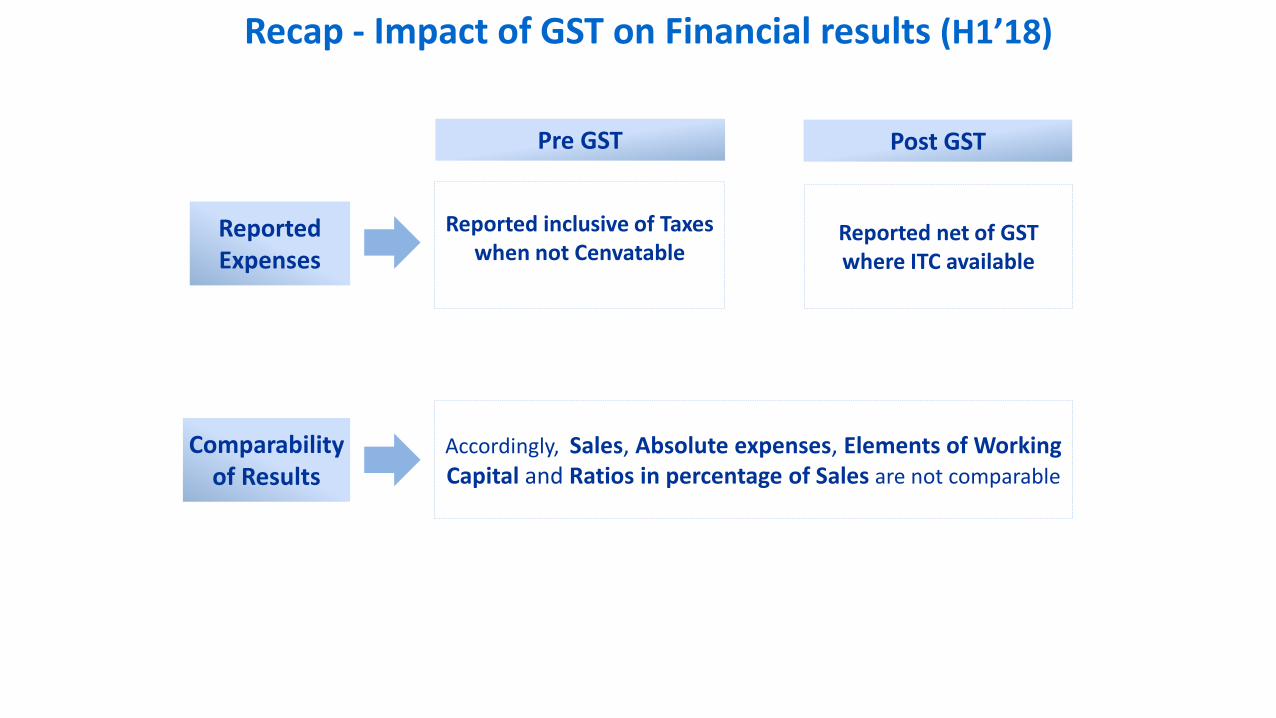
Recap - Impact of GST on Financial results (H1’18)
a. Excise duty subsumed in GST
b. GST not recognised as part of Sales
c. Reduction in realisations to pass on GST benefits
Pre GST Post GST
Reported inclusive of Taxes when not Cenvatable
Reported net of GST where ITC available
Reported Expenses
Accordingly, Sales, Absolute expenses, Elements of Working Capital and Ratios in percentage of Sales are not comparable
Comparability of Results
Recap - Impact of GST on Financial results (H1’18)
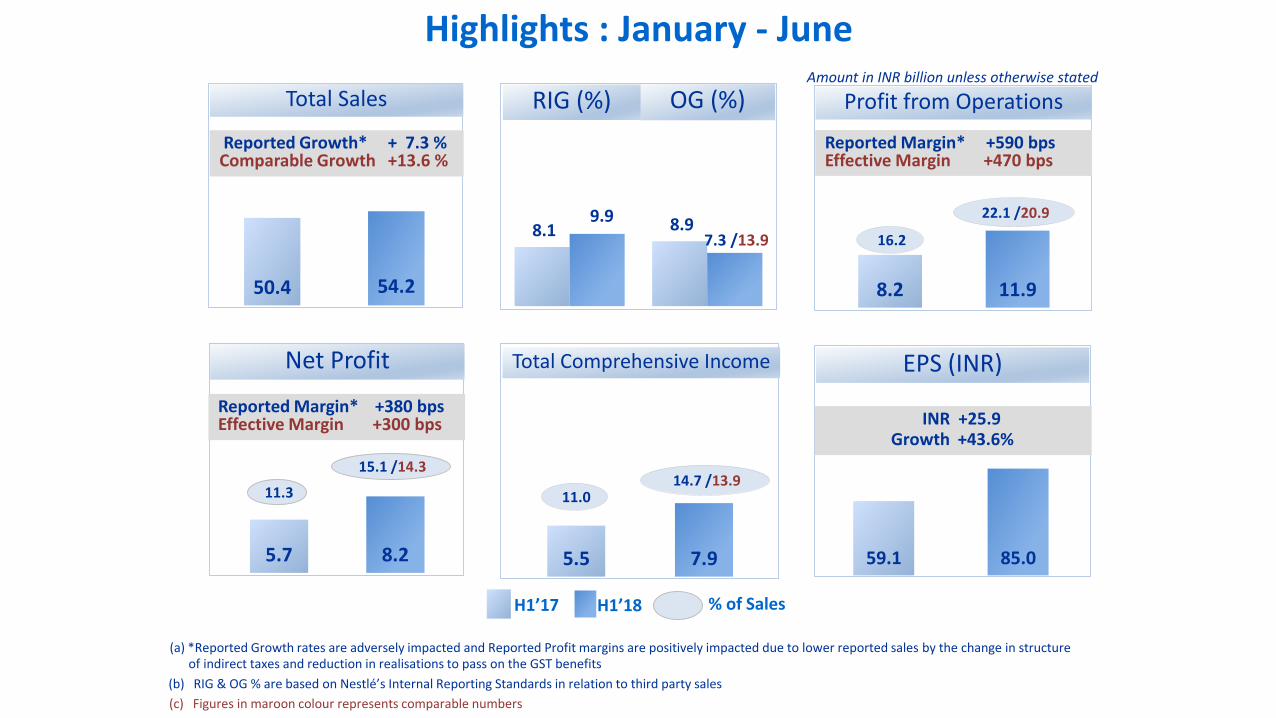
8.2 11.9
16.2
22.1 /20.9
-
5.0
10.0
15.0
20.0
-
0.5
1.0
1.5
2.0
2.5
3.0
3.5
4.0
4.5
5.0
5.5
6.0
6.5
7.0
7.5
8.0
8.5
9.0
9.5
10.0
10.5
11.0
11.5
12.0
12.5
13.0
13.5
14.0
14.5
15.0
50.4 54.2
8.1 8.9 9.9
7.3 /13.9
Profit from Operations
5.7 8.2
11.3
15.1 /14.3
-
5.0
10.0
15.0
20.0
25.0
-
0.5
1.0
1.5
2.0
2.5
3.0
3.5
4.0
4.5
5.0
5.5
6.0
6.5
7.0
7.5
8.0
8.5
9.0
9.5
10.0
10.5
11.0
11.5
12.0
12.5
13.0
13.5
14.0
14.5
15.0
5.5 7.9
11.0 14.7 /13.9
-
5.0
10.0
15.0
20.0
-
0.5
1.0
1.5
2.0
2.5
3.0
3.5
4.0
4.5
5.0
5.5
6.0
6.5
7.0
7.5
8.0
8.5
9.0
9.5
10.0
10.5
11.0
11.5
12.0
12.5
13.0
13.5
14.0
14.5
15.0
Total Comprehensive Income
Reported Margin* +380 bps Effective Margin +300 bps
59.1 85.0
INR +25.9Growth +43.6%
EPS (INR)
OG (%)RIG (%)
Net Profit
Total Sales
H1’17 H1’18 % of Sales
Amount in INR billion unless otherwise stated
(b) RIG & OG % are based on Nestlé’s Internal Reporting Standards in relation to third party sales
Reported Margin* +590 bps Effective Margin +470 bps
Reported Growth* + 7.3 % Comparable Growth +13.6 %
(c) Figures in maroon colour represents comparable numbers
(a) *Reported Growth rates are adversely impacted and Reported Profit margins are positively impacted due to lower reported sales by the change in structure of indirect taxes and reduction in realisations to pass on the GST benefits
Highlights : January - June
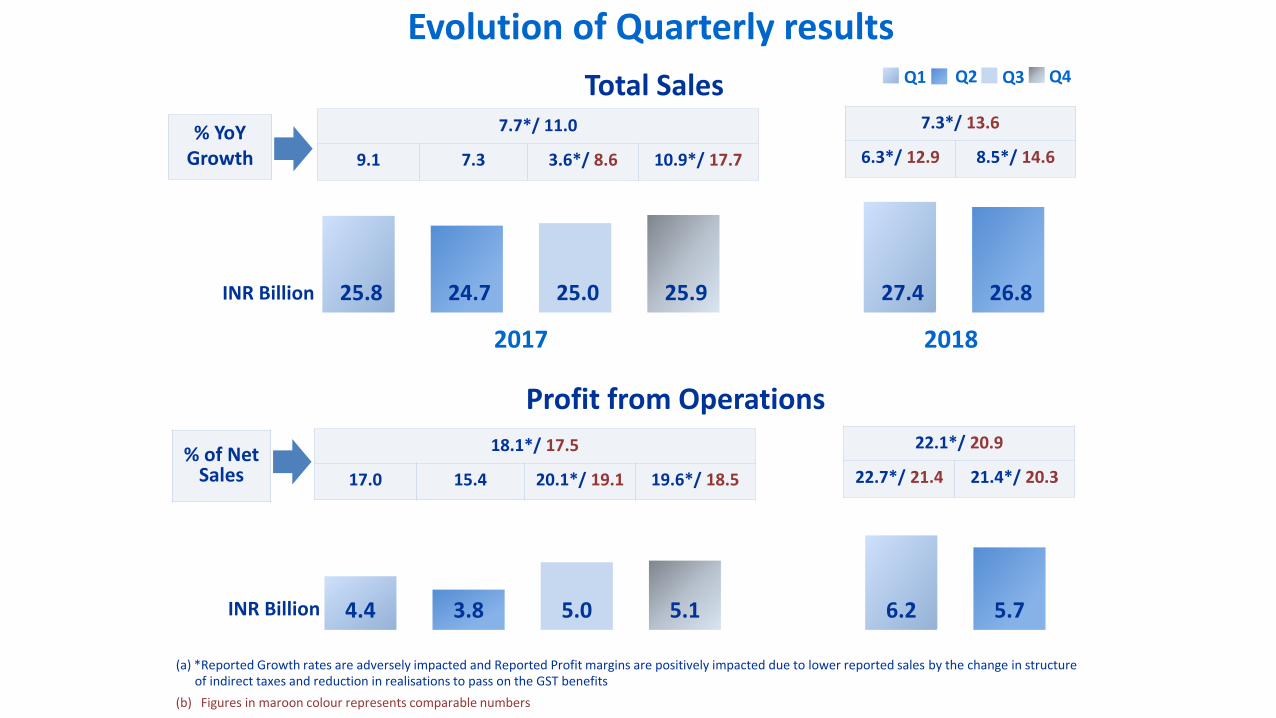
4.4 3.8 5.0 5.1 6.2 5.7
25.8 24.7 25.0 25.9 27.4 26.8
Q3Q1 Q2 Q4
Profit from Operations
Total Sales
INR Billion
Evolution of Quarterly results
7.7*/ 11.0
9.1 7.3 3.6*/ 8.6 10.9*/ 17.7
% of Net Sales
% YoY Growth
2017 2018
(b) Figures in maroon colour represents comparable numbers
(a) *Reported Growth rates are adversely impacted and Reported Profit margins are positively impacted due to lower reported sales by the change in structure of indirect taxes and reduction in realisations to pass on the GST benefits
18.1*/ 17.5
17.0 15.4 20.1*/ 19.1 19.6*/ 18.5
7.3*/ 13.6
6.3*/ 12.9 8.5*/ 14.6
22.1*/ 20.9
22.7*/ 21.4 21.4*/ 20.3
INR Billion
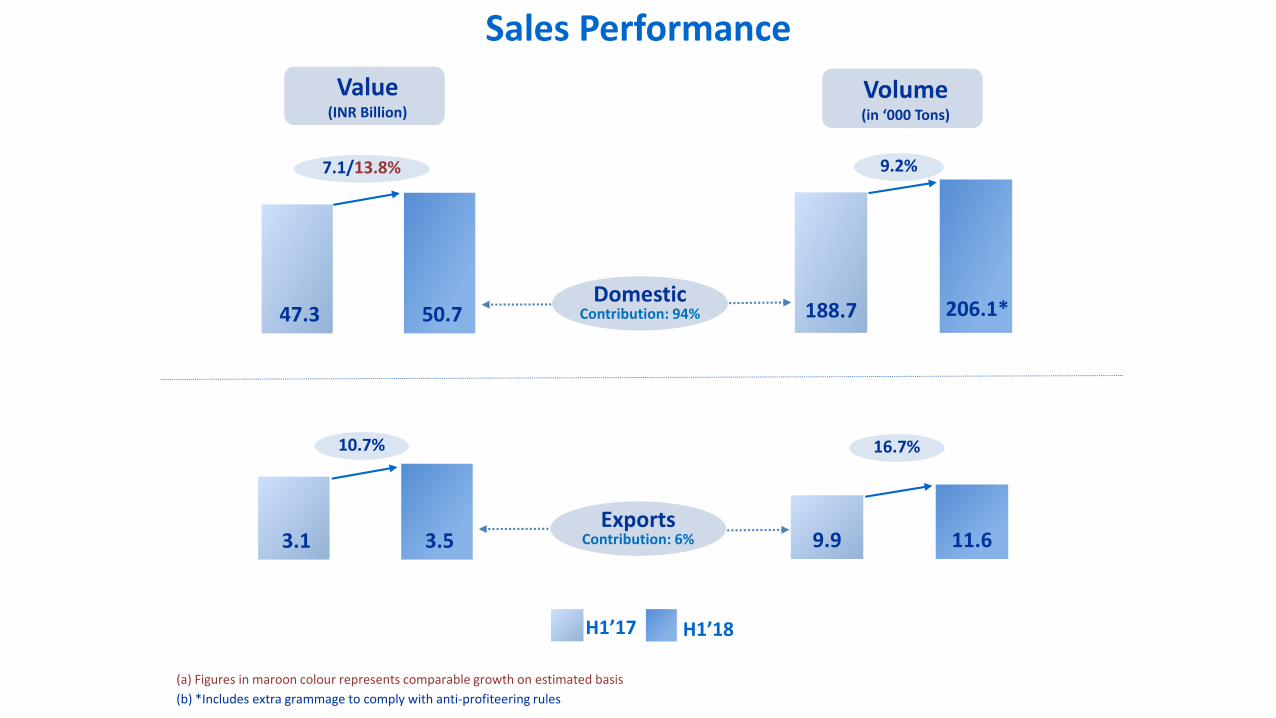
47.3 50.7 188.7 206.1*
3.1 3.5
Sales Performance
9.9 11.6
H1’17 H1’18
Value (INR Billion)
Volume (in ‘000 Tons)
7.1/13.8% 9.2%
10.7% 16.7%
DomesticContribution: 94%
ExportsContribution: 6%
(a) Figures in maroon colour represents comparable growth on estimated basis
(b) *Includes extra grammage to comply with anti-profiteering rules
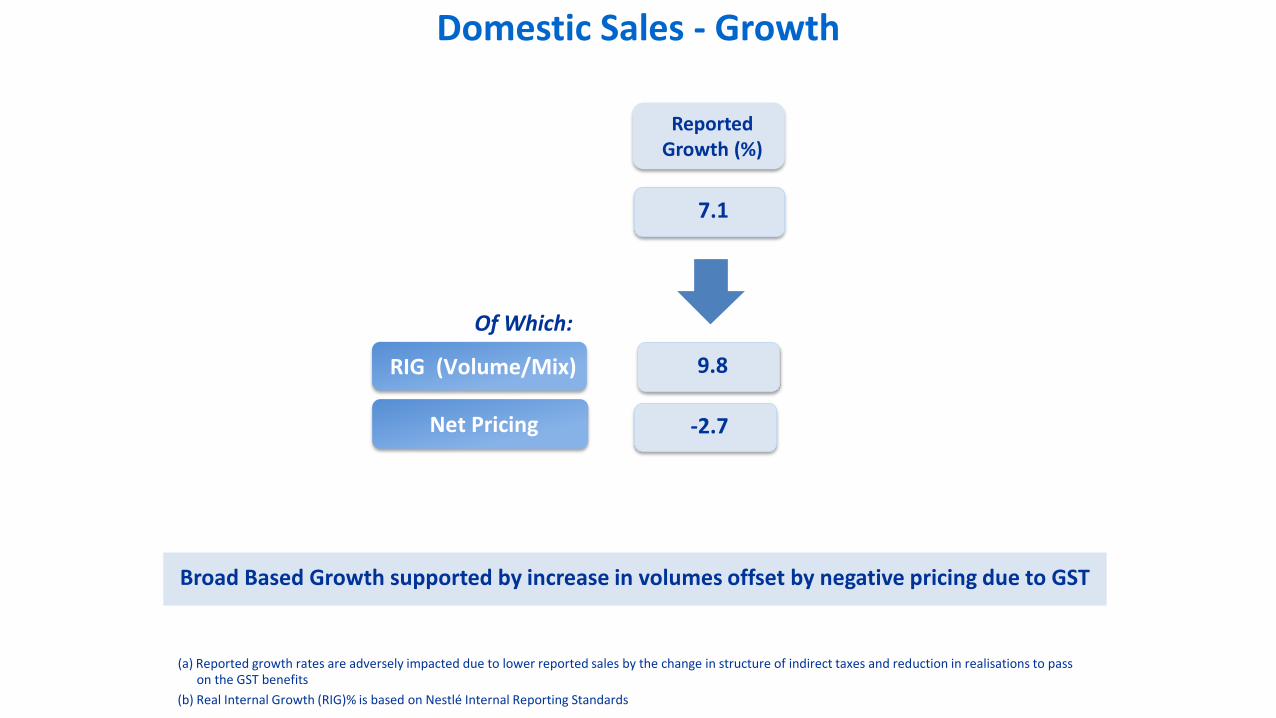
Of Which:
Reported Growth (%)
7.1
Net Pricing
RIG (Volume/Mix)
(a) Reported growth rates are adversely impacted due to lower reported sales by the change in structure of indirect taxes and reduction in realisations to pass on the GST benefits
(b) Real Internal Growth (RIG)% is based on Nestlé Internal Reporting Standards
Broad Based Growth supported by increase in volumes offset by negative pricing due to GST
Domestic Sales - Growth
-2.7
9.8
0
0.2
0.4
0.6
0.8
1
1.2
1.4
1.6
1.8
2
-
100 .00
200 .00
300 .00
400 .00
500 .00
600 .00
700 .00
800 .00
900 .00
H1'17 H1'18
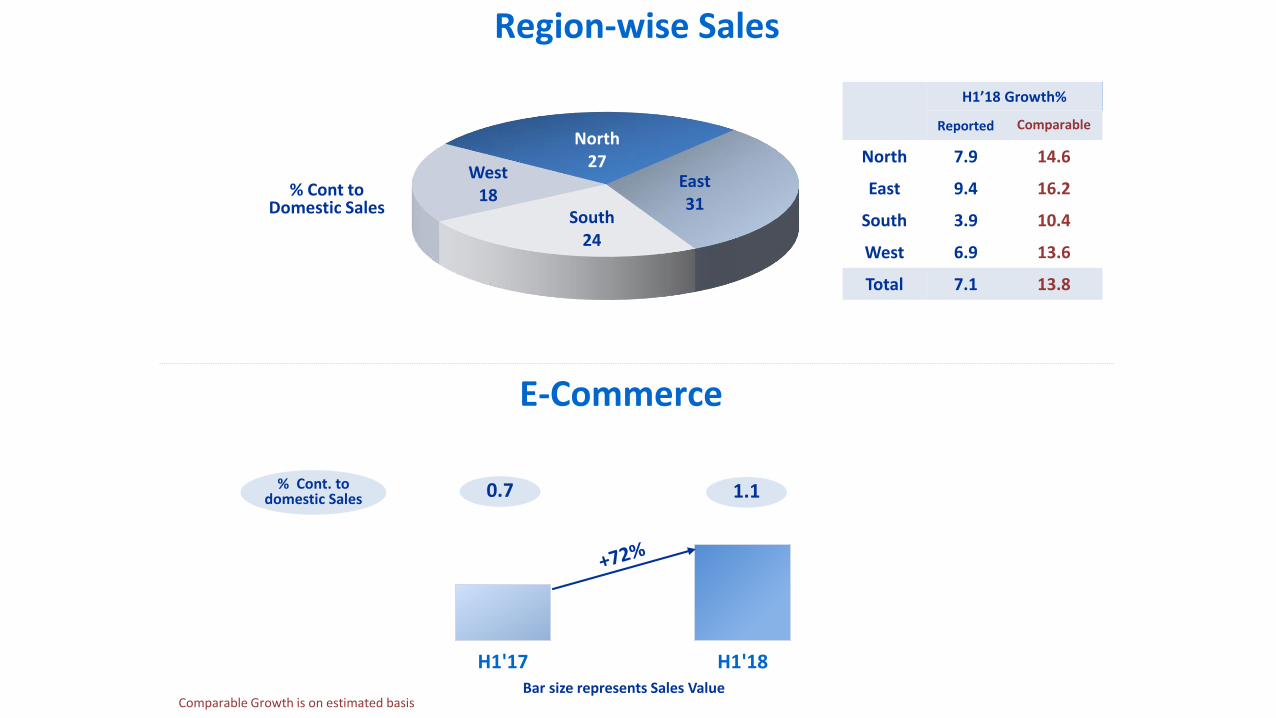
North27
East31
South24
West18
Region-wise Sales
H1’18 Growth%
Reported Comparable
North 7.9 14.6
East 9.4 16.2
South 3.9 10.4
West 6.9 13.6
Total 7.1 13.8
E-Commerce
Bar size represents Sales Value
% Cont. to domestic Sales 0.7 1.1
Comparable Growth is on estimated basis
% Cont to Domestic Sales
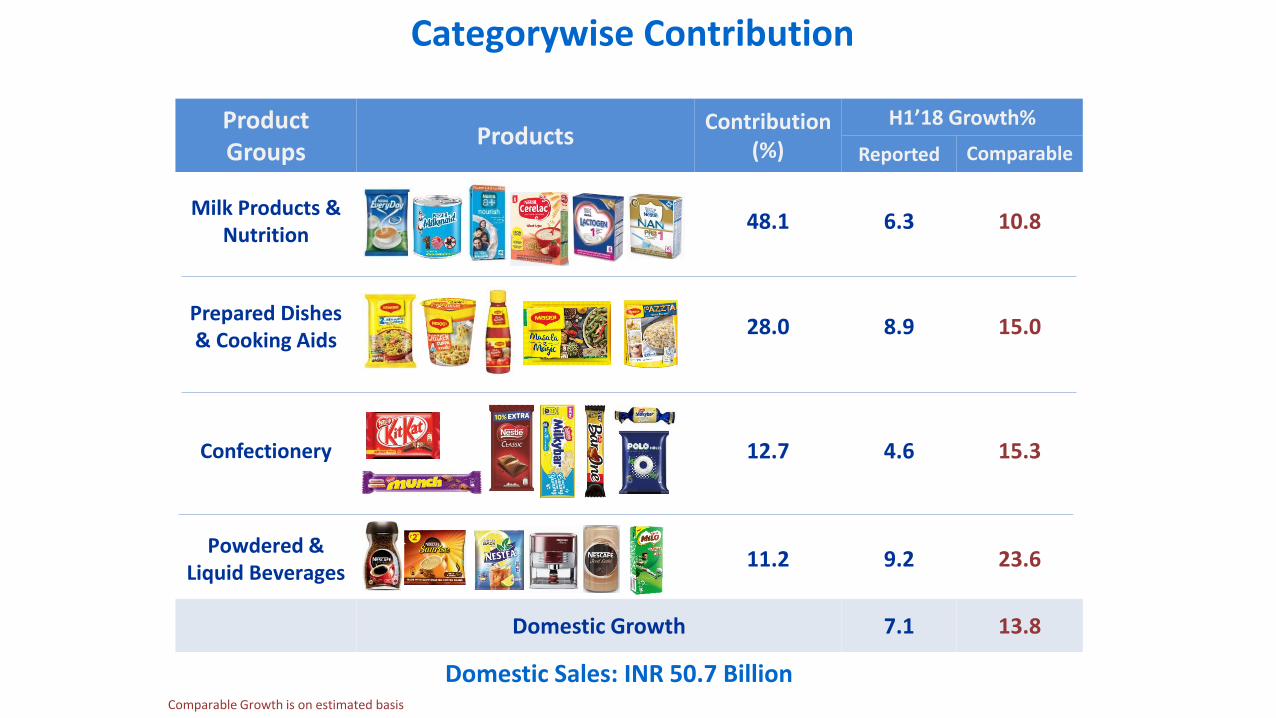
Categorywise Contribution
Domestic Sales: INR 50.7 Billion
Product Groups
ProductsContribution
(%)
H1’18 Growth%
Reported Comparable
Milk Products & Nutrition
48.1 6.3 10.8
Prepared Dishes & Cooking Aids
28.0 8.9 15.0
Confectionery 12.7 4.6 15.3
Powdered & Liquid Beverages
11.2 9.2 23.6
Domestic Growth 7.1 13.8
Comparable Growth is on estimated basis
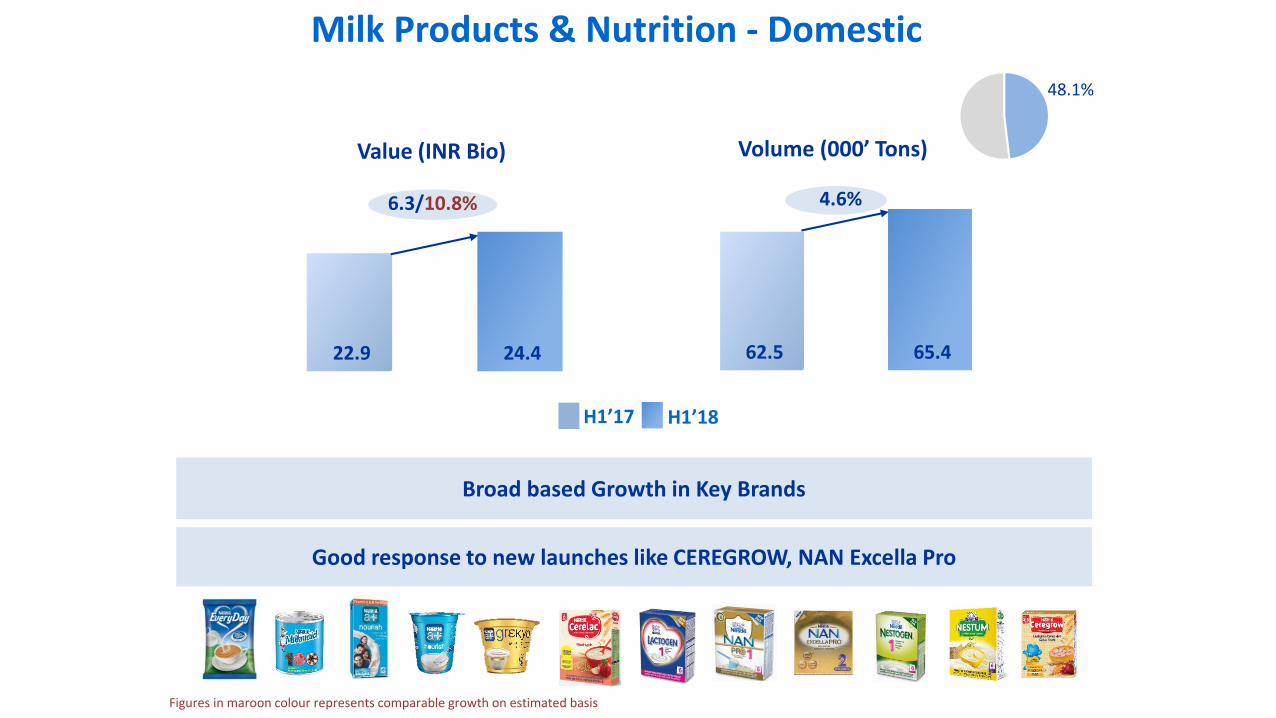
62.5 65.4 22.9 24.4
Milk Products & Nutrition - Domestic
48.1%
Value (INR Bio) Volume (000’ Tons)
Broad based Growth in Key Brands
H1’17 H1’18
6.3/10.8% 4.6%
Good response to new launches like CEREGROW, NAN Excella Pro
Figures in maroon colour represents comparable growth on estimated basis
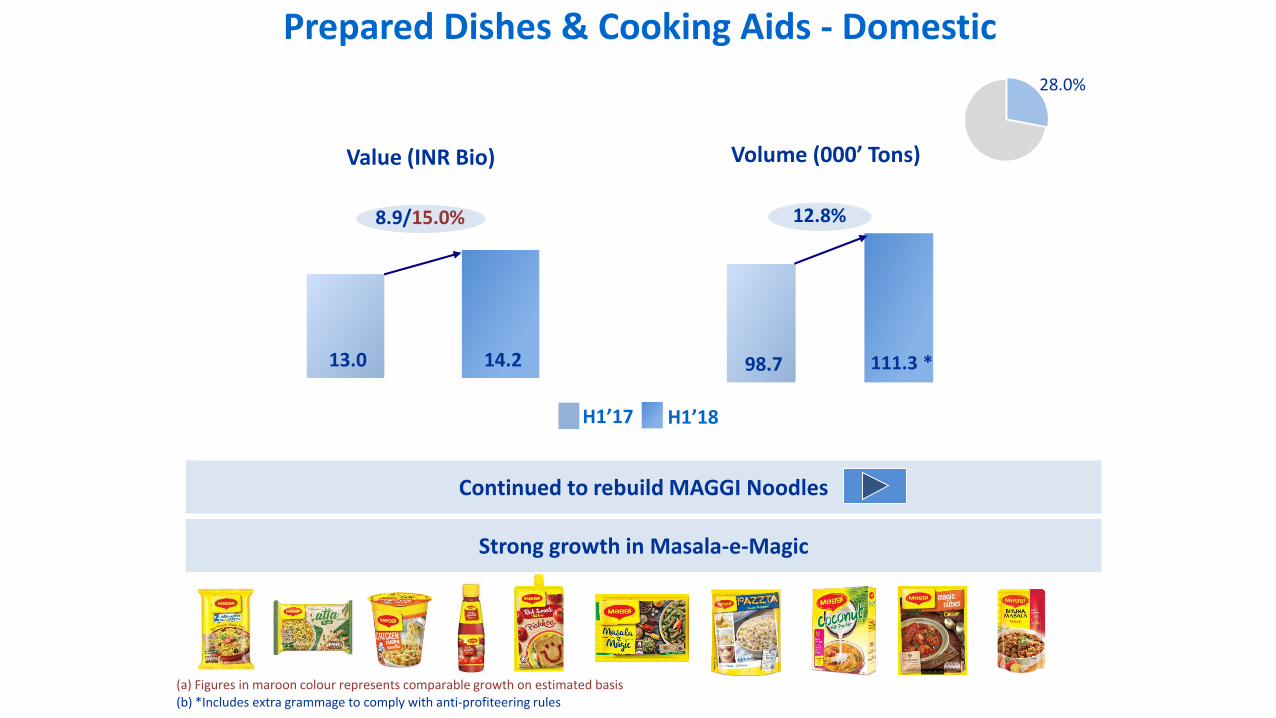
98.7 111.3 *13.0 14.2
Prepared Dishes & Cooking Aids - Domestic
28.0%
12.8%8.9/15.0%
Value (INR Bio) Volume (000’ Tons)
Continued to rebuild MAGGI Noodles
Strong growth in Masala-e-Magic
H1’17 H1’18
(a) Figures in maroon colour represents comparable growth on estimated basis(b) *Includes extra grammage to comply with anti-profiteering rules
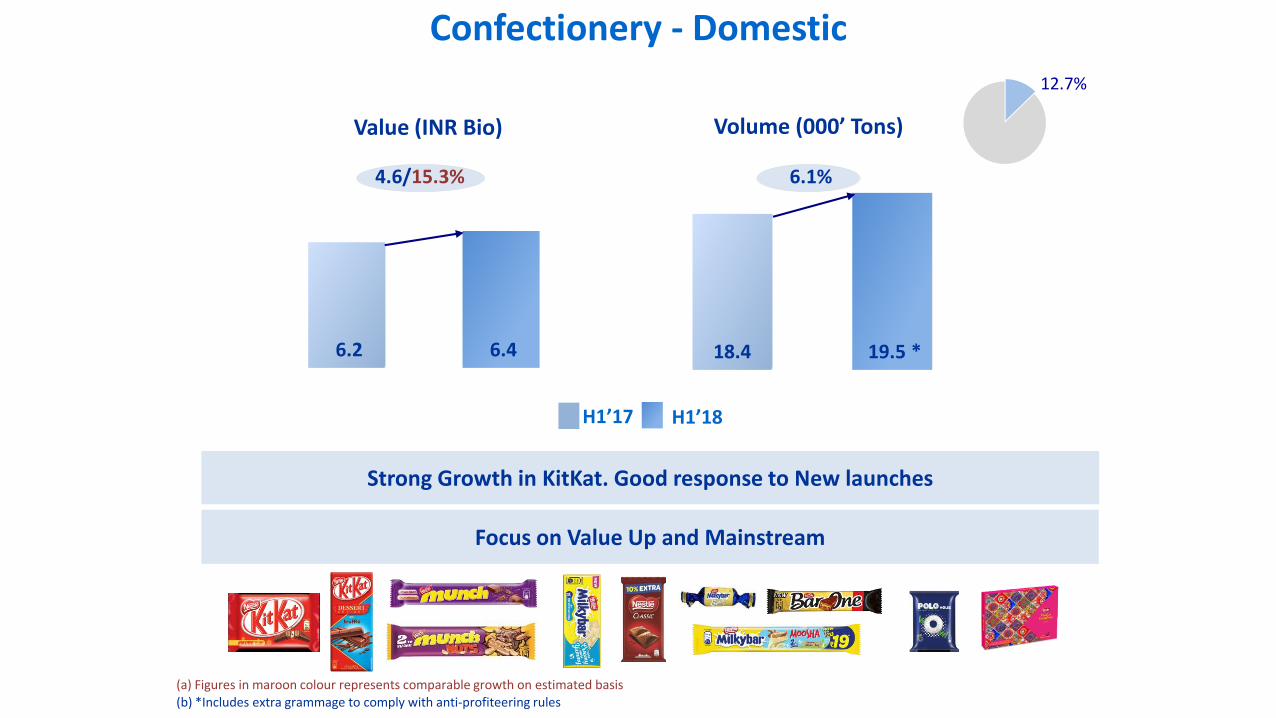
18.4 19.5 *6.2 6.4
Confectionery - Domestic
Value (INR Bio)
6.1%
Volume (000’ Tons)
H1’17 H1’18
12.7%
Focus on Value Up and Mainstream
Strong Growth in KitKat. Good response to New launches
4.6/15.3%
(a) Figures in maroon colour represents comparable growth on estimated basis(b) *Includes extra grammage to comply with anti-profiteering rules
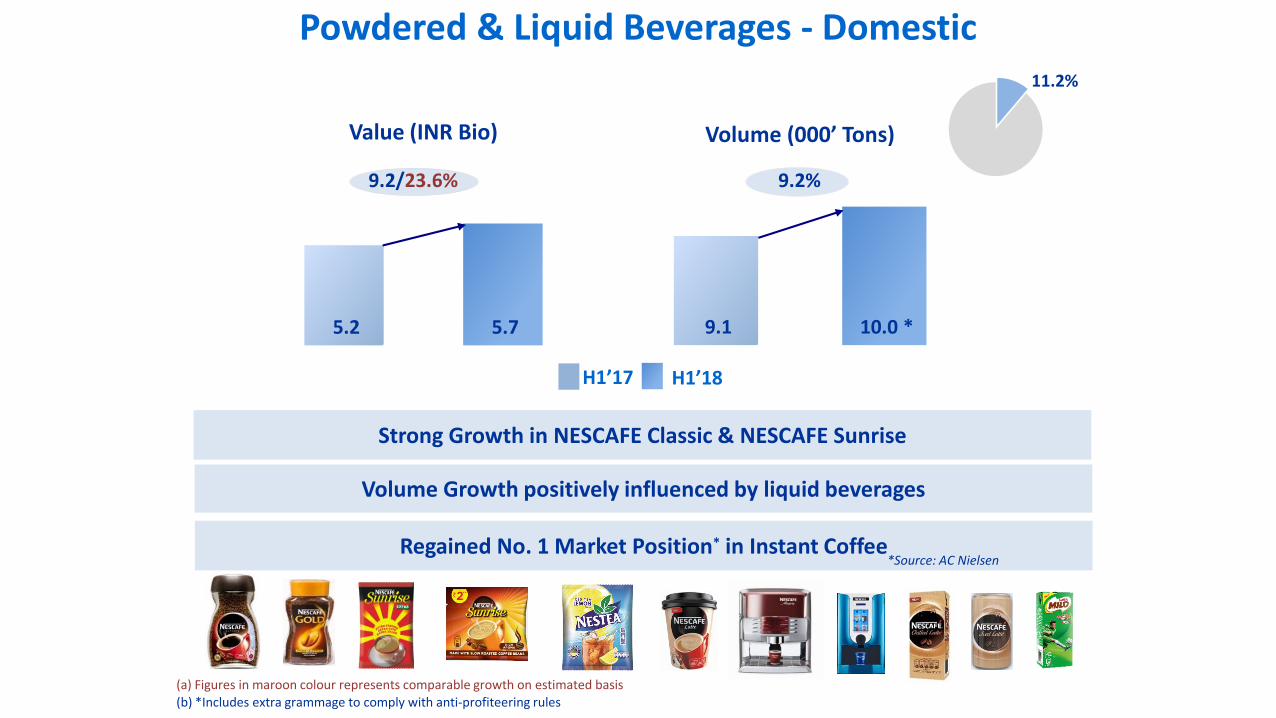
9.1 10.0 *5.2 5.7
Powdered & Liquid Beverages - Domestic11.2%
9.2%
Value (INR Bio) Volume (000’ Tons)
Strong Growth in NESCAFE Classic & NESCAFE Sunrise
Volume Growth positively influenced by liquid beverages
9.2/23.6%
H1’17 H1’18
(a) Figures in maroon colour represents comparable growth on estimated basis(b) *Includes extra grammage to comply with anti-profiteering rules
Regained No. 1 Market Position* in Instant Coffee*Source: AC Nielsen
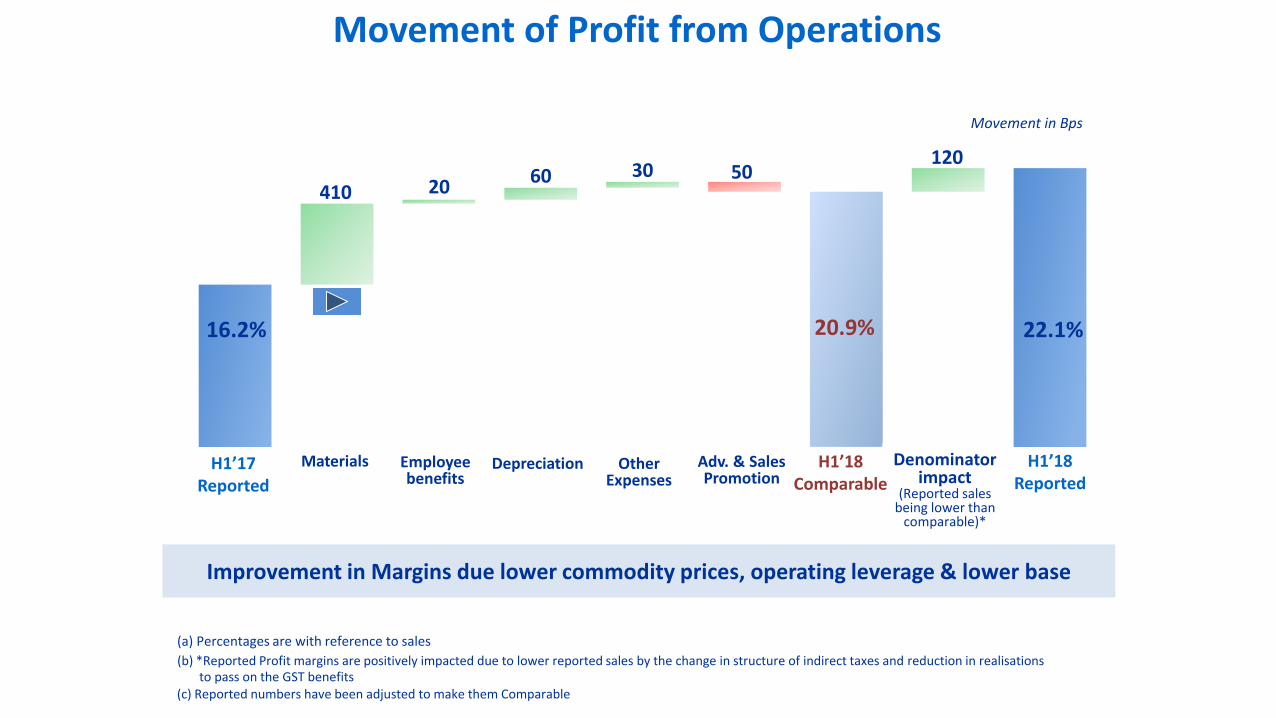
16.2% 22.1%
120
410
Movement of Profit from Operations
20.9%
60
Movement in Bps
Other Expenses
(a) Percentages are with reference to sales
(b) *Reported Profit margins are positively impacted due to lower reported sales by the change in structure of indirect taxes and reduction in realisations to pass on the GST benefits
(c) Reported numbers have been adjusted to make them Comparable
H1’17 Reported
H1’18 Reported
H1’18 Comparable
20
Materials Employee benefits
Depreciation
50
Denominator impact
(Reported sales being lower than
comparable)*
Improvement in Margins due lower commodity prices, operating leverage & lower base
30
Adv. & Sales Promotion
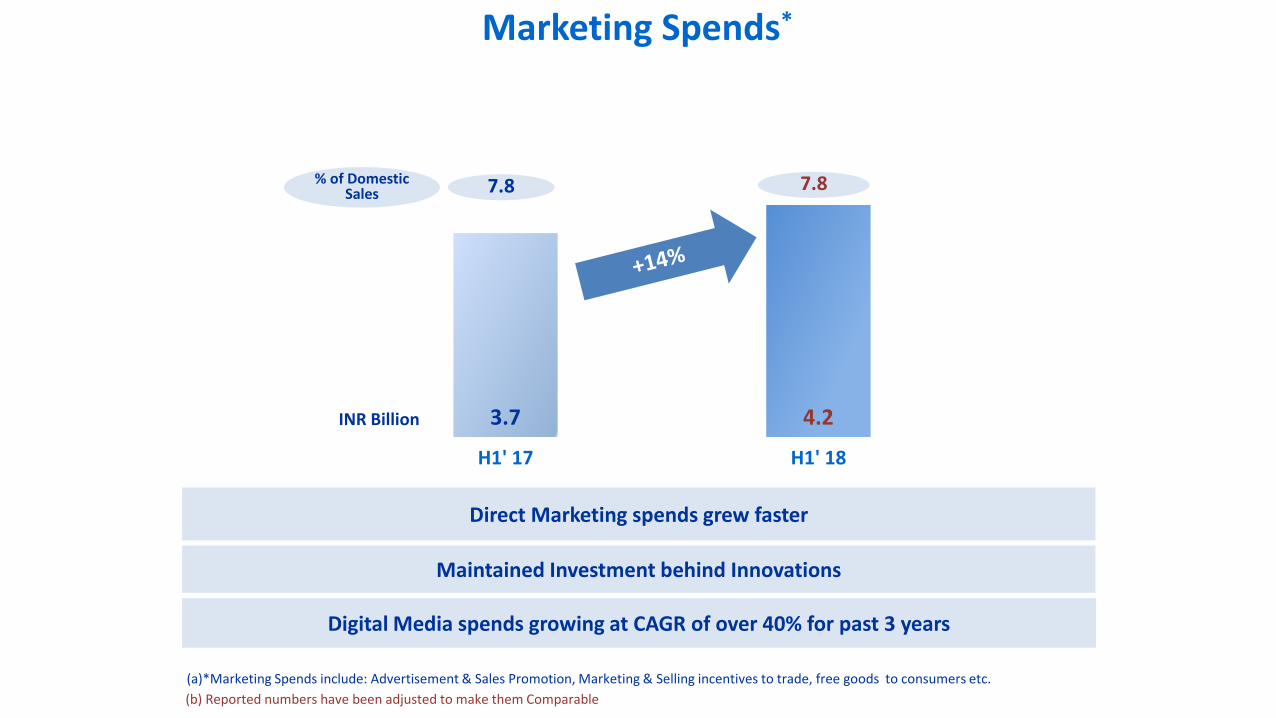
3.7 4.2
H1' 17 H1' 18
Source: Nielsen
Maintained Investment behind Innovations
7.8 7.8
(b) Reported numbers have been adjusted to make them Comparable
INR Billion
% of Domestic Sales
Marketing Spends*
Digital Media spends growing at CAGR of over 40% for past 3 years
Direct Marketing spends grew faster
(a)*Marketing Spends include: Advertisement & Sales Promotion, Marketing & Selling incentives to trade, free goods to consumers etc.
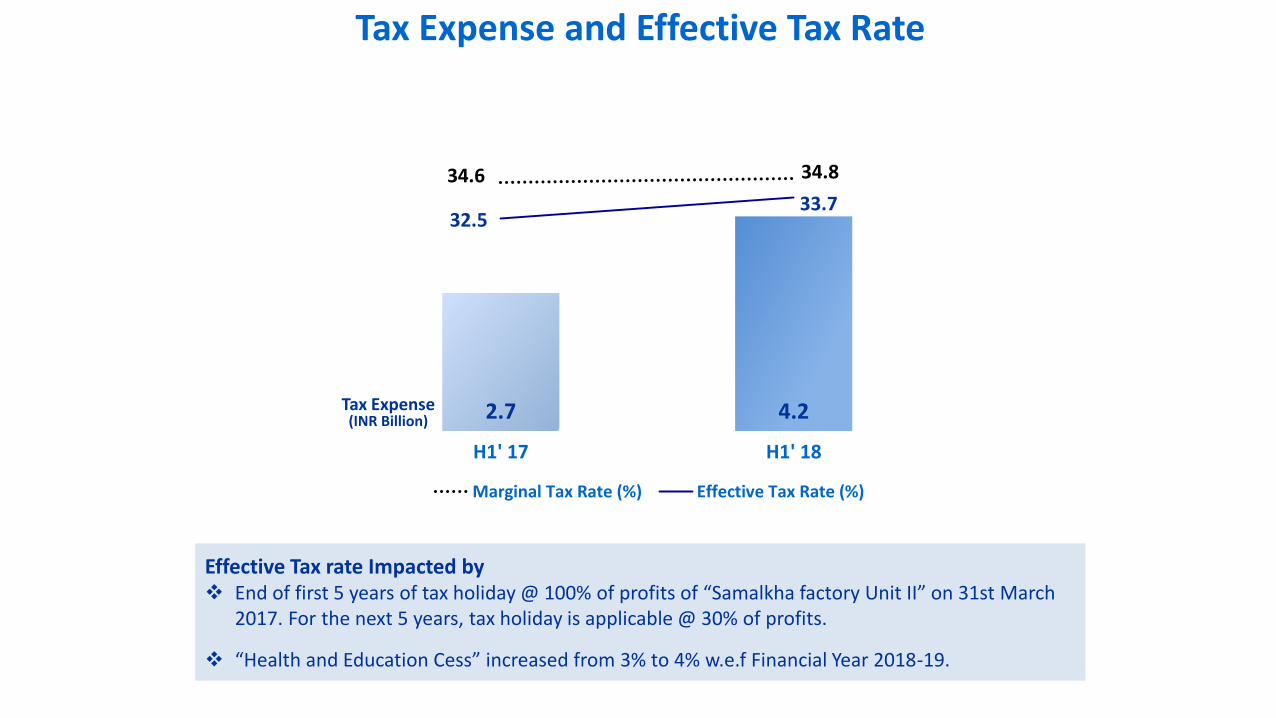
2.7 4.2
34.6 34.8
32.5 33.7
20.0
25.0
30.0
35.0
-
0.5
1.0
1.5
2.0
2.5
3.0
3.5
4.0
4.5
5.0
5.5
6.0
H1' 17 H1' 18
Marginal Tax Rate (%) Effective Tax Rate (%)
Tax Expense and Effective Tax Rate
Effective Tax rate Impacted by End of first 5 years of tax holiday @ 100% of profits of “Samalkha factory Unit II” on 31st March
2017. For the next 5 years, tax holiday is applicable @ 30% of profits.
“Health and Education Cess” increased from 3% to 4% w.e.f Financial Year 2018-19.
Tax Expense (INR Billion)
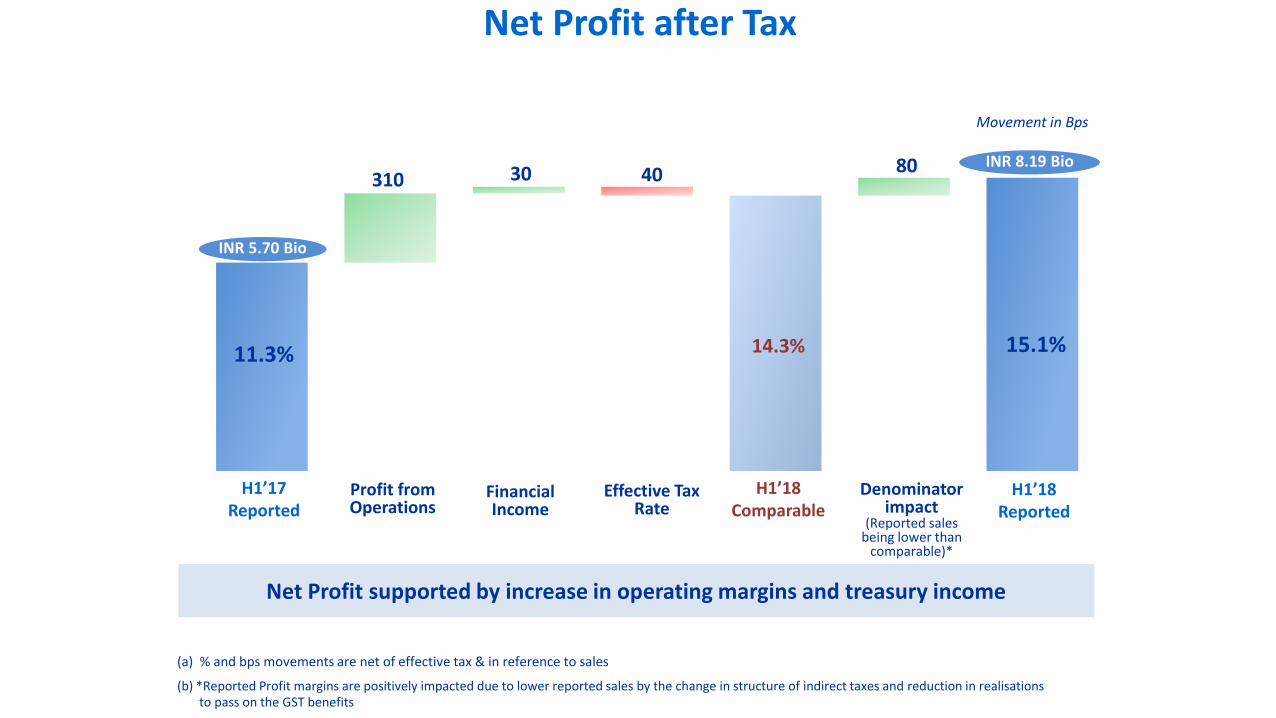
Net Profit after Tax
11.3% 15.1%
Profit from Operations
310 40INR 8.19 Bio
INR 5.70 Bio
30
Financial Income
80
14.3%
H1’17 Reported
H1’18 Reported
H1’18 Comparable
(a) % and bps movements are net of effective tax & in reference to sales
Movement in Bps
Denominator impact
(Reported sales being lower than
comparable)*
(b) *Reported Profit margins are positively impacted due to lower reported sales by the change in structure of indirect taxes and reduction in realisations to pass on the GST benefits
Effective Tax Rate
Net Profit supported by increase in operating margins and treasury income
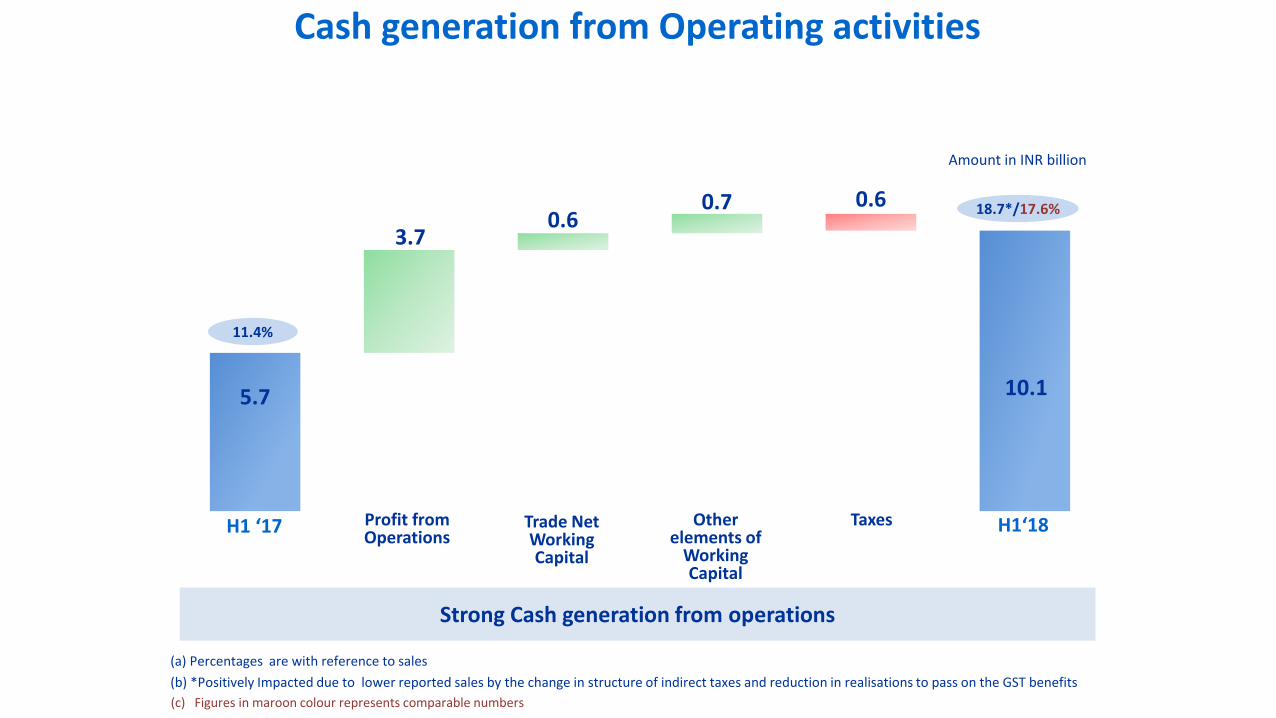
5.7
3.70.6
0.7 0.6
10.1
Profit from Operations
Trade Net Working Capital
Cash generation from Operating activities
Other elements of
Working Capital
Taxes
11.4%
18.7*/17.6%
(a) Percentages are with reference to sales
(b) *Positively Impacted due to lower reported sales by the change in structure of indirect taxes and reduction in realisations to pass on the GST benefits
H1 ‘17 H1‘18
Amount in INR billion
Strong Cash generation from operations
(c) Figures in maroon colour represents comparable numbers
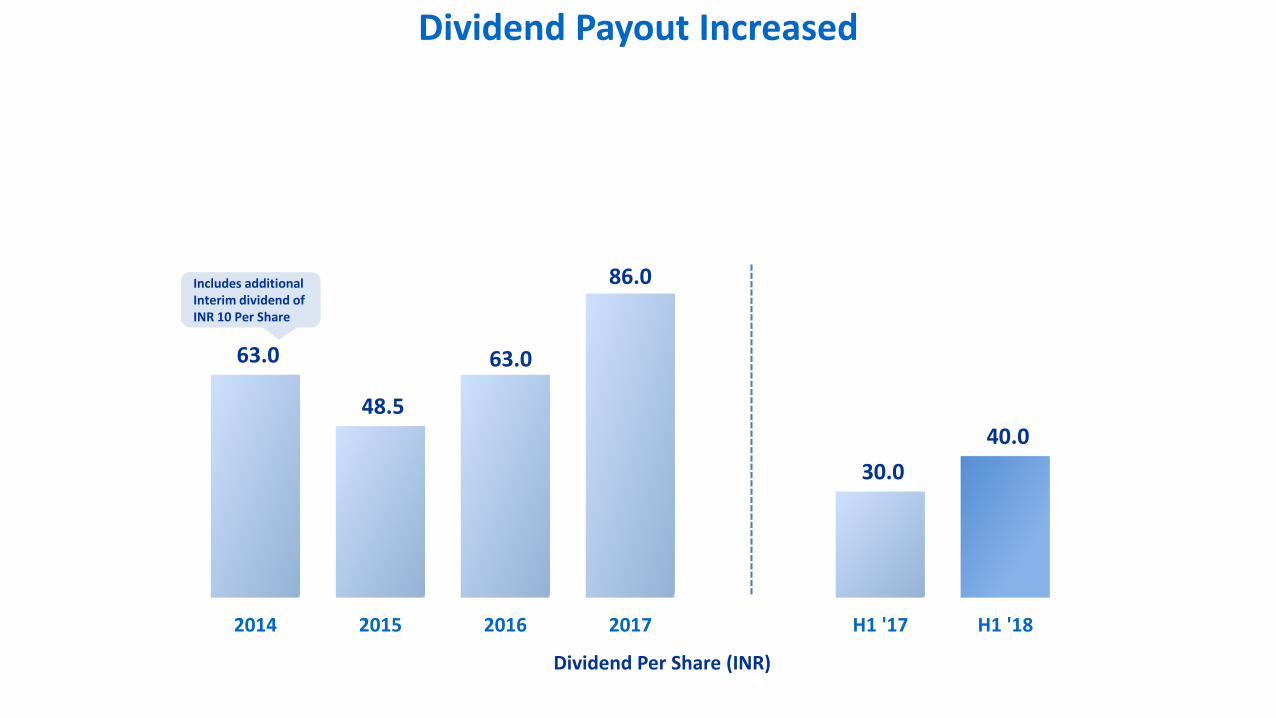
63.0
48.5
63.0
86.0
30.0
40.0
2014 2015 2016 2017 H1 '17 H1 '18
Dividend Per Share (INR)
Dividend Payout Increased
Includes additional Interim dividend of INR 10 Per Share
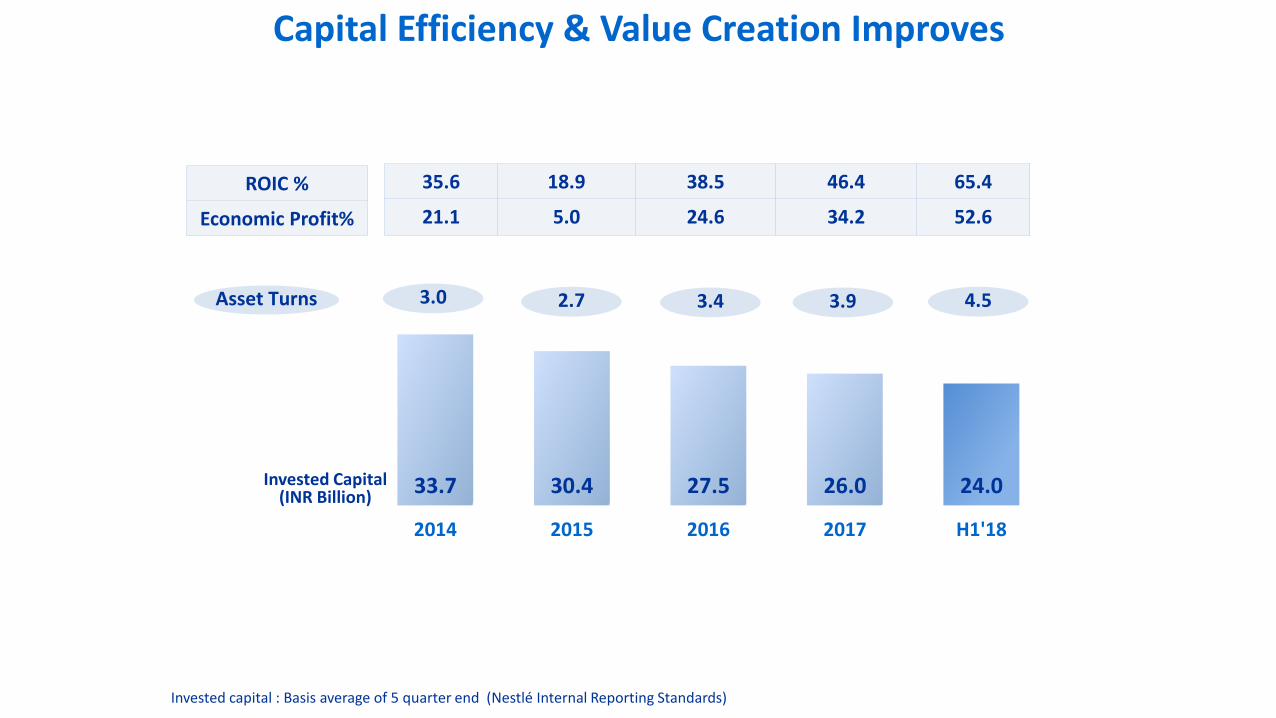
33.7 30.4 27.5 26.0 24.00
5
10
15
20
25
30
35
40
2014 2015 2016 2017 H1'18
Capital Efficiency & Value Creation Improves
Invested capital : Basis average of 5 quarter end (Nestlé Internal Reporting Standards)
Invested Capital (INR Billion)
35.6 18.9 38.5 46.4 65.4
21.1 5.0 24.6 34.2 52.6
ROIC %
Economic Profit%
3.0 2.7 3.4 3.9Asset Turns 4.5
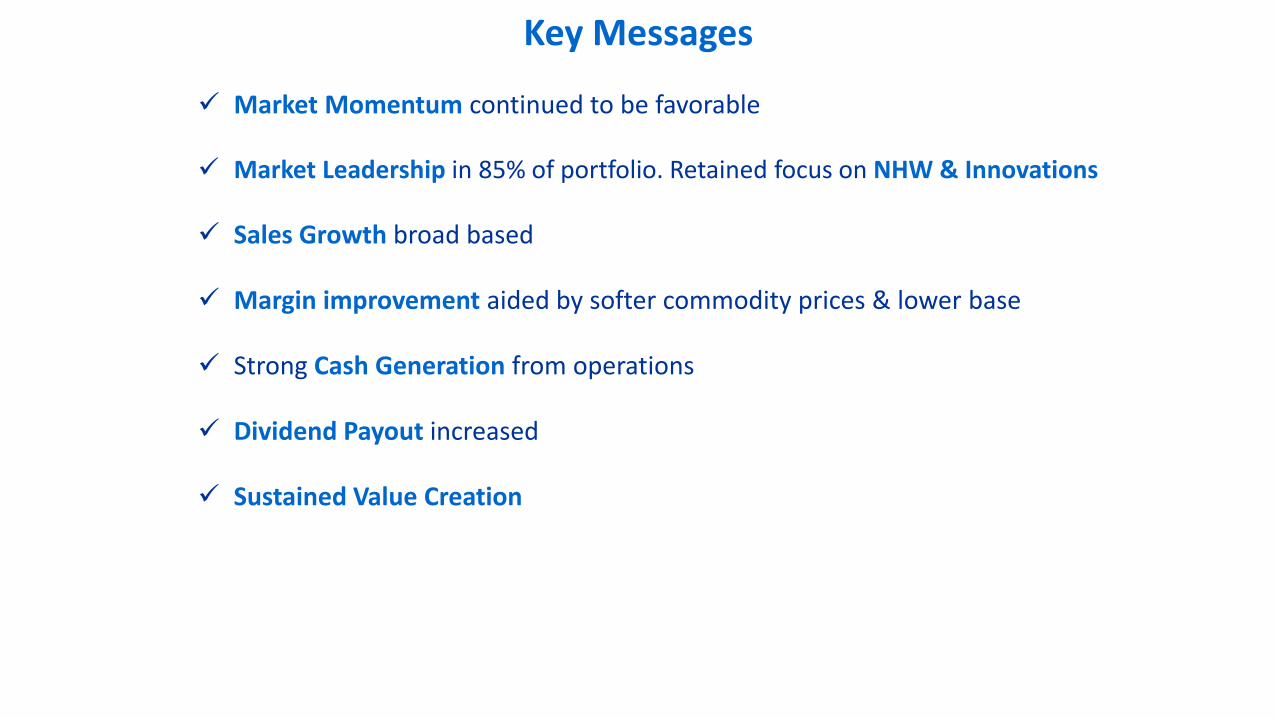
Key Messages
Market Momentum continued to be favorable
Market Leadership in 85% of portfolio. Retained focus on NHW & Innovations
Sales Growth broad based
Margin improvement aided by softer commodity prices & lower base
Strong Cash Generation from operations
Dividend Payout increased
Sustained Value Creation
-
20
40
60
80
100
120
140
160
3.00
3.50
4.00
4.50
5.00
5.50
6.00
6.50
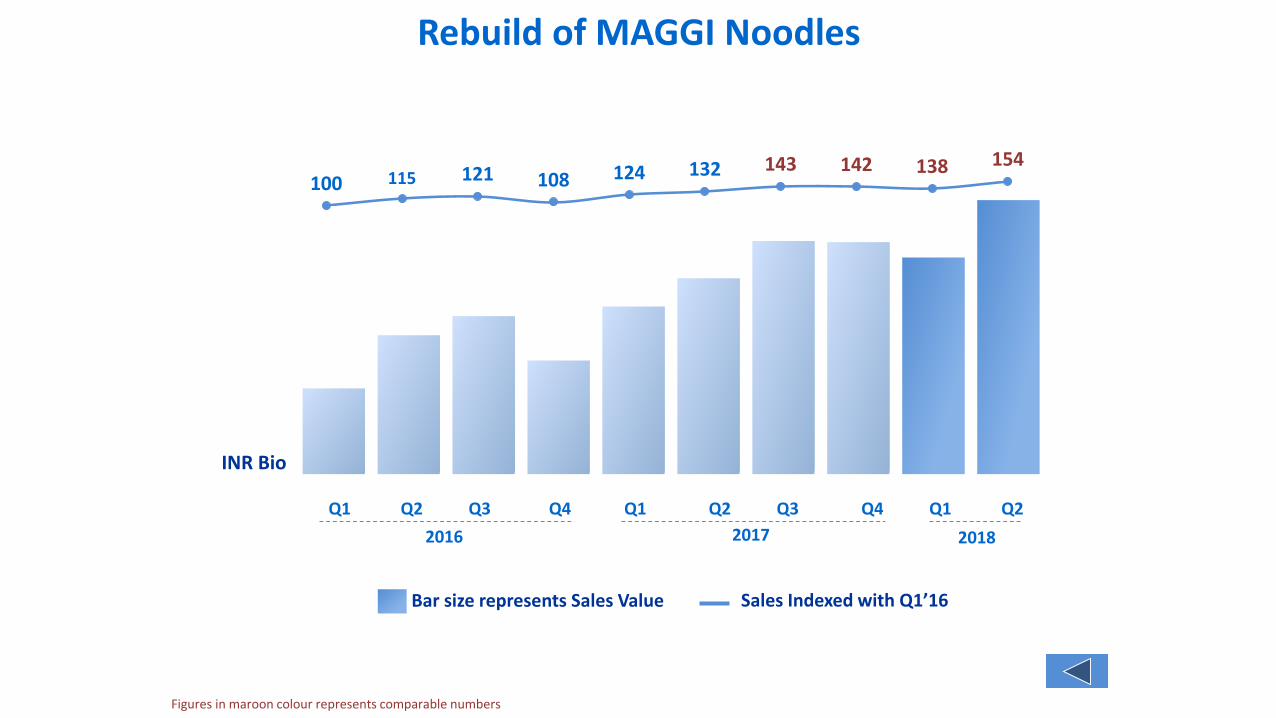
Rebuild of MAGGI Noodles
29
Sales Indexed with Q1’16Bar size represents Sales Value
INR Bio
Figures in maroon colour represents comparable numbers
Q1 Q2 Q3 Q4 Q1 Q2 Q3 Q4 Q1 Q2
2016 2017 2018
100 115 121 108 124 132 143 142 138 154
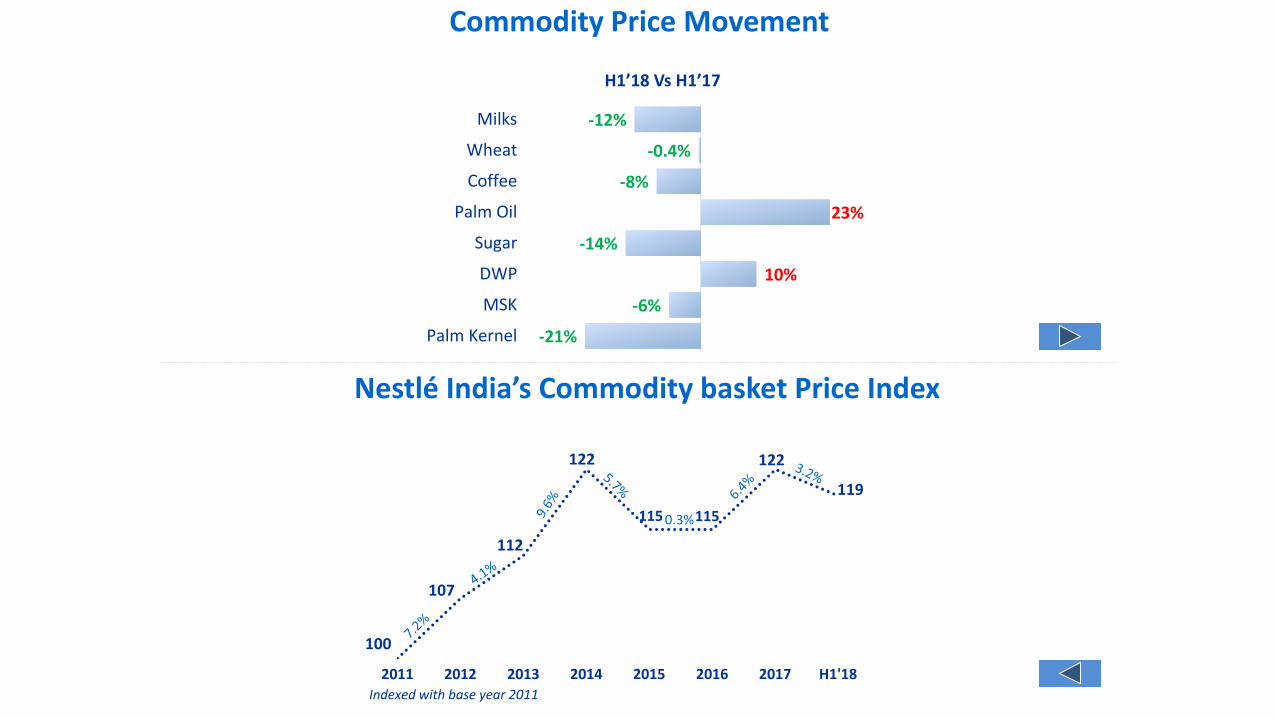
Commodity Price Movement
-12%
-0.4%
-8%
23%
-14%
10%
-6%
-21%
Milks
Wheat
Coffee
Palm Oil
Sugar
DWP
MSK
Palm Kernel
H1’18 Vs H1’17
100
107
112
122
115 115
122
119
2011 2012 2013 2014 2015 2016 2017 H1'18
0.3%
Indexed with base year 2011
Nestlé India’s Commodity basket Price Index
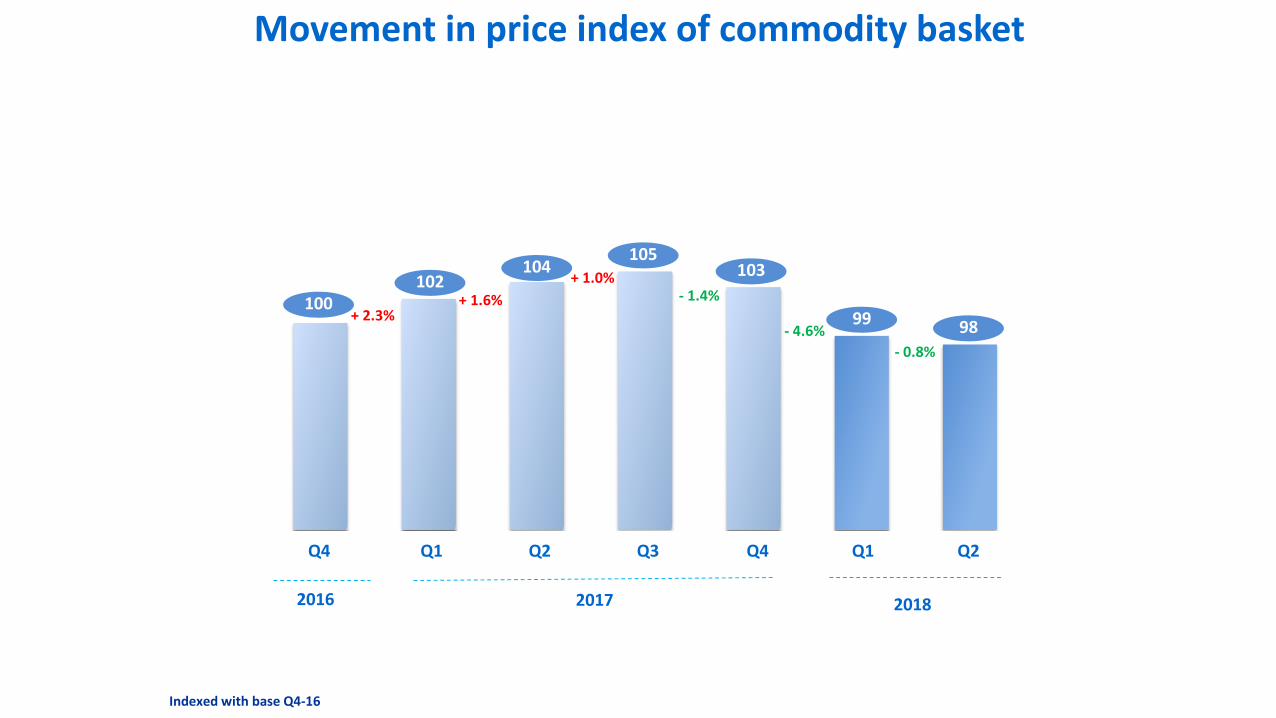
Movement in price index of commodity basket
+ 2.3%+ 1.6%
+ 1.0%- 1.4%
- 4.6%
102104
99
103105
100
98
- 0.8%
Indexed with base Q4-16
Q4 Q1 Q2 Q3 Q4 Q1 Q2
2017 20182016
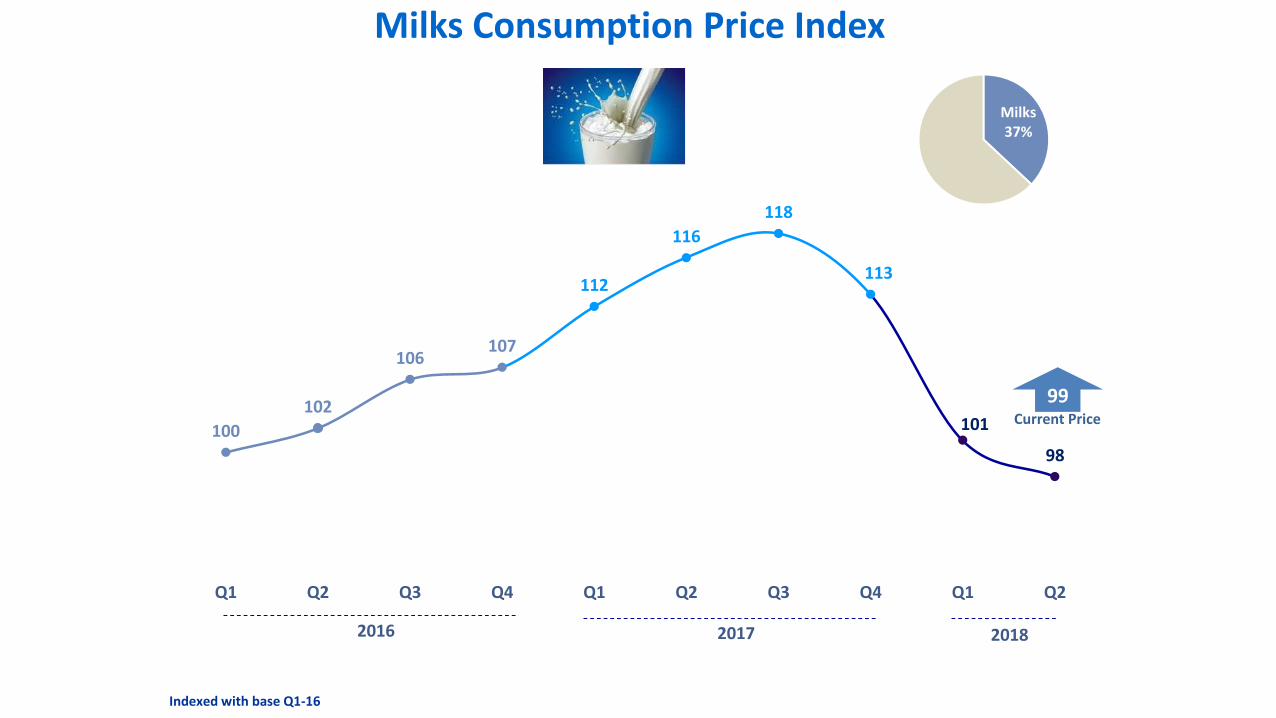
Indexed with base Q1-16
Milks Consumption Price Index
Milks 37%
100
102
106107
112
116
118
113
101
98
Q1 Q2 Q3 Q4 Q1 Q2 Q3 Q4 Q1 Q2
Current Price
99
2016 2017 2018
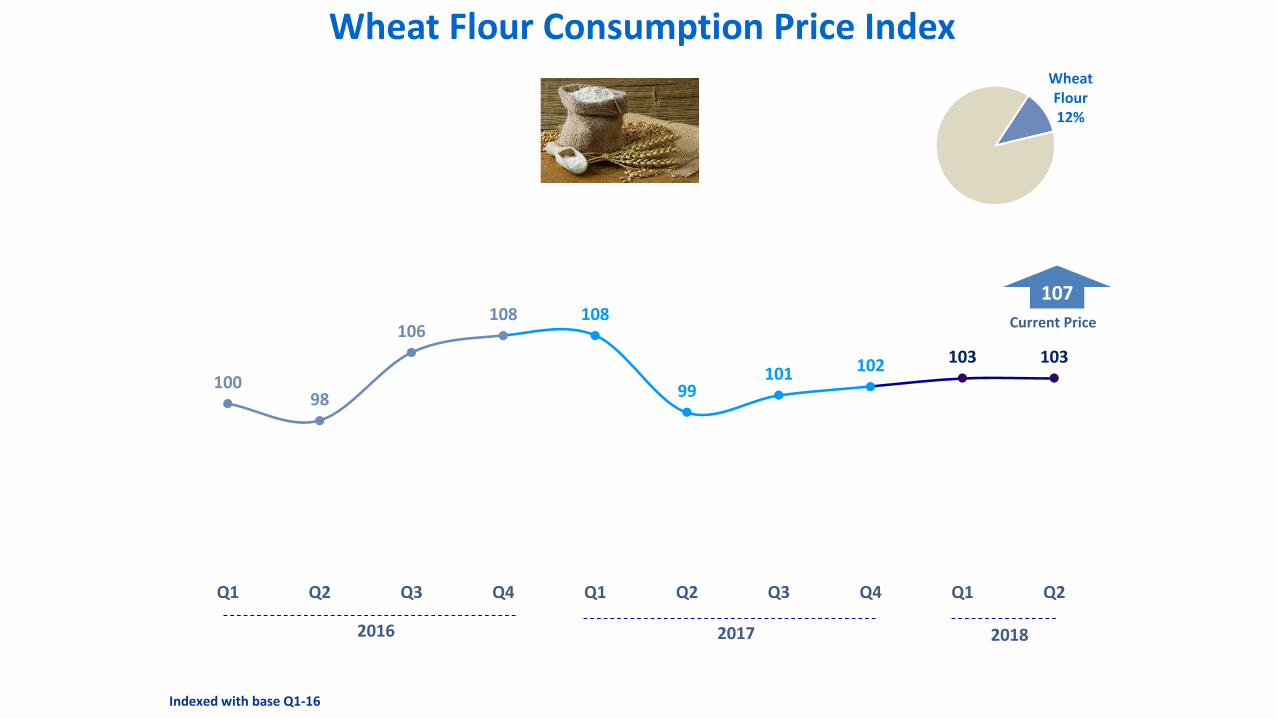
Wheat Flour Consumption Price IndexWheat Flour12%
10098
106108 108
99101 102 103 103
Q1 Q2 Q3 Q4 Q1 Q2 Q3 Q4 Q1 Q2
2016 2017 2018
Current Price
107
Indexed with base Q1-16
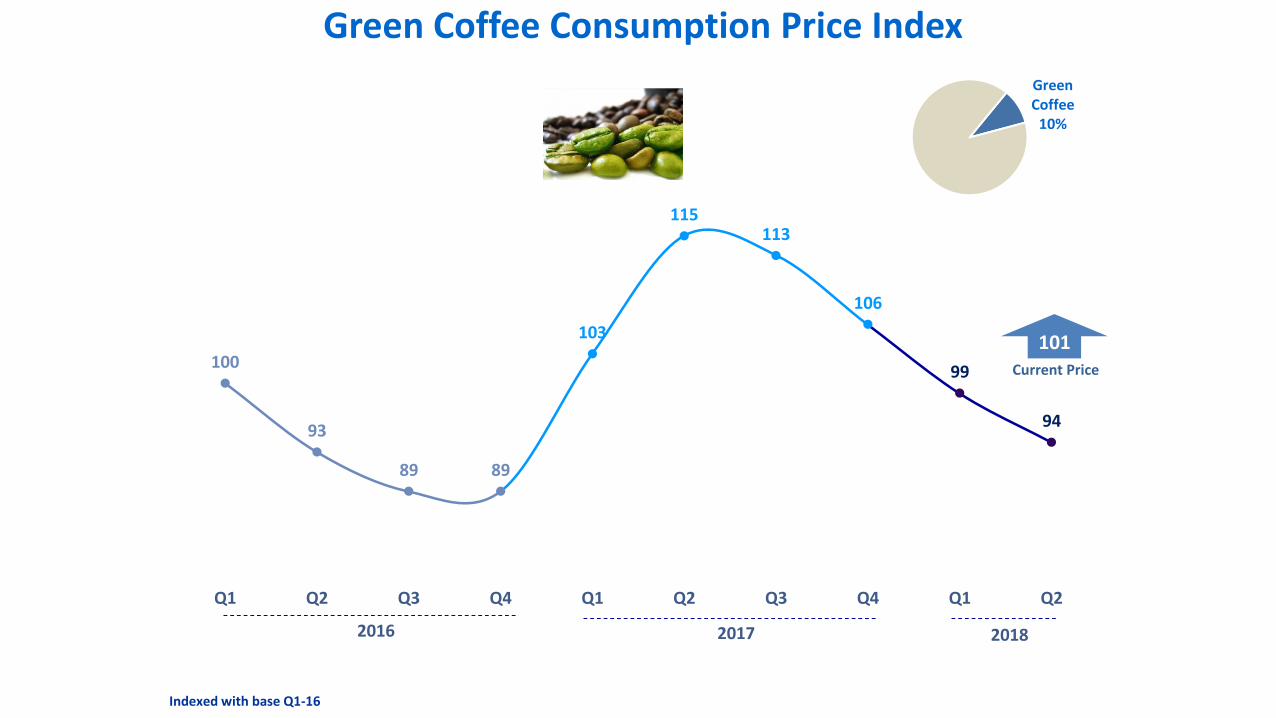
Green Coffee Consumption Price Index
Green Coffee
10%
100
93
89 89
103
115113
106
99
94
Q1 Q2 Q3 Q4 Q1 Q2 Q3 Q4 Q1 Q2
2016 2017 2018
Current Price
101
Indexed with base Q1-16
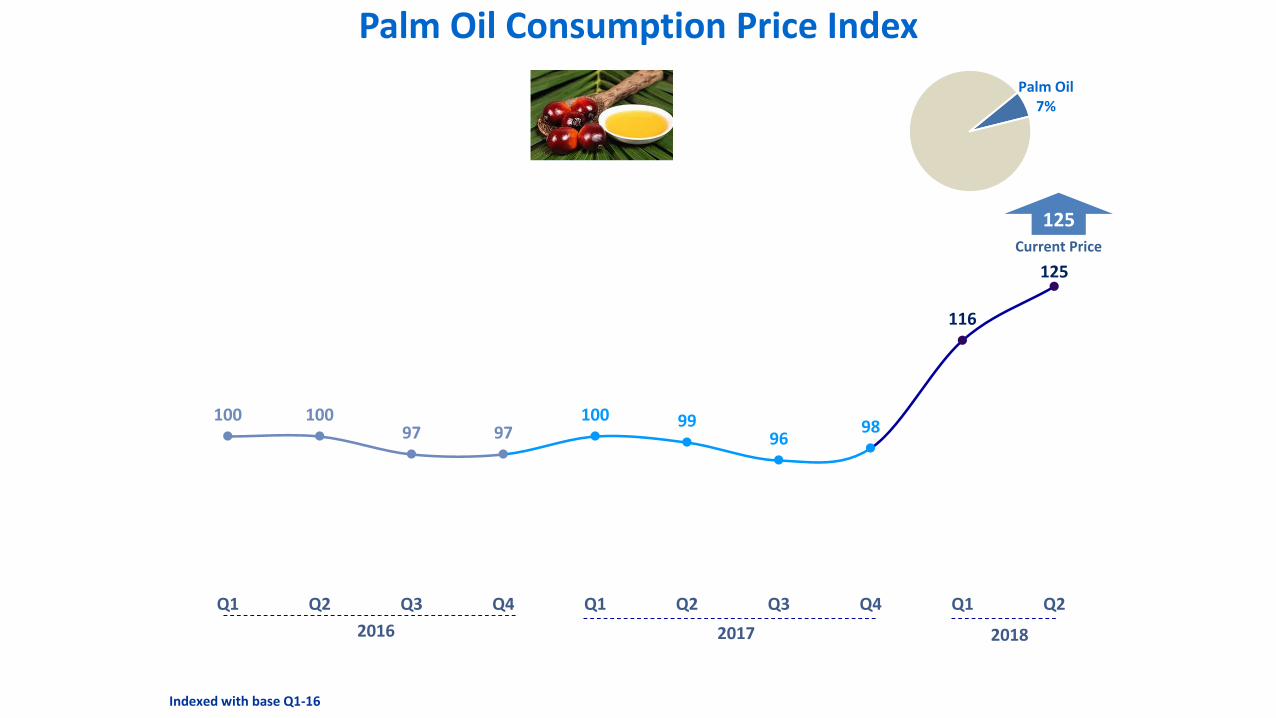
Palm Oil Consumption Price Index
Palm Oil7%
100 10097 97
100 9996
98
116
125
Q1 Q2 Q3 Q4 Q1 Q2 Q3 Q4 Q1 Q2
2016 2017 2018
Current Price
125
Indexed with base Q1-16
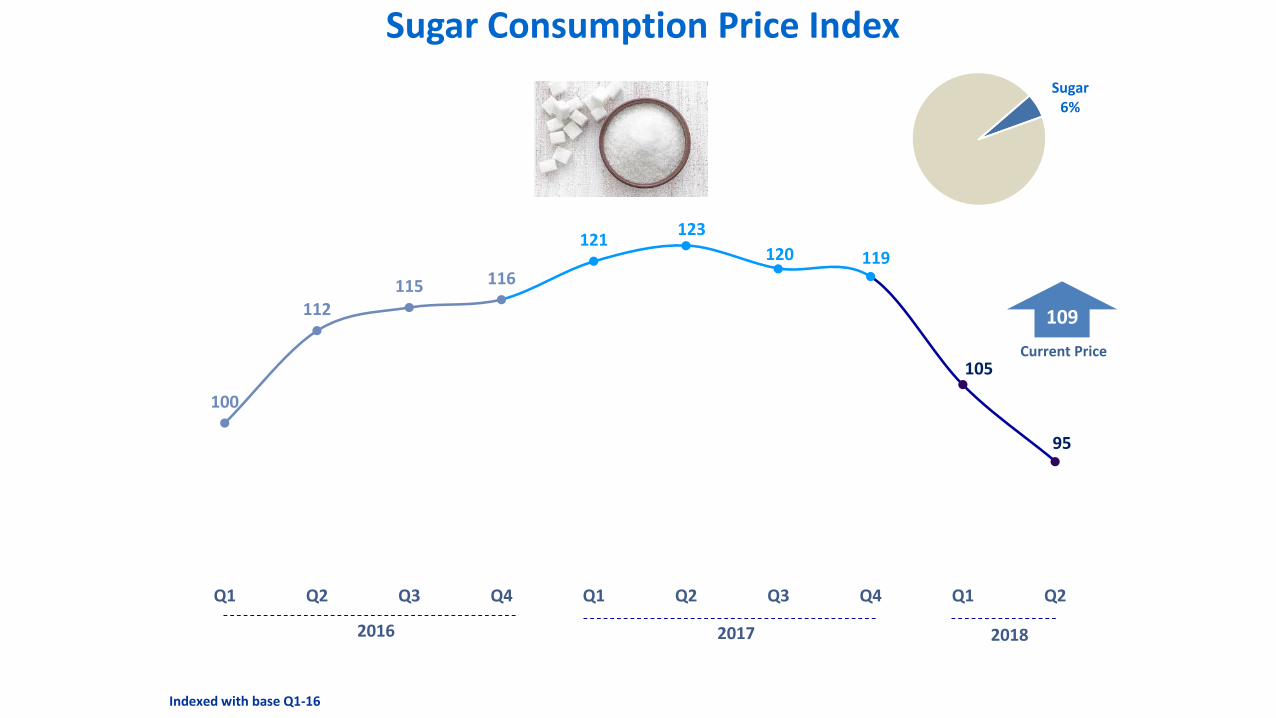
Sugar Consumption Price Index
Sugar6%
100
112115 116
121123
120 119
105
95
Q1 Q2 Q3 Q4 Q1 Q2 Q3 Q4 Q1 Q2
2016 2017 2018
Current Price
109
Indexed with base Q1-16
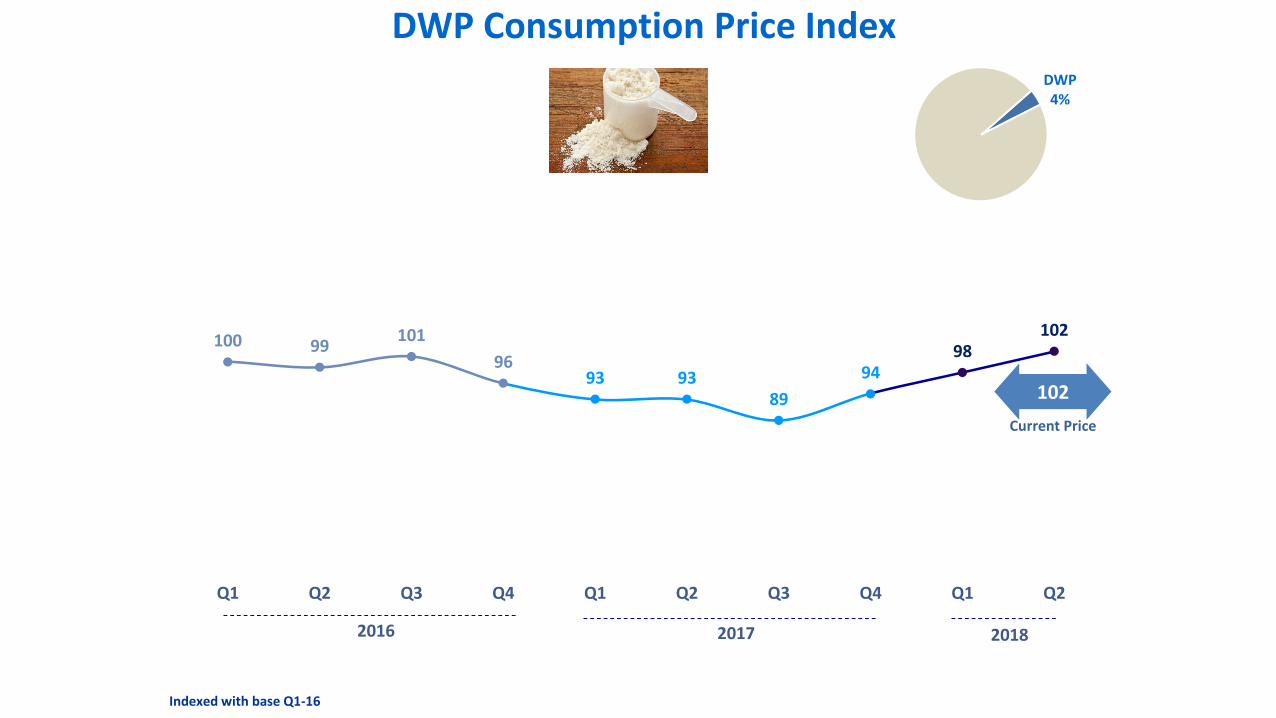
DWP Consumption Price IndexDWP4%
100 99101
9693 93
89
9498
102
Q1 Q2 Q3 Q4 Q1 Q2 Q3 Q4 Q1 Q2
2016 2017 2018
Current Price
Indexed with base Q1-16
102
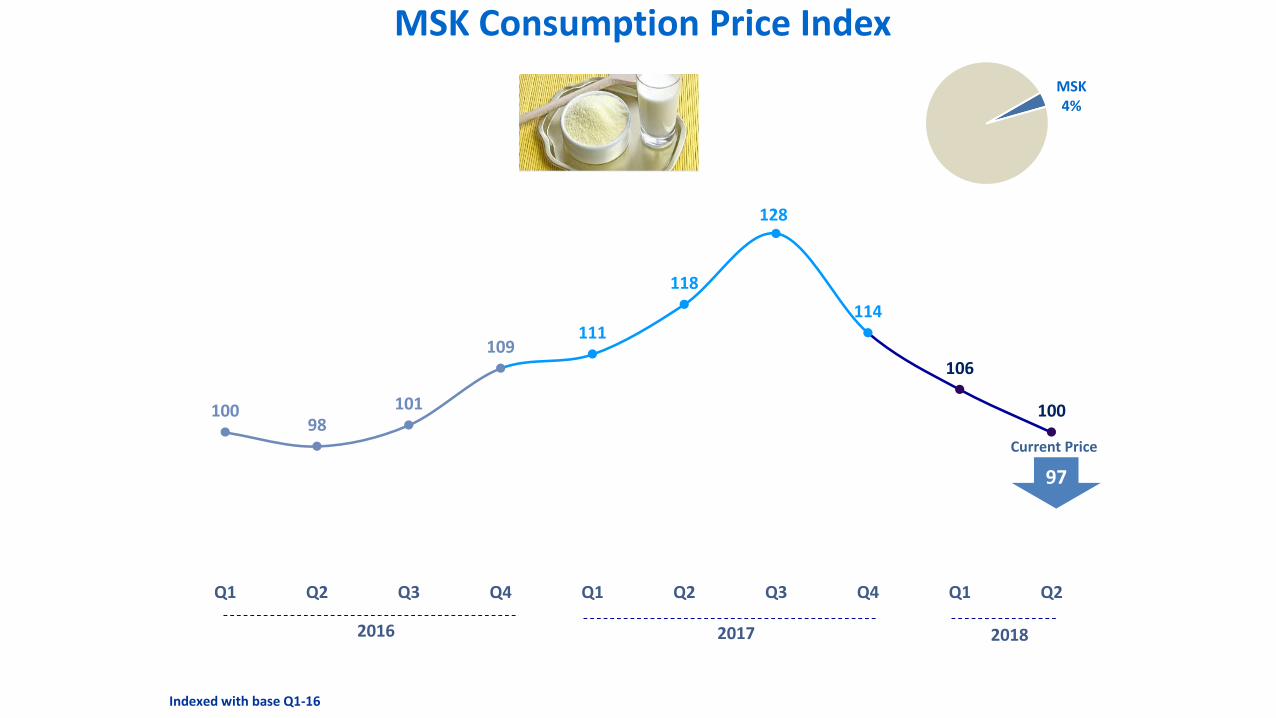
MSK Consumption Price Index
MSK 4%
10098
101
109111
118
128
114
106
100
Q1 Q2 Q3 Q4 Q1 Q2 Q3 Q4 Q1 Q2
2016 2017 2018
Current Price
97
Indexed with base Q1-16
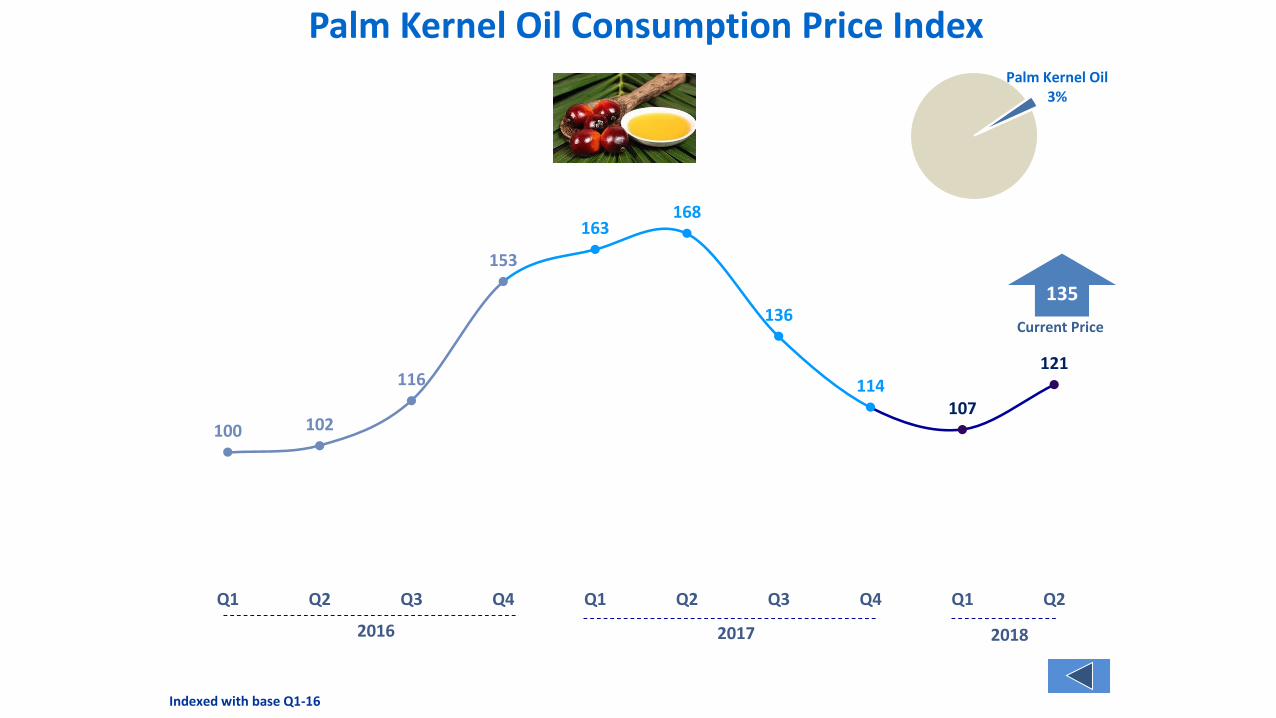
Palm Kernel Oil Consumption Price IndexPalm Kernel Oil
3%
100 102
116
153
163168
136
114107
121
Q1 Q2 Q3 Q4 Q1 Q2 Q3 Q4 Q1 Q2
2016 2017 2018
Current Price
135
Indexed with base Q1-16