Embed Size (px)
Citation preview
SPISim1SPISim Analysis SuiteTD/FD analysis for SI/PI
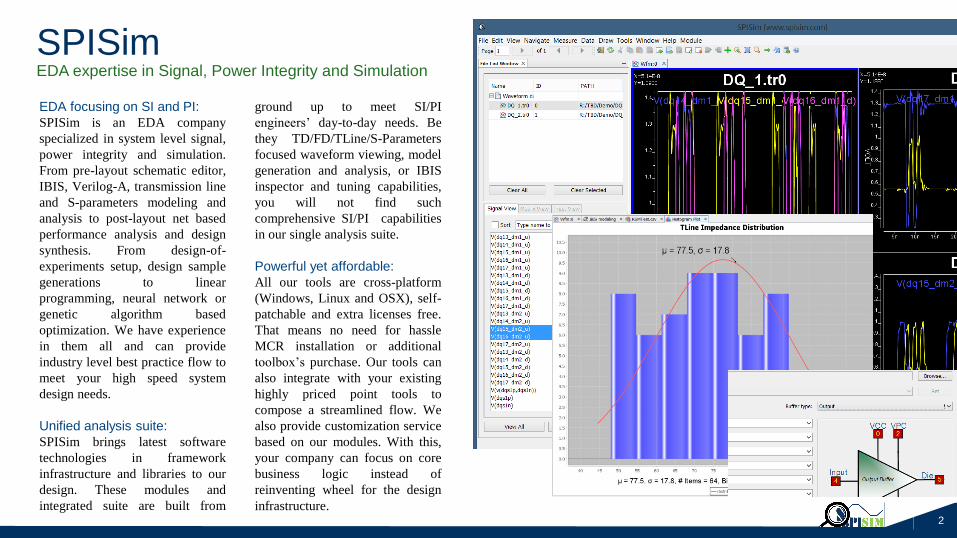
SPISimEDA expertise in Signal, Power Integrity and Simulation
2
EDA focusing on SI and PI:
SPISim is an EDA company
specialized in system level signal,
power integrity and simulation.
From pre-layout schematic editor,
IBIS, Verilog-A, transmission line
and S-parameters modeling and
analysis to post-layout net based
performance analysis and design
synthesis. From design-of-
experiments setup, design sample
generations to linear
programming, neural network or
genetic algorithm based
optimization. We have experience
in them all and can provide
industry level best practice flow to
meet your high speed system
design needs.
Unified analysis suite:
SPISim brings latest software
technologies in framework
infrastructure and libraries to our
design. These modules and
integrated suite are built from
ground up to meet SI/PI
engineers’ day-to-day needs. Be
they TD/FD/TLine/S-Parameters
focused waveform viewing, model
generation and analysis, or IBIS
inspector and tuning capabilities,
you will not find such
comprehensive SI/PI capabilities
in our single analysis suite.
Powerful yet affordable:
All our tools are cross-platform
(Windows, Linux and OSX), self-
patchable and extra licenses free.
That means no need for hassle
MCR installation or additional
toolbox’s purchase. Our tools can
also integrate with your existing
highly priced point tools to
compose a streamlined flow. We
also provide customization service
based on our modules. With this,
your company can focus on core
business logic instead of
reinventing wheel for the design
infrastructure.
SPISim Analysis SuiteTD/FD analysis for SI/PI
3
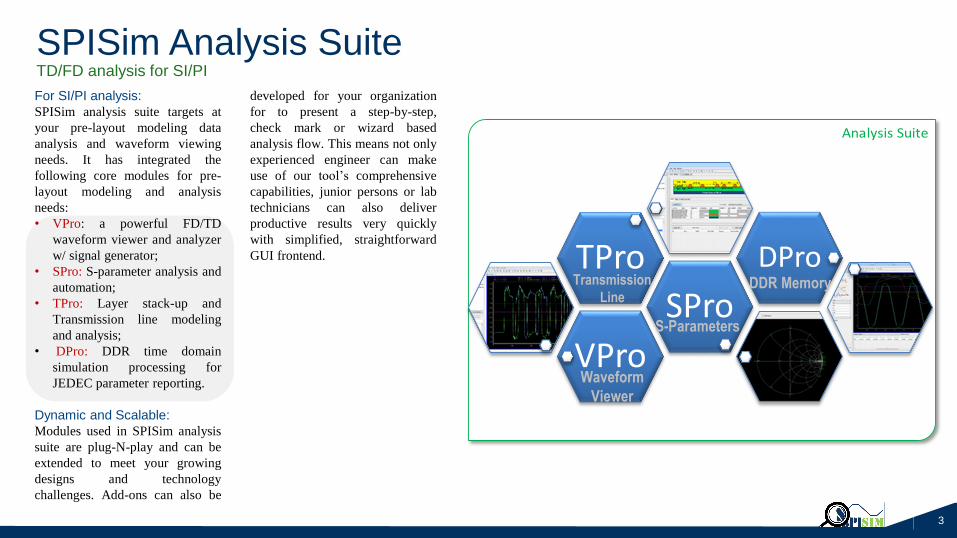
For SI/PI analysis:
SPISim analysis suite targets at
your pre-layout modeling data
analysis and waveform viewing
needs. It has integrated the
following core modules for pre-
layout modeling and analysis
needs:
• VPro: a powerful FD/TD
waveform viewer and analyzer
w/ signal generator;
• SPro: S-parameter analysis and
automation;
• TPro: Layer stack-up and
Transmission line modeling
and analysis;
• DPro: DDR time domain
simulation processing for
JEDEC parameter reporting.
Dynamic and Scalable:
Modules used in SPISim analysis
suite are plug-N-play and can be
extended to meet your growing
designs and technology
challenges. Add-ons can also be
developed for your organization
for to present a step-by-step,
check mark or wizard based
analysis flow. This means not only
experienced engineer can make
use of our tool’s comprehensive
capabilities, junior persons or lab
technicians can also deliver
productive results very quickly
with simplified, straightforward
GUI frontend.
VPro
SPro
TPro DProDDR MemoryTransmission
Line
S-Parameters
Waveform
Viewer
SPIVPro:Time domain/Frequency domain waveform viewer
4
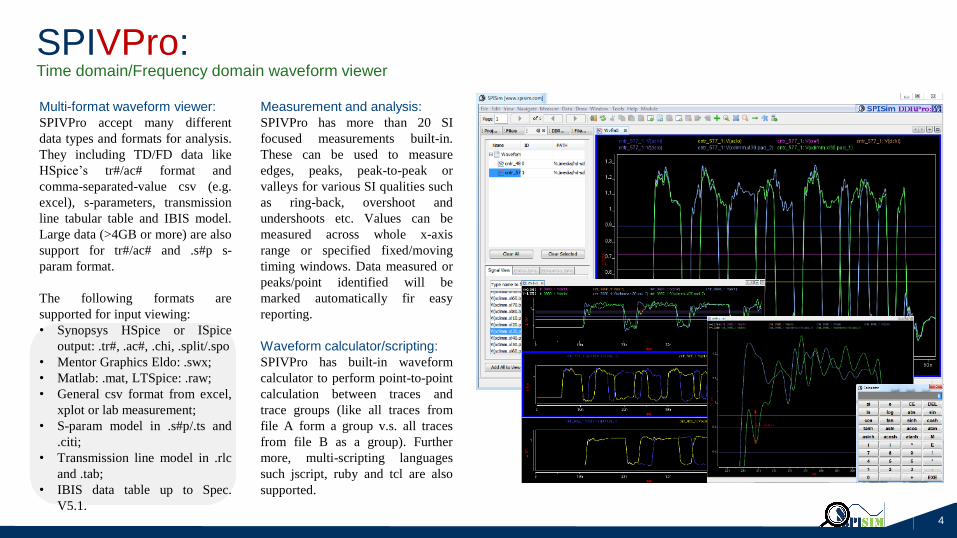
Multi-format waveform viewer:
SPIVPro accept many different
data types and formats for analysis.
They including TD/FD data like
HSpice’s tr#/ac# format and
comma-separated-value csv (e.g.
excel), s-parameters, transmission
line tabular table and IBIS model.
Large data (>4GB or more) are also
support for tr#/ac# and .s#p s-
param format.
The following formats are
supported for input viewing:
• Synopsys HSpice or ISpice
output: .tr#, .ac#, .chi, .split/.spo
• Mentor Graphics Eldo: .swx;
• Matlab: .mat, LTSpice: .raw;
• General csv format from excel,
xplot or lab measurement;
• S-param model in .s#p/.ts and
.citi;
• Transmission line model in .rlc
and .tab;
• IBIS data table up to Spec.
V5.1.
Measurement and analysis:
SPIVPro has more than 20 SI
focused measurements built-in.
These can be used to measure
edges, peaks, peak-to-peak or
valleys for various SI qualities such
as ring-back, overshoot and
undershoots etc. Values can be
measured across whole x-axis
range or specified fixed/moving
timing windows. Data measured or
peaks/point identified will be
marked automatically fir easy
reporting.
Waveform calculator/scripting:
SPIVPro has built-in waveform
calculator to perform point-to-point
calculation between traces and
trace groups (like all traces from
file A form a group v.s. all traces
from file B as a group). Further
more, multi-scripting languages
such jscript, ruby and tcl are also
supported.
SPISPro:S-parameter analysis and automation
5
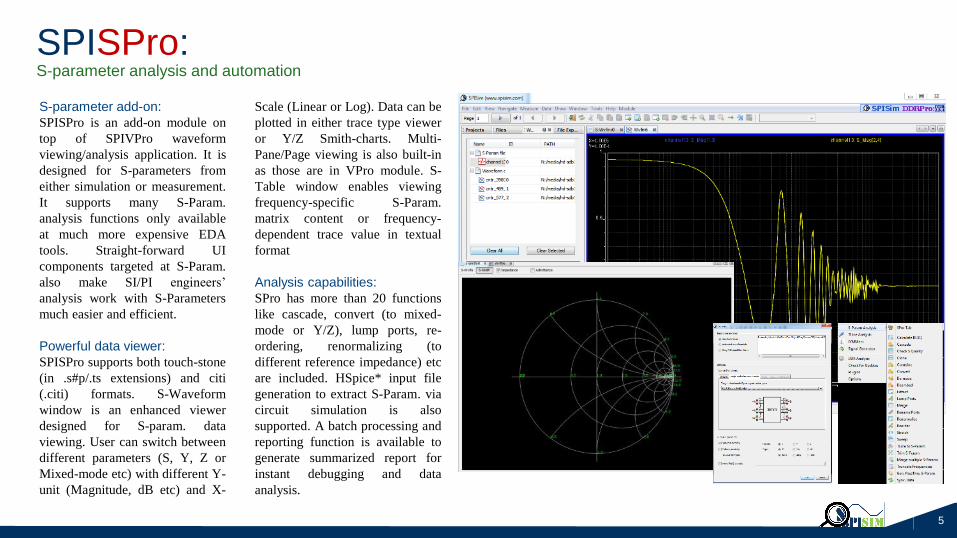
S-parameter add-on:
SPISPro is an add-on module on
top of SPIVPro waveform
viewing/analysis application. It is
designed for S-parameters from
either simulation or measurement.
It supports many S-Param.
analysis functions only available
at much more expensive EDA
tools. Straight-forward UI
components targeted at S-Param.
also make SI/PI engineers’
analysis work with S-Parameters
much easier and efficient.
Powerful data viewer:
SPISPro supports both touch-stone
(in .s#p/.ts extensions) and citi
(.citi) formats. S-Waveform
window is an enhanced viewer
designed for S-param. data
viewing. User can switch between
different parameters (S, Y, Z or
Mixed-mode etc) with different Y-
unit (Magnitude, dB etc) and X-
Scale (Linear or Log). Data can be
plotted in either trace type viewer
or Y/Z Smith-charts. Multi-
Pane/Page viewing is also built-in
as those are in VPro module. S-
Table window enables viewing
frequency-specific S-Param.
matrix content or frequency-
dependent trace value in textual
format
Analysis capabilities:
SPro has more than 20 functions
like cascade, convert (to mixed-
mode or Y/Z), lump ports, re-
ordering, renormalizing (to
different reference impedance) etc
are included. HSpice* input file
generation to extract S-Param. via
circuit simulation is also
supported. A batch processing and
reporting function is available to
generate summarized report for
instant debugging and data
analysis.
SPITPro:Transmission line modeling and analysis
6
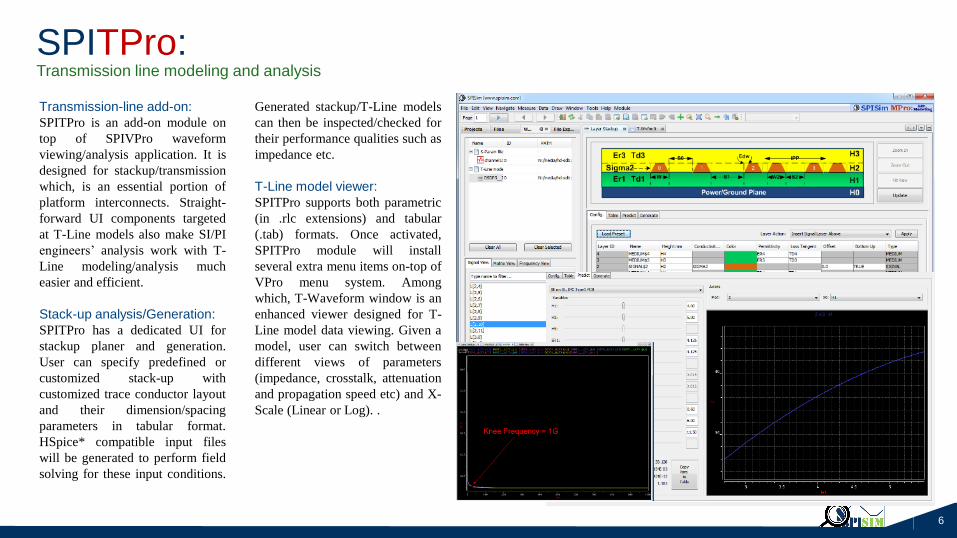
Transmission-line add-on:
SPITPro is an add-on module on
top of SPIVPro waveform
viewing/analysis application. It is
designed for stackup/transmission
which, is an essential portion of
platform interconnects. Straight-
forward UI components targeted
at T-Line models also make SI/PI
engineers’ analysis work with T-
Line modeling/analysis much
easier and efficient.
Stack-up analysis/Generation:
SPITPro has a dedicated UI for
stackup planer and generation.
User can specify predefined or
customized stack-up with
customized trace conductor layout
and their dimension/spacing
parameters in tabular format.
HSpice* compatible input files
will be generated to perform field
solving for these input conditions.
Generated stackup/T-Line models
can then be inspected/checked for
their performance qualities such as
impedance etc.
T-Line model viewer:
SPITPro supports both parametric
(in .rlc extensions) and tabular
(.tab) formats. Once activated,
SPITPro module will install
several extra menu items on-top of
VPro menu system. Among
which, T-Waveform window is an
enhanced viewer designed for T-
Line model data viewing. Given a
model, user can switch between
different views of parameters
(impedance, crosstalk, attenuation
and propagation speed etc) and X-
Scale (Linear or Log). .
SPIDPro:DDR simulation post-processing
7
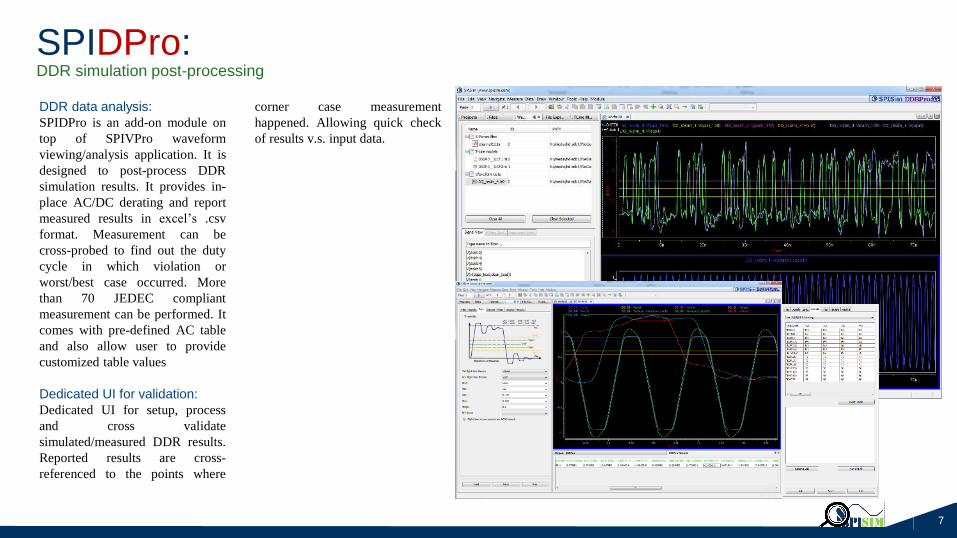
DDR data analysis:
SPIDPro is an add-on module on
top of SPIVPro waveform
viewing/analysis application. It is
designed to post-process DDR
simulation results. It provides in-
place AC/DC derating and report
measured results in excel’s .csv
format. Measurement can be
cross-probed to find out the duty
cycle in which violation or
worst/best case occurred. More
than 70 JEDEC compliant
measurement can be performed. It
comes with pre-defined AC table
and also allow user to provide
customized table values
Dedicated UI for validation:
Dedicated UI for setup, process
and cross validate
simulated/measured DDR results.
Reported results are cross-
referenced to the points where
corner case measurement
happened. Allowing quick check
of results v.s. input data.
EDA Expertise in Signal, Power Integrity and Simulation
WebSite: www.spisim.com, Email: [email protected], Tel:+1-408-905-6692, Location: Vancouver, WA, USA
SPISim is a member of Synopsys HSPICE Integrator Program