Embed Size (px)
Citation preview
Asia Pan-Asia Strategy
28 March 2011
Asia Equities Daily Focus Today's research headlines Asian Edition
Deutsche Bank AG/Hong Kong
All prices are those current at the end of the previous trading session unless otherwise indicated. Prices are sourced from local exchanges via Reuters, Bloomberg and other vendors. Data is sourced from Deutsche Bank and subject companies. Deutsche Bank does and seeks to do business with companies covered in its research reports. Thus, investors should be aware that the firm may have a conflict of interest that could affect the objectivity of this report. Investors should consider this report as only a single factor in making their investment decision. DISCLOSURES AND ANALYST CERTIFICATIONS ARE LOCATED IN APPENDIX 1. MICA(P) 007/05/2010
Periodical
Asian Index Closings EQUITIES Close 1D Chg %Chg
SHSZ300 3294.48 1.33 5.31 HSCEI 12975.54 1.12 2.23 HSI 23158.67 1.06 0.54 TWSE 8610.39 0.40 -4.04 KOSPI 2054.04 0.85 0.15 FSSTI 3070.84 0.91 -3.74 KLCI 1515.55 0.11 -0.22 SENSEX 18815.64 2.53 -8.26 NIFTY 5654.25 2.39 -7.83 SET 1037.73 0.32 0.48 JCI 3607.11 -0.13 -2.60 PCOMP 3875.81 0.89 -7.74 ASX200 4742.60 0.92 -0.06 FOREX (vs US$) Close 1D Chg YTD %Chg Rmb 6.56 0.08 0.76 HK$ 7.79 0.00 -0.27 NT$ 29.46 0.42 -0.54 Won 1114.20 0.62 1.06 S$ 1.26 -0.10 1.70 M$ 3.03 0.05 1.22 Rupee 44.68 0.18 0.07 Baht 30.26 0.00 -0.66 Rupiah 8717.00 0.01 3.20 Peso 43.33 0.04 1.09 A$ 1.03 0.38 0.18
Source: Bloomberg Finance LP
Latest Commodity Prices COMMODITIES Close 1D %Chg YTD %Chg West Texas 105.12 0.07 15.04 Brent 115.67 0.08 22.66 CRB 359.57 0.30 8.04 Copper 440.85 -0.13 -0.70 Gold (Spot) 1427.83 -0.20 0.50 Alum. (LME) 2630.00 -0.04 6.48 Baltic Dry 1583.00 1.15 -10.72
Source: Bloomberg Finance LP
DB CORPORATE ACCESS DB Access Indonesia Small Cap Corporate Day - SG 4/5 - 6 DB Access Asia Conference 2011 - Singapore 5/23 - 26 DB Access Taiwan Conference 2011 - Taipei 11/7 - 8 DB Access Korea Conference 2011 - Seoul 11/10 - 11 DB Access Indonesia Conference 2011 - Jakarta 11/29 - 12/1
Research Team
Carissa Szeto Equity Focus (+852) 2203 6171 [email protected] Ching-Li Teo, CFA Equity Focus (+852) 2203 6206 [email protected]
Co
mp
any
Glo
bal
Mar
kets
Res
earc
h
Nodita_ 1. 2.
TOP STORIES F.I.T.T. China Chemicals Tour Increasing the focus on the domestic
consumer Tim Jones Page 5
Shipping vs Shipbuilding Shipbuilding newsflow continues to be strong
Joe Liew Page 6
POSCO (005490.KS),KRW502,000.00 Buy Price Target KRW620,000.00
Set to ride the tailwinds of volume and price Chanwook
Park Page 7
RECOMMENDATION CHANGES
Li & Fung (0494.HK),HKD39.05 Hold Price Target HKD41.10
Fairly valued; downgrading to Hold Anne LingPage 8
ESTIMATE & TARGET PRICE CHANGES
CRE (0291.HK),HKD29.80 Buy Price Target HKD35.50
Bigger and more profitable; maintaining Buy
Rebecca JiangPage 9
ENN Energy (2688.HK),HKD26.15 Buy Price Target HKD28.30
FY10 results in-line with DBe but 5%below consensus
Eric ChengPage 10
Giordano (0709.HK),HKD4.58 Buy Price Target HKD5.77
2011 outlook; maintaining Buy Anne LingPage 11
PICC (2328.HK),HKD9.23 Sell Price Target HKD7.90
Premium solvency at 18.3%;maintaining Sell
Bob LeungPage 12
Cosco Corporation (COSC.SI),SGD2.01 Buy Price Target SGD2.45
LOI with Sevan worth over US$1bn Kevin ChongPage 13
PT Bukit Asam (PTBA.JK),IDR20,950.00 Buy Price Target IDR33,300.00
Adjusting for 2010 results Cherie KhoengPage 14
STRATEGY/ECONOMICS
Asia Economics Daily Malaysia CPI and Singapore IP Kaushik DasPage 15
Asia Credit Weekly Mixed results on property Gene CheonPage 19
Asia Local Markets Week Policy versus supply Sameer GoelPage 20
US Daily Economic Notes Payrolls, production & income dominate data docket
Joseph A. LaVorgna Page 21
US Economics Weekly Staying strong on above trend growth Joseph LaVorgna Page 22
28 March 2011 Strategy Asia Equities Daily Focus
Page 2 Deutsche Bank AG/Hong Kong
Global Commodities Daily China Macro Outlook Improves Soozhana Choi
Page 25
India Economics Weekly Impact of monetary tightening on growth, weekly WPI update
Taimur BaigPage 27
ADDITIONAL RESEARCH DB MIC
China TMT Daily CM capex; also, 0763.HK, BIDU Alan Hellawell III Page 28 Indonesian Politics
Guest-Speaker: Mr. Wimar Witoelar, Consultant with InterMatrix Communications/Adjunct Professor at Deakin University, Australia
China Comm Services (0552.HK),HKD5.43 Hold Price Target HKD5.20
2H preview Eva LeungPage 29 24 Mar @5pm HK/SG / 4pm Jakarta / 9pm UK
DB CONFERENCE/CORPORATE DAY DB Access Indonesia Small Cap Corporate Day - SG 4/5 - 6
China Construction Bank (0939.HK),HKD7.32 Buy Price Target HKD8.60
2010 NPAT understated on conservative provisioning
Tracy YuPage 30
China Minsheng Bank (1988.HK),HKD7.06 Hold Price Target HKD6.53
More risks, Higher returns Tracy YuPage 31
China Shenhua Energy (1088.HK),HKD34.80 Buy Price Target HKD40.00
2010 results in line; BUY maintained James KanPage 32
DB Access Asia Conference 2011 - Singapore 5/23 - 26 DB Access Taiwan Conference 2011 - Taipei 11/7 - 8 DB Access Korea Conference 2011 - Seoul 11/10 - 11 DB Access Indonesia Conference 2011 - Jakarta 11/29 - 12/1
NDRs Renhe Commercial Holdings (1387 HK) - SG 3/28 China Unicom
(0762.HK),HKD13.20 Hold Price Target HKD11.40
4Q Preview Alan Hellawell III Page 33 China SCE Property Holdings (1966 HK) - HK 3/28, SG
3/30 China High Speed Transmission Equipment (658 HK) - HK 3/28 - 29 Greentown China Holdings (3900 HK) - HK 3/30 Shenzhen Expressway Co (548 HK) - HK 3/31 Industrial and Commercial Bank of China (1398 HK) - HK 3/30
Shenzhen Expressway-H (0548.HK),HKD4.75 Buy Price Target HKD6.12
2010 results ahead of expectation Phyllis WangPage 34
West China Cement (2233.HK),HKD3.44 Buy Price Target HKD3.76
Xinjiang - new growth phase ahead James KanPage 35
Jack Hu - SG 3/30 - 31 China Shipping Container Liner (2866 HK) - HK 3/31 - 4/1 Nan Ya Printed Circuit Board Corp (8046 TT) - HK 3/30 - 31, Shenzhen 4/1 Hengan International Group (1044 HK) - HK 3/31 C C Land Holdings (1224 HK) - HK 3/31
Banking/Finance Feb-2011 new loans: mortgages the weak spot
Nora HouPage 36
Taiwan Financials Pulse More measures on housing mortgages/real estate loans
Nora HouPage 37 NEW: Central China Real Estate (832 HK) - HK 3/31
PT Nippon Indosari Corpindo (ROTI IJ) - HK 4/4 Evergrande Real Estate Group (3333 HK) - SG 4/5, SZX 4/6, PEK 4/8 PT Gajah Tunggal Tbk (GJTL IJ) - HK 4/7 - 8
WPG Holdings (3702.TW),TWD49.60 Buy Price Target TWD60.00
FAQ- Too big to be successful? Not in our view
Jessica ChangPage 38 H TC Corporation (2498 TT) - SG 6/21 - 22, HK 6/23 - 24
DB ANALYST/SALES ROADSHOWS KT Corporation (030200.KS),KRW38,250.00 Buy Price Target KRW51,000.00
Moving toward terminating CDMA network
John Kim
Page 39 Sanghi Han: Korea Construction and LS Corp./Utilities - HK 3/28 - 29, SG 3/30 - 31 Wei-Shi Wu: Singapore/Malaysia Telecoms - Wiring up the Nation: the Telecoms Transformation - HK 3/30 - 31Gamuda
(GAMU.KL),MYR3.85 Buy Price Target MYR4.45
On track for robust growth; Vietnam property launched
Aun-Ling ChiaPage 40
Srinivas Rao: Telecom & Automotive - SG 3/28 - 29, HK 3/30 & 4/1 NEW: Jack Hu: Post 4Q Take-aways - SG 3/30 - 31, HK 4/6 - 7 Phyllis Wang: China Expressway & Rail - HK 4/1 Christopher Wane: CROCI Global - HK 3/31 & 4/1, SEL 4/4, SG 4/5 - 6, PEK 4/7 John Kim: Korea Telecom - HK 4/1
Mapletree Logistics Trust (MAPL.SI),SGD0.88 Buy Price Target SGD1.06
Acquires Hiroshima Centre for S$114m
Elaine KhooPage 41
Sembcorp Industries Ltd (SCIL.SI),SGD5.04 Buy Price Target SGD7.00
Solid value Kevin ChongPage 42
Marico Limited (MRCO.BO),INR130.55 Buy Price Target INR150.00
Sweekar divested Gaurav BhatiaPage 43
Pharmaceuticals/Biotechnology
NEW: Andrew Hill: Singapore & Malaysia Banks - SG 4/4 Worawat Saisuphatphol: Thai Banking - SG 4/4 - 5, HK 4/6 - 7 Tony Tsang: China & HK Property - PEK 4/7, HK 4/11 - 12, SG 4/14 - 15 Jihyun Song: Korea Consumer - HK 4/11 - 12, SG 4/13 - 14
DB INTERNATIONAL PRODUCT ROADSHOWS
Teva‘s JV with P&G for branded OTC is the way to grow
Abhay Shanbhag Page 44
Software & Services Accenture 2QFY11 : Read through for Indian vendors
Aniruddha Bhosale Page 45
Brett Feldman: US Telecommunications - SEL 3/28, PEK 3/29, HK 3/30, SG 4/1 Rizwan Ali: Telecom - SG 3/29, HK 3/30 Continental AG (CON GR) - HK 4/8 Lloyds Banking Group (LLOY LN) - PEK 4/11, HK 4/12, SG 4/13 Rod Lache: US Auto Industry - PEK 4/11, HK 4/14, SG 4/15 Torsten Slok, Chief International Economist: Global Economics - SEL 4/12, PEK 4/13, SG 4/14
China Shipping Container Liner (2866 HK): Metals & Mining - SG 4/12, HK 4/13, PEK 4/14 Diageo (DGE LN) - HK 5/9, SG 5/10, PEK 5/11
Alfamart (AMRT.JK),IDR2,900.00 Buy Price Target IDR3,200.00
In-line FY10 results with net profit up 37% YoY
Reggy SusantoPage 46
Harum Energy (HRUM.JK),IDR8,650.00 Buy Price Target IDR11,200.00
In-line FY10 NP of Rp824bn; 4Q'10 up by 26%yoy
Cherie KhoengPage 47
Indonesia strategy Key points from DB MIC on politics Heriyanto Irawan Page 48
GLOBAL RESEARCH
Japan auto assemblers Forecast and TP changes: Estimating the earnings impact
Kurt SangerPage 49
Japan Equities Weekly Japan’s recovery capabilities Naoki Kamiyama Page 50
Japan Economics Weekly Restoration demand and "Japan crash thesis" revisited
Mikihiro Matsuoka Page 51
The notes and reports contained in this Daily are all excerpts of previously published documents. Please refer to the published notes on our web site for details on risks, valuations and earnings changes
28 March 2011 Strategy Asia Equities Daily Focus
Page 4 Deutsche Bank AG/Hong Kong
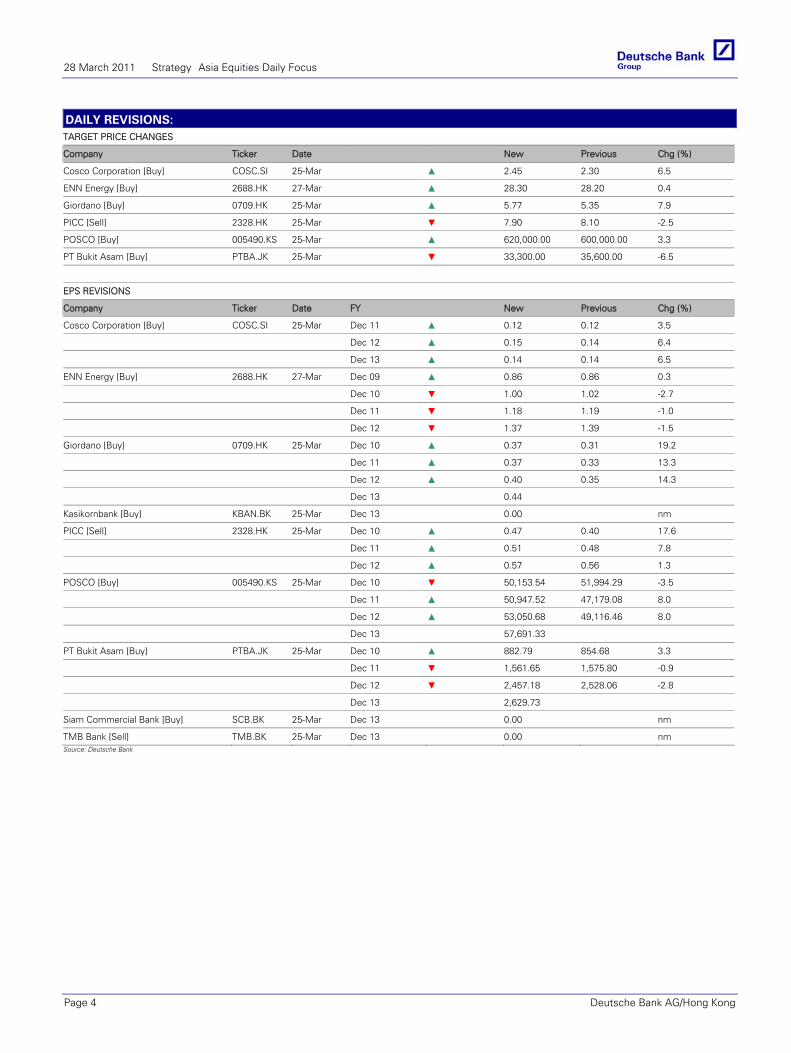
DAILY REVISIONS: TARGET PRICE CHANGES
Company Ticker Date New Previous Chg (%)
Cosco Corporation [Buy] COSC.SI 25-Mar ▲ 2.45 2.30 6.5
ENN Energy [Buy] 2688.HK 27-Mar ▲ 28.30 28.20 0.4
Giordano [Buy] 0709.HK 25-Mar ▲ 5.77 5.35 7.9
PICC [Sell] 2328.HK 25-Mar ▼ 7.90 8.10 -2.5
POSCO [Buy] 005490.KS 25-Mar ▲ 620,000.00 600,000.00 3.3
PT Bukit Asam [Buy] PTBA.JK 25-Mar ▼ 33,300.00 35,600.00 -6.5
EPS REVISIONS
Company Ticker Date FY New Previous Chg (%)
Cosco Corporation [Buy] COSC.SI 25-Mar Dec 11 ▲ 0.12 0.12 3.5
Dec 12 ▲ 0.15 0.14 6.4
Dec 13 ▲ 0.14 0.14 6.5
ENN Energy [Buy] 2688.HK 27-Mar Dec 09 ▲ 0.86 0.86 0.3
Dec 10 ▼ 1.00 1.02 -2.7
Dec 11 ▼ 1.18 1.19 -1.0
Dec 12 ▼ 1.37 1.39 -1.5
Giordano [Buy] 0709.HK 25-Mar Dec 10 ▲ 0.37 0.31 19.2
Dec 11 ▲ 0.37 0.33 13.3
Dec 12 ▲ 0.40 0.35 14.3
Dec 13 0.44
Kasikornbank [Buy] KBAN.BK 25-Mar Dec 13 0.00 nm
PICC [Sell] 2328.HK 25-Mar Dec 10 ▲ 0.47 0.40 17.6
Dec 11 ▲ 0.51 0.48 7.8
Dec 12 ▲ 0.57 0.56 1.3
POSCO [Buy] 005490.KS 25-Mar Dec 10 ▼ 50,153.54 51,994.29 -3.5
Dec 11 ▲ 50,947.52 47,179.08 8.0
Dec 12 ▲ 53,050.68 49,116.46 8.0
Dec 13 57,691.33
PT Bukit Asam [Buy] PTBA.JK 25-Mar Dec 10 ▲ 882.79 854.68 3.3
Dec 11 ▼ 1,561.65 1,575.80 -0.9
Dec 12 ▼ 2,457.18 2,528.06 -2.8
Dec 13 2,629.73
Siam Commercial Bank [Buy] SCB.BK 25-Mar Dec 13 0.00 nm
TMB Bank [Sell] TMB.BK 25-Mar Dec 13 0.00 nm Source: Deutsche Bank
Global Chemicals
24 March 2011
China Chemicals Tour Increasing the focus on the domestic consumerTim Jones Research Analyst (+44) 20 754-76763 [email protected]
David Begleiter, CFA Research Analyst (+1) 212 250-5473 [email protected]
Martin Dunwoodie, CFA Research Analyst (+44) 20 754-72852 [email protected]
Virginie Boucher-FerteResearch Analyst (+44) 20 754-57940 [email protected]
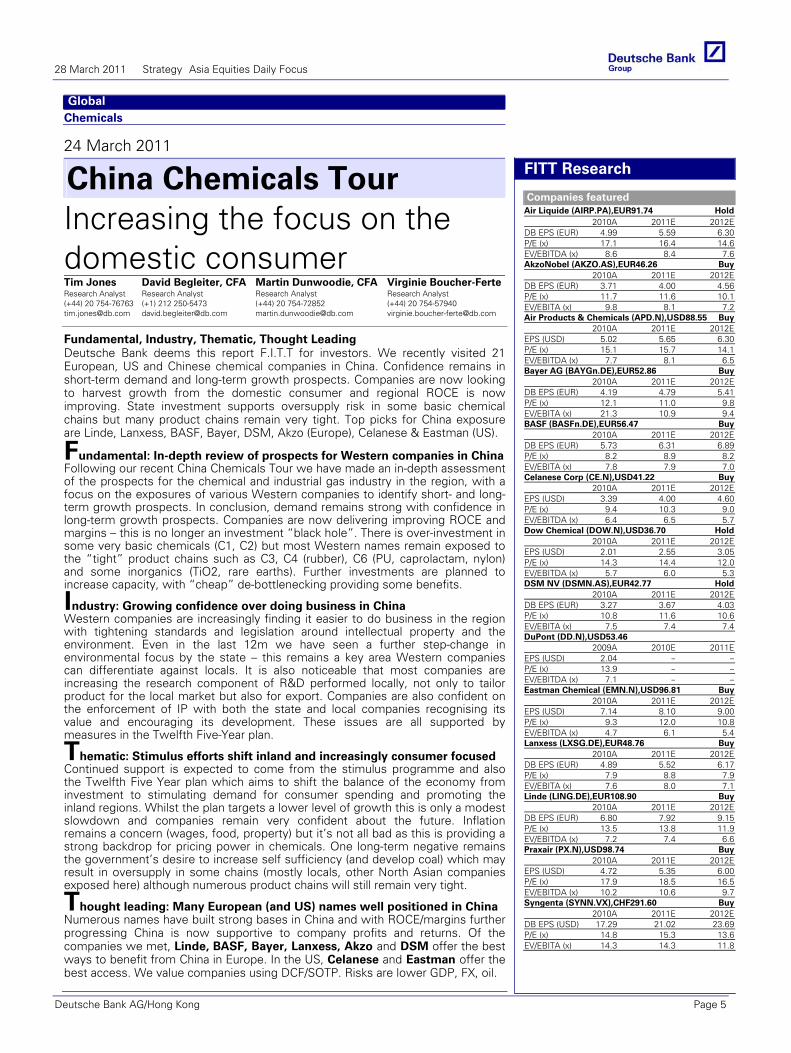
Fundamental, Industry, Thematic, Thought Leading Deutsche Bank deems this report F.I.T.T for investors. We recently visited 21 European, US and Chinese chemical companies in China. Confidence remains in short-term demand and long-term growth prospects. Companies are now looking to harvest growth from the domestic consumer and regional ROCE is now improving. State investment supports oversupply risk in some basic chemical chains but many product chains remain very tight. Top picks for China exposure are Linde, Lanxess, BASF, Bayer, DSM, Akzo (Europe), Celanese & Eastman (US).
FITT Research
Companies featured Air Liquide (AIRP.PA),EUR91.74 Hold
2010A 2011E 2012EDB EPS (EUR) 4.99 5.59 6.30P/E (x) 17.1 16.4 14.6EV/EBITDA (x) 8.6 8.4 7.6AkzoNobel (AKZO.AS),EUR46.26 Buy
2010A 2011E 2012EDB EPS (EUR) 3.71 4.00 4.56P/E (x) 11.7 11.6 10.1EV/EBITA (x) 9.8 8.1 7.2Air Products & Chemicals (APD.N),USD88.55 Buy
2010A 2011E 2012EEPS (USD) 5.02 5.65 6.30P/E (x) 15.1 15.7 14.1EV/EBITDA (x) 7.7 8.1 6.5Bayer AG (BAYGn.DE),EUR52.86 Buy
2010A 2011E 2012EDB EPS (EUR) 4.19 4.79 5.41P/E (x) 12.1 11.0 9.8EV/EBITA (x) 21.3 10.9 9.4BASF (BASFn.DE),EUR56.47 Buy
2010A 2011E 2012EDB EPS (EUR) 5.73 6.31 6.89P/E (x) 8.2 8.9 8.2EV/EBITA (x) 7.8 7.9 7.0Celanese Corp (CE.N),USD41.22 Buy
2010A 2011E 2012EEPS (USD) 3.39 4.00 4.60P/E (x) 9.4 10.3 9.0EV/EBITDA (x) 6.4 6.5 5.7Dow Chemical (DOW.N),USD36.70 Hold
2010A 2011E 2012EEPS (USD) 2.01 2.55 3.05P/E (x) 14.3 14.4 12.0EV/EBITDA (x) 5.7 6.0 5.3DSM NV (DSMN.AS),EUR42.77 Hold
2010A 2011E 2012EDB EPS (EUR) 3.27 3.67 4.03P/E (x) 10.8 11.6 10.6EV/EBITA (x) 7.5 7.4 7.4DuPont (DD.N),USD53.46
2009A 2010E 2011EEPS (USD) 2.04 – –P/E (x) 13.9 – –EV/EBITDA (x) 7.1 – –Eastman Chemical (EMN.N),USD96.81 Buy
2010A 2011E 2012EEPS (USD) 7.14 8.10 9.00P/E (x) 9.3 12.0 10.8EV/EBITDA (x) 4.7 6.1 5.4Lanxess (LXSG.DE),EUR48.76 Buy
2010A 2011E 2012EDB EPS (EUR) 4.89 5.52 6.17P/E (x) 7.9 8.8 7.9EV/EBITA (x) 7.6 8.0 7.1Linde (LING.DE),EUR108.90 Buy
2010A 2011E 2012EDB EPS (EUR) 6.80 7.92 9.15P/E (x) 13.5 13.8 11.9EV/EBITDA (x) 7.2 7.4 6.6Praxair (PX.N),USD98.74 Buy
2010A 2011E 2012EEPS (USD) 4.72 5.35 6.00P/E (x) 17.9 18.5 16.5EV/EBITDA (x) 10.2 10.6 9.7Syngenta (SYNN.VX),CHF291.60 Buy
2010A 2011E 2012EDB EPS (USD) 17.29 21.02 23.69P/E (x) 14.8 15.3 13.6EV/EBITA (x) 14.3 14.3 11.8
Fundamental: In-depth review of prospects for Western companies in China Following our recent China Chemicals Tour we have made an in-depth assessment of the prospects for the chemical and industrial gas industry in the region, with a focus on the exposures of various Western companies to identify short- and long-term growth prospects. In conclusion, demand remains strong with confidence in long-term growth prospects. Companies are now delivering improving ROCE and margins – this is no longer an investment “black hole”. There is over-investment in some very basic chemicals (C1, C2) but most Western names remain exposed to the “tight” product chains such as C3, C4 (rubber), C6 (PU, caprolactam, nylon) and some inorganics (TiO2, rare earths). Further investments are planned to increase capacity, with “cheap” de-bottlenecking providing some benefits.
Industry: Growing confidence over doing business in China Western companies are increasingly finding it easier to do business in the region with tightening standards and legislation around intellectual property and the environment. Even in the last 12m we have seen a further step-change in environmental focus by the state – this remains a key area Western companies can differentiate against locals. It is also noticeable that most companies are increasing the research component of R&D performed locally, not only to tailor product for the local market but also for export. Companies are also confident on the enforcement of IP with both the state and local companies recognising its value and encouraging its development. These issues are all supported by measures in the Twelfth Five-Year plan.
Thematic: Stimulus efforts shift inland and increasingly consumer focused Continued support is expected to come from the stimulus programme and also the Twelfth Five Year plan which aims to shift the balance of the economy from investment to stimulating demand for consumer spending and promoting the inland regions. Whilst the plan targets a lower level of growth this is only a modest slowdown and companies remain very confident about the future. Inflation remains a concern (wages, food, property) but it’s not all bad as this is providing a strong backdrop for pricing power in chemicals. One long-term negative remains the government’s desire to increase self sufficiency (and develop coal) which may result in oversupply in some chains (mostly locals, other North Asian companies exposed here) although numerous product chains will still remain very tight.
Thought leading: Many European (and US) names well positioned in China Numerous names have built strong bases in China and with ROCE/margins further progressing China is now supportive to company profits and returns. Of the companies we met, Linde, BASF, Bayer, Lanxess, Akzo and DSM offer the best ways to benefit from China in Europe. In the US, Celanese and Eastman offer the best access. We value companies using DCF/SOTP. Risks are lower GDP, FX, oil.
28 March 2011 Strategy Asia Equities Daily Focus
Deutsche Bank AG/Hong Kong Page 5
Asia Hong Kong Transportation Marine
25 March 2011
Shipping vs Shipbuilding Shipbuilding newsflow continues to be strongJoe Liew, CFA Research Analyst (+852) 2203 6198 [email protected]
Sanjeev Rana Research Analyst (+82) 2 316 8910 [email protected]
Sky Hong, CFA Research Analyst (+852) 2203 6131 [email protected]
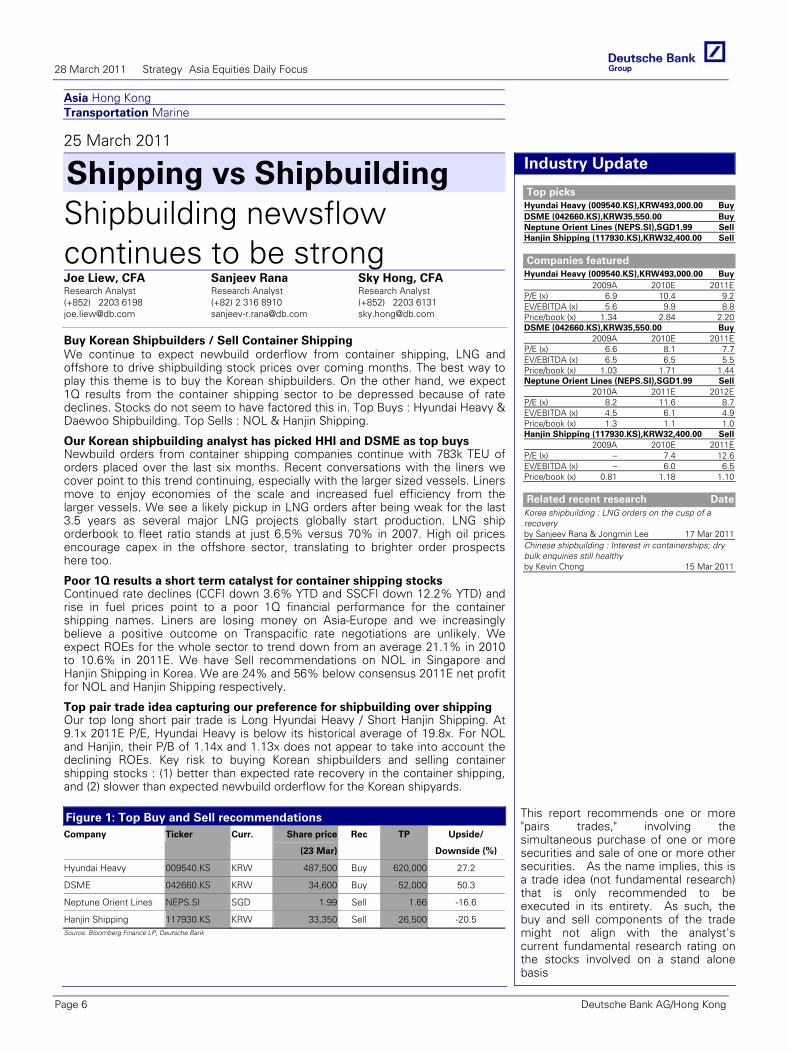
Buy Korean Shipbuilders / Sell Container Shipping We continue to expect newbuild orderflow from container shipping, LNG and offshore to drive shipbuilding stock prices over coming months. The best way to play this theme is to buy the Korean shipbuilders. On the other hand, we expect 1Q results from the container shipping sector to be depressed because of rate declines. Stocks do not seem to have factored this in. Top Buys : Hyundai Heavy & Daewoo Shipbuilding. Top Sells : NOL & Hanjin Shipping.
Industry Update
Top picks Hyundai Heavy (009540.KS),KRW493,000.00 Buy DSME (042660.KS),KRW35,550.00 Buy Neptune Orient Lines (NEPS.SI),SGD1.99 Sell Hanjin Shipping (117930.KS),KRW32,400.00 Sell
Companies featured
Hyundai Heavy (009540.KS),KRW493,000.00 Buy 2009A 2010E 2011E
P/E (x) 6.9 10.4 9.2EV/EBITDA (x) 5.6 9.9 8.8Price/book (x) 1.34 2.84 2.20DSME (042660.KS),KRW35,550.00 Buy
2009A 2010E 2011EP/E (x) 6.6 8.1 7.7EV/EBITDA (x) 6.5 6.5 5.5Price/book (x) 1.03 1.71 1.44Neptune Orient Lines (NEPS.SI),SGD1.99 Sell
2010A 2011E 2012EP/E (x) 8.2 11.6 8.7EV/EBITDA (x) 4.5 6.1 4.9Price/book (x) 1.3 1.1 1.0Hanjin Shipping (117930.KS),KRW32,400.00 Sell
2009A 2010E 2011EP/E (x) – 7.4 12.6EV/EBITDA (x) – 6.0 6.5Price/book (x) 0.81 1.18 1.10
Related recent research Date
Korea shipbuilding : LNG orders on the cusp of a recovery by Sanjeev Rana & Jongmin Lee 17 Mar 2011Chinese shipbuilding : Interest in containerships; dry bulk enquiries still healthy by Kevin Chong 15 Mar 2011
This report recommends one or more "pairs trades," involving the simultaneous purchase of one or more securities and sale of one or more other securities. As the name implies, this is a trade idea (not fundamental research) that is only recommended to be executed in its entirety. As such, the buy and sell components of the trade might not align with the analyst's current fundamental research rating on the stocks involved on a stand alone basis
Our Korean shipbuilding analyst has picked HHI and DSME as top buys Newbuild orders from container shipping companies continue with 783k TEU of orders placed over the last six months. Recent conversations with the liners we cover point to this trend continuing, especially with the larger sized vessels. Liners move to enjoy economies of the scale and increased fuel efficiency from the larger vessels. We see a likely pickup in LNG orders after being weak for the last 3.5 years as several major LNG projects globally start production. LNG ship orderbook to fleet ratio stands at just 6.5% versus 70% in 2007. High oil prices encourage capex in the offshore sector, translating to brighter order prospects here too.
Poor 1Q results a short term catalyst for container shipping stocks Continued rate declines (CCFI down 3.6% YTD and SSCFI down 12.2% YTD) and rise in fuel prices point to a poor 1Q financial performance for the container shipping names. Liners are losing money on Asia-Europe and we increasingly believe a positive outcome on Transpacific rate negotiations are unlikely. We expect ROEs for the whole sector to trend down from an average 21.1% in 2010 to 10.6% in 2011E. We have Sell recommendations on NOL in Singapore and Hanjin Shipping in Korea. We are 24% and 56% below consensus 2011E net profit for NOL and Hanjin Shipping respectively.
Top pair trade idea capturing our preference for shipbuilding over shipping Our top long short pair trade is Long Hyundai Heavy / Short Hanjin Shipping. At 9.1x 2011E P/E, Hyundai Heavy is below its historical average of 19.8x. For NOL and Hanjin, their P/B of 1.14x and 1.13x does not appear to take into account the declining ROEs. Key risk to buying Korean shipbuilders and selling container shipping stocks : (1) better than expected rate recovery in the container shipping, and (2) slower than expected newbuild orderflow for the Korean shipyards. Figure 1: Top Buy and Sell recommendations Company Ticker Curr. Share price
(23 Mar)
Rec TP Upside/
Downside (%)
Hyundai Heavy 009540.KS KRW 487,500 Buy 620,000 27.2
DSME 042660.KS KRW 34,600 Buy 52,000 50.3
Neptune Orient Lines NEPS.SI SGD 1.99 Sell 1.66 -16.6
Hanjin Shipping 117930.KS KRW 33,350 Sell 26,500 -20.5 Source: Bloomberg Finance LP, Deutsche Bank
28 March 2011 Strategy Asia Equities Daily Focus
Page 6 Deutsche Bank AG/Hong Kong
Asia Korea, Republic of Resources Metals & Mining
25 March 2011
POSCO Reuters: 005490.KS Bloomberg: 005490 KS Exchange: KSC Ticker: 005490
Set to ride the tailwinds of volume and price Chanwook Park Research Analyst (+82) 2 316-8940 [email protected]
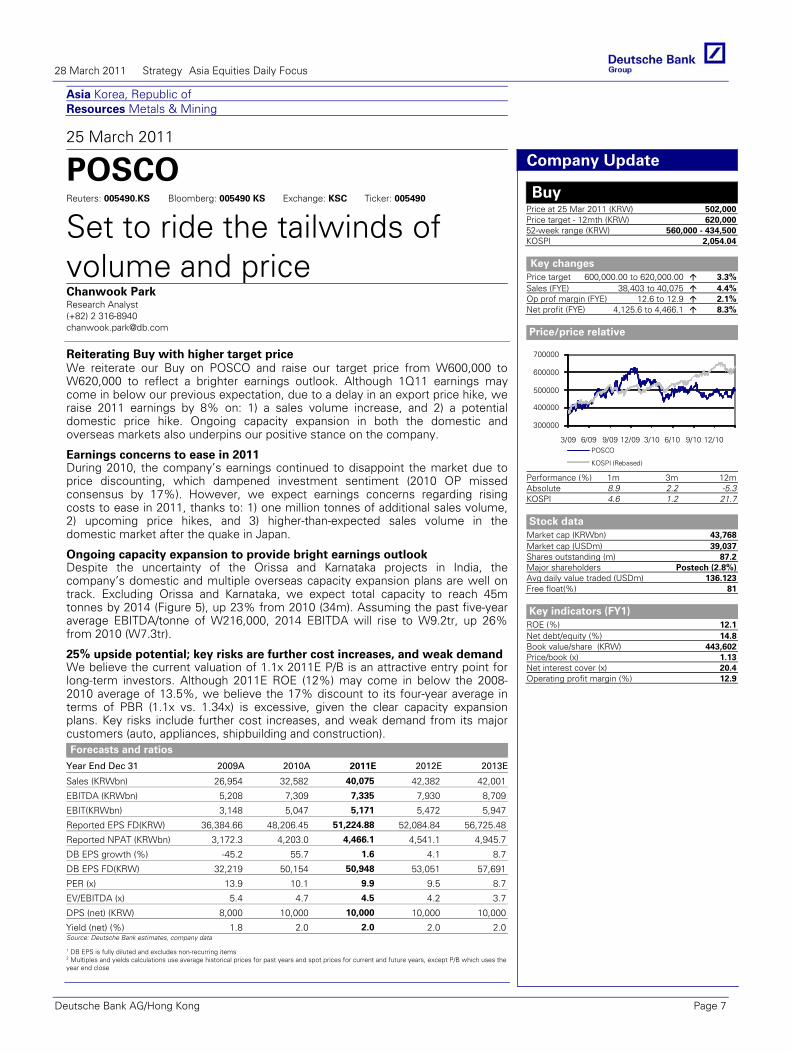
Reiterating Buy with higher target price We reiterate our Buy on POSCO and raise our target price from W600,000 to W620,000 to reflect a brighter earnings outlook. Although 1Q11 earnings may come in below our previous expectation, due to a delay in an export price hike, we raise 2011 earnings by 8% on: 1) a sales volume increase, and 2) a potential domestic price hike. Ongoing capacity expansion in both the domestic and overseas markets also underpins our positive stance on the company.
Forecasts and ratios
Year End Dec 31 2009A 2010A 2011E 2012E 2013E
Sales (KRWbn) 26,954 32,582 40,075 42,382 42,001
EBITDA (KRWbn) 5,208 7,309 7,335 7,930 8,709
EBIT(KRWbn) 3,148 5,047 5,171 5,472 5,947
Reported EPS FD(KRW) 36,384.66 48,206.45 51,224.88 52,084.84 56,725.48
Reported NPAT (KRWbn) 3,172.3 4,203.0 4,466.1 4,541.1 4,945.7
DB EPS growth (%) -45.2 55.7 1.6 4.1 8.7
DB EPS FD(KRW) 32,219 50,154 50,948 53,051 57,691
PER (x) 13.9 10.1 9.9 9.5 8.7
EV/EBITDA (x) 5.4 4.7 4.5 4.2 3.7
DPS (net) (KRW) 8,000 10,000 10,000 10,000 10,000
Yield (net) (%) 1.8 2.0 2.0 2.0 2.0Source: Deutsche Bank estimates, company data
1 DB EPS is fully diluted and excludes non-recurring items 2 Multiples and yields calculations use average historical prices for past years and spot prices for current and future years, except P/B which uses the year end close
Company Update
Buy Price at 25 Mar 2011 (KRW) 502,000Price target - 12mth (KRW) 620,00052-week range (KRW) 560,000 - 434,500KOSPI 2,054.04
Key changes
Price target 600,000.00 to 620,000.00 3.3%Sales (FYE) 38,403 to 40,075 4.4%Op prof margin (FYE) 12.6 to 12.9 2.1%Net profit (FYE) 4,125.6 to 4,466.1 8.3%
Price/price relative
300000
400000
500000
600000
700000
3/09 6/09 9/09 12/09 3/10 6/10 9/10 12/10POSCO
KOSPI (Rebased)
Performance (%) 1m 3m 12mAbsolute 8.9 2.2 -5.3KOSPI 4.6 1.2 21.7
Stock data
Market cap (KRWbn) 43,768Market cap (USDm) 39,037Shares outstanding (m) 87.2Major shareholders Postech (2.8%)Avg daily value traded (USDm) 136.123Free float(%) 81
Key indicators (FY1)
ROE (%) 12.1Net debt/equity (%) 14.8Book value/share (KRW) 443,602Price/book (x) 1.13Net interest cover (x) 20.4Operating profit margin (%) 12.9
Earnings concerns to ease in 2011 During 2010, the company’s earnings continued to disappoint the market due to price discounting, which dampened investment sentiment (2010 OP missed consensus by 17%). However, we expect earnings concerns regarding rising costs to ease in 2011, thanks to: 1) one million tonnes of additional sales volume, 2) upcoming price hikes, and 3) higher-than-expected sales volume in the domestic market after the quake in Japan.
Ongoing capacity expansion to provide bright earnings outlook Despite the uncertainty of the Orissa and Karnataka projects in India, the company’s domestic and multiple overseas capacity expansion plans are well on track. Excluding Orissa and Karnataka, we expect total capacity to reach 45m tonnes by 2014 (Figure 5), up 23% from 2010 (34m). Assuming the past five-year average EBITDA/tonne of W216,000, 2014 EBITDA will rise to W9.2tr, up 26% from 2010 (W7.3tr).
25% upside potential; key risks are further cost increases, and weak demand We believe the current valuation of 1.1x 2011E P/B is an attractive entry point for long-term investors. Although 2011E ROE (12%) may come in below the 2008-2010 average of 13.5%, we believe the 17% discount to its four-year average in terms of PBR (1.1x vs. 1.34x) is excessive, given the clear capacity expansion plans. Key risks include further cost increases, and weak demand from its major customers (auto, appliances, shipbuilding and construction).
28 March 2011 Strategy Asia Equities Daily Focus
Deutsche Bank AG/Hong Kong Page 7
Asia Hong Kong Consumer Retail/Wholesale Trade
24 March 2011
Li & Fung Reuters: 0494.HK Bloomberg: 494 HK Exchange: HKG Ticker: 0494
Fairly valued; downgrading to Hold Anne Ling Research Analyst (+852) 2203 6177 [email protected]
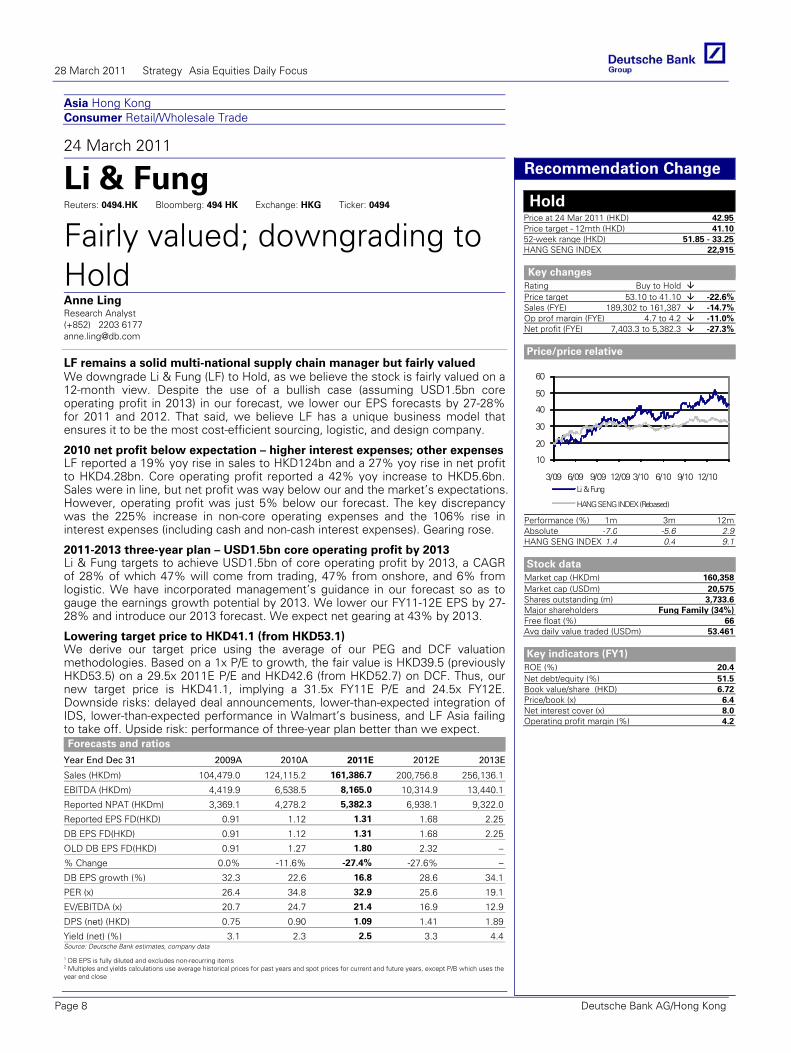
LF remains a solid multi-national supply chain manager but fairly valued We downgrade Li & Fung (LF) to Hold, as we believe the stock is fairly valued on a 12-month view. Despite the use of a bullish case (assuming USD1.5bn core operating profit in 2013) in our forecast, we lower our EPS forecasts by 27-28% for 2011 and 2012. That said, we believe LF has a unique business model that ensures it to be the most cost-efficient sourcing, logistic, and design company.
Forecasts and ratios
Year End Dec 31 2009A 2010A 2011E 2012E 2013E
Sales (HKDm) 104,479.0 124,115.2 161,386.7 200,756.8 256,136.1
EBITDA (HKDm) 4,419.9 6,538.5 8,165.0 10,314.9 13,440.1
Reported NPAT (HKDm) 3,369.1 4,278.2 5,382.3 6,938.1 9,322.0
Reported EPS FD(HKD) 0.91 1.12 1.31 1.68 2.25
DB EPS FD(HKD) 0.91 1.12 1.31 1.68 2.25
OLD DB EPS FD(HKD) 0.91 1.27 1.80 2.32 –
% Change 0.0% -11.6% -27.4% -27.6% –
DB EPS growth (%) 32.3 22.6 16.8 28.6 34.1
PER (x) 26.4 34.8 32.9 25.6 19.1
EV/EBITDA (x) 20.7 24.7 21.4 16.9 12.9
DPS (net) (HKD) 0.75 0.90 1.09 1.41 1.89
Yield (net) (%) 3.1 2.3 2.5 3.3 4.4Source: Deutsche Bank estimates, company data
1 DB EPS is fully diluted and excludes non-recurring items 2 Multiples and yields calculations use average historical prices for past years and spot prices for current and future years, except P/B which uses the year end close
Recommendation Change
Hold Price at 24 Mar 2011 (HKD) 42.95Price target - 12mth (HKD) 41.1052-week range (HKD) 51.85 - 33.25HANG SENG INDEX 22,915
Key changes
Rating Buy to Hold Price target 53.10 to 41.10 -22.6%Sales (FYE) 189,302 to 161,387 -14.7%Op prof margin (FYE) 4.7 to 4.2 -11.0%Net profit (FYE) 7,403.3 to 5,382.3 -27.3%
Price/price relative
10
20
30
40
50
60
3/09 6/09 9/09 12/09 3/10 6/10 9/10 12/10Li & Fung
HANG SENG INDEX (Rebased)
Performance (%) 1m 3m 12mAbsolute -7.0 -5.6 2.9HANG SENG INDEX 1.4 0.4 9.1
Stock data
Market cap (HKDm) 160,358Market cap (USDm) 20,575Shares outstanding (m) 3,733.6Major shareholders Fung Family (34%)Free float (%) 66Avg daily value traded (USDm) 53.461
Key indicators (FY1)
ROE (%) 20.4Net debt/equity (%) 51.5Book value/share (HKD) 6.72Price/book (x) 6.4Net interest cover (x) 8.0Operating profit margin (%) 4.2
2010 net profit below expectation – higher interest expenses; other expenses LF reported a 19% yoy rise in sales to HKD124bn and a 27% yoy rise in net profit to HKD4.28bn. Core operating profit reported a 42% yoy increase to HKD5.6bn. Sales were in line, but net profit was way below our and the market’s expectations. However, operating profit was just 5% below our forecast. The key discrepancy was the 225% increase in non-core operating expenses and the 106% rise in interest expenses (including cash and non-cash interest expenses). Gearing rose.
2011-2013 three-year plan – USD1.5bn core operating profit by 2013 Li & Fung targets to achieve USD1.5bn of core operating profit by 2013, a CAGR of 28% of which 47% will come from trading, 47% from onshore, and 6% from logistic. We have incorporated management’s guidance in our forecast so as to gauge the earnings growth potential by 2013. We lower our FY11-12E EPS by 27-28% and introduce our 2013 forecast. We expect net gearing at 43% by 2013.
Lowering target price to HKD41.1 (from HKD53.1) We derive our target price using the average of our PEG and DCF valuation methodologies. Based on a 1x P/E to growth, the fair value is HKD39.5 (previously HKD53.5) on a 29.5x 2011E P/E and HKD42.6 (from HKD52.7) on DCF. Thus, our new target price is HKD41.1, implying a 31.5x FY11E P/E and 24.5x FY12E. Downside risks: delayed deal announcements, lower-than-expected integration of IDS, lower-than-expected performance in Walmart’s business, and LF Asia failing to take off. Upside risk: performance of three-year plan better than we expect.
28 March 2011 Strategy Asia Equities Daily Focus
Page 8 Deutsche Bank AG/Hong Kong
Asia China Consumer Retail/Wholesale Trade
25 March 2011
CRE Reuters: 0291.HK Bloomberg: 291 HK Exchange: HSI Ticker: 0291
Bigger and more profitable; maintaining Buy Rebecca Jiang, CFA Research Analyst (+852) 2203 6152 [email protected]
Anne Ling Research Analyst (+852) 2203 6177 [email protected]
Mabel Wong, CFA Research Analyst (+852) 2203 6178 [email protected]
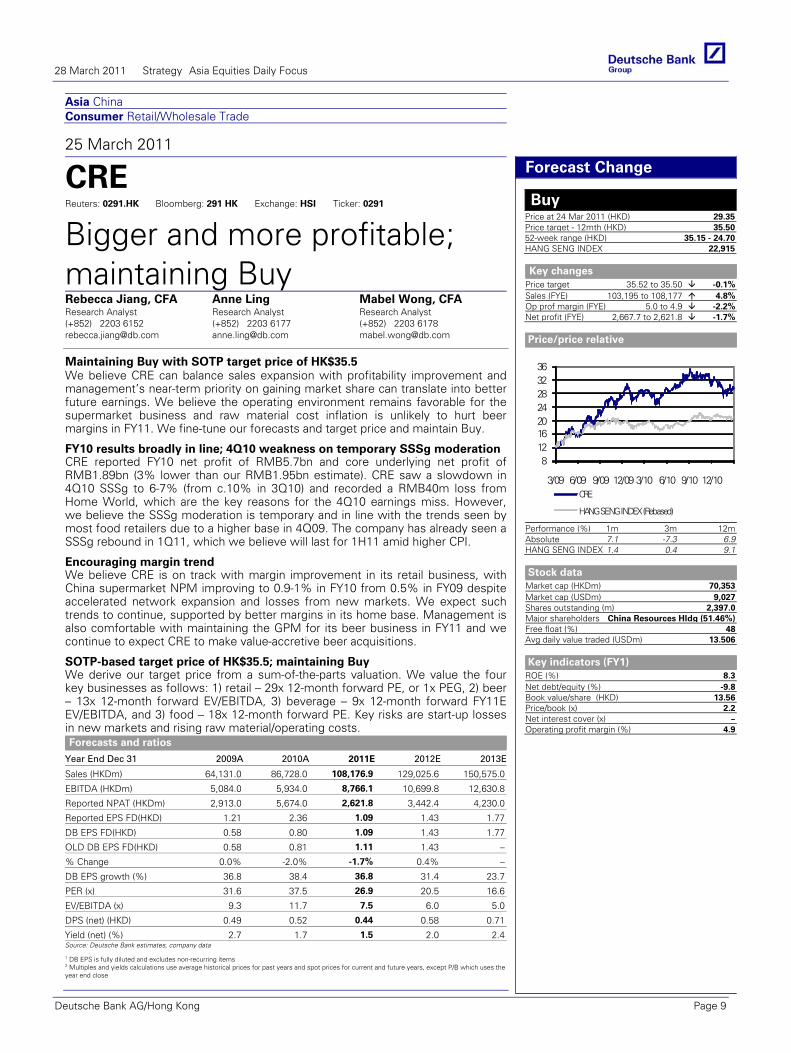
Maintaining Buy with SOTP target price of HK$35.5 We believe CRE can balance sales expansion with profitability improvement and management’s near-term priority on gaining market share can translate into better future earnings. We believe the operating environment remains favorable for the supermarket business and raw material cost inflation is unlikely to hurt beer margins in FY11. We fine-tune our forecasts and target price and maintain Buy.
Forecasts and ratios
Year End Dec 31 2009A 2010A 2011E 2012E 2013E
Sales (HKDm) 64,131.0 86,728.0 108,176.9 129,025.6 150,575.0
EBITDA (HKDm) 5,084.0 5,934.0 8,766.1 10,699.8 12,630.8
Reported NPAT (HKDm) 2,913.0 5,674.0 2,621.8 3,442.4 4,230.0
Reported EPS FD(HKD) 1.21 2.36 1.09 1.43 1.77
DB EPS FD(HKD) 0.58 0.80 1.09 1.43 1.77
OLD DB EPS FD(HKD) 0.58 0.81 1.11 1.43 –
% Change 0.0% -2.0% -1.7% 0.4% –
DB EPS growth (%) 36.8 38.4 36.8 31.4 23.7
PER (x) 31.6 37.5 26.9 20.5 16.6
EV/EBITDA (x) 9.3 11.7 7.5 6.0 5.0
DPS (net) (HKD) 0.49 0.52 0.44 0.58 0.71
Yield (net) (%) 2.7 1.7 1.5 2.0 2.4Source: Deutsche Bank estimates, company data
1 DB EPS is fully diluted and excludes non-recurring items 2 Multiples and yields calculations use average historical prices for past years and spot prices for current and future years, except P/B which uses the year end close
Forecast Change
Buy Price at 24 Mar 2011 (HKD) 29.35Price target - 12mth (HKD) 35.5052-week range (HKD) 35.15 - 24.70HANG SENG INDEX 22,915
Key changes
Price target 35.52 to 35.50 -0.1%Sales (FYE) 103,195 to 108,177 4.8%Op prof margin (FYE) 5.0 to 4.9 -2.2%Net profit (FYE) 2,667.7 to 2,621.8 -1.7%
Price/price relative
812162024283236
3/09 6/09 9/09 12/09 3/10 6/10 9/10 12/10CRE
HANG SENG INDEX (Rebased)
Performance (%) 1m 3m 12mAbsolute 7.1 -7.3 6.9HANG SENG INDEX 1.4 0.4 9.1
Stock data
Market cap (HKDm) 70,353Market cap (USDm) 9,027Shares outstanding (m) 2,397.0Major shareholders China Resources Hldg (51.46%)Free float (%) 48Avg daily value traded (USDm) 13.506
Key indicators (FY1)
ROE (%) 8.3Net debt/equity (%) -9.8Book value/share (HKD) 13.56Price/book (x) 2.2Net interest cover (x) –Operating profit margin (%) 4.9
FY10 results broadly in line; 4Q10 weakness on temporary SSSg moderation CRE reported FY10 net profit of RMB5.7bn and core underlying net profit of RMB1.89bn (3% lower than our RMB1.95bn estimate). CRE saw a slowdown in 4Q10 SSSg to 6-7% (from c.10% in 3Q10) and recorded a RMB40m loss from Home World, which are the key reasons for the 4Q10 earnings miss. However, we believe the SSSg moderation is temporary and in line with the trends seen by most food retailers due to a higher base in 4Q09. The company has already seen a SSSg rebound in 1Q11, which we believe will last for 1H11 amid higher CPI.
Encouraging margin trend We believe CRE is on track with margin improvement in its retail business, with China supermarket NPM improving to 0.9-1% in FY10 from 0.5% in FY09 despite accelerated network expansion and losses from new markets. We expect such trends to continue, supported by better margins in its home base. Management is also comfortable with maintaining the GPM for its beer business in FY11 and we continue to expect CRE to make value-accretive beer acquisitions.
SOTP-based target price of HK$35.5; maintaining Buy We derive our target price from a sum-of-the-parts valuation. We value the four key businesses as follows: 1) retail – 29x 12-month forward PE, or 1x PEG, 2) beer – 13x 12-month forward EV/EBITDA, 3) beverage – 9x 12-month forward FY11E EV/EBITDA, and 3) food – 18x 12-month forward PE. Key risks are start-up losses in new markets and rising raw material/operating costs.
28 March 2011 Strategy Asia Equities Daily Focus
Deutsche Bank AG/Hong Kong Page 9
Asia ChinaUtilities Utilities
28 Mar 2011 - 02:02:56 AM HKT
COMPANY ALERT Results
ENN Energy Buy
FY10 results in-line with DBe but 5% below consensus
Reuters:2688.HK Exchange:HKG Ticker:2688
Price (HKD) 26.15
Price target (HKD) 28.30
52-week range (HKD) 26.15 - 13.94
Market cap (USDm) 3,524
Shares outstanding (m) 1,050.1
Net debt/equity (%) 44.7
Book value/share (CNY) 5.69
Price/book (x) 3.9
FYE 12/31 2009A 2010E 2011E
Sales(CNYm)
8,413 11,215 12,166
Net Profit(CNYm)
802.9 1,013.1 1,213.5
DB EPS(CNY)
0.86 1.00 1.18
PER (x) 12.9 22.1 18.6
Yield (net)(%)
1.7 1.3 1.6
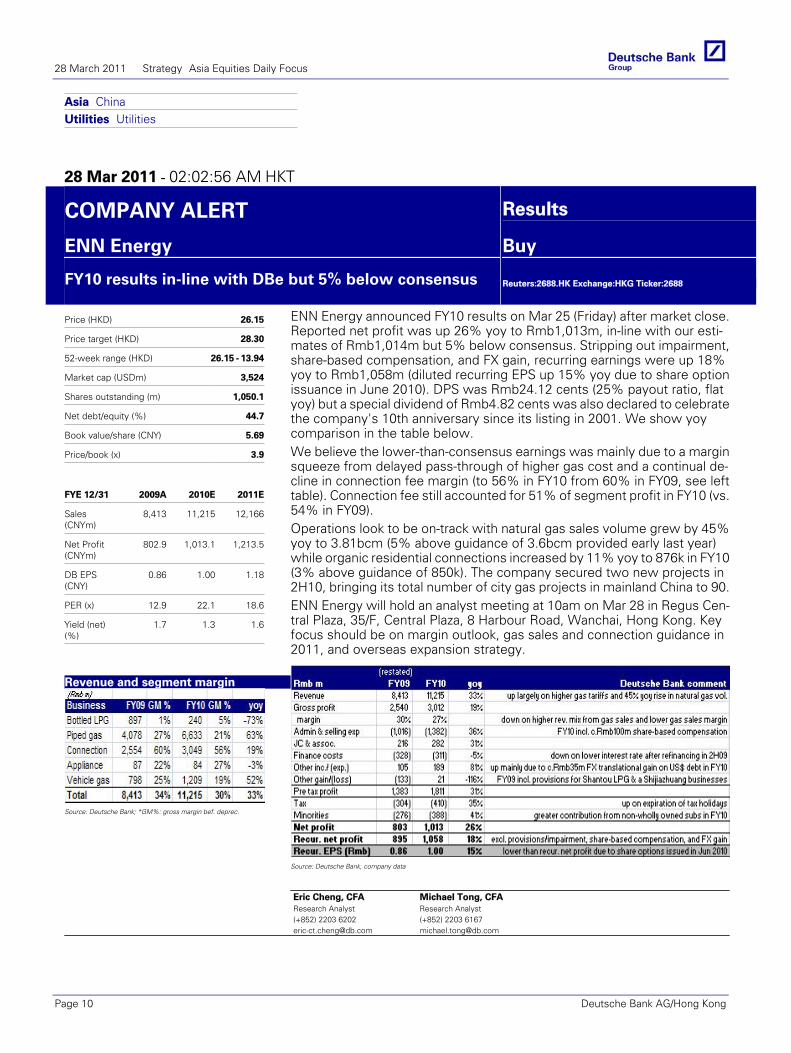
Revenue and segment margin
Source: Deutsche Bank; *GM%: gross margin bef. deprec.
ENN Energy announced FY10 results on Mar 25 (Friday) after market close.Reported net profit was up 26% yoy to Rmb1,013m, in-line with our esti-mates of Rmb1,014m but 5% below consensus. Stripping out impairment,share-based compensation, and FX gain, recurring earnings were up 18%yoy to Rmb1,058m (diluted recurring EPS up 15% yoy due to share optionissuance in June 2010). DPS was Rmb24.12 cents (25% payout ratio, flatyoy) but a special dividend of Rmb4.82 cents was also declared to celebratethe company's 10th anniversary since its listing in 2001. We show yoycomparison in the table below.We believe the lower-than-consensus earnings was mainly due to a marginsqueeze from delayed pass-through of higher gas cost and a continual de-cline in connection fee margin (to 56% in FY10 from 60% in FY09, see lefttable). Connection fee still accounted for 51% of segment profit in FY10 (vs.54% in FY09).Operations look to be on-track with natural gas sales volume grew by 45%yoy to 3.81bcm (5% above guidance of 3.6bcm provided early last year)while organic residential connections increased by 11% yoy to 876k in FY10(3% above guidance of 850k). The company secured two new projects in2H10, bringing its total number of city gas projects in mainland China to 90.ENN Energy will hold an analyst meeting at 10am on Mar 28 in Regus Cen-tral Plaza, 35/F, Central Plaza, 8 Harbour Road, Wanchai, Hong Kong. Keyfocus should be on margin outlook, gas sales and connection guidance in2011, and overseas expansion strategy.
Source: Deutsche Bank, company data
Eric Cheng, CFAResearch Analyst(+852) 2203 [email protected]
Michael Tong, CFAResearch Analyst(+852) 2203 [email protected]
28 March 2011 Strategy Asia Equities Daily Focus
Page 10 Deutsche Bank AG/Hong Kong
Asia Hong Kong Consumer Retail/Wholesale Trade
24 March 2011
Giordano Reuters: 0709.HK Bloomberg: 709 HK Exchange: HKG Ticker: 0709
2011 outlook; maintaining Buy
Anne Ling Research Analyst (+852) 2203 6177 [email protected]
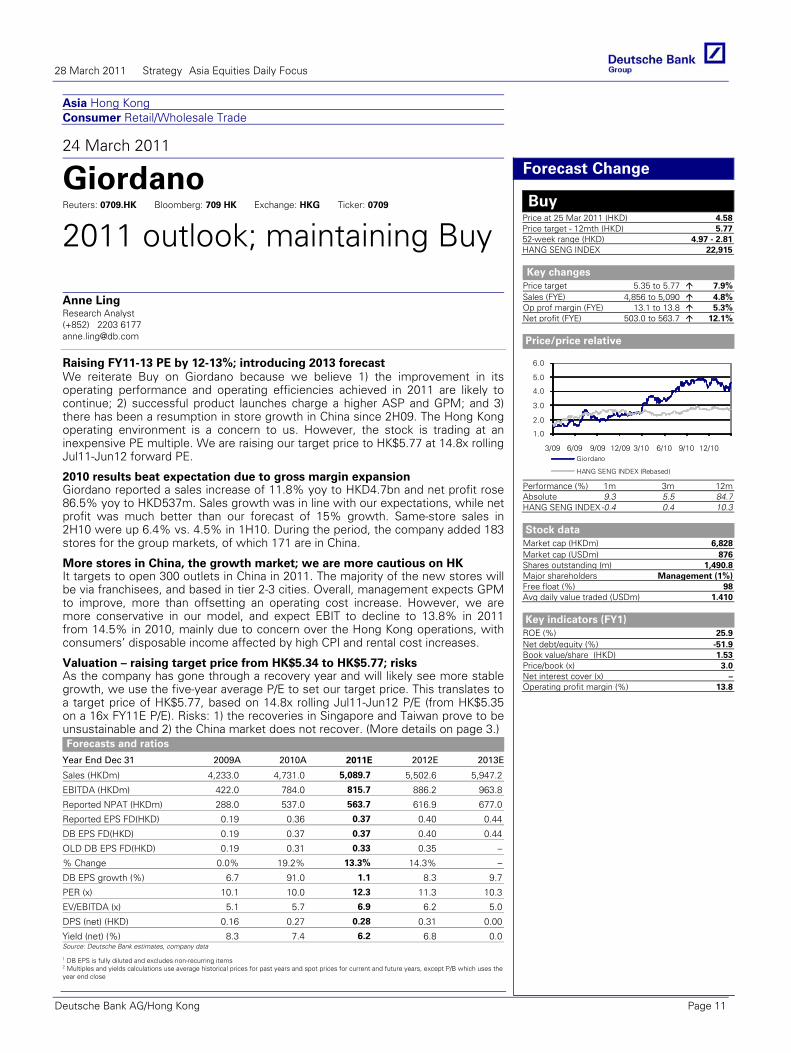
Raising FY11-13 PE by 12-13%; introducing 2013 forecast We reiterate Buy on Giordano because we believe 1) the improvement in its operating performance and operating efficiencies achieved in 2011 are likely to continue; 2) successful product launches charge a higher ASP and GPM; and 3) there has been a resumption in store growth in China since 2H09. The Hong Kong operating environment is a concern to us. However, the stock is trading at an inexpensive PE multiple. We are raising our target price to HK$5.77 at 14.8x rolling Jul11-Jun12 forward PE.
Forecasts and ratios
Year End Dec 31 2009A 2010A 2011E 2012E 2013E
Sales (HKDm) 4,233.0 4,731.0 5,089.7 5,502.6 5,947.2
EBITDA (HKDm) 422.0 784.0 815.7 886.2 963.8
Reported NPAT (HKDm) 288.0 537.0 563.7 616.9 677.0
Reported EPS FD(HKD) 0.19 0.36 0.37 0.40 0.44
DB EPS FD(HKD) 0.19 0.37 0.37 0.40 0.44
OLD DB EPS FD(HKD) 0.19 0.31 0.33 0.35 –
% Change 0.0% 19.2% 13.3% 14.3% –
DB EPS growth (%) 6.7 91.0 1.1 8.3 9.7
PER (x) 10.1 10.0 12.3 11.3 10.3
EV/EBITDA (x) 5.1 5.7 6.9 6.2 5.0
DPS (net) (HKD) 0.16 0.27 0.28 0.31 0.00
Yield (net) (%) 8.3 7.4 6.2 6.8 0.0Source: Deutsche Bank estimates, company data
1 DB EPS is fully diluted and excludes non-recurring items 2 Multiples and yields calculations use average historical prices for past years and spot prices for current and future years, except P/B which uses the year end close
Forecast Change
Buy Price at 25 Mar 2011 (HKD) 4.58Price target - 12mth (HKD) 5.7752-week range (HKD) 4.97 - 2.81HANG SENG INDEX 22,915
Key changes
Price target 5.35 to 5.77 7.9%Sales (FYE) 4,856 to 5,090 4.8%Op prof margin (FYE) 13.1 to 13.8 5.3%Net profit (FYE) 503.0 to 563.7 12.1%
Price/price relative
1.0
2.0
3.0
4.0
5.0
6.0
3/09 6/09 9/09 12/09 3/10 6/10 9/10 12/10Giordano
HANG SENG INDEX (Rebased)
Performance (%) 1m 3m 12mAbsolute 9.3 5.5 84.7HANG SENG INDEX -0.4 0.4 10.3
Stock data
Market cap (HKDm) 6,828Market cap (USDm) 876Shares outstanding (m) 1,490.8Major shareholders Management (1%)Free float (%) 98Avg daily value traded (USDm) 1.410
Key indicators (FY1)
ROE (%) 25.9Net debt/equity (%) -51.9Book value/share (HKD) 1.53Price/book (x) 3.0Net interest cover (x) –Operating profit margin (%) 13.8
2010 results beat expectation due to gross margin expansion Giordano reported a sales increase of 11.8% yoy to HKD4.7bn and net profit rose 86.5% yoy to HKD537m. Sales growth was in line with our expectations, while net profit was much better than our forecast of 15% growth. Same-store sales in 2H10 were up 6.4% vs. 4.5% in 1H10. During the period, the company added 183 stores for the group markets, of which 171 are in China.
More stores in China, the growth market; we are more cautious on HK It targets to open 300 outlets in China in 2011. The majority of the new stores will be via franchisees, and based in tier 2-3 cities. Overall, management expects GPM to improve, more than offsetting an operating cost increase. However, we are more conservative in our model, and expect EBIT to decline to 13.8% in 2011 from 14.5% in 2010, mainly due to concern over the Hong Kong operations, with consumers’ disposable income affected by high CPI and rental cost increases.
Valuation – raising target price from HK$5.34 to HK$5.77; risks As the company has gone through a recovery year and will likely see more stable growth, we use the five-year average P/E to set our target price. This translates to a target price of HK$5.77, based on 14.8x rolling Jul11-Jun12 P/E (from HK$5.35 on a 16x FY11E P/E). Risks: 1) the recoveries in Singapore and Taiwan prove to be unsustainable and 2) the China market does not recover. (More details on page 3.)
28 March 2011 Strategy Asia Equities Daily Focus
Deutsche Bank AG/Hong Kong Page 11
Asia China Banking/Finance General Insurance
25 March 2011
PICC Reuters: 2328.HK Bloomberg: 2328 HK Exchange: HKG Ticker: 2328
Premium solvency at 18.3%; maintaining Sell Bob Leung Research Analyst (+852) 2203 6200 [email protected]
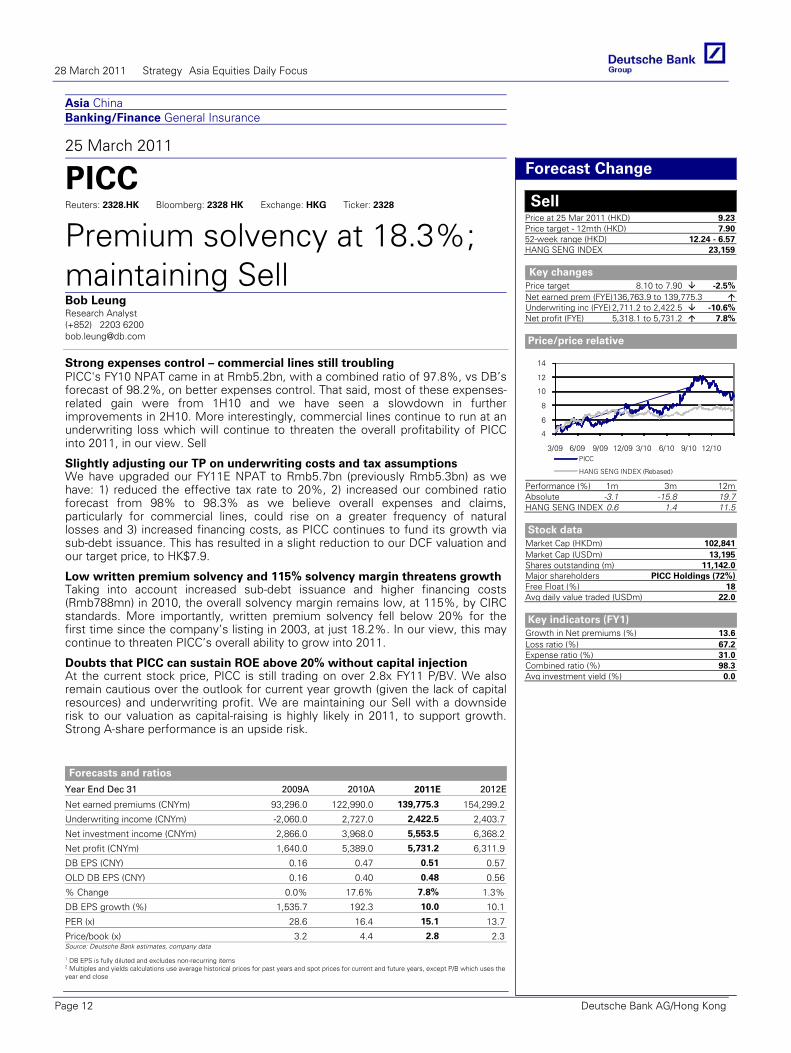
Strong expenses control – commercial lines still troubling PICC's FY10 NPAT came in at Rmb5.2bn, with a combined ratio of 97.8%, vs DB’s forecast of 98.2%, on better expenses control. That said, most of these expenses-related gain were from 1H10 and we have seen a slowdown in further improvements in 2H10. More interestingly, commercial lines continue to run at an underwriting loss which will continue to threaten the overall profitability of PICC into 2011, in our view. Sell
Forecasts and ratios
Year End Dec 31 2009A 2010A 2011E 2012E
Net earned premiums (CNYm) 93,296.0 122,990.0 139,775.3 154,299.2
Underwriting income (CNYm) -2,060.0 2,727.0 2,422.5 2,403.7
Net investment income (CNYm) 2,866.0 3,968.0 5,553.5 6,368.2
Net profit (CNYm) 1,640.0 5,389.0 5,731.2 6,311.9
DB EPS (CNY) 0.16 0.47 0.51 0.57
OLD DB EPS (CNY) 0.16 0.40 0.48 0.56
% Change 0.0% 17.6% 7.8% 1.3%
DB EPS growth (%) 1,535.7 192.3 10.0 10.1
PER (x) 28.6 16.4 15.1 13.7
Price/book (x) 3.2 4.4 2.8 2.3Source: Deutsche Bank estimates, company data
1 DB EPS is fully diluted and excludes non-recurring items 2 Multiples and yields calculations use average historical prices for past years and spot prices for current and future years, except P/B which uses the year end close
Forecast Change
Sell Price at 25 Mar 2011 (HKD) 9.23Price target - 12mth (HKD) 7.9052-week range (HKD) 12.24 - 6.57HANG SENG INDEX 23,159
Key changes
Price target 8.10 to 7.90 -2.5%Net earned prem (FYE)136,763.9 to 139,775.3Underwriting inc (FYE) 2,711.2 to 2,422.5 -10.6%Net profit (FYE) 5,318.1 to 5,731.2 7.8%
Price/price relative
4
6
8
10
12
14
3/09 6/09 9/09 12/09 3/10 6/10 9/10 12/10PICC
HANG SENG INDEX (Rebased)
Performance (%) 1m 3m 12mAbsolute -3.1 -15.8 19.7HANG SENG INDEX 0.6 1.4 11.5
Stock data
Market Cap (HKDm) 102,841Market Cap (USDm) 13,195Shares outstanding (m) 11,142.0Major shareholders PICC Holdings (72%)Free Float (%) 18Avg daily value traded (USDm) 22.0
Key indicators (FY1)
Growth in Net premiums (%) 13.6Loss ratio (%) 67.2Expense ratio (%) 31.0Combined ratio (%) 98.3Avg investment yield (%) 0.0
Slightly adjusting our TP on underwriting costs and tax assumptions We have upgraded our FY11E NPAT to Rmb5.7bn (previously Rmb5.3bn) as we have: 1) reduced the effective tax rate to 20%, 2) increased our combined ratio forecast from 98% to 98.3% as we believe overall expenses and claims, particularly for commercial lines, could rise on a greater frequency of natural losses and 3) increased financing costs, as PICC continues to fund its growth via sub-debt issuance. This has resulted in a slight reduction to our DCF valuation and our target price, to HK$7.9.
Low written premium solvency and 115% solvency margin threatens growth Taking into account increased sub-debt issuance and higher financing costs (Rmb788mn) in 2010, the overall solvency margin remains low, at 115%, by CIRC standards. More importantly, written premium solvency fell below 20% for the first time since the company’s listing in 2003, at just 18.2%. In our view, this may continue to threaten PICC’s overall ability to grow into 2011.
Doubts that PICC can sustain ROE above 20% without capital injection At the current stock price, PICC is still trading on over 2.8x FY11 P/BV. We also remain cautious over the outlook for current year growth (given the lack of capital resources) and underwriting profit. We are maintaining our Sell with a downside risk to our valuation as capital-raising is highly likely in 2011, to support growth. Strong A-share performance is an upside risk.
28 March 2011 Strategy Asia Equities Daily Focus
Page 12 Deutsche Bank AG/Hong Kong
Asia ASEAN SingaporeTransportation
25 Mar 2011 - 11:06:39 AM GMT
COMPANY ALERT Forecast Change
Cosco Corporation Buy
LOI with Sevan worth over US$1bn
Reuters:COSC.SI Exchange:SES Ticker:COSC
Price (SGD) 2.01
Price target (SGD) 2.45
52-week range (SGD) 2.42 - 1.24
Market cap (USDm) 3,571
Shares outstanding (m) 2,239.2
Net debt/equity (%) -18.4
Book value/share (SGD) 0.62
Price/book (x) 3.3
FYE 12/31 2010A 2011E 2012E
Sales(SGDm)
3,861 4,455 5,329
Net Profit(SGDm)
248.8 279.4 339.6
DB EPS(SGD)
0.11 0.12 0.15
PER (x) 14.5 16.1 13.3
Yield (net)(%)
2.5 2.2 2.7
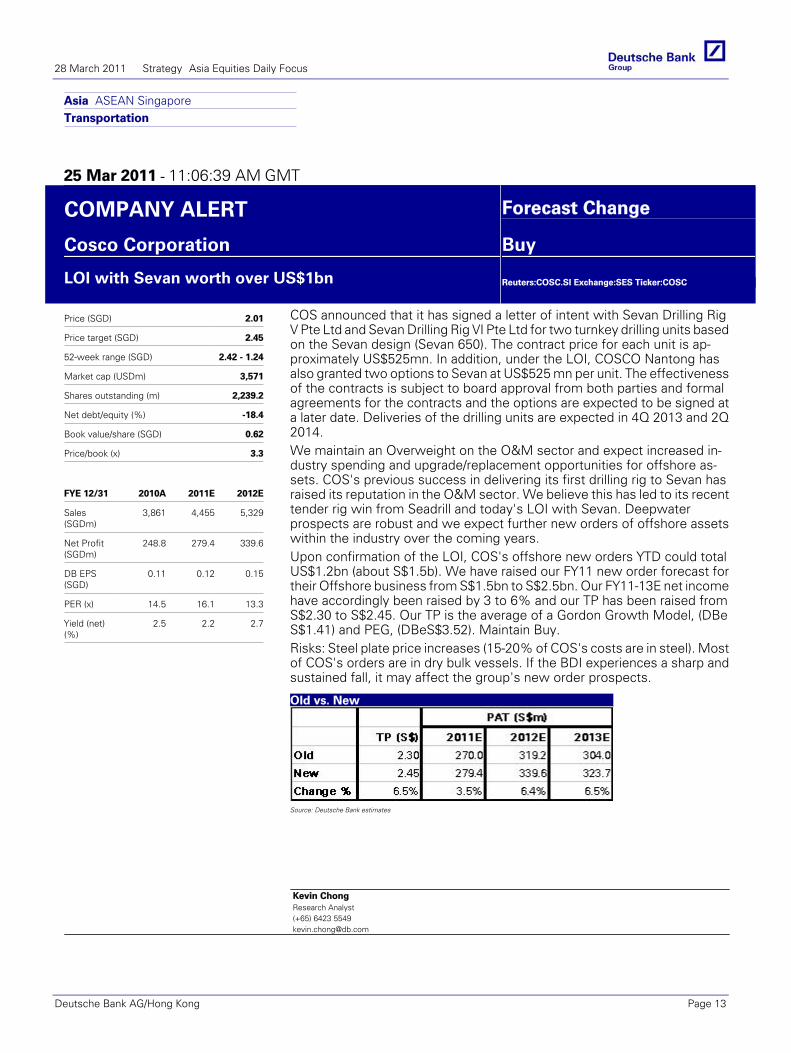
COS announced that it has signed a letter of intent with Sevan Drilling RigV Pte Ltd and Sevan Drilling Rig VI Pte Ltd for two turnkey drilling units basedon the Sevan design (Sevan 650). The contract price for each unit is ap-proximately US$525mn. In addition, under the LOI, COSCO Nantong hasalso granted two options to Sevan at US$525 mn per unit. The effectivenessof the contracts is subject to board approval from both parties and formalagreements for the contracts and the options are expected to be signed ata later date. Deliveries of the drilling units are expected in 4Q 2013 and 2Q2014.We maintain an Overweight on the O&M sector and expect increased in-dustry spending and upgrade/replacement opportunities for offshore as-sets. COS's previous success in delivering its first drilling rig to Sevan hasraised its reputation in the O&M sector. We believe this has led to its recenttender rig win from Seadrill and today's LOI with Sevan. Deepwaterprospects are robust and we expect further new orders of offshore assetswithin the industry over the coming years.Upon confirmation of the LOI, COS's offshore new orders YTD could totalUS$1.2bn (about S$1.5b). We have raised our FY11 new order forecast fortheir Offshore business from S$1.5bn to S$2.5bn. Our FY11-13E net incomehave accordingly been raised by 3 to 6% and our TP has been raised fromS$2.30 to S$2.45. Our TP is the average of a Gordon Growth Model, (DBeS$1.41) and PEG, (DBeS$3.52). Maintain Buy.Risks: Steel plate price increases (15-20% of COS's costs are in steel). Mostof COS's orders are in dry bulk vessels. If the BDI experiences a sharp andsustained fall, it may affect the group's new order prospects.
Old vs. New
Source: Deutsche Bank estimates
Kevin ChongResearch Analyst(+65) 6423 [email protected]
28 March 2011 Strategy Asia Equities Daily Focus
Deutsche Bank AG/Hong Kong Page 13
Asia ASEAN IndonesiaResources Metals & Mining
25 Mar 2011 - 02:29:13 PM GMT
COMPANY ALERT Forecast Change
PT Bukit Asam Buy
Adjusting for 2010 results
Reuters:PTBA.JK Exchange:JKT Ticker:PTBA
Price (IDR) 20,950
Price target (IDR) 33,300
52-week range (IDR) 24,900.00 -15,700.00
Market cap (USDm) 5,536
Shares outstanding (m) 2,304.1
Net debt/equity (%) -78.2
Book value/share (IDR) 3,939
Price/book (x) 5.32
FYE 12/31 2010A 2011E 2012E
Sales(IDRbn)
7,909 12,849 17,554
Net Profit(IDRbn)
2,009 3,598 5,662
DB EPS(IDR)
883 1,562 2,457
PER (x) 20.5 13.4 8.5
Yield (net)(%)
2.4 3.7 5.9
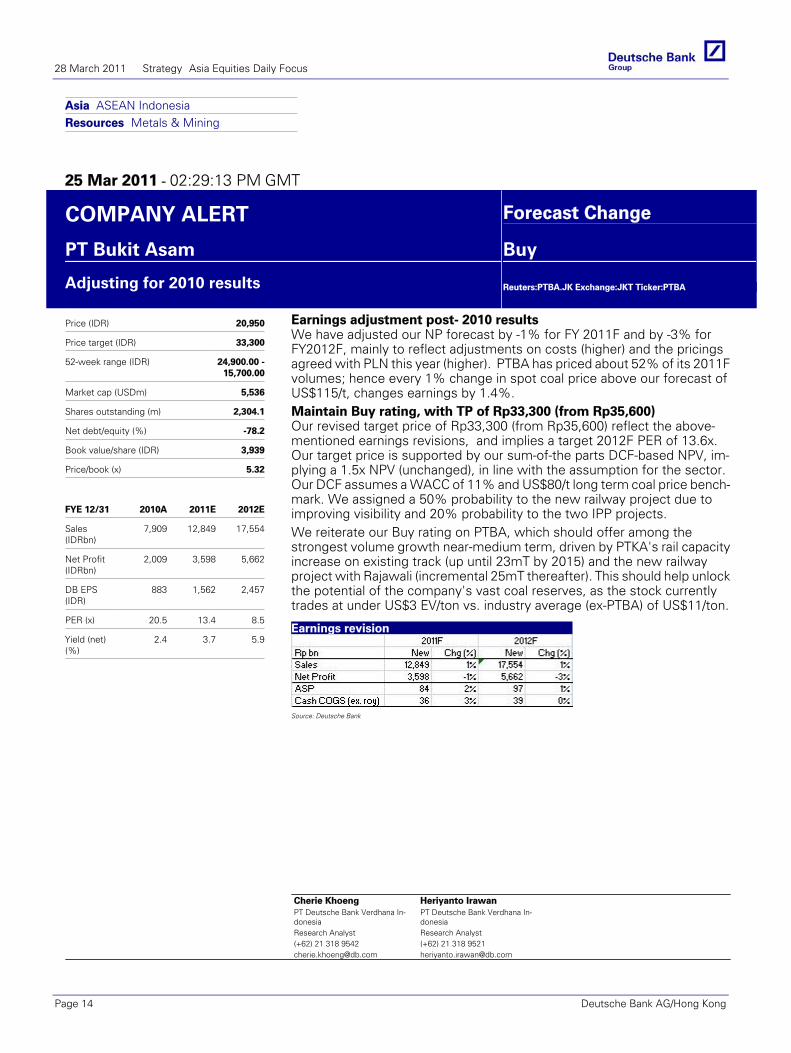
Earnings adjustment post- 2010 resultsWe have adjusted our NP forecast by -1% for FY 2011F and by -3% forFY2012F, mainly to reflect adjustments on costs (higher) and the pricingsagreed with PLN this year (higher). PTBA has priced about 52% of its 2011Fvolumes; hence every 1% change in spot coal price above our forecast ofUS$115/t, changes earnings by 1.4%.Maintain Buy rating, with TP of Rp33,300 (from Rp35,600)Our revised target price of Rp33,300 (from Rp35,600) reflect the above-mentioned earnings revisions, and implies a target 2012F PER of 13.6x.Our target price is supported by our sum-of-the parts DCF-based NPV, im-plying a 1.5x NPV (unchanged), in line with the assumption for the sector.Our DCF assumes a WACC of 11% and US$80/t long term coal price bench-mark. We assigned a 50% probability to the new railway project due toimproving visibility and 20% probability to the two IPP projects.We reiterate our Buy rating on PTBA, which should offer among thestrongest volume growth near-medium term, driven by PTKA's rail capacityincrease on existing track (up until 23mT by 2015) and the new railwayproject with Rajawali (incremental 25mT thereafter). This should help unlockthe potential of the company's vast coal reserves, as the stock currentlytrades at under US$3 EV/ton vs. industry average (ex-PTBA) of US$11/ton.
Earnings revision
Source: Deutsche Bank
Cherie KhoengPT Deutsche Bank Verdhana In-donesiaResearch Analyst(+62) 21 318 [email protected]
Heriyanto IrawanPT Deutsche Bank Verdhana In-donesiaResearch Analyst(+62) 21 318 [email protected]
28 March 2011 Strategy Asia Equities Daily Focus
Page 14 Deutsche Bank AG/Hong Kong
Asia
25 March 2011
Asia Economics Daily
Malaysia CPI and Singapore IP
Michael Spencer, Ph.D Chief Economist, Asia (+852) 2203 8303 [email protected]
Jun Ma, Ph.D Chief Economist, Greater China (+852) 2203 8308 [email protected]
Taimur Baig, Ph.D Chief Economist, India (+65) 6423 8681 [email protected]
Juliana Lee Senior Economist (+852) 2203 8312 [email protected]
Kaushik Das Economist (+91) 22 6658 4909 [email protected]
Eco
no
mic
s
HIGHLIGHTS
Malaysia - CPI inflation touches 2.9% in February Singapore – Production activities remain weak in February, below expectations Philippines - Trade deficit widens in January Taiwan -- M2 rises by 6.1%yoy in February
UPCOMING RELEASES
Taiwan- Leading Indicator (Feb) DB forecast 0.2%(0.6% in Jan) Thailand- Manufacturing Production (Feb) DB forecast 1.8%(3.7% in Jan) Vietnam- GDP (Q1’11) DB forecast 6.3%(7.7% in Q4’10) Vietnam- Exports (ytd) (Mar) DB forecast 43.9%(40.3% in Feb) Vietnam- Industrial Production (ytd) (Mar) DB forecast 15.0%(14.6% in Feb) Vietnam- Retail Sales (ytd) (Mar) DB forecast 24.0%(23.5% in Feb) Sri Lanka – GDP (Q4) DB forecast 7.7%(8.0% in Q3)
Sri Lanka’s economy is likely to post a 7.7%yoy real GDP growth in 4Q’10, slightly lower than the 8.0% outturn in 3Q. This should lead to a 2010 full year growth of 7.8%, reversing sharply from the 3.5% growth recorded in 2009. While farm sector is expected to grow by 5.0%yoy in 4Q, non-farm sector growth is likely to moderate to 8.0%, from 8.3% in the previous quarter.
NEWS IN BRIEF
MALAYSIA CPI inflation (Feb). CPI inflation accelerated to 2.9%yoy in February, sharply up from 2.4% in January, beating our (2.5%) as well as consensus (2.7%) expectations. This upward surprise came from food index, inflation of which rose at a faster pace of 4.7% in February, as compared to 3.6% and 2.8% respectively in the last two months. Meanwhile, housing and transport inflation prices rose by 1.5% and 4.5% respectively in February, marginally higher than 1.4% and 4.3% reported in January. We expect inflation to become more volatile in the coming months as food and fuel subsidies are gradually removed.
(Continued on the next page…)
28 March 2011 Strategy Asia Equities Daily Focus
Deutsche Bank AG/Hong Kong Page 15
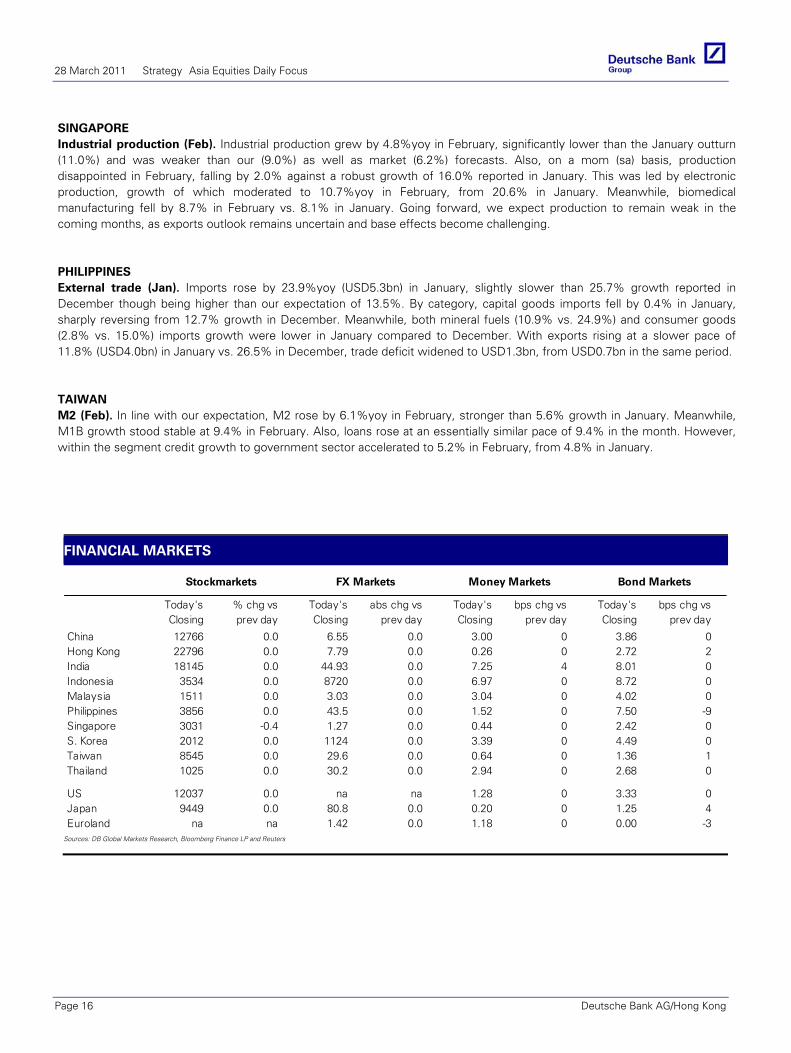
SINGAPORE Industrial production (Feb). Industrial production grew by 4.8%yoy in February, significantly lower than the January outturn (11.0%) and was weaker than our (9.0%) as well as market (6.2%) forecasts. Also, on a mom (sa) basis, production disappointed in February, falling by 2.0% against a robust growth of 16.0% reported in January. This was led by electronic production, growth of which moderated to 10.7%yoy in February, from 20.6% in January. Meanwhile, biomedical manufacturing fell by 8.7% in February vs. 8.1% in January. Going forward, we expect production to remain weak in the coming months, as exports outlook remains uncertain and base effects become challenging.
PHILIPPINES External trade (Jan). Imports rose by 23.9%yoy (USD5.3bn) in January, slightly slower than 25.7% growth reported in December though being higher than our expectation of 13.5%. By category, capital goods imports fell by 0.4% in January, sharply reversing from 12.7% growth in December. Meanwhile, both mineral fuels (10.9% vs. 24.9%) and consumer goods (2.8% vs. 15.0%) imports growth were lower in January compared to December. With exports rising at a slower pace of 11.8% (USD4.0bn) in January vs. 26.5% in December, trade deficit widened to USD1.3bn, from USD0.7bn in the same period.
TAIWAN M2 (Feb). In line with our expectation, M2 rose by 6.1%yoy in February, stronger than 5.6% growth in January. Meanwhile, M1B growth stood stable at 9.4% in February. Also, loans rose at an essentially similar pace of 9.4% in the month. However, within the segment credit growth to government sector accelerated to 5.2% in February, from 4.8% in January.
FINANCIAL MARKETS
Today's % chg vs Today's abs chg vs Today's bps chg vs Today's bps chg vsClosing prev day Closing prev day Closing prev day Closing prev day
China 12766 0.0 6.55 0.0 3.00 0 3.86 0Hong Kong 22796 0.0 7.79 0.0 0.26 0 2.72 2India 18145 0.0 44.93 0.0 7.25 4 8.01 0Indonesia 3534 0.0 8720 0.0 6.97 0 8.72 0Malaysia 1511 0.0 3.03 0.0 3.04 0 4.02 0Philippines 3856 0.0 43.5 0.0 1.52 0 7.50 -9Singapore 3031 -0.4 1.27 0.0 0.44 0 2.42 0S. Korea 2012 0.0 1124 0.0 3.39 0 4.49 0Taiwan 8545 0.0 29.6 0.0 0.64 0 1.36 1Thailand 1025 0.0 30.2 0.0 2.94 0 2.68 0
US 12037 0.0 na na 1.28 0 3.33 0Japan 9449 0.0 80.8 0.0 0.20 0 1.25 4Euroland na na 1.42 0.0 1.18 0 0.00 -3
Stockmarkets FX Markets Money Markets Bond Markets
Sources: DB Global Markets Research, Bloomberg Finance LP and Reuters
28 March 2011 Strategy Asia Equities Daily Focus
Page 16 Deutsche Bank AG/Hong Kong
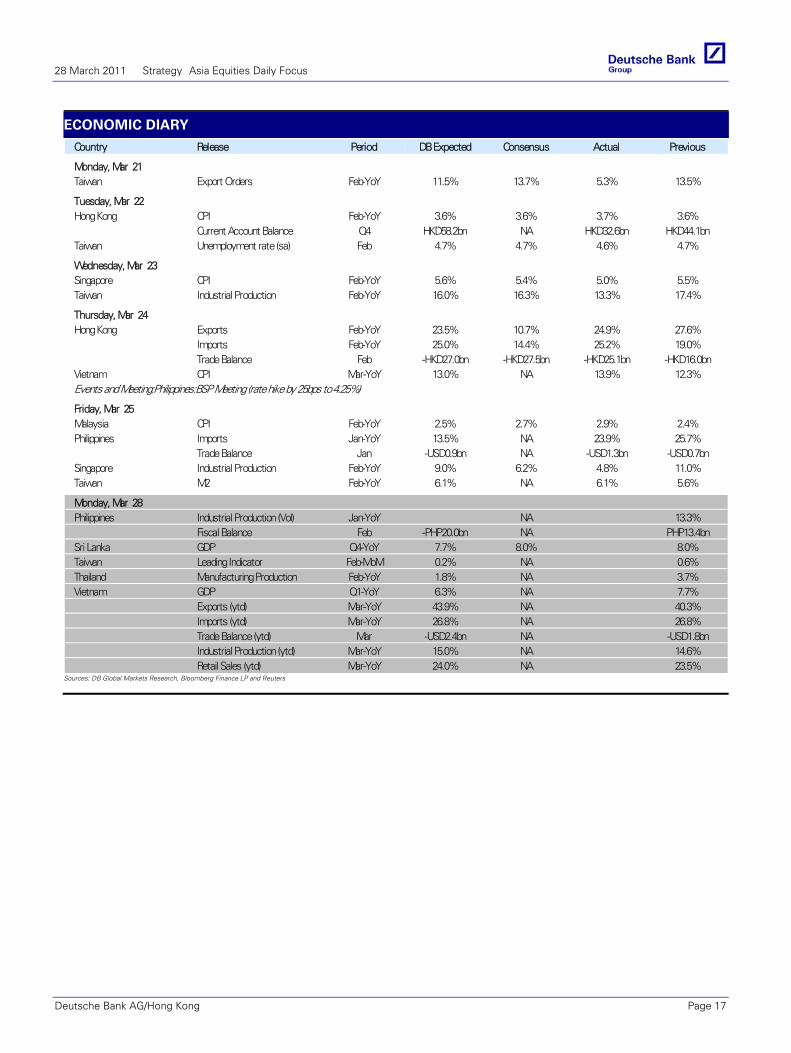
ECONOMIC DIARY
Country Release Period DB Expected Consensus Actual Previous
Monday, Mar 21Taiwan Export Orders Feb-YoY 11.5% 13.7% 5.3% 13.5%
Tuesday, Mar 22Hong Kong CPI Feb-YoY 3.6% 3.6% 3.7% 3.6%
Current Account Balance Q4 HKD58.2bn NA HKD32.6bn HKD44.1bnTaiwan Unemployment rate (sa) Feb 4.7% 4.7% 4.6% 4.7%
Wednesday, Mar 23Singapore CPI Feb-YoY 5.6% 5.4% 5.0% 5.5%Taiwan Industrial Production Feb-YoY 16.0% 16.3% 13.3% 17.4%
Thursday, Mar 24Hong Kong Exports Feb-YoY 23.5% 10.7% 24.9% 27.6%
Imports Feb-YoY 25.0% 14.4% 25.2% 19.0%Trade Balance Feb -HKD27.0bn -HKD27.5bn -HKD25.1bn -HKD16.0bn
Vietnam CPI Mar-YoY 13.0% NA 13.9% 12.3%Events and Meeting:Philippines:BSP Meeting (rate hike by 25bps to 4.25%)
Friday, Mar 25Malaysia CPI Feb-YoY 2.5% 2.7% 2.9% 2.4%Philippines Imports Jan-YoY 13.5% NA 23.9% 25.7%
Trade Balance Jan -USD0.9bn NA -USD1.3bn -USD0.7bnSingapore Industrial Production Feb-YoY 9.0% 6.2% 4.8% 11.0%Taiwan M2 Feb-YoY 6.1% NA 6.1% 5.6%
Monday, Mar 28Philippines Industrial Production (Vol) Jan-YoY NA 13.3%
Fiscal Balance Feb -PHP20.0bn NA PHP13.4bnSri Lanka GDP Q4-YoY 7.7% 8.0% 8.0%Taiwan Leading Indicator Feb-MoM 0.2% NA 0.6%Thailand Manufacturing Production Feb-YoY 1.8% NA 3.7%Vietnam GDP Q1-YoY 6.3% NA 7.7%
Exports (ytd) Mar-YoY 43.9% NA 40.3%Imports (ytd) Mar-YoY 26.8% NA 26.8%Trade Balance (ytd) Mar -USD2.4bn NA -USD1.8bnIndustrial Production (ytd) Mar-YoY 15.0% NA 14.6%Retail Sales (ytd) Mar-YoY 24.0% NA 23.5%
Sources: DB Global Markets Research, Bloomberg Finance LP and Reuters
28 March 2011 Strategy Asia Equities Daily Focus
Deutsche Bank AG/Hong Kong Page 17
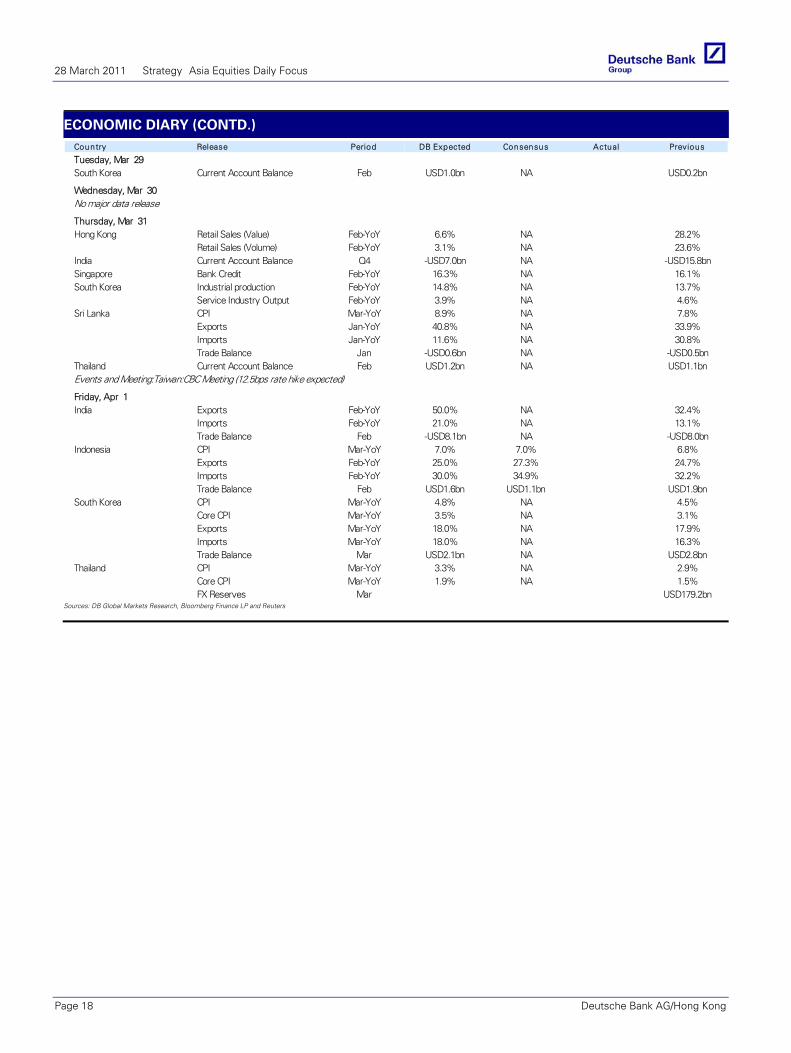
ECONOMIC DIARY (CONTD.) Country Release Period DB Expected Consensus Actual Previous
Tuesday, Mar 29South Korea Current Account Balance Feb USD1.0bn NA USD0.2bn
Wednesday, Mar 30No major data release
Thursday, Mar 31Hong Kong Retail Sales (Value) Feb-YoY 6.6% NA 28.2%
Retail Sales (Volume) Feb-YoY 3.1% NA 23.6%India Current Account Balance Q4 -USD7.0bn NA -USD15.8bnSingapore Bank Credit Feb-YoY 16.3% NA 16.1%South Korea Industrial production Feb-YoY 14.8% NA 13.7%
Service Industry Output Feb-YoY 3.9% NA 4.6%Sri Lanka CPI Mar-YoY 8.9% NA 7.8%
Exports Jan-YoY 40.8% NA 33.9%Imports Jan-YoY 11.6% NA 30.8%Trade Balance Jan -USD0.6bn NA -USD0.5bn
Thailand Current Account Balance Feb USD1.2bn NA USD1.1bnEvents and Meeting:Taiwan:CBC Meeting (12.5bps rate hike expected)
Friday, Apr 1India Exports Feb-YoY 50.0% NA 32.4%
Imports Feb-YoY 21.0% NA 13.1%Trade Balance Feb -USD8.1bn NA -USD8.0bn
Indonesia CPI Mar-YoY 7.0% 7.0% 6.8%Exports Feb-YoY 25.0% 27.3% 24.7%Imports Feb-YoY 30.0% 34.9% 32.2%Trade Balance Feb USD1.6bn USD1.1bn USD1.9bn
South Korea CPI Mar-YoY 4.8% NA 4.5%Core CPI Mar-YoY 3.5% NA 3.1%Exports Mar-YoY 18.0% NA 17.9%Imports Mar-YoY 18.0% NA 16.3%Trade Balance Mar USD2.1bn NA USD2.8bn
Thailand CPI Mar-YoY 3.3% NA 2.9%Core CPI Mar-YoY 1.9% NA 1.5%FX Reserves Mar USD179.2bn
Sources: DB Global Markets Research, Bloomberg Finance LP and Reuters
28 March 2011 Strategy Asia Equities Daily Focus
Page 18 Deutsche Bank AG/Hong Kong
Asia Corporate Credit
25 March 2011
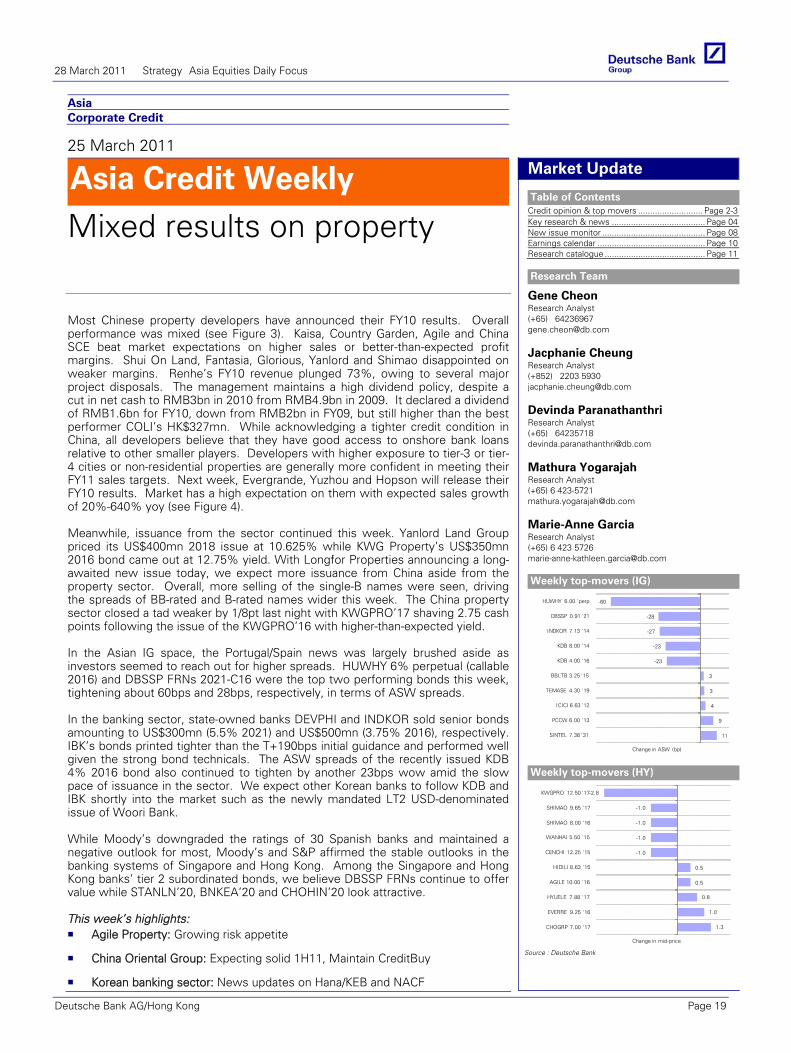
Asia Credit Weekly
Mixed results on property
Market Update
Table of Contents Credit opinion & top movers ........................... Page 2-3Key research & news ....................................... Page 04New issue monitor ........................................... Page 08Earnings calendar ............................................. Page 10Research catalogue .......................................... Page 11
Research Team
Gene Cheon Research Analyst (+65) 64236967 [email protected]
Jacphanie Cheung Research Analyst (+852) 2203 5930 [email protected]
Devinda Paranathanthri Research Analyst (+65) 64235718 [email protected]
Mathura Yogarajah Research Analyst (+65) 6 423-5721 [email protected]
Marie-Anne Garcia Research Analyst (+65) 6 423 5726 [email protected]
Weekly top-movers (IG)
11
9
4
3
3
-23
-23
-27
-28
-60
SINTEL 7.38 '31
PCCW 6.00 '13
ICICI 6.63 '12
TEMASE 4.30 '19
BBLTB 3.25 '15
KDB 4.00 '16
KDB 8.00 '14
INDKOR 7.13 '14
DBSSP 0.91 '21
HUWHY 6.00 'perp
Change in ASW (bp)
Weekly top-movers (HY)
1.3
1.0
0.8
0.5
0.5
-1.0
-1.0
-1.0
-1.0
-2.8
CHOGRP 7.00 '17
EVERRE 9.25 '16
HYUELE 7.88 '17
AGILE 10.00 '16
HIDILI 8.63 '15
CENCHI 12.25 '15
WANHAI 5.50 '15
SHIMAO 8.00 '16
SHIMAO 9.65 '17
KWGPRO 12.50 '17
Change in mid-price
Source : Deutsche Bank
Co
rpo
rate
Cre
dit
Most Chinese property developers have announced their FY10 results. Overall performance was mixed (see Figure 3). Kaisa, Country Garden, Agile and China SCE beat market expectations on higher sales or better-than-expected profit margins. Shui On Land, Fantasia, Glorious, Yanlord and Shimao disappointed on weaker margins. Renhe’s FY10 revenue plunged 73%, owing to several major project disposals. The management maintains a high dividend policy, despite a cut in net cash to RMB3bn in 2010 from RMB4.9bn in 2009. It declared a dividend of RMB1.6bn for FY10, down from RMB2bn in FY09, but still higher than the best performer COLI’s HK$327mn. While acknowledging a tighter credit condition in China, all developers believe that they have good access to onshore bank loans relative to other smaller players. Developers with higher exposure to tier-3 or tier-4 cities or non-residential properties are generally more confident in meeting their FY11 sales targets. Next week, Evergrande, Yuzhou and Hopson will release their FY10 results. Market has a high expectation on them with expected sales growth of 20%-640% yoy (see Figure 4). Meanwhile, issuance from the sector continued this week. Yanlord Land Group priced its US$400mn 2018 issue at 10.625% while KWG Property’s US$350mn 2016 bond came out at 12.75% yield. With Longfor Properties announcing a long-awaited new issue today, we expect more issuance from China aside from the property sector. Overall, more selling of the single-B names were seen, driving the spreads of BB-rated and B-rated names wider this week. The China property sector closed a tad weaker by 1/8pt last night with KWGPRO’17 shaving 2.75 cash points following the issue of the KWGPRO’16 with higher-than-expected yield. In the Asian IG space, the Portugal/Spain news was largely brushed aside as investors seemed to reach out for higher spreads. HUWHY 6% perpetual (callable 2016) and DBSSP FRNs 2021-C16 were the top two performing bonds this week, tightening about 60bps and 28bps, respectively, in terms of ASW spreads. In the banking sector, state-owned banks DEVPHI and INDKOR sold senior bonds amounting to US$300mn (5.5% 2021) and US$500mn (3.75% 2016), respectively. IBK’s bonds printed tighter than the T+190bps initial guidance and performed well given the strong bond technicals. The ASW spreads of the recently issued KDB 4% 2016 bond also continued to tighten by another 23bps wow amid the slow pace of issuance in the sector. We expect other Korean banks to follow KDB and IBK shortly into the market such as the newly mandated LT2 USD-denominated issue of Woori Bank. While Moody’s downgraded the ratings of 30 Spanish banks and maintained a negative outlook for most, Moody’s and S&P affirmed the stable outlooks in the banking systems of Singapore and Hong Kong. Among the Singapore and Hong Kong banks’ tier 2 subordinated bonds, we believe DBSSP FRNs continue to offer value while STANLN’20, BNKEA’20 and CHOHIN’20 look attractive. This week’s highlights:
Agile Property: Growing risk appetite
China Oriental Group: Expecting solid 1H11, Maintain CreditBuy
Korean banking sector: News updates on Hana/KEB and NACF
28 March 2011 Strategy Asia Equities Daily Focus
Deutsche Bank AG/Hong Kong Page 19
Asia
25 March 2011
Asia Local Markets Weekly Policy versus supply
Strategy Update
Table of Contents Summary Market Views ................................... Page 02Economics........................................................ Page 03Fixed Income Strategy ..................................... Page 04Foreign Exchange Strategy .............................. Page 10Economic Diary ................................................ Page 11Bond Supply Monitor ....................................... Page 12Monetary Policy Monitor.................................. Page 13Local Markets Analytics ................................... Page 14Asian Economic Indicators ............................... Page 19
Research Team
Sameer Goel Strategist (+65 ) 64236973 [email protected]
Mirza Baig Strategist (+65) 64235930 [email protected]
Linan Liu Strategist (+852) 2203 8709 [email protected]
Arjun Shetty Strategist (+65) 6423 5925 [email protected]
Michael Spencer, Ph.D Chief Economist (++852) 22038303 [email protected]
Dennis Tan Strategist (+65) 6 423-5347 [email protected]
Str
ateg
y
Economics: We think MAS will keep its policy stance unchanged next month. Core inflation has fallen below 2% and we think it will stay there for a few more months at least. That suggests to us that the current policy is working to keep inflation under control and further tightening is not necessary at this time. BSP raised rates this week in what we think will be the first of at least four 25bps rate hikes. We expect CBC will raise rates by 12.5bps again next week.
CNH: We don’t expect a significant correction in the CNH bond market in the event of an increase in CNH deposit rates, as we remain fairly optimistic on the prospect of RMB appreciation in the medium-term.
Malaysia: The BNM Annual Report was read by the market as a hawkish statement of its intent, but we still think the next rate hike is most likely not till Q3 this year (which is well priced in). We see supply as the more significant drag on the curve, and stick with our call for steepening.
Taiwan: The immediate focus is on CBC’s policy decision (March 31st). We are neutral on the front-end where our expectation of a 12.5bp hike has been fully priced in. Higher than expected duration supply in Q2 and the risk that the market may demand some compensation from the credit risk premium on Type B bonds poses upside risk to the long-end of the government yield curve.
Thailand: We think the front end of the IRS curve is under pricing policy rate hikes and hence we recommend being short. We like receiving the 1Y/3Y/5Y butterfly spreads at current levels as an inexpensive way to express this bearish view on the front end. We also look for swap spreads to widen on relatively better bond technicals.
FX: We like PHP and THB but are turning neutral on IDR as the rupiah's recent gains look overextended.
28 March 2011 Strategy Asia Equities Daily Focus
Page 20 Deutsche Bank AG/Hong Kong
North America United States
25 March 2011
US Daily Economic Notes
Payrolls, production & income dominate data docket 4
Eco
n
Economic ResearchResearch TeamJoseph A. LaVorgna Chief US Economist 212 250-7329 [email protected]
Carl J. Riccadonna Senior US Economist 212-250-0186 [email protected]
Brett Ryan Economist 212-250-6294 [email protected]
Policy Speeches
12:40 pm Atlanta Fed President Lockhart (non-voter) speaks on U.S. economy in Atlanta, GA 3:40 pm Chicago Fed President Evans (voter) speaks to reporters in Columbia, SC 4:00 pm Chicago Fed President Evans (voter) speaks on U.S. economy in Columbia, SC 6:00 pm Boston Fed President Rosengren (non-voter) speaks on recession and recovery in Boston, MA
Year End TargetsReal GDP growth: +4.1% Q4/Q4 Core PCE deflator: +2.1% Q4/Q4 Unemployment rate: 7.8% Fed Funds: 0.50%
Fed Policy
We expect fed funds to be range-bound between 0-25 bps through Q3 2011. The Fed is projected to hike rates to 0.50% in Q4 2011.
Tsy Auction
Size Prev. 1:00 pm 2-y note (auc.) $35B $35B
Post Employment Conference Call
Friday March 4, 9:00am ET
Domestic Participant Dial In: (877) 660- 0990/ International: (706) 643-3803 Conference ID: 29101415 Replay # (Begins after 11:30am ET): (800) 642-1687 or (706) 645-9291 Int’l
150
Monday Release Forecast Previous Consensus 8:30 am Personal income (Feb): +0.5% +1.0% +0.4% Personal consumption expenditure: +0.5% +0.2% +0.6% Core PCE deflator: +0.1% +0.1% +0.2% 10:00 am Pending home sales (Feb): Unch. -2.8% +0.9% Source: Deutsche Bank, Bloomberg Finance LP
Commentary for Monday: The data docket for the week ahead commences this morning with personal income and consumption as well as pending home sales. Regarding the latter, we expect pending sales to remain unchanged in February as the housing data of late continues to disappoint. However, we expect both income and spending in February to improve a modest 0.5% month-on-month in addition to a 0.1% increase in the core PCE. If our forecast proves correct, this would equate to nominal income growth of 5% year-on-year—a new cyclical high. Even on an inflation adjusted basis, the wages and salaries component of income should be up over 2.5%, roughly double the growth rate back in July 2010. This is consistent with a gradual firming of the labor market. Despite expected healthy consumption growth in February, we are less sanguine concerning consumer confidence (62.0 forecast vs. 70.4 previously) on Tuesday. This will be an important gauge going forward given that average retail gasoline prices have risen over 11% in just the last four weeks. This clearly had an impact on the University of Michigan survey and the Conference Board data should likely show a similar decline in sentiment. According to our analysis, every one penny increase in gasoline is worth about $1.4 billion in household energy consumption. If prices remain elevated for a significant period of time it could drag on growth. Unit motor vehicle sales (Friday) are one such category that could be affected by rising fuel costs. Sales should remain around 13.4M annualized in March, on track to meet our 2011 forecast of 13.6M.
Partly due to robust auto demand, the factory sector has continued to show strong performance. However we do expect a slight decline (70.0 vs. 71.2) in the Chicago PMI on Thursday as well as the ISM index (60.0 vs. 61.4) reported Friday. Although most likely not reflected in the March data, production delays due to shortages of components from Japanese manufacturers affected by the recent earthquake could begin to weigh on the data going forward. Anecdotal evidence from the auto sector suggests that production schedules could be curtailed and that some plants may need to be temporarily idled. To that end we will closely follow the weekly jobless claims data for any spike in manufacturing layoffs.
The trend in initial jobless claims over the past month has been heartening. As we have noted on numerous occasions, 400k on claims is a key level. In the past, payrolls did not turn significantly higher until this barrier was breached and at present the 4-week moving average on claims has registered sub-400k in four out of the past five weeks. This makes us confident that the underlying trend in the labor market is improving. With respect to our March employment report due this Friday, we are projecting a +200k increase in nonfarm payrolls and a +225k gain in private payrolls. We also think we could see substantial upward revisions to the
previous two months. Additionally, the ongoing decline in continuing claims tells us the unemployment rate should edge lower, down 0.1% to 8.8%. —BR
28 March 2011 Strategy Asia Equities Daily Focus
Deutsche Bank AG/Hong Kong Page 21
North America United States
25 March 2011
US Economics Weekly Staying strong on above trend growth
Economics
Table of Contents Overview.............................................................Page 2Above trend growth expected... .........................Page 4Calendar ..............................................................Page 8Contacts ..............................................................Page 9
Research Team
Joseph LaVorgna Economist (+1) 212 250-7329 [email protected]
Carl Riccadonna Economist (+1) 212 250-0186 [email protected]
Brett Ryan Research Analyst (+1) 212 250-6294 [email protected]
Forecasts
2010 2011Q3 Q4 Q1F Q2F Q3F Q4F
Real GDP (% q/ q)2.6 3.1 3.8 4.2 4.1 4.3
Final sales (% q/ q)0.9 6.7 2.0 3.6 4.0 4.8
Private consumption (% q/ q)2.4 4.0 2.5 3.3 3.3 3.5
Core CPI (% y/ y)0.9 0.6 1.0 1.3 1.6 2.1
Unemployment rate9.6 9.6 8.9 8.4 8.1 7.8
Fed funds0.20 0.20 0.20 0.20 0.20 0.50
Eco
no
mic
s
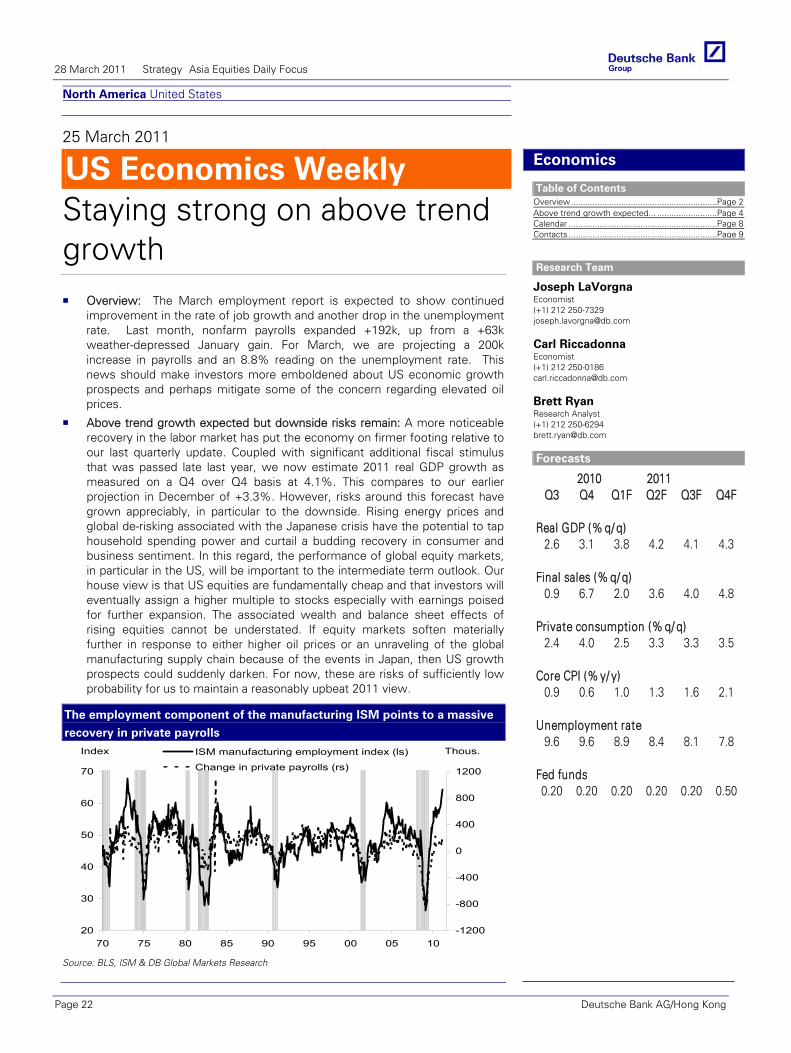
Overview: The March employment report is expected to show continued improvement in the rate of job growth and another drop in the unemployment rate. Last month, nonfarm payrolls expanded +192k, up from a +63k weather-depressed January gain. For March, we are projecting a 200k increase in payrolls and an 8.8% reading on the unemployment rate. This news should make investors more emboldened about US economic growth prospects and perhaps mitigate some of the concern regarding elevated oil prices.
Above trend growth expected but downside risks remain: A more noticeable recovery in the labor market has put the economy on firmer footing relative to our last quarterly update. Coupled with significant additional fiscal stimulus that was passed late last year, we now estimate 2011 real GDP growth as measured on a Q4 over Q4 basis at 4.1%. This compares to our earlier projection in December of +3.3%. However, risks around this forecast have grown appreciably, in particular to the downside. Rising energy prices and global de-risking associated with the Japanese crisis have the potential to tap household spending power and curtail a budding recovery in consumer and business sentiment. In this regard, the performance of global equity markets, in particular in the US, will be important to the intermediate term outlook. Our house view is that US equities are fundamentally cheap and that investors will eventually assign a higher multiple to stocks especially with earnings poised for further expansion. The associated wealth and balance sheet effects of rising equities cannot be understated. If equity markets soften materially further in response to either higher oil prices or an unraveling of the global manufacturing supply chain because of the events in Japan, then US growth prospects could suddenly darken. For now, these are risks of sufficiently low probability for us to maintain a reasonably upbeat 2011 view.
The employment component of the manufacturing ISM points to a massive
recovery in private payrolls
20
30
40
50
60
70
70 75 80 85 90 95 00 05 10
Index
-1200
-800
-400
0
400
800
1200
Thous.ISM manufacturing employment index (ls)
Change in private payrolls (rs)
Source: BLS, ISM & DB Global Markets Research
28 March 2011 Strategy Asia Equities Daily Focus
Page 22 Deutsche Bank AG/Hong Kong
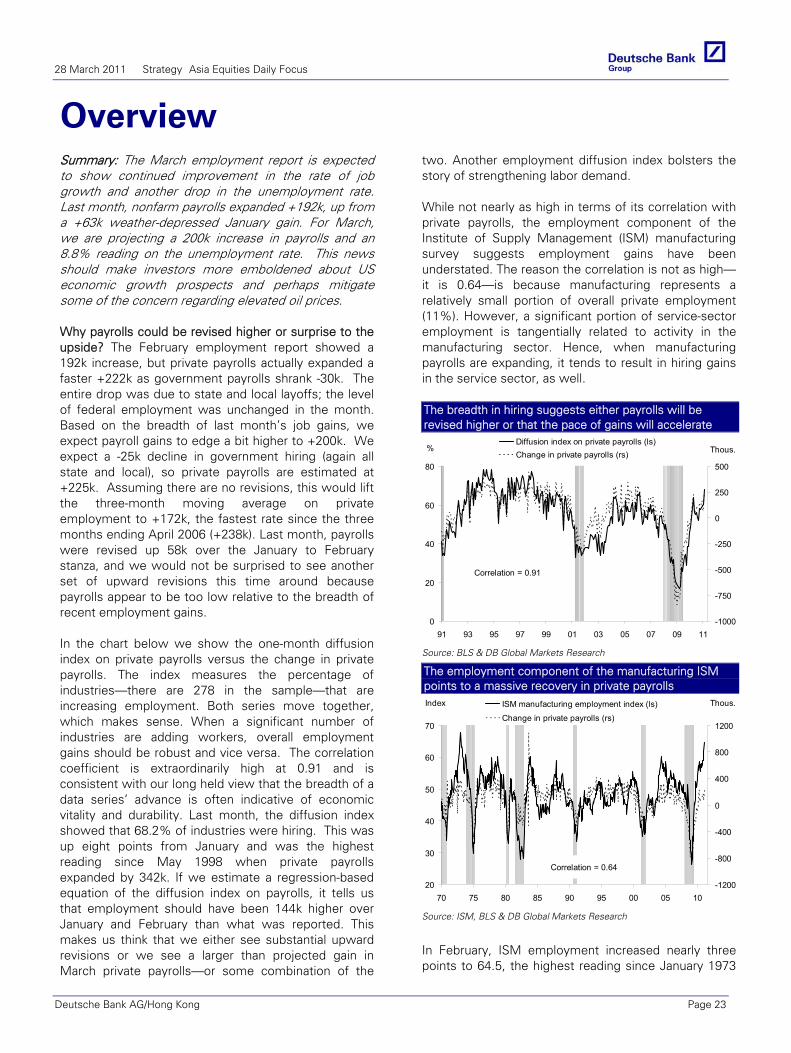
OverviewSummary: The March employment report is expected to show continued improvement in the rate of job growth and another drop in the unemployment rate. Last month, nonfarm payrolls expanded +192k, up from a +63k weather-depressed January gain. For March, we are projecting a 200k increase in payrolls and an 8.8% reading on the unemployment rate. This news should make investors more emboldened about US economic growth prospects and perhaps mitigate some of the concern regarding elevated oil prices. Why payrolls could be revised higher or surprise to the upside? The February employment report showed a 192k increase, but private payrolls actually expanded a faster +222k as government payrolls shrank -30k. The entire drop was due to state and local layoffs; the level of federal employment was unchanged in the month. Based on the breadth of last month’s job gains, we expect payroll gains to edge a bit higher to +200k. We expect a -25k decline in government hiring (again all state and local), so private payrolls are estimated at +225k. Assuming there are no revisions, this would lift the three-month moving average on private employment to +172k, the fastest rate since the three months ending April 2006 (+238k). Last month, payrolls were revised up 58k over the January to February stanza, and we would not be surprised to see another set of upward revisions this time around because payrolls appear to be too low relative to the breadth of recent employment gains. In the chart below we show the one-month diffusion index on private payrolls versus the change in private payrolls. The index measures the percentage of industries—there are 278 in the sample—that are increasing employment. Both series move together, which makes sense. When a significant number of industries are adding workers, overall employment gains should be robust and vice versa. The correlation coefficient is extraordinarily high at 0.91 and is consistent with our long held view that the breadth of a data series’ advance is often indicative of economic vitality and durability. Last month, the diffusion index showed that 68.2% of industries were hiring. This was up eight points from January and was the highest reading since May 1998 when private payrolls expanded by 342k. If we estimate a regression-based equation of the diffusion index on payrolls, it tells us that employment should have been 144k higher over January and February than what was reported. This makes us think that we either see substantial upward revisions or we see a larger than projected gain in March private payrolls—or some combination of the
two. Another employment diffusion index bolsters the story of strengthening labor demand. While not nearly as high in terms of its correlation with private payrolls, the employment component of the Institute of Supply Management (ISM) manufacturing survey suggests employment gains have been understated. The reason the correlation is not as high—it is 0.64—is because manufacturing represents a relatively small portion of overall private employment (11%). However, a significant portion of service-sector employment is tangentially related to activity in the manufacturing sector. Hence, when manufacturing payrolls are expanding, it tends to result in hiring gains in the service sector, as well. The breadth in hiring suggests either payrolls will be revised higher or that the pace of gains will accelerate
0
20
40
60
80
91 93 95 97 99 01 03 05 07 09 11
%
-1000
-750
-500
-250
0
250
500
Thous.Diffusion index on private payrolls (ls)Change in private payrolls (rs)
Correlation = 0.91
Source: BLS & DB Global Markets Research
The employment component of the manufacturing ISM points to a massive recovery in private payrolls
20
30
40
50
60
70
70 75 80 85 90 95 00 05 10
Index
-1200
-800
-400
0
400
800
1200
Thous.ISM manufacturing employment index (ls)
Change in private payrolls (rs)
Correlation = 0.64
Source: ISM, BLS & DB Global Markets Research
In February, ISM employment increased nearly three points to 64.5, the highest reading since January 1973
28 March 2011 Strategy Asia Equities Daily Focus
Deutsche Bank AG/Hong Kong Page 23
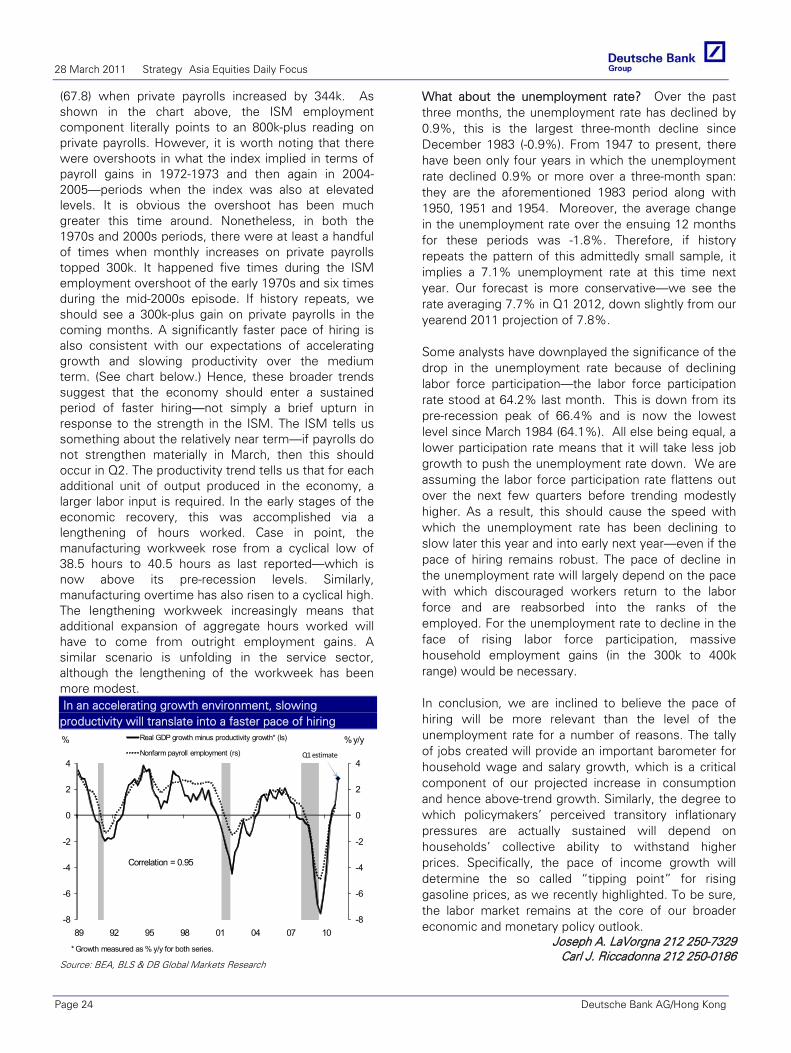
(67.8) when private payrolls increased by 344k. As shown in the chart above, the ISM employment component literally points to an 800k-plus reading on private payrolls. However, it is worth noting that there were overshoots in what the index implied in terms of payroll gains in 1972-1973 and then again in 2004-2005—periods when the index was also at elevated levels. It is obvious the overshoot has been much greater this time around. Nonetheless, in both the 1970s and 2000s periods, there were at least a handful of times when monthly increases on private payrolls topped 300k. It happened five times during the ISM employment overshoot of the early 1970s and six times during the mid-2000s episode. If history repeats, we should see a 300k-plus gain on private payrolls in the coming months. A significantly faster pace of hiring is also consistent with our expectations of accelerating growth and slowing productivity over the medium term. (See chart below.) Hence, these broader trends suggest that the economy should enter a sustained period of faster hiring—not simply a brief upturn in response to the strength in the ISM. The ISM tells us something about the relatively near term—if payrolls do not strengthen materially in March, then this should occur in Q2. The productivity trend tells us that for each additional unit of output produced in the economy, a larger labor input is required. In the early stages of the economic recovery, this was accomplished via a lengthening of hours worked. Case in point, the manufacturing workweek rose from a cyclical low of 38.5 hours to 40.5 hours as last reported—which is now above its pre-recession levels. Similarly, manufacturing overtime has also risen to a cyclical high. The lengthening workweek increasingly means that additional expansion of aggregate hours worked will have to come from outright employment gains. A similar scenario is unfolding in the service sector, although the lengthening of the workweek has been more modest. In an accelerating growth environment, slowing productivity will translate into a faster pace of hiring
-8
-6
-4
-2
0
2
4
-8
-6
-4
-2
0
2
4
89 92 95 98 01 04 07 10
% y/y% Real GDP growth minus productivity growth* (ls)
Nonfarm payroll employment (rs)
* Growth measured as % y/y for both series.
Correlation = 0.95
Q1 estimate
Source: BEA, BLS & DB Global Markets Research
What about the unemployment rate? Over the past three months, the unemployment rate has declined by 0.9%, this is the largest three-month decline since December 1983 (-0.9%). From 1947 to present, there have been only four years in which the unemployment rate declined 0.9% or more over a three-month span: they are the aforementioned 1983 period along with 1950, 1951 and 1954. Moreover, the average change in the unemployment rate over the ensuing 12 months for these periods was -1.8%. Therefore, if history repeats the pattern of this admittedly small sample, it implies a 7.1% unemployment rate at this time next year. Our forecast is more conservative—we see the rate averaging 7.7% in Q1 2012, down slightly from our yearend 2011 projection of 7.8%. Some analysts have downplayed the significance of the drop in the unemployment rate because of declining labor force participation—the labor force participation rate stood at 64.2% last month. This is down from its pre-recession peak of 66.4% and is now the lowest level since March 1984 (64.1%). All else being equal, a lower participation rate means that it will take less job growth to push the unemployment rate down. We are assuming the labor force participation rate flattens out over the next few quarters before trending modestly higher. As a result, this should cause the speed with which the unemployment rate has been declining to slow later this year and into early next year—even if the pace of hiring remains robust. The pace of decline in the unemployment rate will largely depend on the pace with which discouraged workers return to the labor force and are reabsorbed into the ranks of the employed. For the unemployment rate to decline in the face of rising labor force participation, massive household employment gains (in the 300k to 400k range) would be necessary. In conclusion, we are inclined to believe the pace of hiring will be more relevant than the level of the unemployment rate for a number of reasons. The tally of jobs created will provide an important barometer for household wage and salary growth, which is a critical component of our projected increase in consumption and hence above-trend growth. Similarly, the degree to which policymakers’ perceived transitory inflationary pressures are actually sustained will depend on households’ collective ability to withstand higher prices. Specifically, the pace of income growth will determine the so called “tipping point” for rising gasoline prices, as we recently highlighted. To be sure, the labor market remains at the core of our broader economic and monetary policy outlook.
Joseph A. LaVorgna 212 250-7329 Carl J. Riccadonna 212 250-0186
28 March 2011 Strategy Asia Equities Daily Focus
Page 24 Deutsche Bank AG/Hong Kong
Global
25 March 2011
Global Commodities DailyChina Macro Outlook Improves
Co
mm
od
itie
s
The Day Ahead
Time(EST) Country Event Previous Market View
03:00 Germany Gfk Consumer Conf. Survey (Apr) 6 5.8
05:00 Germany IFO - Business Climate (Mar) 111.2 110.5
08:30 US GDP QoQ (Annualized) (Q4) 2.8% 3%
08:30 US Personal Consumption (Q4) 4.1% 4.1%
09:55 US U. of Michigan Confidence (Mar) 68.2 68
Overview
Commodities rallied across the board in early trading supported by Chinese PMI and US dollar weakness. However, gains were surrendered after the US reported weaker than expected durable goods sales. HSBC’s manufacturing PMI for China rose to 52.5 in March, up from 51.7 in February. This is the first positive change in the macro environment over the past months. According to our China economics team, together with moderating inflation growth, these changes point to a lower risk of hard landing and reduced inflationary pressure. We believe an improving outlook for China is particularly beneficial for industrial metals complex.
Gold hit a fresh record high intraday, supported by heightened unrest in the Middle East-North Africa region, rising likelihood of Portuguese bailout and a renewed US dollar slump. Gold then moved lower with the rest of precious metals complex on profit taking.
China's State Council approved the country’s first coal emergency storage proposal. According to the China National Coal Association, the first batch of reserve has been set at five million tones. Storage will be assigned to ten large-scale coal mines and power companies, as well as eight coastal ports across the country. The aim of the emergency reserve plan is to improve energy safety and ease any short term supply pressure in the market. We believe this could provide additional support for the coal market.
The grains market was higher led by wheat. Wheat rose by 3.5% on the day amid reports of dryness in the US Plains and a constructive export sales report showing that China bought 116,000 metric tons of wheat from the US in the week ending March 17th. The purchase in and of itself as well as the large size was seen as a positive catalyst by the market given that China is not a frequent buyer of US wheat. Corn also benefited from the constructive wheat figure for China given the market’s fixation in recent weeks on the potential scale of China’s corn import needs. That said, this week’s US export sales data didn’t confirm China’s corn import needs.
Looking at today’s calendar, in Europe market will focus on Gfk consumer confidence survey and IFO business climate for Germany. In the US, the highlight today is Q4 annualised GDP with the market expecting 4.1%. Personal consumption and university of Michigan confidence will also be released.
Commodities & Global Markets
Commodities News In Brief
• EIA reported a gas storage draw of 6 bcf, below the 8 bcf consensus.
• China will raise resource taxes on rare earth minerals from April 1.The tax on mined light rare earths will rise to 60 Yuan per tonne, Ministry of Finance said.
• The Japan Copper and Brass Association said output of rolled copper products, which are used in items such as car parts, chips and utensils, will likely fall short of 70,000 tonnes in March.
• South Africa had corn stocks of 4.310 mn tonnes at the end of February, 19% more than a year earlier, the South African Grain Information Service said.
• Zambia exported 238,000 tonnes of corn to Southern African Development Community countries this year, Reuters reported, citing the state-run Food Reserve Agency.
Global Markets News In Brief
• Germany PMI Manufacturing decreased to 60.9 in Mar from 62.7 in Feb.
• Germany PMI Services rose to 60.1 in Mar from 58 in Feb.
• EU Manufacturing PMI dropped to 57.7in Mar vs 59 in Feb.
• EZ Flash Services PMI increased to 56.9 inMar vs 56.8 in Feb.
• US durable goods order for Feb fell 0.9% from 2.7% in Jan.
• US initial jobless claims for the week ending Mar 19 fell to 382K from 385K previously.
• Japan CPI YoY for Feb remained unchanged at 0%.
Event Risks
• China Leading Index 24-28 Mar
• US Dallas Fed Manf. Activity on 28 Mar
• China HSBC Manufacturing PMI Mar 31
• US Change in Nonfarm Payrolls on Apr 1
• US ISM Manufacturing on Apr 1
• USDA crop progress report on Apr 4
Research Team Soozhana Choi Xiao Fu Research Analyst Research Analyst (65) 6423 5261 (44) 20 7547 1558 [email protected] [email protected]
28 March 2011 Strategy Asia Equities Daily Focus
Deutsche Bank AG/Hong Kong Page 25
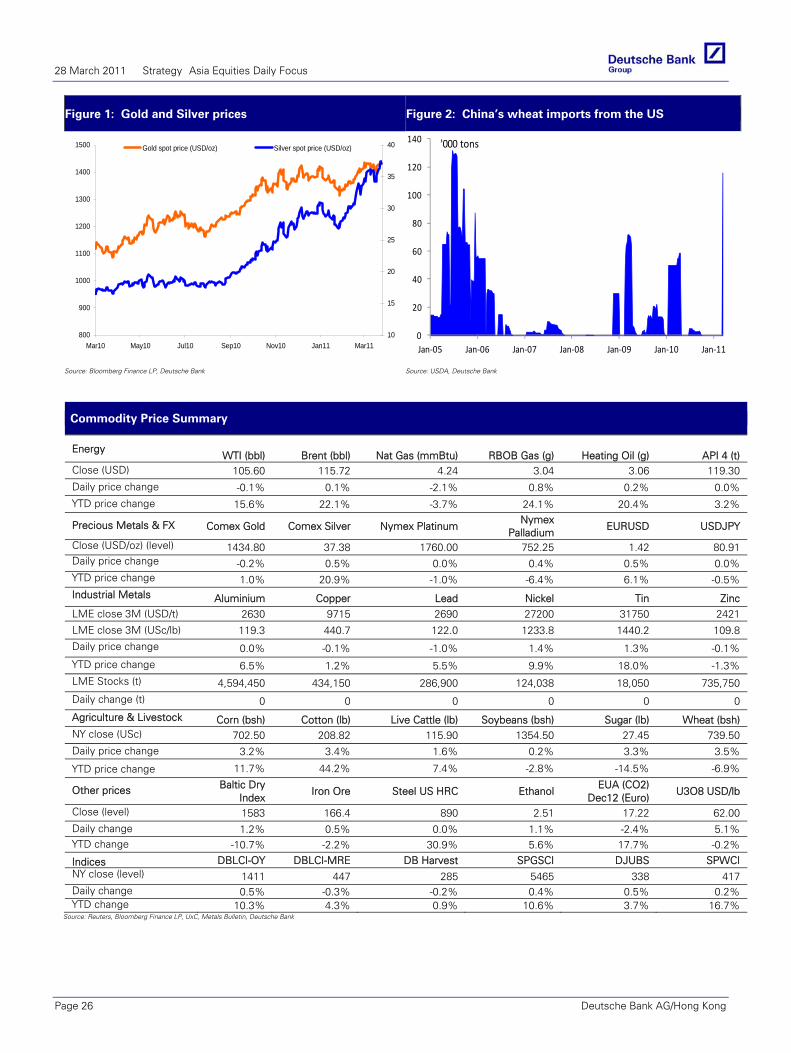
Figure 1: Gold and Silver prices Figure 2: China’s wheat imports from the US
800
900
1000
1100
1200
1300
1400
1500
Mar10 May10 Jul10 Sep10 Nov10 Jan11 Mar1110
15
20
25
30
35
40Gold spot price (USD/oz) Silver spot price (USD/oz)
0
20
40
60
80
100
120
140
Jan-05 Jan-06 Jan-07 Jan-08 Jan-09 Jan-10 Jan-11
'000 tons
Source: Bloomberg Finance LP, Deutsche Bank Source: USDA, Deutsche Bank
Commodity Price Summary
Energy WTI (bbl) Brent (bbl) Nat Gas (mmBtu) RBOB Gas (g) Heating Oil (g) API 4 (t)
Close (USD) 105.60 115.72 4.24 3.04 3.06 119.30 Daily price change -0.1% 0.1% -2.1% 0.8% 0.2% 0.0% YTD price change 15.6% 22.1% -3.7% 24.1% 20.4% 3.2%
Precious Metals & FX Comex Gold Comex Silver Nymex Platinum Nymex
Palladium EURUSD USDJPY
Close (USD/oz) (level) 1434.80 37.38 1760.00 752.25 1.42 80.91 Daily price change -0.2% 0.5% 0.0% 0.4% 0.5% 0.0% YTD price change 1.0% 20.9% -1.0% -6.4% 6.1% -0.5% Industrial Metals Aluminium Copper Lead Nickel Tin Zinc LME close 3M (USD/t) 2630 9715 2690 27200 31750 2421
LME close 3M (USc/lb) 119.3 440.7 122.0 1233.8 1440.2 109.8
Daily price change 0.0% -0.1% -1.0% 1.4% 1.3% -0.1%
YTD price change 6.5% 1.2% 5.5% 9.9% 18.0% -1.3% LME Stocks (t) 4,594,450 434,150 286,900 124,038 18,050 735,750
Daily change (t) 0 0 0 0 0 0
Agriculture & Livestock Corn (bsh) Cotton (lb) Live Cattle (lb) Soybeans (bsh) Sugar (lb) Wheat (bsh) NY close (USc) 702.50 208.82 115.90 1354.50 27.45 739.50 Daily price change 3.2% 3.4% 1.6% 0.2% 3.3% 3.5%
YTD price change 11.7% 44.2% 7.4% -2.8% -14.5% -6.9%
Other prices Baltic Dry Index
Iron Ore Steel US HRC Ethanol EUA (CO2)
Dec12 (Euro) U3O8 USD/lb
Close (level) 1583 166.4 890 2.51 17.22 62.00 Daily change 1.2% 0.5% 0.0% 1.1% -2.4% 5.1% YTD change -10.7% -2.2% 30.9% 5.6% 17.7% -0.2%
Indices DBLCI-OY DBLCI-MRE DB Harvest SPGSCI DJUBS SPWCI NY close (level) 1411 447 285 5465 338 417 Daily change 0.5% -0.3% -0.2% 0.4% 0.5% 0.2% YTD change 10.3% 4.3% 0.9% 10.6% 3.7% 16.7%
Source: Reuters, Bloomberg Finance LP, UxC, Metals Bulletin, Deutsche Bank
28 March 2011 Strategy Asia Equities Daily Focus
Page 26 Deutsche Bank AG/Hong Kong
Asia India
25 March 2011
India Economics Weekly Impact of monetary tightening on growth, weekly WPI update
Economics
Research Team
Taimur Baig, Ph.D Chief Economist (+65) 64238681 [email protected]
Kaushik Das Economist (+91) 22 6658-4909 [email protected]
Key forecasts Year ending 31 March FY09/10 FY10/11F FY11/12F FY12/13FReal GDP (YoY %) 7.5 8.5 8.5 8.5Consolidated fiscal deficit, % of GDP
-9.7 -7.7 -7.4 -6.8
WPI (YoY%) avg 3.6 9.2 7.5 6.8WPI (YoY%) eop 10.2 8.0 6.3 7.1Current account balance, % of GDP
-2.9 -2.9 -3.0 -3.0
2009 2010F 2011F 2012FTrade balance, % of GDP -8.6 -8.7 -8.7 -8.4Current account balance, % of GDP
-2.2 -2.6 -3.0 -3.0
INR/USD, eop 46.7 44.8 43.5 42.5
Source: CEIC, Deutsche Bank
Impact of monetary tightening on growth. The RBI has raised policy rates a total of eight times since March 2010, pushing up the reverse repo and repo rates to 5.75% and 6.75% from a record low of 3.25% and 4.75% respectively. The rate increases have been accompanied by 1% hike in cash reserve ratio and an additional effective tightening of interest rates by 150bps due to the overnight call money rate moving to the upper end of the LAF corridor (repo rate) from the reverse repo mode on account of tight liquidity conditions in the money market.
It may appear at first glance that monetary policy tightening has been substantial and growth is bound to be impacted as a result. But this observation is caused by an analytical confusion of comparing nominal interest rate with real growth. An analysis of real interest rate, measured as Repo rate – WPI inflation, reveals that policy tightening was generally mild in the previous cycle (barring a small period) and has been even milder in this cycle relative to inflation trends. An economy with growth potential of 8-9% can hardly be expected to slow down in response to negative or barely positive real interest rates.
RBI has tended to raise rates gradually in the past (with the exception of a short-lived period in 2008), which has ended up diluting the impact on the Indian economy which has strong underlying demand. We believe that in this cycle rates have yet again been raised too gradually to have a major impact on growth (or inflation) in the near term. The ongoing slowdown in industrial production growth likely reflects a variety of other factors, including base effect, structural and regulatory bottlenecks to capital spending, and capacity constraints. Demand remains robust, in our view, given the trend in lending, wage growth, and PMI (both manufacturing and services). Hence our 8.5% growth forecast for FY11/12 remains unchanged for the time being. Rising real rates and the risk of demand destruction due to persistently high inflation are clear negatives for the growth outlook, but conditions need to tighten considerably more before we would feel the need to revise our growth forecast.
Weekly WPI inflation update (12th March). The sizable moderation in primary articles and food inflation, witnessed in February seems to have reversed in March, with signs of price pressures building up once again. In the present week, food inflation rose modestly (+0.4%wow) but non-food articles witnessed a sharp price spike (+3.3%wow), resulting in a +1%wow rise in primary articles inflation. The latest weekly inflation trend suggests a possible risk of March WPI inflation to be higher than the RBI’s end-March target of 8.0%, unless food and primary articles inflation drop sharply in the remaining two weeks of March. Inflation will remain elevated in March mainly on account of sharp rise in prices of non-administered fuel items, in the early part of the month.
Our recent publications on India 2011Living with 100 dollar oil 21-Jan
2010Debt and deficit of India's states 16-Nov
RBI hikes, signals a (temporary) pause 2-Nov
Fiscal impact of the Food Security Act 28-Oct
Rupee and capital controls 21-Oct
India's heterogeneous states 21-Sep
India's food prices: high and sticky 31-Aug
India's population dynamic 13-Jul
Fuel price reform: a potential game changer 28-Jun
Food subsidies: a new fiscal risk 29-Apr
India's changing trade dynamic 12-Apr
India's Budget review 26-Feb
Implementing the GST 28-Jan
2009Privatization outlook 23-Dec
India's debt problem 17-Dec
Surging food prices: drivers & implications 10-Dec
Asian EM currencies: still tied to the Dollar 20-Nov
Assessing monetary stance in India 9-Oct
Education and the private sector 7-Oct
28 March 2011 Strategy Asia Equities Daily Focus
Deutsche Bank AG/Hong Kong Page 27
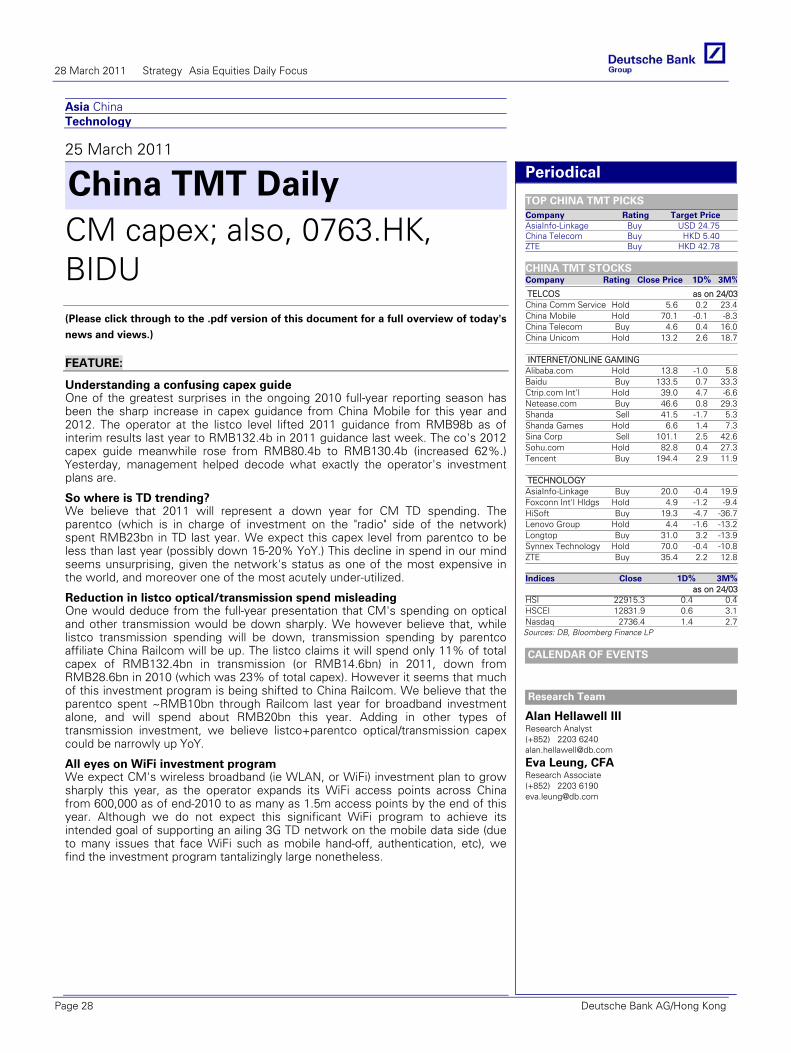
Asia China Technology
25 March 2011
China TMT Daily CM capex; also, 0763.HK, BIDU
(Please click through to the .pdf version of this document for a full overview of today's
news and views.)
Periodical
TOP CHINA TMT PICKS Company Rating Target Price AsiaInfo-Linkage Buy USD 24.75 China Telecom Buy HKD 5.40 ZTE Buy HKD 42.78
CHINA TMT STOCKS Company Rating Close Price 1D% 3M%
TELCOS as on 24/03China Comm Service Hold 5.6 0.2 23.4China Mobile Hold 70.1 -0.1 -8.3China Telecom Buy 4.6 0.4 16.0China Unicom Hold 13.2 2.6 18.7 INTERNET/ONLINE GAMING Alibaba.com Hold 13.8 -1.0 5.8Baidu Buy 133.5 0.7 33.3Ctrip.com Int'l Hold 39.0 4.7 -6.6Netease.com Buy 46.6 0.8 29.3Shanda Sell 41.5 -1.7 5.3Shanda Games Hold 6.6 1.4 7.3Sina Corp Sell 101.1 2.5 42.6Sohu.com Hold 82.8 0.4 27.3Tencent Buy 194.4 2.9 11.9 TECHNOLOGY AsiaInfo-Linkage Buy 20.0 -0.4 19.9Foxconn Int'l Hldgs Hold 4.9 -1.2 -9.4HiSoft Buy 19.3 -4.7 -36.7Lenovo Group Hold 4.4 -1.6 -13.2Longtop Buy 31.0 3.2 -13.9Synnex Technology Hold 70.0 -0.4 -10.8ZTE Buy 35.4 2.2 12.8 Indices Close 1D% 3M% as on 24/03HSI 22915.3 0.4 0.4HSCEI 12831.9 0.6 3.1Nasdaq 2736.4 1.4 2.7Sources: DB, Bloomberg Finance LP
CALENDAR OF EVENTS
Research Team
Alan Hellawell III Research Analyst (+852) 2203 6240 [email protected]
Eva Leung, CFA Research Associate (+852) 2203 6190 [email protected]
FEATURE:
Understanding a confusing capex guide One of the greatest surprises in the ongoing 2010 full-year reporting season has been the sharp increase in capex guidance from China Mobile for this year and 2012. The operator at the listco level lifted 2011 guidance from RMB98b as of interim results last year to RMB132.4b in 2011 guidance last week. The co's 2012 capex guide meanwhile rose from RMB80.4b to RMB130.4b (increased 62%.) Yesterday, management helped decode what exactly the operator's investment plans are.
So where is TD trending? We believe that 2011 will represent a down year for CM TD spending. The parentco (which is in charge of investment on the "radio" side of the network) spent RMB23bn in TD last year. We expect this capex level from parentco to be less than last year (possibly down 15-20% YoY.) This decline in spend in our mind seems unsurprising, given the network's status as one of the most expensive in the world, and moreover one of the most acutely under-utilized.
Reduction in listco optical/transmission spend misleading One would deduce from the full-year presentation that CM's spending on optical and other transmission would be down sharply. We however believe that, while listco transmission spending will be down, transmission spending by parentco affiliate China Railcom will be up. The listco claims it will spend only 11% of total capex of RMB132.4bn in transmission (or RMB14.6bn) in 2011, down from RMB28.6bn in 2010 (which was 23% of total capex). However it seems that much of this investment program is being shifted to China Railcom. We believe that the parentco spent ~RMB10bn through Railcom last year for broadband investment alone, and will spend about RMB20bn this year. Adding in other types of transmission investment, we believe listco+parentco optical/transmission capex could be narrowly up YoY.
All eyes on WiFi investment program We expect CM's wireless broadband (ie WLAN, or WiFi) investment plan to grow sharply this year, as the operator expands its WiFi access points across China from 600,000 as of end-2010 to as many as 1.5m access points by the end of this year. Although we do not expect this significant WiFi program to achieve its intended goal of supporting an ailing 3G TD network on the mobile data side (due to many issues that face WiFi such as mobile hand-off, authentication, etc), we find the investment program tantalizingly large nonetheless.
28 March 2011 Strategy Asia Equities Daily Focus
Page 28 Deutsche Bank AG/Hong Kong
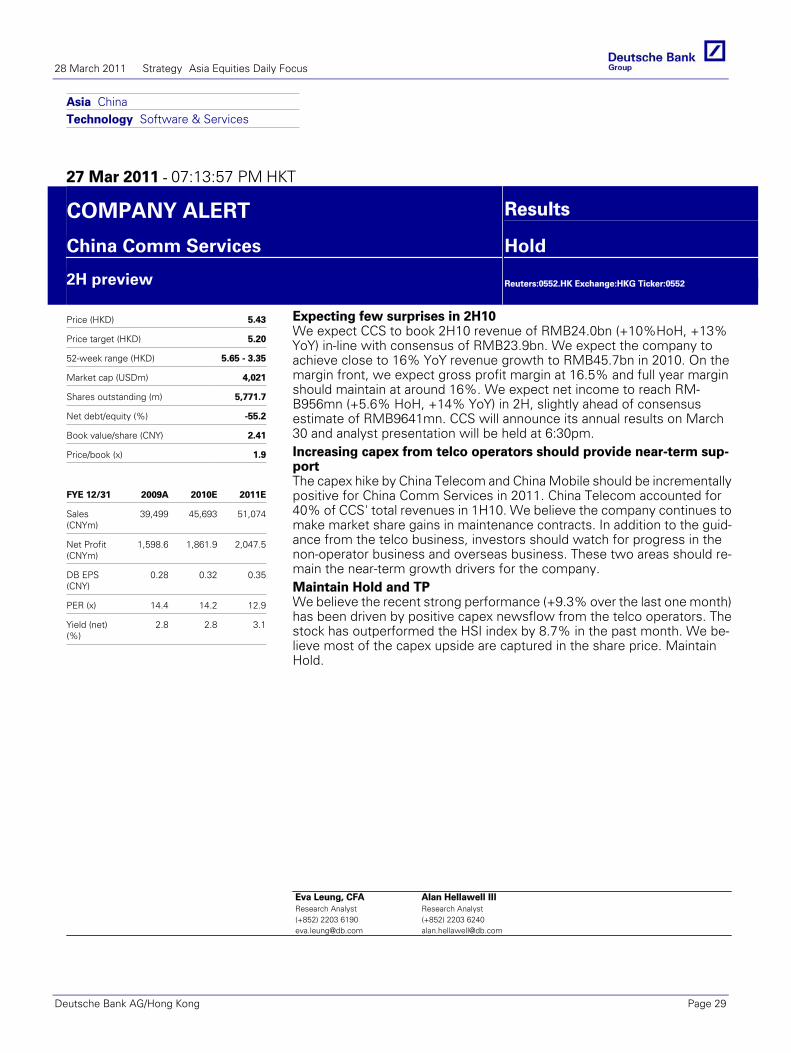
Asia ChinaTechnology Software & Services
27 Mar 2011 - 07:13:57 PM HKT
COMPANY ALERT Results
China Comm Services Hold
2H preview
Reuters:0552.HK Exchange:HKG Ticker:0552
Price (HKD) 5.43
Price target (HKD) 5.20
52-week range (HKD) 5.65 - 3.35
Market cap (USDm) 4,021
Shares outstanding (m) 5,771.7
Net debt/equity (%) -55.2
Book value/share (CNY) 2.41
Price/book (x) 1.9
FYE 12/31 2009A 2010E 2011E
Sales(CNYm)
39,499 45,693 51,074
Net Profit(CNYm)
1,598.6 1,861.9 2,047.5
DB EPS(CNY)
0.28 0.32 0.35
PER (x) 14.4 14.2 12.9
Yield (net)(%)
2.8 2.8 3.1
Expecting few surprises in 2H10We expect CCS to book 2H10 revenue of RMB24.0bn (+10%HoH, +13%YoY) in-line with consensus of RMB23.9bn. We expect the company toachieve close to 16% YoY revenue growth to RMB45.7bn in 2010. On themargin front, we expect gross profit margin at 16.5% and full year marginshould maintain at around 16%. We expect net income to reach RM-B956mn (+5.6% HoH, +14% YoY) in 2H, slightly ahead of consensusestimate of RMB9641mn. CCS will announce its annual results on March30 and analyst presentation will be held at 6:30pm.Increasing capex from telco operators should provide near-term sup-portThe capex hike by China Telecom and China Mobile should be incrementallypositive for China Comm Services in 2011. China Telecom accounted for40% of CCS' total revenues in 1H10. We believe the company continues tomake market share gains in maintenance contracts. In addition to the guid-ance from the telco business, investors should watch for progress in thenon-operator business and overseas business. These two areas should re-main the near-term growth drivers for the company.Maintain Hold and TPWe believe the recent strong performance (+9.3% over the last one month)has been driven by positive capex newsflow from the telco operators. Thestock has outperformed the HSI index by 8.7% in the past month. We be-lieve most of the capex upside are captured in the share price. MaintainHold.
Eva Leung, CFAResearch Analyst(+852) 2203 [email protected]
Alan Hellawell IIIResearch Analyst(+852) 2203 [email protected]
28 March 2011 Strategy Asia Equities Daily Focus
Deutsche Bank AG/Hong Kong Page 29
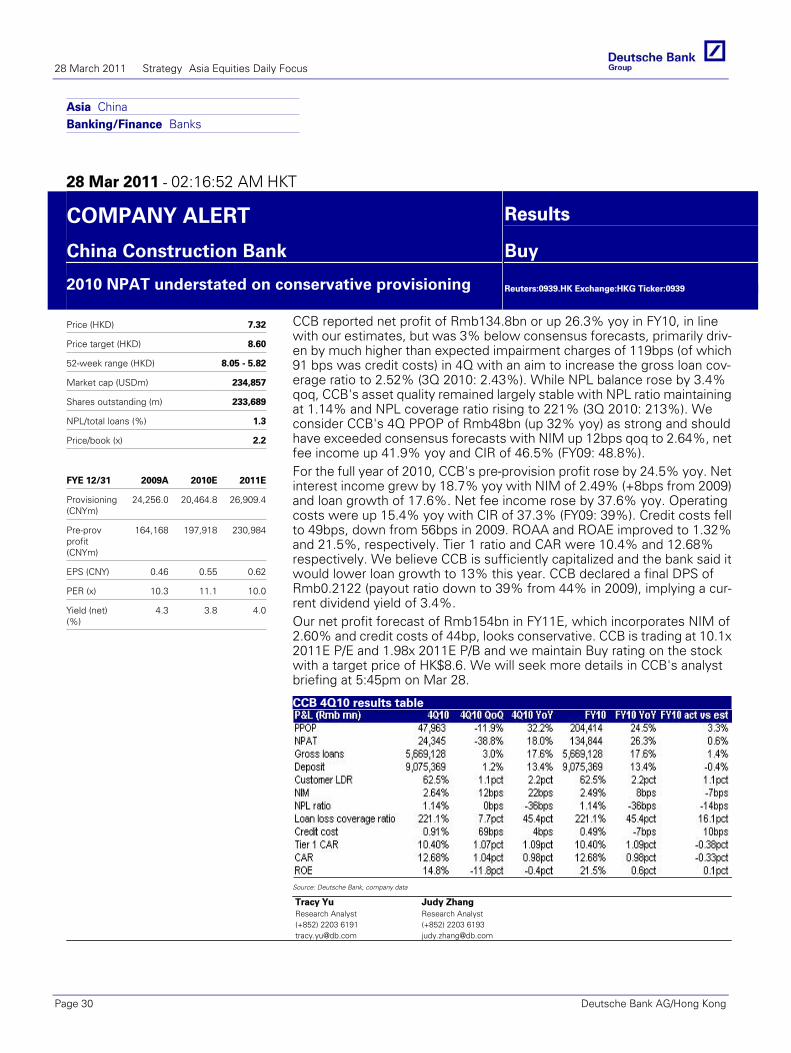
Asia ChinaBanking/Finance Banks
28 Mar 2011 - 02:16:52 AM HKT
COMPANY ALERT Results
China Construction Bank Buy
2010 NPAT understated on conservative provisioning
Reuters:0939.HK Exchange:HKG Ticker:0939
Price (HKD) 7.32
Price target (HKD) 8.60
52-week range (HKD) 8.05 - 5.82
Market cap (USDm) 234,857
Shares outstanding (m) 233,689
NPL/total loans (%) 1.3
Price/book (x) 2.2
FYE 12/31 2009A 2010E 2011E
Provisioning(CNYm)
24,256.0 20,464.8 26,909.4
Pre-provprofit(CNYm)
164,168 197,918 230,984
EPS (CNY) 0.46 0.55 0.62
PER (x) 10.3 11.1 10.0
Yield (net)(%)
4.3 3.8 4.0
CCB reported net profit of Rmb134.8bn or up 26.3% yoy in FY10, in linewith our estimates, but was 3% below consensus forecasts, primarily driv-en by much higher than expected impairment charges of 119bps (of which91 bps was credit costs) in 4Q with an aim to increase the gross loan cov-erage ratio to 2.52% (3Q 2010: 2.43%). While NPL balance rose by 3.4%qoq, CCB's asset quality remained largely stable with NPL ratio maintainingat 1.14% and NPL coverage ratio rising to 221% (3Q 2010: 213%). Weconsider CCB's 4Q PPOP of Rmb48bn (up 32% yoy) as strong and shouldhave exceeded consensus forecasts with NIM up 12bps qoq to 2.64%, netfee income up 41.9% yoy and CIR of 46.5% (FY09: 48.8%).For the full year of 2010, CCB's pre-provision profit rose by 24.5% yoy. Netinterest income grew by 18.7% yoy with NIM of 2.49% (+8bps from 2009)and loan growth of 17.6%. Net fee income rose by 37.6% yoy. Operatingcosts were up 15.4% yoy with CIR of 37.3% (FY09: 39%). Credit costs fellto 49bps, down from 56bps in 2009. ROAA and ROAE improved to 1.32%and 21.5%, respectively. Tier 1 ratio and CAR were 10.4% and 12.68%respectively. We believe CCB is sufficiently capitalized and the bank said itwould lower loan growth to 13% this year. CCB declared a final DPS ofRmb0.2122 (payout ratio down to 39% from 44% in 2009), implying a cur-rent dividend yield of 3.4%.Our net profit forecast of Rmb154bn in FY11E, which incorporates NIM of2.60% and credit costs of 44bp, looks conservative. CCB is trading at 10.1x2011E P/E and 1.98x 2011E P/B and we maintain Buy rating on the stockwith a target price of HK$8.6. We will seek more details in CCB's analystbriefing at 5:45pm on Mar 28.
CCB 4Q10 results table
Source: Deutsche Bank, company data
Tracy YuResearch Analyst(+852) 2203 [email protected]
Judy ZhangResearch Analyst(+852) 2203 [email protected]
28 March 2011 Strategy Asia Equities Daily Focus
Page 30 Deutsche Bank AG/Hong Kong
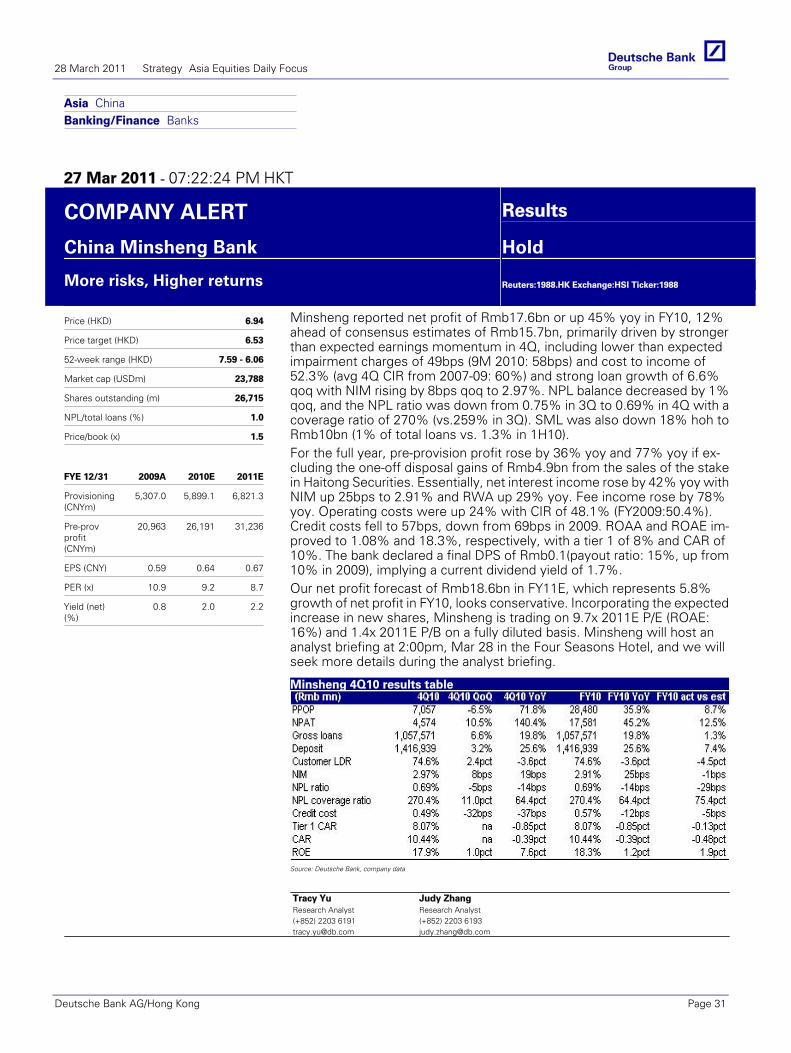
Asia ChinaBanking/Finance Banks
27 Mar 2011 - 07:22:24 PM HKT
COMPANY ALERT Results
China Minsheng Bank Hold
More risks, Higher returns
Reuters:1988.HK Exchange:HSI Ticker:1988
Price (HKD) 6.94
Price target (HKD) 6.53
52-week range (HKD) 7.59 - 6.06
Market cap (USDm) 23,788
Shares outstanding (m) 26,715
NPL/total loans (%) 1.0
Price/book (x) 1.5
FYE 12/31 2009A 2010E 2011E
Provisioning(CNYm)
5,307.0 5,899.1 6,821.3
Pre-provprofit(CNYm)
20,963 26,191 31,236
EPS (CNY) 0.59 0.64 0.67
PER (x) 10.9 9.2 8.7
Yield (net)(%)
0.8 2.0 2.2
Minsheng reported net profit of Rmb17.6bn or up 45% yoy in FY10, 12%ahead of consensus estimates of Rmb15.7bn, primarily driven by strongerthan expected earnings momentum in 4Q, including lower than expectedimpairment charges of 49bps (9M 2010: 58bps) and cost to income of52.3% (avg 4Q CIR from 2007-09: 60%) and strong loan growth of 6.6%qoq with NIM rising by 8bps qoq to 2.97%. NPL balance decreased by 1%qoq, and the NPL ratio was down from 0.75% in 3Q to 0.69% in 4Q with acoverage ratio of 270% (vs.259% in 3Q). SML was also down 18% hoh toRmb10bn (1% of total loans vs. 1.3% in 1H10).For the full year, pre-provision profit rose by 36% yoy and 77% yoy if ex-cluding the one-off disposal gains of Rmb4.9bn from the sales of the stakein Haitong Securities. Essentially, net interest income rose by 42% yoy withNIM up 25bps to 2.91% and RWA up 29% yoy. Fee income rose by 78%yoy. Operating costs were up 24% with CIR of 48.1% (FY2009:50.4%).Credit costs fell to 57bps, down from 69bps in 2009. ROAA and ROAE im-proved to 1.08% and 18.3%, respectively, with a tier 1 of 8% and CAR of10%. The bank declared a final DPS of Rmb0.1(payout ratio: 15%, up from10% in 2009), implying a current dividend yield of 1.7%.Our net profit forecast of Rmb18.6bn in FY11E, which represents 5.8%growth of net profit in FY10, looks conservative. Incorporating the expectedincrease in new shares, Minsheng is trading on 9.7x 2011E P/E (ROAE:16%) and 1.4x 2011E P/B on a fully diluted basis. Minsheng will host ananalyst briefing at 2:00pm, Mar 28 in the Four Seasons Hotel, and we willseek more details during the analyst briefing.
Minsheng 4Q10 results table
Source: Deutsche Bank, company data
Tracy YuResearch Analyst(+852) 2203 [email protected]
Judy ZhangResearch Analyst(+852) 2203 [email protected]
28 March 2011 Strategy Asia Equities Daily Focus
Deutsche Bank AG/Hong Kong Page 31
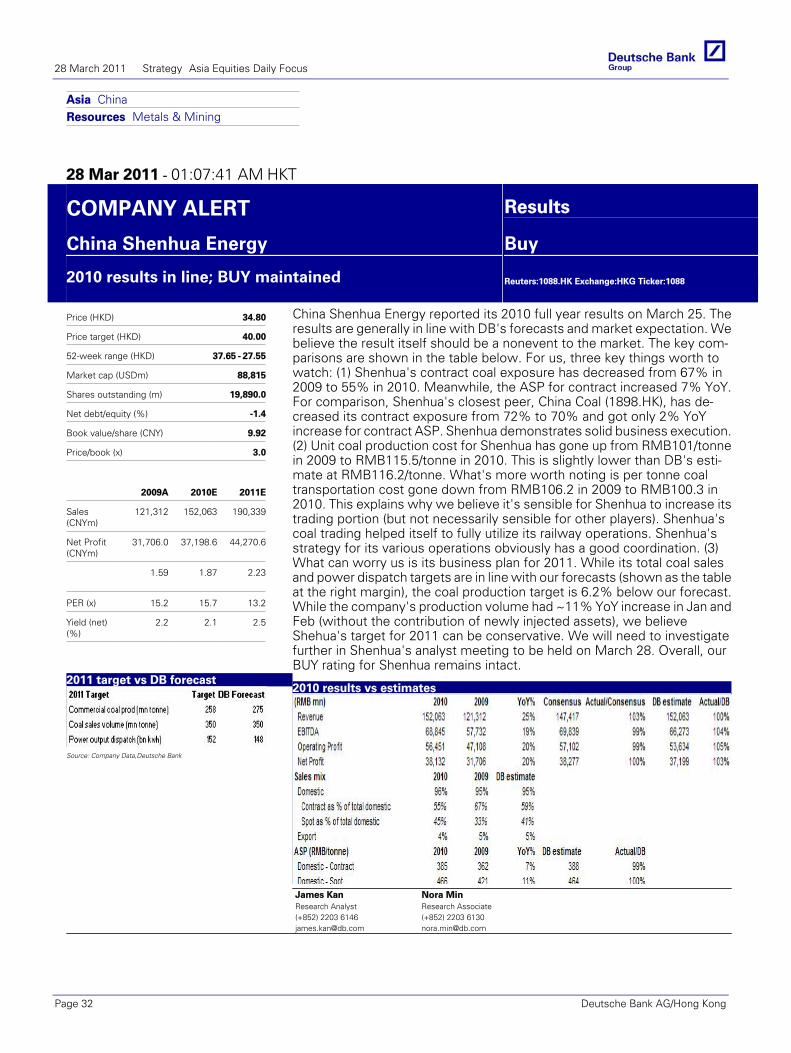
Asia ChinaResources Metals & Mining
28 Mar 2011 - 01:07:41 AM HKT
COMPANY ALERT Results
China Shenhua Energy Buy
2010 results in line; BUY maintained
Reuters:1088.HK Exchange:HKG Ticker:1088
Price (HKD) 34.80
Price target (HKD) 40.00
52-week range (HKD) 37.65 - 27.55
Market cap (USDm) 88,815
Shares outstanding (m) 19,890.0
Net debt/equity (%) -1.4
Book value/share (CNY) 9.92
Price/book (x) 3.0
FYE 12/31 2009A 2010E 2011E
Sales(CNYm)
121,312 152,063 190,339
Net Profit(CNYm)
31,706.0 37,198.6 44,270.6
DB EPS(CNY)
1.59 1.87 2.23
PER (x) 15.2 15.7 13.2
Yield (net)(%)
2.2 2.1 2.5
2011 target vs DB forecast
Source: Company Data,Deutsche Bank
China Shenhua Energy reported its 2010 full year results on March 25. Theresults are generally in line with DB's forecasts and market expectation. Webelieve the result itself should be a nonevent to the market. The key com-parisons are shown in the table below. For us, three key things worth towatch: (1) Shenhua's contract coal exposure has decreased from 67% in2009 to 55% in 2010. Meanwhile, the ASP for contract increased 7% YoY.For comparison, Shenhua's closest peer, China Coal (1898.HK), has de-creased its contract exposure from 72% to 70% and got only 2% YoYincrease for contract ASP. Shenhua demonstrates solid business execution.(2) Unit coal production cost for Shenhua has gone up from RMB101/tonnein 2009 to RMB115.5/tonne in 2010. This is slightly lower than DB's esti-mate at RMB116.2/tonne. What's more worth noting is per tonne coaltransportation cost gone down from RMB106.2 in 2009 to RMB100.3 in2010. This explains why we believe it's sensible for Shenhua to increase itstrading portion (but not necessarily sensible for other players). Shenhua'scoal trading helped itself to fully utilize its railway operations. Shenhua'sstrategy for its various operations obviously has a good coordination. (3)What can worry us is its business plan for 2011. While its total coal salesand power dispatch targets are in line with our forecasts (shown as the tableat the right margin), the coal production target is 6.2% below our forecast.While the company's production volume had ~11% YoY increase in Jan andFeb (without the contribution of newly injected assets), we believeShehua's target for 2011 can be conservative. We will need to investigatefurther in Shenhua's analyst meeting to be held on March 28. Overall, ourBUY rating for Shenhua remains intact.
2010 results vs estimates
Source: Company Data,Deutsche Bank, Bloomberg ConsensusJames KanResearch Analyst(+852) 2203 [email protected]
Nora MinResearch Associate(+852) 2203 [email protected]
28 March 2011 Strategy Asia Equities Daily Focus
Page 32 Deutsche Bank AG/Hong Kong
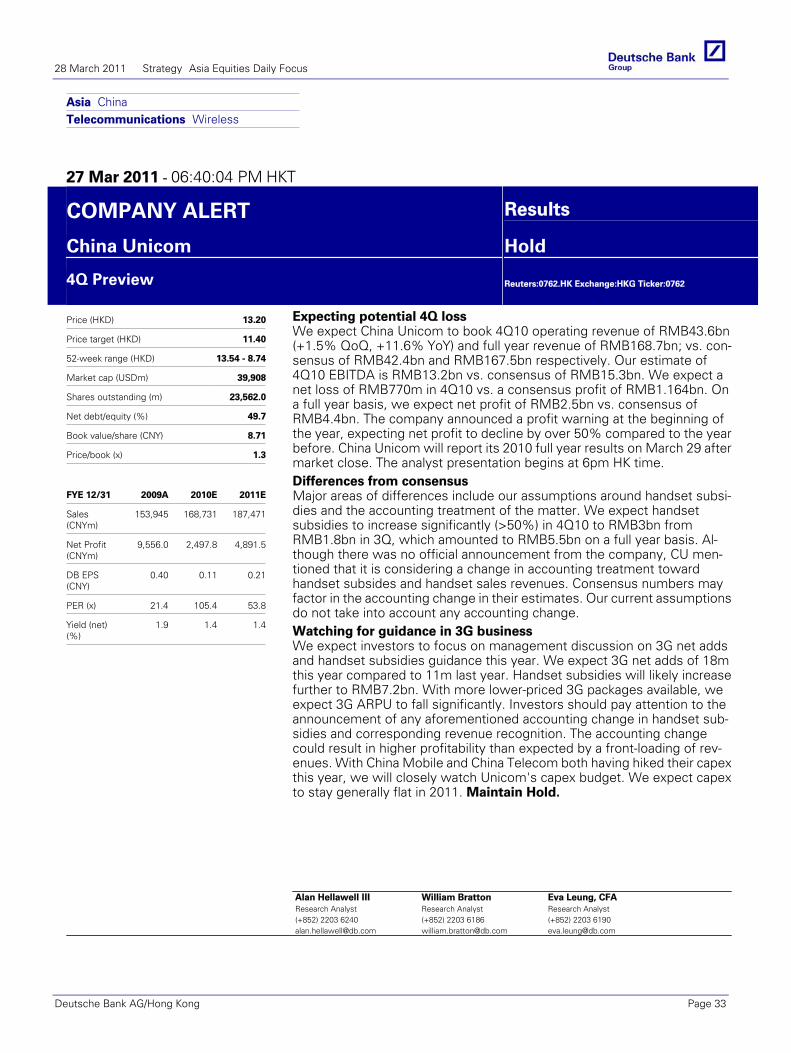
Asia ChinaTelecommunications Wireless
27 Mar 2011 - 06:40:04 PM HKT
COMPANY ALERT Results
China Unicom Hold
4Q Preview
Reuters:0762.HK Exchange:HKG Ticker:0762
Price (HKD) 13.20
Price target (HKD) 11.40
52-week range (HKD) 13.54 - 8.74
Market cap (USDm) 39,908
Shares outstanding (m) 23,562.0
Net debt/equity (%) 49.7
Book value/share (CNY) 8.71
Price/book (x) 1.3
FYE 12/31 2009A 2010E 2011E
Sales(CNYm)
153,945 168,731 187,471
Net Profit(CNYm)
9,556.0 2,497.8 4,891.5
DB EPS(CNY)
0.40 0.11 0.21
PER (x) 21.4 105.4 53.8
Yield (net)(%)
1.9 1.4 1.4
Expecting potential 4Q lossWe expect China Unicom to book 4Q10 operating revenue of RMB43.6bn(+1.5% QoQ, +11.6% YoY) and full year revenue of RMB168.7bn; vs. con-sensus of RMB42.4bn and RMB167.5bn respectively. Our estimate of4Q10 EBITDA is RMB13.2bn vs. consensus of RMB15.3bn. We expect anet loss of RMB770m in 4Q10 vs. a consensus profit of RMB1.164bn. Ona full year basis, we expect net profit of RMB2.5bn vs. consensus ofRMB4.4bn. The company announced a profit warning at the beginning ofthe year, expecting net profit to decline by over 50% compared to the yearbefore. China Unicom will report its 2010 full year results on March 29 aftermarket close. The analyst presentation begins at 6pm HK time.Differences from consensusMajor areas of differences include our assumptions around handset subsi-dies and the accounting treatment of the matter. We expect handsetsubsidies to increase significantly (>50%) in 4Q10 to RMB3bn fromRMB1.8bn in 3Q, which amounted to RMB5.5bn on a full year basis. Al-though there was no official announcement from the company, CU men-tioned that it is considering a change in accounting treatment towardhandset subsides and handset sales revenues. Consensus numbers mayfactor in the accounting change in their estimates. Our current assumptionsdo not take into account any accounting change.Watching for guidance in 3G businessWe expect investors to focus on management discussion on 3G net addsand handset subsidies guidance this year. We expect 3G net adds of 18mthis year compared to 11m last year. Handset subsidies will likely increasefurther to RMB7.2bn. With more lower-priced 3G packages available, weexpect 3G ARPU to fall significantly. Investors should pay attention to theannouncement of any aforementioned accounting change in handset sub-sidies and corresponding revenue recognition. The accounting changecould result in higher profitability than expected by a front-loading of rev-enues. With China Mobile and China Telecom both having hiked their capexthis year, we will closely watch Unicom's capex budget. We expect capexto stay generally flat in 2011. Maintain Hold.
Alan Hellawell IIIResearch Analyst(+852) 2203 [email protected]
William BrattonResearch Analyst(+852) 2203 [email protected]
Eva Leung, CFAResearch Analyst(+852) 2203 [email protected]
28 March 2011 Strategy Asia Equities Daily Focus
Deutsche Bank AG/Hong Kong Page 33
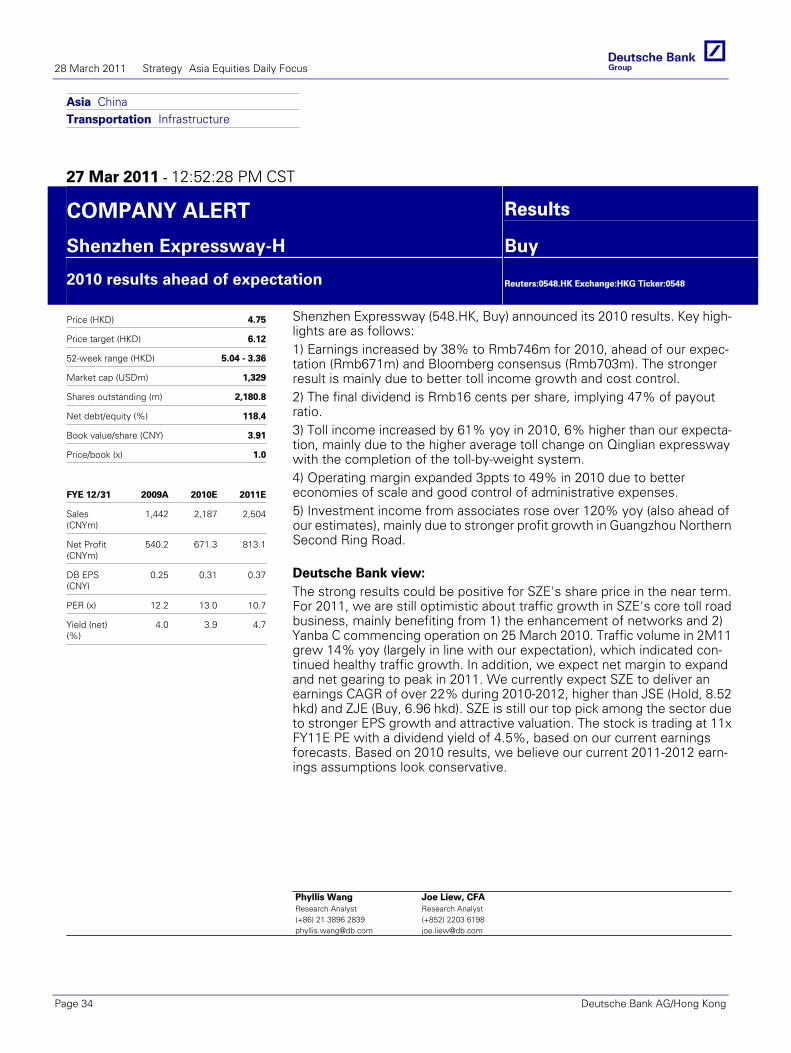
Asia ChinaTransportation Infrastructure
27 Mar 2011 - 12:52:28 PM CST
COMPANY ALERT Results
Shenzhen Expressway-H Buy
2010 results ahead of expectation
Reuters:0548.HK Exchange:HKG Ticker:0548
Price (HKD) 4.75
Price target (HKD) 6.12
52-week range (HKD) 5.04 - 3.36
Market cap (USDm) 1,329
Shares outstanding (m) 2,180.8
Net debt/equity (%) 118.4
Book value/share (CNY) 3.91
Price/book (x) 1.0
FYE 12/31 2009A 2010E 2011E
Sales(CNYm)
1,442 2,187 2,504
Net Profit(CNYm)
540.2 671.3 813.1
DB EPS(CNY)
0.25 0.31 0.37
PER (x) 12.2 13.0 10.7
Yield (net)(%)
4.0 3.9 4.7
Shenzhen Expressway (548.HK, Buy) announced its 2010 results. Key high-lights are as follows:1) Earnings increased by 38% to Rmb746m for 2010, ahead of our expec-tation (Rmb671m) and Bloomberg consensus (Rmb703m). The strongerresult is mainly due to better toll income growth and cost control.2) The final dividend is Rmb16 cents per share, implying 47% of payoutratio.3) Toll income increased by 61% yoy in 2010, 6% higher than our expecta-tion, mainly due to the higher average toll change on Qinglian expresswaywith the completion of the toll-by-weight system.4) Operating margin expanded 3ppts to 49% in 2010 due to bettereconomies of scale and good control of administrative expenses.5) Investment income from associates rose over 120% yoy (also ahead ofour estimates), mainly due to stronger profit growth in Guangzhou NorthernSecond Ring Road.
Deutsche Bank view:The strong results could be positive for SZE's share price in the near term.For 2011, we are still optimistic about traffic growth in SZE's core toll roadbusiness, mainly benefiting from 1) the enhancement of networks and 2)Yanba C commencing operation on 25 March 2010. Traffic volume in 2M11grew 14% yoy (largely in line with our expectation), which indicated con-tinued healthy traffic growth. In addition, we expect net margin to expandand net gearing to peak in 2011. We currently expect SZE to deliver anearnings CAGR of over 22% during 2010-2012, higher than JSE (Hold, 8.52hkd) and ZJE (Buy, 6.96 hkd). SZE is still our top pick among the sector dueto stronger EPS growth and attractive valuation. The stock is trading at 11xFY11E PE with a dividend yield of 4.5%, based on our current earningsforecasts. Based on 2010 results, we believe our current 2011-2012 earn-ings assumptions look conservative.
Phyllis WangResearch Analyst(+86) 21 3896 [email protected]
Joe Liew, CFAResearch Analyst(+852) 2203 [email protected]
28 March 2011 Strategy Asia Equities Daily Focus
Page 34 Deutsche Bank AG/Hong Kong
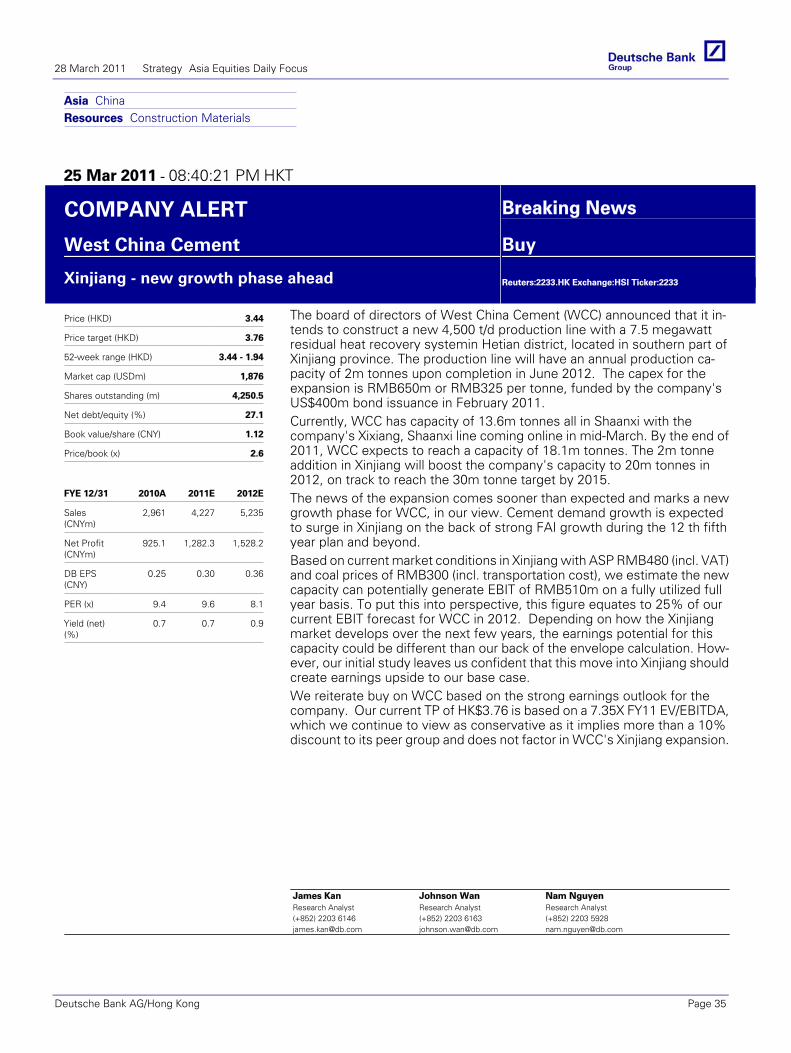
Asia ChinaResources Construction Materials
25 Mar 2011 - 08:40:21 PM HKT
COMPANY ALERT Breaking News
West China Cement Buy
Xinjiang - new growth phase ahead
Reuters:2233.HK Exchange:HSI Ticker:2233
Price (HKD) 3.44
Price target (HKD) 3.76
52-week range (HKD) 3.44 - 1.94
Market cap (USDm) 1,876
Shares outstanding (m) 4,250.5
Net debt/equity (%) 27.1
Book value/share (CNY) 1.12
Price/book (x) 2.6
FYE 12/31 2010A 2011E 2012E
Sales(CNYm)
2,961 4,227 5,235
Net Profit(CNYm)
925.1 1,282.3 1,528.2
DB EPS(CNY)
0.25 0.30 0.36
PER (x) 9.4 9.6 8.1
Yield (net)(%)
0.7 0.7 0.9
The board of directors of West China Cement (WCC) announced that it in-tends to construct a new 4,500 t/d production line with a 7.5 megawattresidual heat recovery systemin Hetian district, located in southern part ofXinjiang province. The production line will have an annual production ca-pacity of 2m tonnes upon completion in June 2012. The capex for theexpansion is RMB650m or RMB325 per tonne, funded by the company'sUS$400m bond issuance in February 2011.Currently, WCC has capacity of 13.6m tonnes all in Shaanxi with thecompany's Xixiang, Shaanxi line coming online in mid-March. By the end of2011, WCC expects to reach a capacity of 18.1m tonnes. The 2m tonneaddition in Xinjiang will boost the company's capacity to 20m tonnes in2012, on track to reach the 30m tonne target by 2015.The news of the expansion comes sooner than expected and marks a newgrowth phase for WCC, in our view. Cement demand growth is expectedto surge in Xinjiang on the back of strong FAI growth during the 12 th fifthyear plan and beyond.Based on current market conditions in Xinjiang with ASP RMB480 (incl. VAT)and coal prices of RMB300 (incl. transportation cost), we estimate the newcapacity can potentially generate EBIT of RMB510m on a fully utilized fullyear basis. To put this into perspective, this figure equates to 25% of ourcurrent EBIT forecast for WCC in 2012. Depending on how the Xinjiangmarket develops over the next few years, the earnings potential for thiscapacity could be different than our back of the envelope calculation. How-ever, our initial study leaves us confident that this move into Xinjiang shouldcreate earnings upside to our base case.We reiterate buy on WCC based on the strong earnings outlook for thecompany. Our current TP of HK$3.76 is based on a 7.35X FY11 EV/EBITDA,which we continue to view as conservative as it implies more than a 10%discount to its peer group and does not factor in WCC's Xinjiang expansion.
James KanResearch Analyst(+852) 2203 [email protected]
Johnson WanResearch Analyst(+852) 2203 [email protected]
Nam NguyenResearch Analyst(+852) 2203 [email protected]
28 March 2011 Strategy Asia Equities Daily Focus
Deutsche Bank AG/Hong Kong Page 35
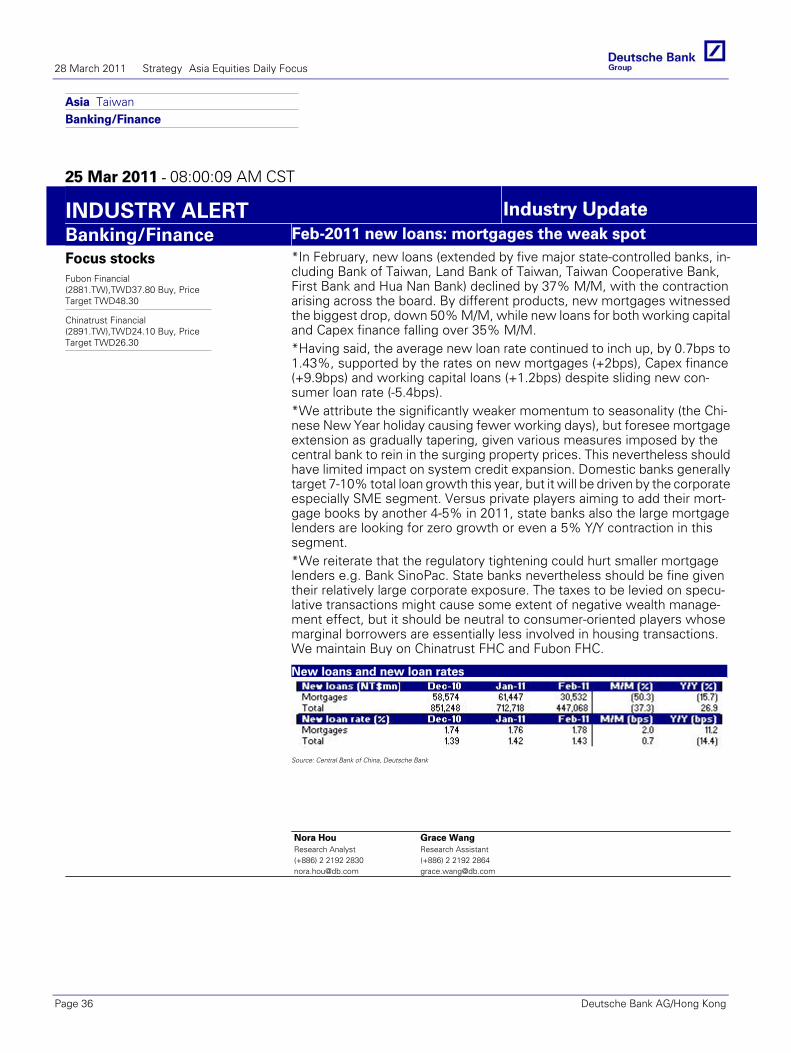
Asia TaiwanBanking/Finance
25 Mar 2011 - 08:00:09 AM CST
INDUSTRY ALERT Industry UpdateBanking/Finance Feb-2011 new loans: mortgages the weak spot
Focus stocksFubon Financial(2881.TW),TWD37.80 Buy, PriceTarget TWD48.30
Chinatrust Financial(2891.TW),TWD24.10 Buy, PriceTarget TWD26.30
*In February, new loans (extended by five major state-controlled banks, in-cluding Bank of Taiwan, Land Bank of Taiwan, Taiwan Cooperative Bank,First Bank and Hua Nan Bank) declined by 37% M/M, with the contractionarising across the board. By different products, new mortgages witnessedthe biggest drop, down 50% M/M, while new loans for both working capitaland Capex finance falling over 35% M/M.*Having said, the average new loan rate continued to inch up, by 0.7bps to1.43%, supported by the rates on new mortgages (+2bps), Capex finance(+9.9bps) and working capital loans (+1.2bps) despite sliding new con-sumer loan rate (-5.4bps).*We attribute the significantly weaker momentum to seasonality (the Chi-nese New Year holiday causing fewer working days), but foresee mortgageextension as gradually tapering, given various measures imposed by thecentral bank to rein in the surging property prices. This nevertheless shouldhave limited impact on system credit expansion. Domestic banks generallytarget 7-10% total loan growth this year, but it will be driven by the corporateespecially SME segment. Versus private players aiming to add their mort-gage books by another 4-5% in 2011, state banks also the large mortgagelenders are looking for zero growth or even a 5% Y/Y contraction in thissegment.*We reiterate that the regulatory tightening could hurt smaller mortgagelenders e.g. Bank SinoPac. State banks nevertheless should be fine giventheir relatively large corporate exposure. The taxes to be levied on specu-lative transactions might cause some extent of negative wealth manage-ment effect, but it should be neutral to consumer-oriented players whosemarginal borrowers are essentially less involved in housing transactions.We maintain Buy on Chinatrust FHC and Fubon FHC.
New loans and new loan rates
Source: Central Bank of China, Deutsche Bank
Nora HouResearch Analyst(+886) 2 2192 [email protected]
Grace WangResearch Assistant(+886) 2 2192 [email protected]
28 March 2011 Strategy Asia Equities Daily Focus
Page 36 Deutsche Bank AG/Hong Kong
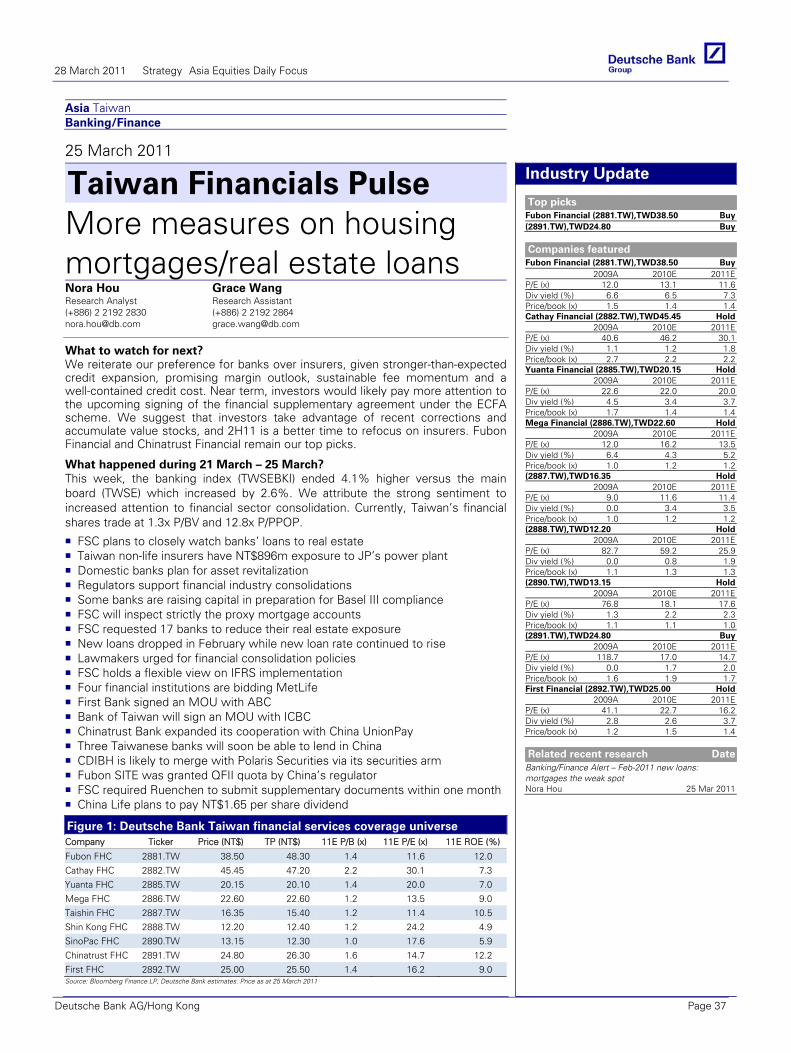
Asia Taiwan Banking/Finance
25 March 2011
Taiwan Financials Pulse More measures on housing mortgages/real estate loansNora Hou Research Analyst (+886) 2 2192 2830 [email protected]
Grace Wang Research Assistant (+886) 2 2192 2864 [email protected]
What to watch for next? We reiterate our preference for banks over insurers, given stronger-than-expected credit expansion, promising margin outlook, sustainable fee momentum and a well-contained credit cost. Near term, investors would likely pay more attention to the upcoming signing of the financial supplementary agreement under the ECFA scheme. We suggest that investors take advantage of recent corrections and accumulate value stocks, and 2H11 is a better time to refocus on insurers. Fubon Financial and Chinatrust Financial remain our top picks.
Industry Update
Top picks Fubon Financial (2881.TW),TWD38.50 Buy(2891.TW),TWD24.80 Buy
Companies featured
Fubon Financial (2881.TW),TWD38.50 Buy2009A 2010E 2011E
P/E (x) 12.0 13.1 11.6Div yield (%) 6.6 6.5 7.3Price/book (x) 1.5 1.4 1.4Cathay Financial (2882.TW),TWD45.45 Hold
2009A 2010E 2011EP/E (x) 40.6 46.2 30.1Div yield (%) 1.1 1.2 1.8Price/book (x) 2.7 2.2 2.2Yuanta Financial (2885.TW),TWD20.15 Hold
2009A 2010E 2011EP/E (x) 22.6 22.0 20.0Div yield (%) 4.5 3.4 3.7Price/book (x) 1.7 1.4 1.4Mega Financial (2886.TW),TWD22.60 Hold
2009A 2010E 2011EP/E (x) 12.0 16.2 13.5Div yield (%) 6.4 4.3 5.2Price/book (x) 1.0 1.2 1.2(2887.TW),TWD16.35 Hold
2009A 2010E 2011EP/E (x) 9.0 11.6 11.4Div yield (%) 0.0 3.4 3.5Price/book (x) 1.0 1.2 1.2(2888.TW),TWD12.20 Hold
2009A 2010E 2011EP/E (x) 82.7 59.2 25.9Div yield (%) 0.0 0.8 1.9Price/book (x) 1.1 1.3 1.3(2890.TW),TWD13.15 Hold
2009A 2010E 2011EP/E (x) 76.8 18.1 17.6Div yield (%) 1.3 2.2 2.3Price/book (x) 1.1 1.1 1.0(2891.TW),TWD24.80 Buy
2009A 2010E 2011EP/E (x) 118.7 17.0 14.7Div yield (%) 0.0 1.7 2.0Price/book (x) 1.6 1.9 1.7First Financial (2892.TW),TWD25.00 Hold
2009A 2010E 2011EP/E (x) 41.1 22.7 16.2Div yield (%) 2.8 2.6 3.7Price/book (x) 1.2 1.5 1.4
Related recent research Date
Banking/Finance Alert – Feb-2011 new loans: mortgages the weak spot Nora Hou 25 Mar 2011
What happened during 21 March – 25 March? This week, the banking index (TWSEBKI) ended 4.1% higher versus the main board (TWSE) which increased by 2.6%. We attribute the strong sentiment to increased attention to financial sector consolidation. Currently, Taiwan’s financial shares trade at 1.3x P/BV and 12.8x P/PPOP.
FSC plans to closely watch banks’ loans to real estate Taiwan non-life insurers have NT$896m exposure to JP’s power plant Domestic banks plan for asset revitalization Regulators support financial industry consolidations Some banks are raising capital in preparation for Basel III compliance FSC will inspect strictly the proxy mortgage accounts FSC requested 17 banks to reduce their real estate exposure New loans dropped in February while new loan rate continued to rise Lawmakers urged for financial consolidation policies FSC holds a flexible view on IFRS implementation Four financial institutions are bidding MetLife First Bank signed an MOU with ABC Bank of Taiwan will sign an MOU with ICBC Chinatrust Bank expanded its cooperation with China UnionPay Three Taiwanese banks will soon be able to lend in China CDIBH is likely to merge with Polaris Securities via its securities arm Fubon SITE was granted QFII quota by China’s regulator FSC required Ruenchen to submit supplementary documents within one month China Life plans to pay NT$1.65 per share dividend
Figure 1: Deutsche Bank Taiwan financial services coverage universe Company Ticker Price (NT$) TP (NT$) 11E P/B (x) 11E P/E (x) 11E ROE (%)
Fubon FHC 2881.TW 38.50 48.30 1.4 11.6 12.0
Cathay FHC 2882.TW 45.45 47.20 2.2 30.1 7.3
Yuanta FHC 2885.TW 20.15 20.10 1.4 20.0 7.0
Mega FHC 2886.TW 22.60 22.60 1.2 13.5 9.0
Taishin FHC 2887.TW 16.35 15.40 1.2 11.4 10.5
Shin Kong FHC 2888.TW 12.20 12.40 1.2 24.2 4.9
SinoPac FHC 2890.TW 13.15 12.30 1.0 17.6 5.9
Chinatrust FHC 2891.TW 24.80 26.30 1.6 14.7 12.2
First FHC 2892.TW 25.00 25.50 1.4 16.2 9.0 Source: Bloomberg Finance LP, Deutsche Bank estimates. Price as at 25 March 2011
28 March 2011 Strategy Asia Equities Daily Focus
Deutsche Bank AG/Hong Kong Page 37
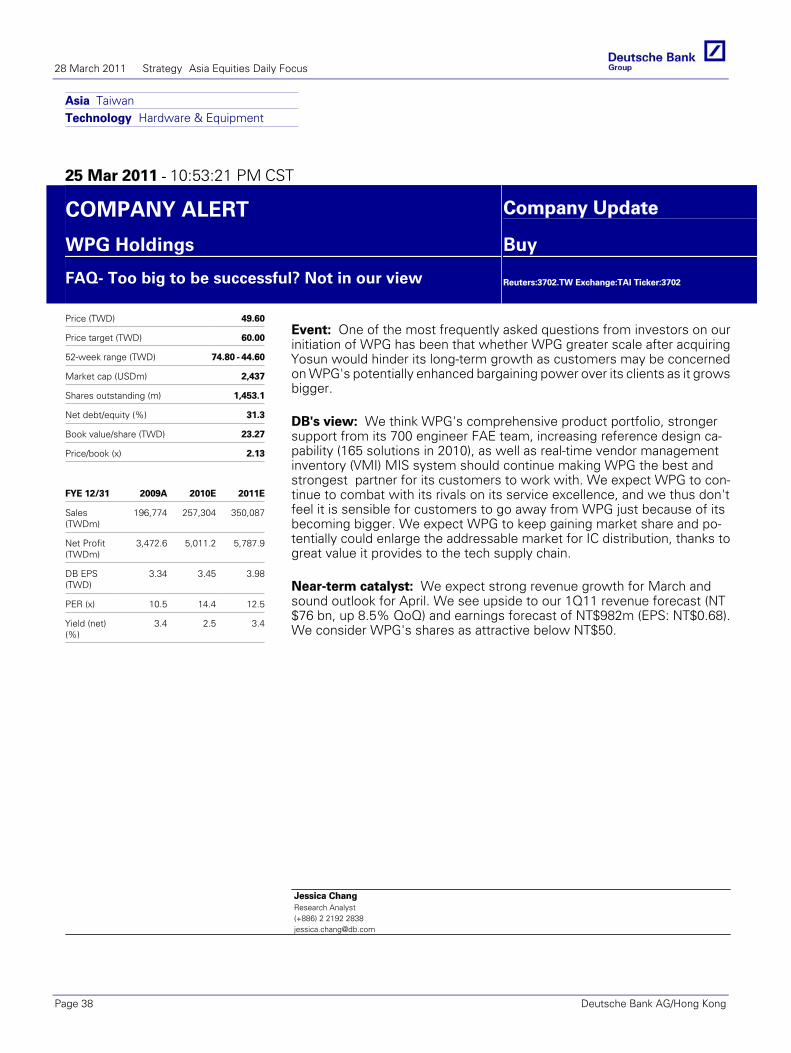
Asia TaiwanTechnology Hardware & Equipment
25 Mar 2011 - 10:53:21 PM CST
COMPANY ALERT Company Update
WPG Holdings Buy
FAQ- Too big to be successful? Not in our view
Reuters:3702.TW Exchange:TAI Ticker:3702
Price (TWD) 49.60
Price target (TWD) 60.00
52-week range (TWD) 74.80 - 44.60
Market cap (USDm) 2,437
Shares outstanding (m) 1,453.1
Net debt/equity (%) 31.3
Book value/share (TWD) 23.27
Price/book (x) 2.13
FYE 12/31 2009A 2010E 2011E
Sales(TWDm)
196,774 257,304 350,087
Net Profit(TWDm)
3,472.6 5,011.2 5,787.9
DB EPS(TWD)
3.34 3.45 3.98
PER (x) 10.5 14.4 12.5
Yield (net)(%)
3.4 2.5 3.4
Event: One of the most frequently asked questions from investors on ourinitiation of WPG has been that whether WPG greater scale after acquiringYosun would hinder its long-term growth as customers may be concernedon WPG's potentially enhanced bargaining power over its clients as it growsbigger.
DB's view: We think WPG's comprehensive product portfolio, strongersupport from its 700 engineer FAE team, increasing reference design ca-pability (165 solutions in 2010), as well as real-time vendor managementinventory (VMI) MIS system should continue making WPG the best andstrongest partner for its customers to work with. We expect WPG to con-tinue to combat with its rivals on its service excellence, and we thus don'tfeel it is sensible for customers to go away from WPG just because of itsbecoming bigger. We expect WPG to keep gaining market share and po-tentially could enlarge the addressable market for IC distribution, thanks togreat value it provides to the tech supply chain.
Near-term catalyst: We expect strong revenue growth for March andsound outlook for April. We see upside to our 1Q11 revenue forecast (NT$76 bn, up 8.5% QoQ) and earnings forecast of NT$982m (EPS: NT$0.68).We consider WPG's shares as attractive below NT$50.
Jessica ChangResearch Analyst(+886) 2 2192 [email protected]
28 March 2011 Strategy Asia Equities Daily Focus
Page 38 Deutsche Bank AG/Hong Kong
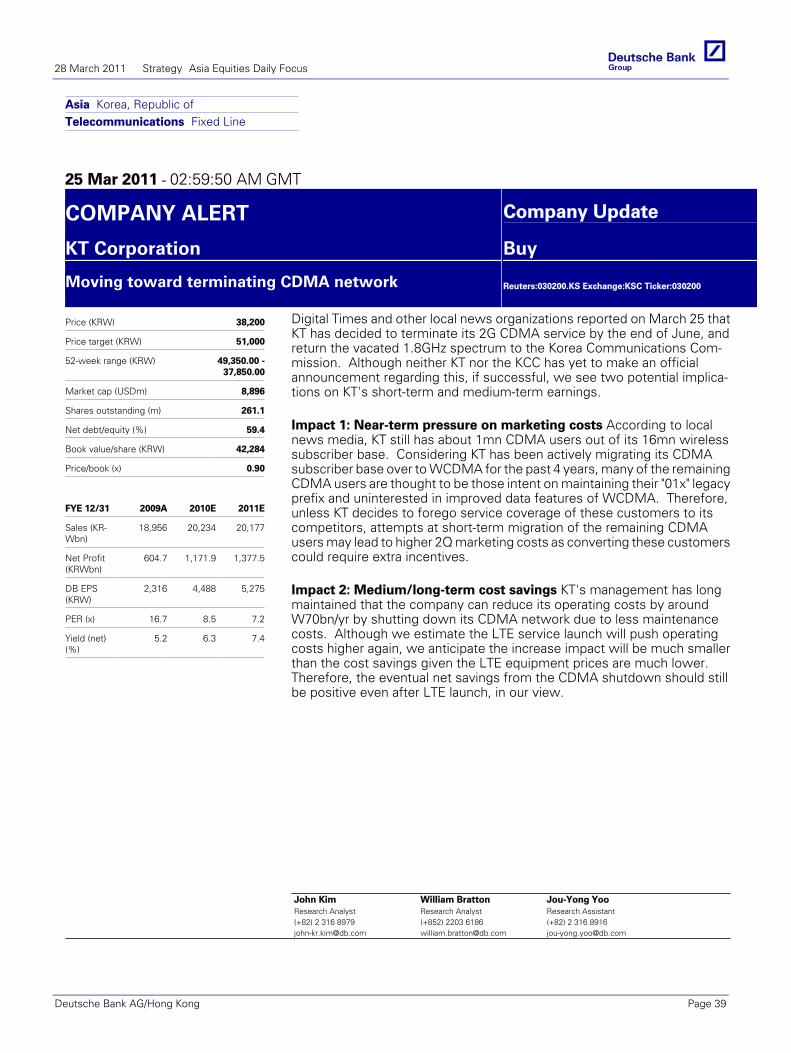
Asia Korea, Republic ofTelecommunications Fixed Line
25 Mar 2011 - 02:59:50 AM GMT
COMPANY ALERT Company Update
KT Corporation Buy
Moving toward terminating CDMA network
Reuters:030200.KS Exchange:KSC Ticker:030200
Price (KRW) 38,200
Price target (KRW) 51,000
52-week range (KRW) 49,350.00 -37,850.00
Market cap (USDm) 8,896
Shares outstanding (m) 261.1
Net debt/equity (%) 59.4
Book value/share (KRW) 42,284
Price/book (x) 0.90
FYE 12/31 2009A 2010E 2011E
Sales (KR-Wbn)
18,956 20,234 20,177
Net Profit(KRWbn)
604.7 1,171.9 1,377.5
DB EPS(KRW)
2,316 4,488 5,275
PER (x) 16.7 8.5 7.2
Yield (net)(%)
5.2 6.3 7.4
Digital Times and other local news organizations reported on March 25 thatKT has decided to terminate its 2G CDMA service by the end of June, andreturn the vacated 1.8GHz spectrum to the Korea Communications Com-mission. Although neither KT nor the KCC has yet to make an officialannouncement regarding this, if successful, we see two potential implica-tions on KT's short-term and medium-term earnings.
Impact 1: Near-term pressure on marketing costs According to localnews media, KT still has about 1mn CDMA users out of its 16mn wirelesssubscriber base. Considering KT has been actively migrating its CDMAsubscriber base over to WCDMA for the past 4 years, many of the remainingCDMA users are thought to be those intent on maintaining their "01x" legacyprefix and uninterested in improved data features of WCDMA. Therefore,unless KT decides to forego service coverage of these customers to itscompetitors, attempts at short-term migration of the remaining CDMAusers may lead to higher 2Q marketing costs as converting these customerscould require extra incentives.
Impact 2: Medium/long-term cost savings KT's management has longmaintained that the company can reduce its operating costs by aroundW70bn/yr by shutting down its CDMA network due to less maintenancecosts. Although we estimate the LTE service launch will push operatingcosts higher again, we anticipate the increase impact will be much smallerthan the cost savings given the LTE equipment prices are much lower.Therefore, the eventual net savings from the CDMA shutdown should stillbe positive even after LTE launch, in our view.
John KimResearch Analyst(+82) 2 316 [email protected]
William BrattonResearch Analyst(+852) 2203 [email protected]
Jou-Yong YooResearch Assistant(+82) 2 316 [email protected]
28 March 2011 Strategy Asia Equities Daily Focus
Deutsche Bank AG/Hong Kong Page 39
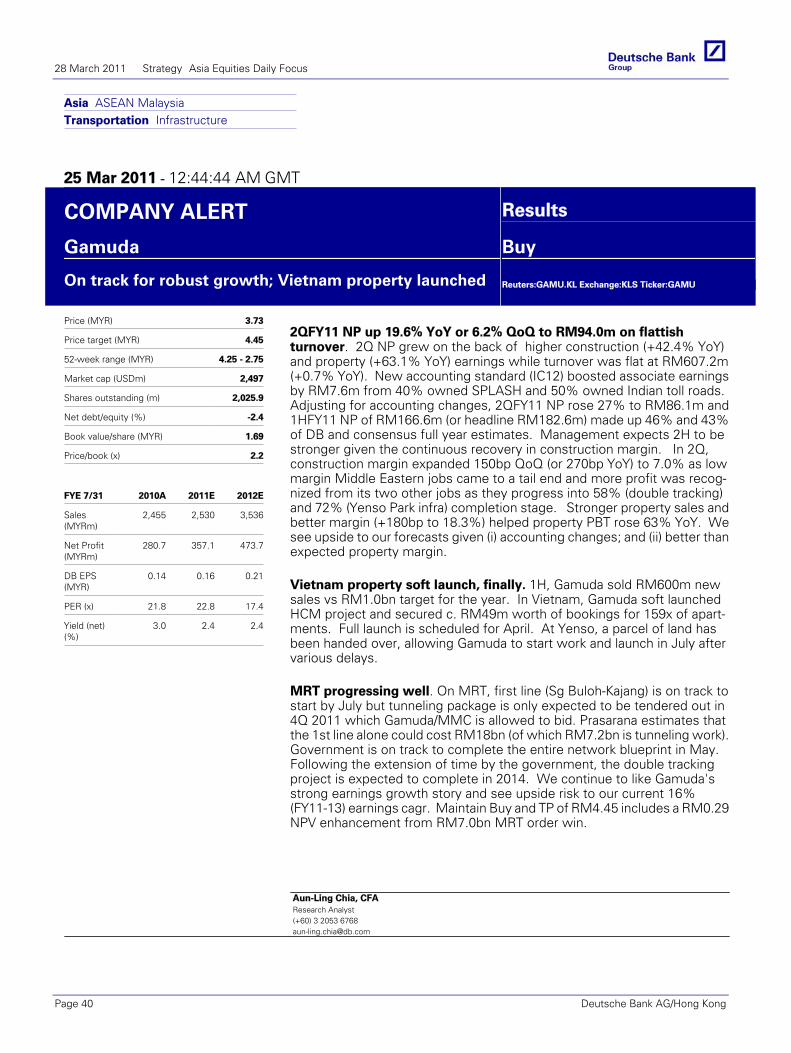
Asia ASEAN MalaysiaTransportation Infrastructure
25 Mar 2011 - 12:44:44 AM GMT
COMPANY ALERT Results
Gamuda Buy
On track for robust growth; Vietnam property launched
Reuters:GAMU.KL Exchange:KLS Ticker:GAMU
Price (MYR) 3.73
Price target (MYR) 4.45
52-week range (MYR) 4.25 - 2.75
Market cap (USDm) 2,497
Shares outstanding (m) 2,025.9
Net debt/equity (%) -2.4
Book value/share (MYR) 1.69
Price/book (x) 2.2
FYE 7/31 2010A 2011E 2012E
Sales(MYRm)
2,455 2,530 3,536
Net Profit(MYRm)
280.7 357.1 473.7
DB EPS(MYR)
0.14 0.16 0.21
PER (x) 21.8 22.8 17.4
Yield (net)(%)
3.0 2.4 2.4
2QFY11 NP up 19.6% YoY or 6.2% QoQ to RM94.0m on flattishturnover. 2Q NP grew on the back of higher construction (+42.4% YoY)and property (+63.1% YoY) earnings while turnover was flat at RM607.2m(+0.7% YoY). New accounting standard (IC12) boosted associate earningsby RM7.6m from 40% owned SPLASH and 50% owned Indian toll roads.Adjusting for accounting changes, 2QFY11 NP rose 27% to RM86.1m and1HFY11 NP of RM166.6m (or headline RM182.6m) made up 46% and 43%of DB and consensus full year estimates. Management expects 2H to bestronger given the continuous recovery in construction margin. In 2Q,construction margin expanded 150bp QoQ (or 270bp YoY) to 7.0% as lowmargin Middle Eastern jobs came to a tail end and more profit was recog-nized from its two other jobs as they progress into 58% (double tracking)and 72% (Yenso Park infra) completion stage. Stronger property sales andbetter margin (+180bp to 18.3%) helped property PBT rose 63% YoY. Wesee upside to our forecasts given (i) accounting changes; and (ii) better thanexpected property margin.
Vietnam property soft launch, finally. 1H, Gamuda sold RM600m newsales vs RM1.0bn target for the year. In Vietnam, Gamuda soft launchedHCM project and secured c. RM49m worth of bookings for 159x of apart-ments. Full launch is scheduled for April. At Yenso, a parcel of land hasbeen handed over, allowing Gamuda to start work and launch in July aftervarious delays.
MRT progressing well. On MRT, first line (Sg Buloh-Kajang) is on track tostart by July but tunneling package is only expected to be tendered out in4Q 2011 which Gamuda/MMC is allowed to bid. Prasarana estimates thatthe 1st line alone could cost RM18bn (of which RM7.2bn is tunneling work).Government is on track to complete the entire network blueprint in May.Following the extension of time by the government, the double trackingproject is expected to complete in 2014. We continue to like Gamuda'sstrong earnings growth story and see upside risk to our current 16%(FY11-13) earnings cagr. Maintain Buy and TP of RM4.45 includes a RM0.29NPV enhancement from RM7.0bn MRT order win.
Aun-Ling Chia, CFAResearch Analyst(+60) 3 2053 [email protected]
28 March 2011 Strategy Asia Equities Daily Focus
Page 40 Deutsche Bank AG/Hong Kong
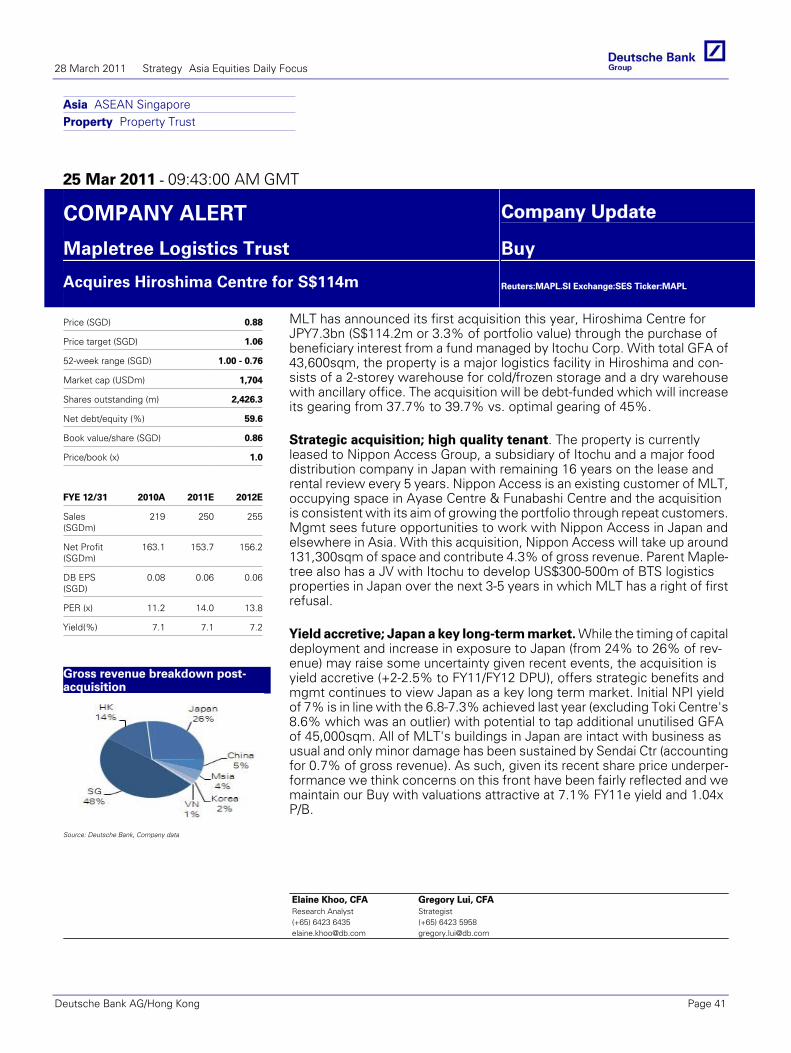
Asia ASEAN SingaporeProperty Property Trust
25 Mar 2011 - 09:43:00 AM GMT
COMPANY ALERT Company Update
Mapletree Logistics Trust Buy
Acquires Hiroshima Centre for S$114m
Reuters:MAPL.SI Exchange:SES Ticker:MAPL
Price (SGD) 0.88
Price target (SGD) 1.06
52-week range (SGD) 1.00 - 0.76
Market cap (USDm) 1,704
Shares outstanding (m) 2,426.3
Net debt/equity (%) 59.6
Book value/share (SGD) 0.86
Price/book (x) 1.0
FYE 12/31 2010A 2011E 2012E
Sales(SGDm)
219 250 255
Net Profit(SGDm)
163.1 153.7 156.2
DB EPS(SGD)
0.08 0.06 0.06
PER (x) 11.2 14.0 13.8
Yield(%) 7.1 7.1 7.2
Gross revenue breakdown post-acquisition
Source: Deutsche Bank, Company data
MLT has announced its first acquisition this year, Hiroshima Centre forJPY7.3bn (S$114.2m or 3.3% of portfolio value) through the purchase ofbeneficiary interest from a fund managed by Itochu Corp. With total GFA of43,600sqm, the property is a major logistics facility in Hiroshima and con-sists of a 2-storey warehouse for cold/frozen storage and a dry warehousewith ancillary office. The acquisition will be debt-funded which will increaseits gearing from 37.7% to 39.7% vs. optimal gearing of 45%.
Strategic acquisition; high quality tenant. The property is currentlyleased to Nippon Access Group, a subsidiary of Itochu and a major fooddistribution company in Japan with remaining 16 years on the lease andrental review every 5 years. Nippon Access is an existing customer of MLT,occupying space in Ayase Centre & Funabashi Centre and the acquisitionis consistent with its aim of growing the portfolio through repeat customers.Mgmt sees future opportunities to work with Nippon Access in Japan andelsewhere in Asia. With this acquisition, Nippon Access will take up around131,300sqm of space and contribute 4.3% of gross revenue. Parent Maple-tree also has a JV with Itochu to develop US$300-500m of BTS logisticsproperties in Japan over the next 3-5 years in which MLT has a right of firstrefusal.
Yield accretive; Japan a key long-term market. While the timing of capitaldeployment and increase in exposure to Japan (from 24% to 26% of rev-enue) may raise some uncertainty given recent events, the acquisition isyield accretive (+2-2.5% to FY11/FY12 DPU), offers strategic benefits andmgmt continues to view Japan as a key long term market. Initial NPI yieldof 7% is in line with the 6.8-7.3% achieved last year (excluding Toki Centre's8.6% which was an outlier) with potential to tap additional unutilised GFAof 45,000sqm. All of MLT's buildings in Japan are intact with business asusual and only minor damage has been sustained by Sendai Ctr (accountingfor 0.7% of gross revenue). As such, given its recent share price underper-formance we think concerns on this front have been fairly reflected and wemaintain our Buy with valuations attractive at 7.1% FY11e yield and 1.04xP/B.
Elaine Khoo, CFAResearch Analyst(+65) 6423 [email protected]
Gregory Lui, CFAStrategist(+65) 6423 [email protected]
28 March 2011 Strategy Asia Equities Daily Focus
Deutsche Bank AG/Hong Kong Page 41
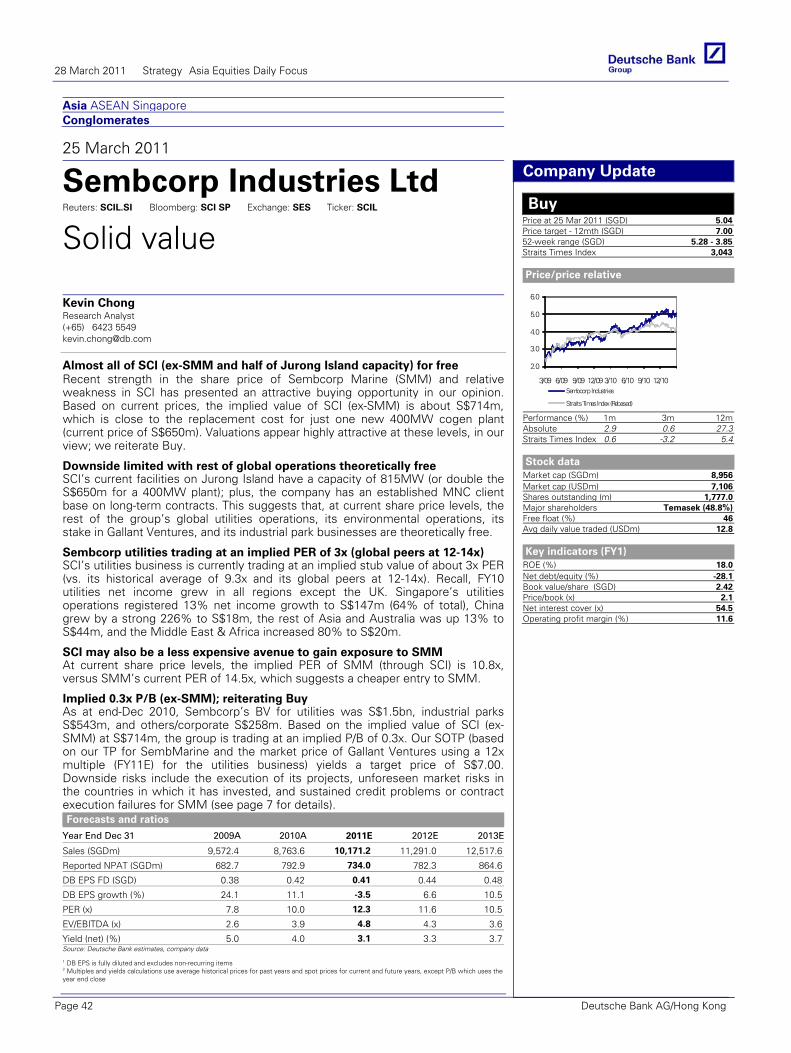
Asia ASEAN Singapore Conglomerates
25 March 2011
Sembcorp Industries Ltd Reuters: SCIL.SI Bloomberg: SCI SP Exchange: SES Ticker: SCIL
Solid value
Kevin Chong Research Analyst (+65) 6423 5549 [email protected]
Almost all of SCI (ex-SMM and half of Jurong Island capacity) for free Recent strength in the share price of Sembcorp Marine (SMM) and relative weakness in SCI has presented an attractive buying opportunity in our opinion. Based on current prices, the implied value of SCI (ex-SMM) is about S$714m, which is close to the replacement cost for just one new 400MW cogen plant (current price of S$650m). Valuations appear highly attractive at these levels, in our view; we reiterate Buy.
Forecasts and ratios
Year End Dec 31 2009A 2010A 2011E 2012E 2013E
Sales (SGDm) 9,572.4 8,763.6 10,171.2 11,291.0 12,517.6
Reported NPAT (SGDm) 682.7 792.9 734.0 782.3 864.6
DB EPS FD (SGD) 0.38 0.42 0.41 0.44 0.48
DB EPS growth (%) 24.1 11.1 -3.5 6.6 10.5
PER (x) 7.8 10.0 12.3 11.6 10.5
EV/EBITDA (x) 2.6 3.9 4.8 4.3 3.6
Yield (net) (%) 5.0 4.0 3.1 3.3 3.7Source: Deutsche Bank estimates, company data
1 DB EPS is fully diluted and excludes non-recurring items 2 Multiples and yields calculations use average historical prices for past years and spot prices for current and future years, except P/B which uses the year end close
Company Update
Buy Price at 25 Mar 2011 (SGD) 5.04Price target - 12mth (SGD) 7.0052-week range (SGD) 5.28 - 3.85Straits Times Index 3,043
Price/price relative
2.0
3.0
4.0
5.0
6.0
3/09 6/09 9/09 12/09 3/10 6/10 9/10 12/10Sembcorp Industries
Straits Times Index (Rebased)
Performance (%) 1m 3m 12mAbsolute 2.9 0.6 27.3Straits Times Index 0.6 -3.2 5.4
Stock data
Market cap (SGDm) 8,956Market cap (USDm) 7,106Shares outstanding (m) 1,777.0Major shareholders Temasek (48.8%)Free float (%) 46Avg daily value traded (USDm) 12.8
Key indicators (FY1)
ROE (%) 18.0Net debt/equity (%) -28.1Book value/share (SGD) 2.42Price/book (x) 2.1Net interest cover (x) 54.5Operating profit margin (%) 11.6
Downside limited with rest of global operations theoretically free SCI’s current facilities on Jurong Island have a capacity of 815MW (or double the S$650m for a 400MW plant); plus, the company has an established MNC client base on long-term contracts. This suggests that, at current share price levels, the rest of the group’s global utilities operations, its environmental operations, its stake in Gallant Ventures, and its industrial park businesses are theoretically free.
Sembcorp utilities trading at an implied PER of 3x (global peers at 12-14x) SCI’s utilities business is currently trading at an implied stub value of about 3x PER (vs. its historical average of 9.3x and its global peers at 12-14x). Recall, FY10 utilities net income grew in all regions except the UK. Singapore’s utilities operations registered 13% net income growth to S$147m (64% of total), China grew by a strong 226% to S$18m, the rest of Asia and Australia was up 13% to S$44m, and the Middle East & Africa increased 80% to S$20m.
SCI may also be a less expensive avenue to gain exposure to SMM At current share price levels, the implied PER of SMM (through SCI) is 10.8x, versus SMM’s current PER of 14.5x, which suggests a cheaper entry to SMM.
Implied 0.3x P/B (ex-SMM); reiterating Buy As at end-Dec 2010, Sembcorp’s BV for utilities was S$1.5bn, industrial parks S$543m, and others/corporate S$258m. Based on the implied value of SCI (ex-SMM) at S$714m, the group is trading at an implied P/B of 0.3x. Our SOTP (based on our TP for SembMarine and the market price of Gallant Ventures using a 12x multiple (FY11E) for the utilities business) yields a target price of S$7.00. Downside risks include the execution of its projects, unforeseen market risks in the countries in which it has invested, and sustained credit problems or contract execution failures for SMM (see page 7 for details).
28 March 2011 Strategy Asia Equities Daily Focus
Page 42 Deutsche Bank AG/Hong Kong
Asia IndiaConsumer Retail/Wholesale Trade
25 Mar 2011 - 07:27:43 PM IST
COMPANY ALERT Breaking News
Marico Limited Buy
Sweekar divested.
Reuters:MRCO.BO Exchange:BSE Ticker:MRCO
Price (INR) 130.05
Price target (INR) 150.00
52-week range (INR) 141.25 -100.55
Market cap (USDm) 1,770
Shares outstanding (m) 609.3
Net debt/equity (%) 15.7
Book value/share (INR) 15.11
Price/book (x) 8.6
FYE 3/31 2010A 2011E 2012E
Sales (INRm) 26,608 32,250 38,148
Net Profit(INRm)
2,316.9 3,158.7 3,990.7
DB EPS(INR)
3.96 5.18 6.55
PER (x) 22.5 25.1 19.9
Yield (net)(%)
0.7 0.5 0.5
Marico has announced the sale of its edible oil brand Sweekar to Cargill.Sweekar was never a focus brand for Marico and the management hadstated its intention of divesting the brand a few years back. The transactioncould have also been forced due to the high sunflower oil prices which isthe key raw material for sweekar. Marico's other edible oil brand,Saffola,uses Khardi oil, Rice bran oil and corn oil. Saffola has been growing volumesin double digits and continues to remain the focus area for the company.Over the last 2 years, Marico had launched 2 low price variants of Saffola -Saffola Active and Saffola Tasty to make the brand sweekar somewhat re-dundant for them. The two brands together are roughly 25% of saffola'sportfolio.We estimate that the sweekar sales would have been close to INR1700 mn, 5%-6% of overall sales.Cargill had earlier bought "Rath" brand from Agrotech foods. Rath was alsoa non-focus brand for Agrotech. The annual sales of Rath were reported tobe about 1200 mn and the company reported a profit of INR 1750mn fromthe transaction as exceptional income in 3QFY11.Marico has outperformed sensex by about 16.9% y-t-d on expectations ofcopra prices falling down from historic levels due to the start of the flushseason. Although the fall in prices have been lower than expected, all veg-etable oil prices have started to show a downward trend including Palm oil,sunflower oil, soyabean oil, rapesead oil etc. Falling vegetable oil pricesbenefits Marico the most as the company operates at the permium end ofall the segments that it operates in. The gross margins of Parachute is40-45% and for saffola is 30-35% as against 10%-30% for the competitionWe maintain Buy with a target price of INR 150 per share.
Gaurav BhatiaResearch Associate(+91) 22 6658 [email protected]
Harrish ZaveriResearch Analyst(+91) 22 6658 [email protected]
28 March 2011 Strategy Asia Equities Daily Focus
Deutsche Bank AG/Hong Kong Page 43
Asia IndiaHealth Care Pharmaceuticals/Biotechnolo‐gy
25 Mar 2011 - 10:59:36 AM IST
INDUSTRY ALERT Breaking NewsPharmaceuticals/Biotechnology
Teva‘s JV with P&G for branded OTC is the way to grow
Focus stocksRanbaxy (RANB.BO),INR443.00Sell, Price Target INR190.00
Dr Reddy's Labs(REDY.BO),INR1,540.90 Sell, PriceTarget INR1,160.00
Sun Pharma (SUN.BO),INR454.45Hold, Price Target INR410.00
Lupin (LUPN.BO),INR407.30 Hold,Price Target INR430.00
Cipla (CIPL.BO),INR305.65 Hold,Price Target INR295.00
JV between Teva and P&G for branded OTC ex-N.America: Teva andProcter & Gamble (P&G) just announced a 49:51 JV for their existing OTCbusinesses outside N. America. DB analyst covering Teva (David Steinberg)writes that this symbiotic relationship captures Teva's expertise in productdevelopment, registration, production and channel marketing and P&G'sexpertise in brand‐building, consumer products innovation, and marketingto mass trade retailing channel. After the exit from prescription drugs,P&G's OTC drugs (Vicks cold, Prilosec OTC heartburn medicine, etc) lackedaccess to pharmacies. Teva never focused on becoming a supplier of OTCstore brands in US ‐ it even sold sales rights for US OTC generic version ofAllegra to Perrigo in Jun'10.This Swiss headquartered JV's CEO and CFO will come from P&G and COOfrom Teva. Separately and later on, Teva is acquiring 2 mfg facilities in theUS from P&G and will ultimately be responsible for mfg all products for theJV as well as for P&G's N. America OTC business. The JV will commenceoperations in 2HCY11 with huge scale ‐ USD 1.3bn in revenues, which Tevabelieves could grow to USD 4bn in ~6 years. On its CY10 revenues of USD16bn, Teva guides for CY15 revenues of USD 31b.
Teva shows the way to growth: Despite its size (2010 revenues being120% more than top 5 Indian companies combined) and sector growthheadwinds (fall in patent expiry from CY12, pricing pressures, etc), Tevacontinues to show the way to growth. It successfully acquired market lead‐ers in niches ‐ Ivax for inhalers in 2005, Barr for women's healthcare in 2008and has undertaken multiple acquisitions and alliances for biogenerics. Itacquired Ratiopharm (generic leader in Germany, which is the 2 nd largestglobal generic market) in 2010 only after the structural reforms in Germanpharma market were completed. Acquisitions powered growth to becomemarket leader in US and Europe generics with the largest product basketand pipeline. Unfortunately, India pharma that has been struggling for long‐term growth drivers, have almost stopped acquisitions or alliances in thelast 2 years.
Abhay ShanbhagResearch Analyst(+91) 22 6658 [email protected]
Mayank KankariaResearch Associate(+91) 22 6658 [email protected]
28 March 2011 Strategy Asia Equities Daily Focus
Page 44 Deutsche Bank AG/Hong Kong
Global IndiaTechnology Software & Services
25 Mar 2011 - 05:19:56 PM
INDUSTRY ALERT Industry UpdateSoftware & Services Accenture 2QFY11 : Read through for Indian vendors
Focus stocksInfosys Technologies(INFY.BO),INR3,004.90 Buy, PriceTarget INR4,000.00
Tata Consultancy(TCS.BO),INR1,093.45 Buy, PriceTarget INR1,400.00
Wipro (WIPR.BO),INR439.65 Buy,Price Target INR510.00
HCL Tech (HCLT.BO),INR460.15Hold, Price Target INR520.00
Accenture 2QFY11 - Strong growth and guidance revisionAccenture (ACN.N, US$51.96, Buy) reported solid 2QFY11 and has conse‐quently raised its revenue and earnings guidance for FY11. While revenuegrowth was significantly better than street expectations, a key positive wasthe strength in new bookings. At US$7bn, new bookings were the highestin 10 quarters, which included the second‐highest consulting bookings ever.The revenue growth for the quarter was broadbased with each vertical re‐porting atleast mid‐double digit yoy growth.
Positive read through for Indian vendorsAccenture management believes that the strong momentum witnessed in2QFY11 is likely to be sustained over the next 4‐5 quarters. Some of thenoteworthy comments from the management are:1. In technology consulting there is significant activity in application mod‐ernisation, operations rationalisation through virtualisation of infrastructureand in cloud computing led initiatives.2. The outlook for discretionary spending is improving rapidly. Systems in‐tegration bookings in 2QFY11 were the highest in 10 quarters. The primarilydriver was ERP.3. Demand for transformational services is on the rise. Though the size ofthe engagements is not large, it is higher value add services.4. Vendor consolidation has helped strong growth in existing accounts.5. Continue to aggressively hire talent in the global delivery network (GDN)centres. It is on track to hire more than 64,000 (31% of FY10 base) employ‐ees this year with a greater emphasis on moving work offshore
We believe that: a. The significantly improved outlook for higher value add services like con‐sulting, package implementation and system integration augurs well fordemand of offshore IT services and price realisation.b. Deal size of US$50‐150mn is the sweet spot of the Indian vendors andhence, the lower size of the transformational services contracts is an at‐tractive space for the Indian vendors to win incremental business.c. Given that the large cap Indian vendors have benefitted from vendor con‐solidation and have also indicated robust employee hiring targets for FY12E,we remain positive on the large cap Indian vendors with Infosys and TCSbeing our top picks.Aniruddha BhosaleResearch Analyst(+91) 22 6658 [email protected]
28 March 2011 Strategy Asia Equities Daily Focus
Deutsche Bank AG/Hong Kong Page 45
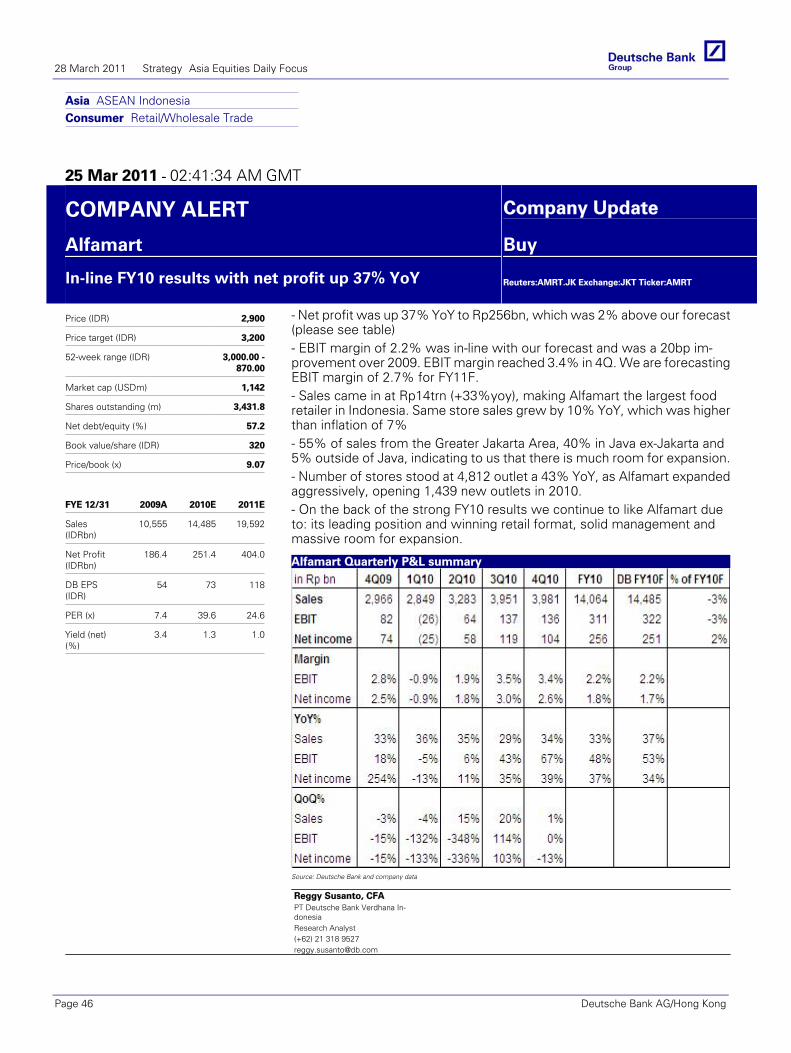
Asia ASEAN IndonesiaConsumer Retail/Wholesale Trade
25 Mar 2011 - 02:41:34 AM GMT
COMPANY ALERT Company Update
Alfamart Buy
In-line FY10 results with net profit up 37% YoY
Reuters:AMRT.JK Exchange:JKT Ticker:AMRT
Price (IDR) 2,900
Price target (IDR) 3,200
52-week range (IDR) 3,000.00 -870.00
Market cap (USDm) 1,142
Shares outstanding (m) 3,431.8
Net debt/equity (%) 57.2
Book value/share (IDR) 320
Price/book (x) 9.07
FYE 12/31 2009A 2010E 2011E
Sales(IDRbn)
10,555 14,485 19,592
Net Profit(IDRbn)
186.4 251.4 404.0
DB EPS(IDR)
54 73 118
PER (x) 7.4 39.6 24.6
Yield (net)(%)
3.4 1.3 1.0
- Net profit was up 37% YoY to Rp256bn, which was 2% above our forecast(please see table)- EBIT margin of 2.2% was in-line with our forecast and was a 20bp im-provement over 2009. EBIT margin reached 3.4% in 4Q. We are forecastingEBIT margin of 2.7% for FY11F.- Sales came in at Rp14trn (+33%yoy), making Alfamart the largest foodretailer in Indonesia. Same store sales grew by 10% YoY, which was higherthan inflation of 7%- 55% of sales from the Greater Jakarta Area, 40% in Java ex-Jakarta and5% outside of Java, indicating to us that there is much room for expansion.- Number of stores stood at 4,812 outlet a 43% YoY, as Alfamart expandedaggressively, opening 1,439 new outlets in 2010.- On the back of the strong FY10 results we continue to like Alfamart dueto: its leading position and winning retail format, solid management andmassive room for expansion.
Alfamart Quarterly P&L summary
Source: Deutsche Bank and company data
Reggy Susanto, CFAPT Deutsche Bank Verdhana In-donesiaResearch Analyst(+62) 21 318 [email protected]
28 March 2011 Strategy Asia Equities Daily Focus
Page 46 Deutsche Bank AG/Hong Kong
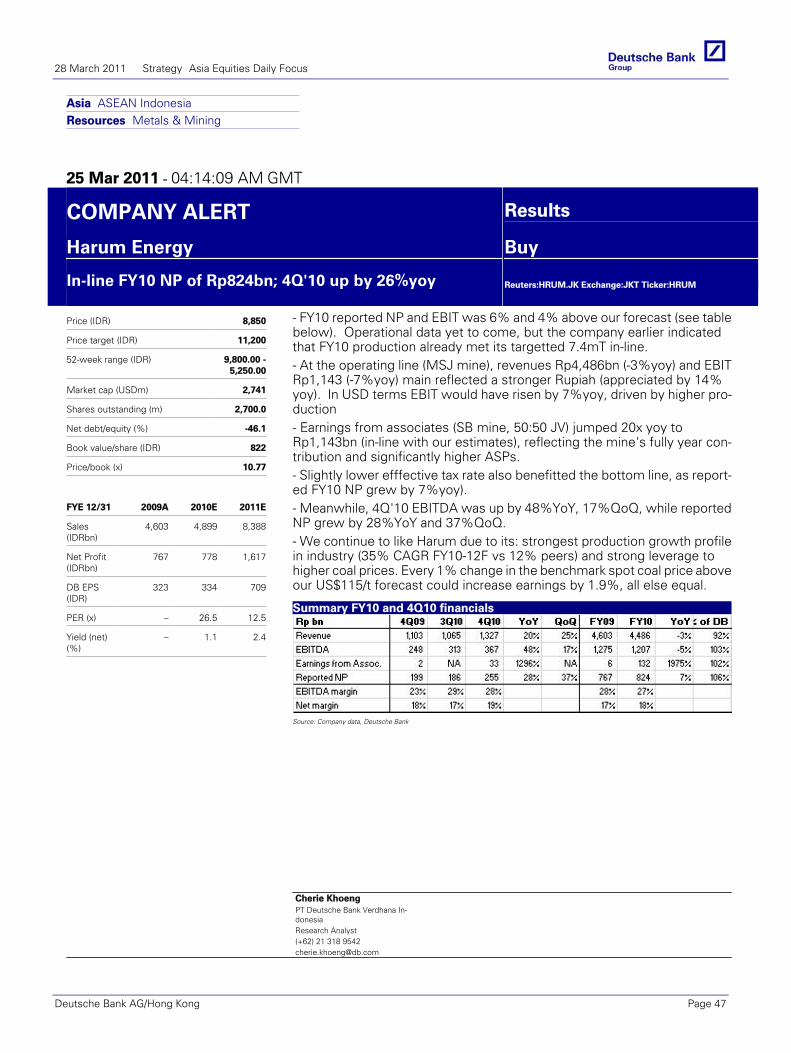
Asia ASEAN IndonesiaResources Metals & Mining
25 Mar 2011 - 04:14:09 AM GMT
COMPANY ALERT Results
Harum Energy Buy
In-line FY10 NP of Rp824bn; 4Q'10 up by 26%yoy
Reuters:HRUM.JK Exchange:JKT Ticker:HRUM
Price (IDR) 8,850
Price target (IDR) 11,200
52-week range (IDR) 9,800.00 -5,250.00
Market cap (USDm) 2,741
Shares outstanding (m) 2,700.0
Net debt/equity (%) -46.1
Book value/share (IDR) 822
Price/book (x) 10.77
FYE 12/31 2009A 2010E 2011E
Sales(IDRbn)
4,603 4,899 8,388
Net Profit(IDRbn)
767 778 1,617
DB EPS(IDR)
323 334 709
PER (x) – 26.5 12.5
Yield (net)(%)
– 1.1 2.4
- FY10 reported NP and EBIT was 6% and 4% above our forecast (see tablebelow). Operational data yet to come, but the company earlier indicatedthat FY10 production already met its targetted 7.4mT in-line.- At the operating line (MSJ mine), revenues Rp4,486bn (-3%yoy) and EBITRp1,143 (-7%yoy) main reflected a stronger Rupiah (appreciated by 14%yoy). In USD terms EBIT would have risen by 7%yoy, driven by higher pro-duction- Earnings from associates (SB mine, 50:50 JV) jumped 20x yoy toRp1,143bn (in-line with our estimates), reflecting the mine's fully year con-tribution and significantly higher ASPs.- Slightly lower efffective tax rate also benefitted the bottom line, as report-ed FY10 NP grew by 7%yoy).- Meanwhile, 4Q'10 EBITDA was up by 48%YoY, 17%QoQ, while reportedNP grew by 28%YoY and 37%QoQ.- We continue to like Harum due to its: strongest production growth profilein industry (35% CAGR FY10-12F vs 12% peers) and strong leverage tohigher coal prices. Every 1% change in the benchmark spot coal price aboveour US$115/t forecast could increase earnings by 1.9%, all else equal.
Summary FY10 and 4Q10 financials
Source: Company data, Deutsche Bank
Cherie KhoengPT Deutsche Bank Verdhana In-donesiaResearch Analyst(+62) 21 318 [email protected]
28 March 2011 Strategy Asia Equities Daily Focus
Deutsche Bank AG/Hong Kong Page 47
Asia ASEAN Indonesia Strategy Update
25 March 2011
Indonesia strategy
Key points from DB MIC on politics
Heriyanto Irawan PT Deutsche Bank Verdhana Indonesia Research Analyst (+62) 21 318 9521 [email protected]
Nicholas Nugroho PT Deutsche Bank Verdhana Indonesia Research Analyst (+62) 21 318 9558 [email protected]
Reggy Susanto, CFA PT Deutsche Bank Verdhana Indonesia Research Analyst (+62) 21 318 9527 [email protected]
We hosted a call to discuss the latest development in Indonesian politics with Wimar Witoelar, a renowned political commentator, who served as the presidential spokesperson for Aburrahman Wahid. Key points from the call:
Political stagnation likely to remain, but muted impact on economic growth Over the past year, coalition members Golkar (19% of parliamentary seats) and PKS (10%) have twice taken opposing positions to President Susilo Bambang Yudhoyono’s Partai Demokrat (PD), resulting in political stagnation and slow in passing of legislation. SBY is hesitant to exercise his mandate despite winning 60% of the popular vote as PD only won 26% of the seats. However, even with no major government breakthroughs since 2004, the good news is that economic growth has remained robust driven by private sector investment and consumption. In Wimar's view, political stagnation is unlikely to derail growth. However, he is concerned on the social implications from the rising threat to pluralism.
Parliament begins to review the proposed land acquisition bill Despite the stagnation, the parliament has now put the review process of the proposed land acquisition bill on fast track, which was submitted by the government last December and is scheduled for completion by June/July 2011, in a bid to pass the bill into law in mid-2011. The coalition parties appear to have a common goal to pass this bill to speed up land procurement process for infrastructure realization.
Golkar's position in coalition secure; cabinet reshuffle still possible Given its strong political clout an agreement was reached between Golkar’s Chairman Aburizal Bakrie and SBY; Golkar will remain in the coalition and support the government until 2014 even as a faction in PD were eager to replace Golkar. In addition, there are signs that PKS's position in the coalition and cabinet is not secure. Hence, a cabinet reshuffle is likely, although not imminent. There is precedence for doing this as during his first term SBY reshuffled his cabinet twice.
Candidates already strategizing for 2014 presidential elections Though there are three more years left for SBY’s final term, several candidates are already preparing for the 2014 elections: 1) Aburizal Bakrie, who has the political machinery of Golkar and finances to mount a campaign, although he lacks popularity; 2) Prabowo, an ex-general and the founder of the Gerindra Party, who polls favourably; 3) No clear candidate for PD at this point, but there is a faction that wants the First Lady Ani Yudhoyono to run for the elections, but both Yudhoyono and SBY have repeatedly rejected the idea; 4) Surya Paloh, a media mogul, is preparing to set up a new political party, the Nasional Demokrat; 5) The dark horse is former finance minister Sri Mulyani Indrawati. However, she lacks a political vehicle and funding.
28 March 2011 Strategy Asia Equities Daily Focus
Page 48 Deutsche Bank AG/Hong Kong
Japan Automobiles Autos
25 March 2011
Japan auto assemblers Forecast and TP changes: Estimating the earnings impactKurt Sanger, CFA Research Analyst (+81) 3 5156-6692 [email protected]
Takeshi Kitaura Research Associate (+81) 3 5156-6738 [email protected]
Anticipating a volatile year of earnings on the back of supply uncertainty Following our 22 March note (Significant challenges emerging in the supply chain) we attempt to put a framework around earnings expectations. Given the level of uncertainty over depth and duration of any disruption, we will surely be wrong in our absolute figures. Nevertheless, we need to consider a base scenario given the potential scale of the problem. Ultimately this is a definable problem with a solution and should be one the market can look beyond. We expect near term volatility, but we do not see permanent impairment to corporate value.
Forecast Change This report makes material changes to target prices and estimates. Please refer to Figure 1 (page 4) and Figure 2 (page 5) for further details.
Companies featured Nissan Motor (7201.T),¥681 BuyToyota Motor (7203.T),¥3,275 BuyMazda Motor (7261.T),¥174 HoldDaihatsu Motor (7262.T),¥1,204 BuyHonda Motor (7267.T),¥2,978 BuySuzuki Motor (7269.T),¥1,762 BuyFuji Heavy Industries (7270.T),¥535 Hold
A tough half, but no significant longer-term impairment We had assumed that Japanese automakers would produce 23m unit over the next year. In assessing a possible scenario, we assume production could be 15% below our pervious expectations with the impact focused in 1H. While a reduction of our 1H production assumption (~-30%) is similar in scale to the “Lehman Shock”, we see this situation as very different. Most simply put, this is a supply shock, not a demand shock. This makes the situation different from when shares reached lows during the financial crisis over uncertainty in future global demand prospects and liquidity risk as well as recent lows caused by a sharp appreciation of the yen. Those situations did not have a clear path to a solution making them prone to speculative assumptions. We see this situation as severe, but definable.
We expect to see OP losses in 1HFY3/12, followed by a path to normalized earnings in FY3/13 We have cut our FY3/12 earnings outlook across the board (details on pg4) and assume the impact to production should push all companies into the red in 1H FY3/12. Our base assumption is that we see a return to normal output levels by 2H with our FY3/13 earnings assumptions largely unchanged. Given the lack of information, we do not think it is possible at this point to decide that one firm is materially better off than another so we have applied largely similar impacts to volume. This will ultimately change, but for now there is little option. We have not made any ratings changes given valuation and our view on FY3/13 potential. We believe that Honda’s earnings diversification with motorbikes and finance will help its earnings do relatively well in a tough year, while its midterm outlook looks strong on the back of a robust model pipeline. We believe Nissan shares are oversold on the view it is measurably more at risk than others. While its challenges are many, it has many resources. All shares are likely to face bouts of volatility as the market comes to grips with the potential hit to earning.
Valuation/Risk We have adjusted our target prices lower for seven auto assemblers (pg5). We continue to use EV/EBITDA as our preferred valuation metric to differentiate between relative balance sheet strength. We have, however, moved our base year out to FY3/13 (from FY3/12). This now puts us inline with our global team for comparison purposes. It also gives us a clearer view of PER for those who prefer that metric. For the J4, we have lower our target multiple to 4.0x (from 4.5x) to reflect a greater degree of uncertainty surrounding the sector. Risks include concerns in Japan over the health of the supply chain, the pace of global auto sales growth in the face of this, and the constant risk of a stronger yen.
28 March 2011 Strategy Asia Equities Daily Focus
Deutsche Bank AG/Hong Kong Page 49
Japan Strategy Update
25 March 2011
Japan Equities Weekly This week’s factor and sector trends Technical factors, fundamentals, and sectors Japan’s recovery
capabilities
This week’s comments
Naoki Kamiyama, CFA Chief Strategist (+81) 3 5156-6713 [email protected]
Kensuke Isomura Strategist (+81) 3 5156-6704 [email protected]
This week P r ic e Return
TOPIX 857.38 3.25%
Nikkei 225 9,536.13 3.58%
TPX 30 465.51 2.82%
TPX 100 (Large) 594.84 3.08%
TPX Mid 869.05 2.91%
TPX Small 903.92 5.73%
TPX Value 1,030.81 3.90%
TPX Growth 1,030.63 2.59%
JASDAQ 51.76 4.17%
S&P 500 1,309.66 2.38%
USD/JPY 80.97 0.14%
JGB Yield 1.22 0.010
Oil - WTI 105.60 4.48%
Note: Weekly returns of S&P 500 and WTI are calculated as thursdays.
Sec tor Returns ( w eekly )
Outperform (%)
1 Mining 9.96
2 Oil & Coal Products 8.68
3 Metal Products 8.34
4 Construction 8.26
5 Pulp & Paper 8.21
Underperform (%)
29 Air Transport 0.25
30 Transport Equipment -0.38
31 Securities -1.03
32 Electric Power & Gas -1.48
33 Real Estate -3.19
Valuation
P EREP S
grow th
3mth
return
TOPIX 10.9 16.2% -5.3%
S&P 500 12.5 14.6% 4.2%
STOXX Europe 600 10.2 13.9% -2.0%
Hang Seng 11.4 14.6% 0.4%
TOPIX PER ROE
FY1 12.8 8.4
FY2 11.0 9.8
FY3 9.7 11.1
Note: IBES, P/B of 1.08 is used to obtain ROEs above.
Source: DataStream, Nikkei Astra, Deutsche Securities
Note: PER and EPS growth are IBES 12-month forward forecast basis.
Our hearts go out to the victims of the recent earthquake in Eastern Japan and their families. We wish them a speedy recovery.
Many electronic parts manufactured in hard-hit areas Since many electronic parts factories are located in Iwate, Miyagi, and Fukushima prefectures, damage caused by the quake may interrupt supply chains. However, we only expect a few cases in which Japanese firms see their competitiveness decline or global output sharply scaled back.
Supplemental budget likely to focus on construction Construction-related projects accounted for over 60% of the roughly ¥3trn supplemental budget that was implemented after the Great Hanshin-Awaji (Kobe) Earthquake. The Tohoku Pacific Earthquake might require reconstruction funds totaling ¥10trn, and we expect sales to rise at companies involved in the construction, glass and ceramics, steel, home equipment, and construction machinery industries.
Dip in consumer sentiment should be temporary While there is considerable concern about weaker consumer sentiment due to the enormity of the damage and the unstable electricity supply in Tokyo, provided that disruptions to incomes outside the affected areas are modest, we expect the dip in sentiment to be temporary. It is difficult to forecast consumer sentiment but we advise against taking a pessimistic view.
This week’s focus: The supplemental budget and daylight savings We expect a large supplemental budget to focus attention on construction demand. Consequently we have selected construction, housing, and other related stocks. Minister Renho, who has been assigned the task of raising awareness of electricity conservation, mentioned in a press conference that daylight savings and flex-time programs are being reviewed. This favors clock makers, leisure, and sports-related stocks.
Factor return trends: Value and small-caps performed well We observed a value effect as low P/B and P/E stocks delivered strong returns. Stocks with small market caps also generated high returns.
28 March 2011 Strategy Asia Equities Daily Focus
Page 50 Deutsche Bank AG/Hong Kong
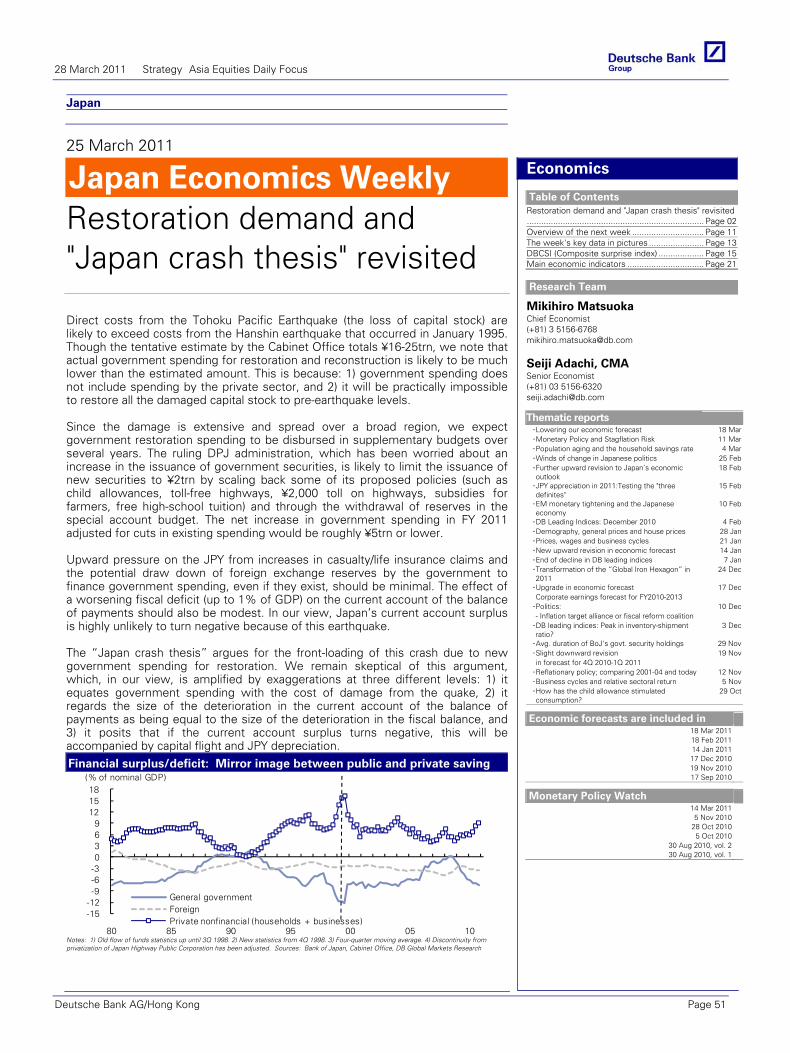
Japan
25 March 2011
Japan Economics Weekly Restoration demand and "Japan crash thesis" revisited
Economics
Table of Contents Restoration demand and "Japan crash thesis" revisited.......................................................................... Page 02Overview of the next week .............................. Page 11The week's key data in pictures ....................... Page 13DBCSI (Composite surprise index) ................... Page 15Main economic indicators ................................ Page 21
Research Team
Mikihiro Matsuoka Chief Economist (+81) 3 5156-6768 [email protected]
Seiji Adachi, CMA Senior Economist (+81) 03 5156-6320 [email protected]
Eco
no
mic
s
Direct costs from the Tohoku Pacific Earthquake (the loss of capital stock) are likely to exceed costs from the Hanshin earthquake that occurred in January 1995. Though the tentative estimate by the Cabinet Office totals ¥16-25trn, we note that actual government spending for restoration and reconstruction is likely to be much lower than the estimated amount. This is because: 1) government spending does not include spending by the private sector, and 2) it will be practically impossible to restore all the damaged capital stock to pre-earthquake levels. Since the damage is extensive and spread over a broad region, we expect government restoration spending to be disbursed in supplementary budgets over several years. The ruling DPJ administration, which has been worried about an increase in the issuance of government securities, is likely to limit the issuance of new securities to ¥2trn by scaling back some of its proposed policies (such as child allowances, toll-free highways, ¥2,000 toll on highways, subsidies for farmers, free high-school tuition) and through the withdrawal of reserves in the special account budget. The net increase in government spending in FY 2011 adjusted for cuts in existing spending would be roughly ¥5trn or lower. Upward pressure on the JPY from increases in casualty/life insurance claims and the potential draw down of foreign exchange reserves by the government to finance government spending, even if they exist, should be minimal. The effect of a worsening fiscal deficit (up to 1% of GDP) on the current account of the balance of payments should also be modest. In our view, Japan’s current account surplus is highly unlikely to turn negative because of this earthquake. The “Japan crash thesis” argues for the front-loading of this crash due to new government spending for restoration. We remain skeptical of this argument, which, in our view, is amplified by exaggerations at three different levels: 1) it equates government spending with the cost of damage from the quake, 2) it regards the size of the deterioration in the current account of the balance of payments as being equal to the size of the deterioration in the fiscal balance, and 3) it posits that if the current account surplus turns negative, this will be accompanied by capital flight and JPY depreciation. Financial surplus/deficit: Mirror image between public and private saving
-15-12-9-6-30369
121518
80 85 90 95 00 05 10
General governmentForeignPrivate nonfinancial (households + businesses)
(% of nominal GDP)
Notes: 1) Old flow of funds statistics up until 3Q 1998. 2) New statistics from 4Q 1998. 3) Four-quarter moving average. 4) Discontinuity from privatization of Japan Highway Public Corporation has been adjusted. Sources: Bank of Japan, Cabinet Office, DB Global Markets Research
Thematic reports ・Lowering our economic forecast 18 Mar・Monetary Policy and Stagflation Risk 11 Mar・Population aging and the household savings rate 4 Mar・Winds of change in Japanese politics 25 Feb・Further upward revision to Japan’s economic outlook
18 Feb
・JPY appreciation in 2011:Testing the "three definites"
15 Feb
・EM monetary tightening and the Japanese economy
10 Feb
・DB Leading Indices: December 2010 4 Feb・Demography, general prices and house prices 28 Jan・Prices, wages and business cycles 21 Jan・New upward revision in economic forecast 14 Jan・End of decline in DB leading indices 7 Jan・Transformation of the “Global Iron Hexagon” in 2011
24 Dec
・Upgrade in economic forecast 17 DecCorporate earnings forecast for FY2010-2013 ・Politics: 10 Dec- Inflation target alliance or fiscal reform coalition ・DB leading indices: Peak in inventory-shipment ratio?
3 Dec
・Avg. duration of BoJ's govt. security holdings 29 Nov・Slight downward revision 19 Novin forecast for 4Q 2010-1Q 2011 ・Reflationary policy; comparing 2001-04 and today 12 Nov・Business cycles and relative sectoral return 5 Nov・How has the child allowance stimulated consumption?
29 Oct
Economic forecasts are included in 18 Mar 201118 Feb 201114 Jan 201117 Dec 201019 Nov 201017 Sep 2010
Monetary Policy Watch 14 Mar 20115 Nov 2010
28 Oct 20105 Oct 2010
30 Aug 2010, vol. 230 Aug 2010, vol. 1
28 March 2011 Strategy Asia Equities Daily Focus
Deutsche Bank AG/Hong Kong Page 51
28 March 2011 Strategy Asia Equities Daily Focus
Appendix 1 Important Disclosures
Additional information available upon request
For disclosures pertaining to recommendations or estimates made on a security mentioned in this report, please see the most recently published company report or visit our global disclosure look-up page on our website at http://gm.db.com/ger/disclosure/DisclosureDirectory.eqsr.
Analyst Certification
The views expressed in this report accurately reflect the personal views of the undersigned lead analyst about the subject issuers and the securities of those issuers. In addition, the undersigned lead analyst has not and will not receive any compensation for providing a specific recommendation or view in this report. Ching-Li Teo
Equity rating key Equity rating dispersion and banking relationships Buy: Based on a current 12- month view of total share-holder return (TSR = percentage change in share price from current price to projected target price plus pro-jected dividend yield ) , we recommend that investors buy the stock. Sell: Based on a current 12-month view of total share-holder return, we recommend that investors sell the stock Hold: We take a neutral view on the stock 12-months out and, based on this time horizon, do not recommend either a Buy or Sell. Notes: 1. Newly issued research recommendations and target prices always supersede previously published research.2. Ratings definitions prior to 27 January, 2007 were:
Buy: Expected total return (including dividends) of 10% or more over a 12-month period Hold: Expected total return (including dividends) between -10% and 10% over a 12-month period Sell: Expected total return (including dividends) of -10% or worse over a 12-month period
7%
32%
61%
11%12%13%
0
100
200
300
400
500
Buy Hold Sell
Asia-Pacific Universe
Companies Covered Cos. w/ Banking Relationship
Page 52 Deutsche Bank AG/Hong Kong
28 March 2011 Strategy Asia Equities Daily Focus
Deutsche Bank AG/Hong Kong Page 53
Regulatory Disclosures
1. Important Additional Conflict Disclosures
Aside from within this report, important conflict disclosures can also be found at https://gm.db.com/equities under the "Disclosures Lookup" and "Legal" tabs. Investors are strongly encouraged to review this information before investing.
2. Short-Term Trade Ideas
Deutsche Bank equity research analysts sometimes have shorter-term trade ideas (known as SOLAR ideas) that are consistent or inconsistent with Deutsche Bank's existing longer term ratings. These trade ideas can be found at the SOLAR link at http://gm.db.com.
3. Country-Specific Disclosures
Australia: This research, and any access to it, is intended only for "wholesale clients" within the meaning of the Australian Corporations Act. Brazil: The views expressed above accurately reflect personal views of the authors about the subject company(ies) and its(their) securities, including in relation to Deutsche Bank. The compensation of the equity research analyst(s) is indirectly affected by revenues deriving from the business and financial transactions of Deutsche Bank. EU countries: Disclosures relating to our obligations under MiFiD can be found at http://globalmarkets.db.com/riskdisclosures. Japan: Disclosures under the Financial Instruments and Exchange Law: Company name - Deutsche Securities Inc. Registration number - Registered as a financial instruments dealer by the Head of the Kanto Local Finance Bureau (Kinsho) No. 117. Member of associations: JSDA, The Financial Futures Association of Japan. Commissions and risks involved in stock transactions - for stock transactions, we charge stock commissions and consumption tax by multiplying the transaction amount by the commission rate agreed with each customer. Stock transactions can lead to losses as a result of share price fluctuations and other factors. Transactions in foreign stocks can lead to additional losses stemming from foreign exchange fluctuations. "Moody's", "Standard & Poor's", and "Fitch" mentioned in this report are not registered as rating agency in Japan unless specifically indicated as Japan entities of such rating agencies. New Zealand: This research is not intended for, and should not be given to, "members of the public" within the meaning of the New Zealand Securities Market Act 1988. Russia: This information, interpretation and opinions submitted herein are not in the context of, and do not constitute, any appraisal or evaluation activity requiring a license in the Russian Federation.
Deutsche Bank AG/Hong Kong
North American locations
Deutsche Bank Securities Inc. 60 Wall Street New York, NY 10005 Tel: (212) 250 2500
Deutsche Bank Securities Inc. One International Place 12th Floor Boston, MA 02110 United States of America Tel: (1) 617 217 6100
Deutsche Bank Securities Inc. 222 South Riverside Plaza
Deutsche Bank Securities Inc. 3033 East First Avenue
30th Floor Suite 303, Third Floor Chicago, IL 60606 Denver, CO 80206 Tel: (312) 537-3758 Tel: (303) 394 6800
Deutsche Bank Securities Inc. Deutsche Bank Securities Inc. Deutsche Bank Securities Inc. 1735 Market Street 101 California Street 700 Louisiana Street 24th Floor 46th Floor Houston, TX 77002 Philadelphia, PA 19103 San Francisco, CA 94111 Tel: (832) 239-4600 Tel: (215) 854 1546 Tel: (415) 617 2800
International locations
Deutsche Bank Securities Inc. Deutsche Bank AG London Deutsche Bank AG Deutsche Bank AG 60 Wall Street 1 Great Winchester Street Große Gallusstraße 10-14 Deutsche Bank Place New York, NY 10005 London EC2N 2EQ 60272 Frankfurt am Main Level 16
United States of America United Kingdom Germany Corner of Hunter & Phillip Streets Tel: (1) 212 250 2500 Tel: (44) 20 7545 8000 Tel: (49) 69 910 00 Sydney, NSW 2000
Australia Tel: (61) 2 8258 1234
Deutsche Securities Inc. Deutsche Bank AG Level 55 2-11-1 Nagatacho Cheung Kong Center Sanno Park Tower 2 Queen's Road Central Chiyoda-ku, Tokyo 100-6171 Hong Kong Japan Tel: (852) 2203 8888 Tel: (81) 3 5156 6701
Global Disclaimer The information and opinions in this report were prepared by Deutsche Bank AG or one of its affiliates (collectively "Deutsche Bank"). The information herein is believed to be reliable and has been obtained from public sources believed to be reliable. Deutsche Bank makes no representation as to the accuracy or completeness of such information.
Deutsche Bank may engage in securities transactions, on a proprietary basis or otherwise, in a manner inconsistent with the view taken in this research report. In addition, others within Deutsche Bank, including strategists and sales staff, may take a view that is inconsistent with that taken in this research report.
Opinions, estimates and projections in this report constitute the current judgement of the author as of the date of this report. They do not necessarily reflect the opinions of Deutsche Bank and are subject to change without notice. Deutsche Bank has no obligation to update, modify or amend this report or to otherwise notify a recipient thereof in the event that any opinion, forecast or estimate set forth herein, changes or subsequently becomes inaccurate. Prices and availability of financial instruments are subject to change without notice. This report is provided for informational purposes only. It is not an offer or a solicitation of an offer to buy or sell any financial instruments or to participate in any particular trading strategy. Target prices are inherently imprecise and a product of the analyst judgement.
As a result of Deutsche Bank’s recent acquisition of BHF-Bank AG, a security may be covered by more than one analyst within the Deutsche Bank group. Each of these analysts may use differing methodologies to value the security; as a result, the recommendations may differ and the price targets and estimates of each may vary widely.
Deutsche Bank has instituted a new policy whereby analysts may choose not to set or maintain a target price of certain issuers under coverage with a Hold rating. In particular, this will typically occur for "Hold" rated stocks having a market cap smaller than most other companies in its sector or region. We believe that such policy will allow us to make best use of our resources. Please visit our website at http://gm.db.com to determine the target price of any stock.
The financial instruments discussed in this report may not be suitable for all investors and investors must make their own informed investment decisions. Stock transactions can lead to losses as a result of price fluctuations and other factors. If a financial instrument is denominated in a currency other than an investor's currency, a change in exchange rates may adversely affect the investment. Past performance is not necessarily indicative of future results. Deutsche Bank may with respect to securities covered by this report, sell to or buy from customers on a principal basis, and consider this report in deciding to trade on a proprietary basis.
Unless governing law provides otherwise, all transactions should be executed through the Deutsche Bank entity in the investor's home jurisdiction. In the U.S. this report is approved and/or distributed by Deutsche Bank Securities Inc., a member of the NYSE, the NASD, NFA and SIPC. In Germany this report is approved and/or communicated by Deutsche Bank AG Frankfurt authorized by the BaFin. In the United Kingdom this report is approved and/or communicated by Deutsche Bank AG London, a member of the London Stock Exchange and regulated by the Financial Services Authority for the conduct of investment business in the UK and authorized by the BaFin. This report is distributed in Hong Kong by Deutsche Bank AG, Hong Kong Branch, in Korea by Deutsche Securities Korea Co. This report is distributed in Singapore by Deutsche Bank AG, Singapore Branch, and recipients in Singapore of this report are to contact Deutsche Bank AG, Singapore Branch in respect of any matters arising from, or in connection with, this report. Where this report is issued or promulgated in Singapore to a person who is not an accredited investor, expert investor or institutional investor (as defined in the applicable Singapore laws and regulations), Deutsche Bank AG, Singapore Branch accepts legal responsibility to such person for the contents of this report. In Japan this report is approved and/or distributed by Deutsche Securities Inc. The information contained in this report does not constitute the provision of investment advice. In Australia, retail clients should obtain a copy of a Product Disclosure Statement (PDS) relating to any financial product referred to in this report and consider the PDS before making any decision about whether to acquire the product. Deutsche Bank AG Johannesburg is incorporated in the Federal Republic of Germany (Branch Register Number in South Africa: 1998/003298/10). Additional information relative to securities, other financial products or issuers discussed in this report is available upon request. This report may not be reproduced, distributed or published by any person for any purpose without Deutsche Bank's prior written consent. Please cite source when quoting.
Copyright © 2011 Deutsche Bank AG