Embed Size (px)
Citation preview
1
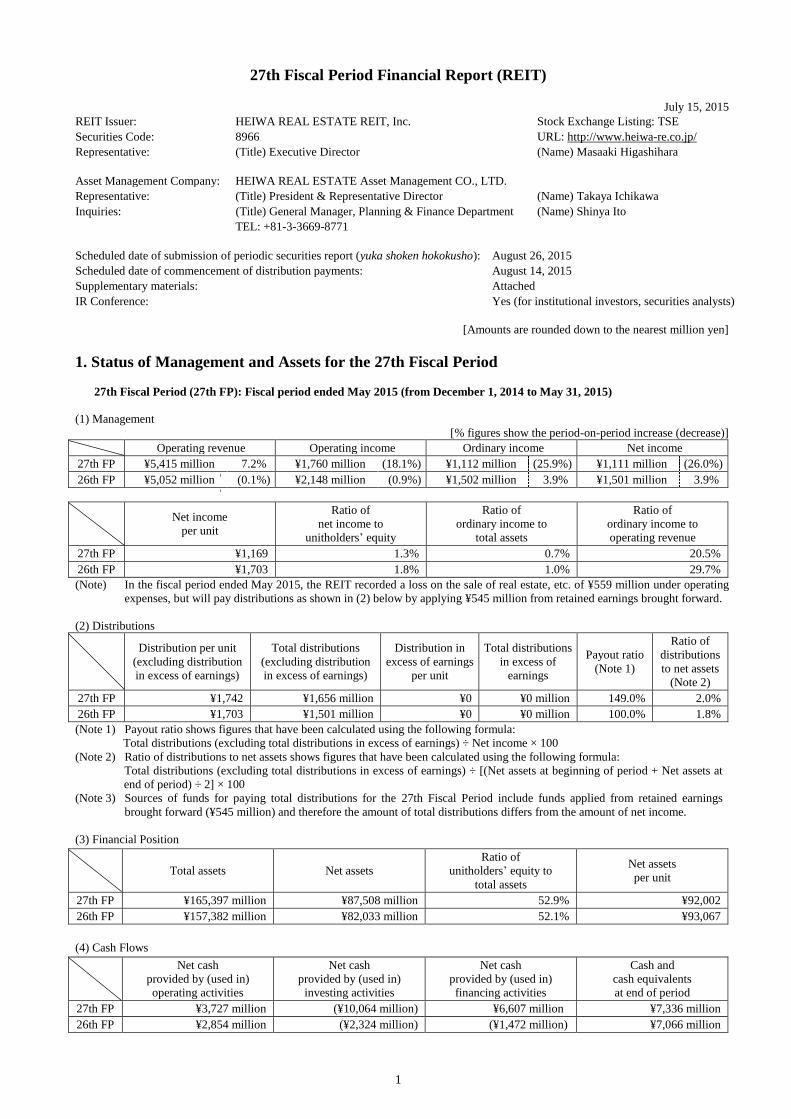
27th Fiscal Period Financial Report (REIT)
July 15, 2015
REIT Issuer: HEIWA REAL ESTATE REIT, Inc. Stock Exchange Listing: TSE
Securities Code: 8966 URL: http://www.heiwa-re.co.jp/
Representative: (Title) Executive Director (Name) Masaaki Higashihara
Asset Management Company: HEIWA REAL ESTATE Asset Management CO., LTD.
Representative: (Title) President & Representative Director (Name) Takaya Ichikawa
Inquiries: (Title) General Manager, Planning & Finance Department (Name) Shinya Ito
TEL: +81-3-3669-8771
Scheduled date of submission of periodic securities report (yuka shoken hokokusho): August 26, 2015
Scheduled date of commencement of distribution payments: August 14, 2015
Supplementary materials: Attached
IR Conference: Yes (for institutional investors, securities analysts)
[Amounts are rounded down to the nearest million yen]
1. Status of Management and Assets for the 27th Fiscal Period
27th Fiscal Period (27th FP): Fiscal period ended May 2015 (from December 1, 2014 to May 31, 2015)
(1) Management
[% figures show the period-on-period increase (decrease)]
Operating revenue Operating income Ordinary income Net income
27th FP ¥5,415 million 7.2% ¥1,760 million (18.1%) ¥1,112 million (25.9%) ¥1,111 million (26.0%)
26th FP ¥5,052 million (0.1%) ¥2,148 million (0.9%) ¥1,502 million 3.9% ¥1,501 million 3.9%
Net income
per unit
Ratio of
net income to
unitholders’ equity
Ratio of
ordinary income to
total assets
Ratio of
ordinary income to
operating revenue
27th FP ¥1,169 1.3% 0.7% 20.5%
26th FP ¥1,703 1.8% 1.0% 29.7%
(Note) In the fiscal period ended May 2015, the REIT recorded a loss on the sale of real estate, etc. of ¥559 million under operating
expenses, but will pay distributions as shown in (2) below by applying ¥545 million from retained earnings brought forward.
(2) Distributions
Distribution per unit
(excluding distribution
in excess of earnings)
Total distributions
(excluding distribution
in excess of earnings)
Distribution in
excess of earnings
per unit
Total distributions
in excess of
earnings
Payout ratio
(Note 1)
Ratio of
distributions
to net assets
(Note 2)
27th FP ¥1,742 ¥1,656 million ¥0 ¥0 million 149.0% 2.0%
26th FP ¥1,703 ¥1,501 million ¥0 ¥0 million 100.0% 1.8%
(Note 1) Payout ratio shows figures that have been calculated using the following formula:
Total distributions (excluding total distributions in excess of earnings) ÷ Net income × 100
(Note 2) Ratio of distributions to net assets shows figures that have been calculated using the following formula:
Total distributions (excluding total distributions in excess of earnings) ÷ [(Net assets at beginning of period + Net assets at
end of period) ÷ 2] × 100
(Note 3) Sources of funds for paying total distributions for the 27th Fiscal Period include funds applied from retained earnings
brought forward (¥545 million) and therefore the amount of total distributions differs from the amount of net income.
(3) Financial Position
Total assets Net assets
Ratio of
unitholders’ equity to
total assets
Net assets
per unit
27th FP ¥165,397 million ¥87,508 million 52.9% ¥92,002
26th FP ¥157,382 million ¥82,033 million 52.1% ¥93,067
(4) Cash Flows
Net cash
provided by (used in)
operating activities
Net cash
provided by (used in)
investing activities
Net cash
provided by (used in)
financing activities
Cash and
cash equivalents
at end of period
27th FP ¥3,727 million (¥10,064 million) ¥6,607 million ¥7,336 million
26th FP ¥2,854 million (¥2,324 million) (¥1,472 million) ¥7,066 million
HEIWA REAL ESTATE REIT, Inc. (8966) 27th Fiscal Period Financial Report
2
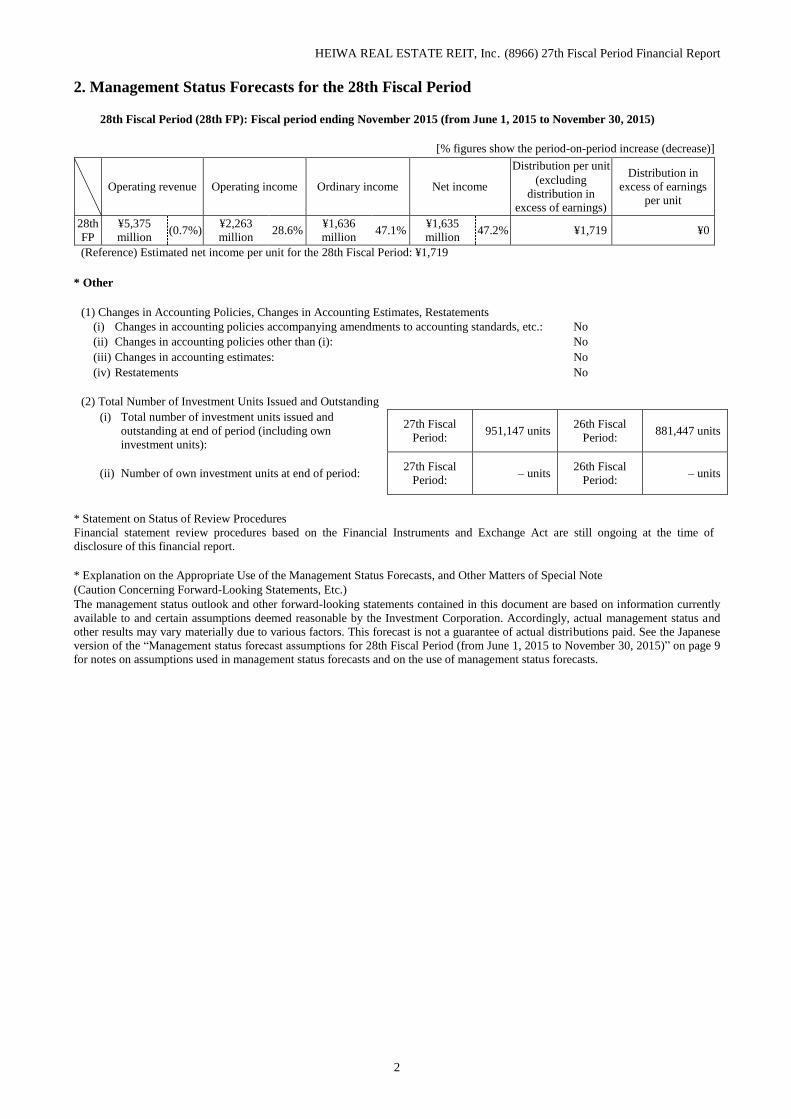
2. Management Status Forecasts for the 28th Fiscal Period
28th Fiscal Period (28th FP): Fiscal period ending November 2015 (from June 1, 2015 to November 30, 2015)
[% figures show the period-on-period increase (decrease)]
Operating revenue Operating income Ordinary income Net income
Distribution per unit
(excluding
distribution in
excess of earnings)
Distribution in
excess of earnings
per unit
28th
FP
¥5,375
million (0.7%)
¥2,263
million 28.6%
¥1,636
million 47.1%
¥1,635
million 47.2% ¥1,719 ¥0
(Reference) Estimated net income per unit for the 28th Fiscal Period: ¥1,719
* Other
(1) Changes in Accounting Policies, Changes in Accounting Estimates, Restatements
(i) Changes in accounting policies accompanying amendments to accounting standards, etc.: No
(ii) Changes in accounting policies other than (i): No
(iii) Changes in accounting estimates: No
(iv) Restatements No
(2) Total Number of Investment Units Issued and Outstanding
(i) Total number of investment units issued and
outstanding at end of period (including own
investment units):
27th Fiscal
Period: 951,147 units
26th Fiscal
Period: 881,447 units
(ii) Number of own investment units at end of period: 27th Fiscal
Period: ‒ units
26th Fiscal
Period: ‒ units
* Statement on Status of Review Procedures
Financial statement review procedures based on the Financial Instruments and Exchange Act are still ongoing at the time of
disclosure of this financial report.
* Explanation on the Appropriate Use of the Management Status Forecasts, and Other Matters of Special Note
(Caution Concerning Forward-Looking Statements, Etc.)
The management status outlook and other forward-looking statements contained in this document are based on information currently
available to and certain assumptions deemed reasonable by the Investment Corporation. Accordingly, actual management status and
other results may vary materially due to various factors. This forecast is not a guarantee of actual distributions paid. See the Japanese
version of the “Management status forecast assumptions for 28th Fiscal Period (from June 1, 2015 to November 30, 2015)” on page 9
for notes on assumptions used in management status forecasts and on the use of management status forecasts.
HEIWA REAL ESTATE REIT, Inc. (8966) 27th Fiscal Period Financial Report
3
1. Related Corporations of the REIT
No disclosure necessary, since there have been no material changes from “Structure of the REIT” in the most
recent Annual Securities Report (submitted February 25, 2015).
2. Operating Policies and Operations
(1) Operating policies
No disclosure necessary, since there have been no material changes from “Investment policies,” “Targets of
investments” and “Distributions policy” in the most recent Annual Securities Report (submitted February 25,
2015).
(2) Operations
a. General situation during the 27th Fiscal Period
The REIT is striving based on its Basic Philosophy of “Steady Growth of Assets Under Management” and
“Stable Medium- to Long-Term Profits,” as well as “Active Use of the Heiwa Real Estate Group” (below,
collectively referring to Heiwa Real Estate Co., Ltd. [below, “Heiwa Real Estate”] and the subsidiaries of Heiwa
Real Estate; the same hereinafter) to manage its assets with the purpose of maximizing investor’s value.
Following is a summary of our asset management during the 27th Fiscal Period.
(i) Brief background of the REIT
Investment units in the REIT have been listed on the Real Estate Investment Trust Section (J-REIT Section) of
the Tokyo Stock Exchange (below, TSE) since March 8, 2005 (Securities Code: 8966). Subsequently, the REIT
executed a capital increase through public offering and underwriting of investment units issued through private
placement on several occasions and an investment unit split and investment unit issuance through a merger with
Japan Single-residence REIT Inc. (below, JSR) on October 1, 2010 (below, this event is referred to as the merger)
by the 22nd Fiscal Period. During the Fiscal Period under review, the REIT executed a capital increase through
public offering in December 2014 and applied the proceeds as part of the funds to acquire three office spaces and
one residential building. As a result, total investment units outstanding were 951,147 and unitholders' capital was
76,372 million yen as of the end of the 27th Fiscal Period.
(ii) Operating environment
The Japanese economy during the 27th Fiscal Period at last showed signs of an upturn, as the stimulus measures
adopted by the Japanese government and the expansion of quantitative and qualitative monetary easing by the
Bank of Japan fostered continued improvement in corporate earnings and the employment and income
environment throughout the fiscal period, offsetting continued year-on-year falls in personal consumption for a
time due to a decline in reaction to the rush demand before the consumption tax hike. Under these circumstances,
the TSE REIT Index remained at a level exceeding 1,800 points throughout the fiscal period, rising to 1,866.06
points as of May 31, 2015, after ending the previous fiscal period at 1,826.72 points, due to the effect of
additional monetary easing by the Bank of Japan on October 31, 2014.
(a) Office building leasing market
The latest office building market data from Miki Shoji Co., Ltd. shows a decline in the average office building
vacancy rate in the five central wards of Tokyo (Chiyoda, Minato, Chuo, Shibuya and Shinjuku), to 5.17% at
the end of the 27th Fiscal Period (May 2015) from 5.55% as of the end of the 26th Fiscal Period (November
2014) as a result of steady reduction in vacancies at existing office buildings, offsetting a rise mainly due to the
impact of the completion of large office buildings. The office building leasing market is showing signs of a
steady improvement trend driven by an increase in demand for office space backed by improved corporate
economic sentiment. Average rents level also rose steadily from 16,950 yen per tsubo at the end of the previous
Fiscal Period to 17,320 yen per tsubo at the end of the Fiscal Period under review, and there is a noticeable
improvement trend in market rents.
HEIWA REAL ESTATE REIT, Inc. (8966) 27th Fiscal Period Financial Report
4
(b) Residential leasing market
According to the IPD/Recruit Residential Index, rents for rental apartments in the metropolitan areas in May
2015 rose 0.94% compared to the same month of the previous year, indicating that demand for rental housing is
decent due to continuous net positive migration into the metropolitan areas and an increasing number of
households with relatively few members, and since, in the meantime, new housing starts for rental housing
were almost unchanged from the year-ago level and supply remained limited, the supply-demand trend on the
residential leasing market remained firm. For assets under management by the REIT, occupancy rates remained
high throughout the Fiscal Period under review, and the number of properties with higher rent levels increased,
contributing to a steady rise in profitability. The outlook for the residential market remains stable, buoyed by
the further advancement of improvements in employment and consumption in the economic recovery process.
(c) Real estate
According to official land prices as of January 1, 2015 announced in March 2015, average land prices in
Japan’s three major metropolitan areas (Tokyo, Osaka and Nagoya) maintained last year’s upward trend in both
the residential and commercial areas. A breakdown shows that in the Tokyo and Nagoya areas, official land
prices in residential areas rose for a second consecutive year amid growth in housing demand fueled by
improvement in economic sentiment, while official land prices in commercial areas climbed for a second
straight year in all three areas. The rise in official land prices in residential areas can be largely attributed to
firm housing demand driven by low interest rates and mortgage tax breaks, whilst the increase in official land
prices in commercial areas is primarily attributable to increased demand for real estate for investment due to the
favorable funding environment created mainly by low interest rates and due to the downward trend in the
vacancy rate of office buildings in major city centers and signs of improvement in rents in certain regional
areas.
In contrast, official land prices in the regional areas continued to fall, both in the residential and commercial
areas. However, the size of the decline was smaller in both the residential and commercial areas.
(iii) Management performance
(a) External growth
The REIT acquired three office buildings (Of-33Daiwa Ueno Building (trust beneficial interest, acquisition
price 3,400 million yen), Of-34 Kojimachi HF Building (trust beneficial interest, acquisition price 1,350
million yen), Of-35 HF Kudanminami Building (trust beneficial interest, acquisition price 2,720 million yen)),
and one residential building (Re-75 HF Sendai Residence EAST (trust beneficial interest, acquisition price
1,630 million yen)) on December 4, 2014, for the purpose of improving its portfolio quality and increasing
profitability. On the other hand, the REIT sold one office property (Of-14 KCA Building (real estate,
acquisition price 1,730 million yen) on March 10, 2015. As a result, portfolio assets as of the period end were
95 properties (total acquisition price 155,039 million yen), including 30 office buildings (total acquisition price
of 68,006 million yen), 61 residential buildings (total acquisition price of 82,853 million yen) and four hotels
(total acquisition price 4,180 million yen).
(b) Internal growth
The REIT has consistently endeavored to increase profitability by improving and maintaining its occupancy
rates. During the 27th Fiscal Period, with the aim of maintaining the high occupancy rate achieved at the end of
the previous fiscal period, the REIT continued to be engaged in tenant leasing activities, working to shorten
vacancy duration as well as systematic efforts to increase its investment value based on tenant needs and the
characteristics of each individual property. Partly as a result of these initiatives of improving and maintaining
the competitiveness of its assets, the occupancy rate for all properties held by the REIT climber further to
96.84% as at the end of the 27th Fiscal Period. The REIT successfully maintained high and stable occupancy
throughout the period, resulting in a high average month-end occupancy rate of 97.27% for the fiscal period
under review, albeit lower than occupancy rate of 97.31% recorded at the end of the previous fiscal period.
Moreover, as part of the initiatives that the REIT has been working on continuously, it changed the names of
the following two managed assets in the period between the start of the fiscal period under review and the date
of this report, for the purpose of seeking to improve the caliber of its appeal to potential tenants and achieve
more efficient leasing.
HEIWA REAL ESTATE REIT, Inc. (8966) 27th Fiscal Period Financial Report
5
Properties renamed on January 5, 2015
Property no. Former property name New property name
Of-31 Nihonbashi Hamacho Central Building HF Nihonbashi Hamacho Building
Of-32 Sendai Green Place HF Sendai Honcho Building
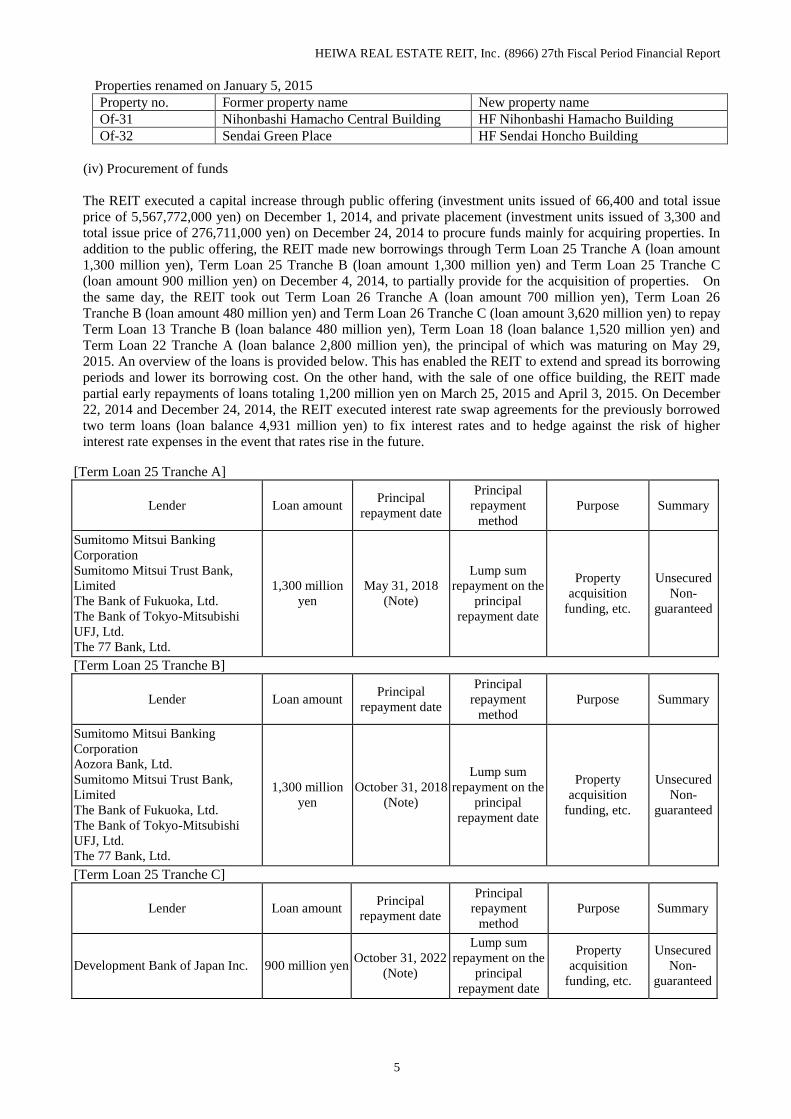
(iv) Procurement of funds
The REIT executed a capital increase through public offering (investment units issued of 66,400 and total issue
price of 5,567,772,000 yen) on December 1, 2014, and private placement (investment units issued of 3,300 and
total issue price of 276,711,000 yen) on December 24, 2014 to procure funds mainly for acquiring properties. In
addition to the public offering, the REIT made new borrowings through Term Loan 25 Tranche A (loan amount
1,300 million yen), Term Loan 25 Tranche B (loan amount 1,300 million yen) and Term Loan 25 Tranche C
(loan amount 900 million yen) on December 4, 2014, to partially provide for the acquisition of properties. On
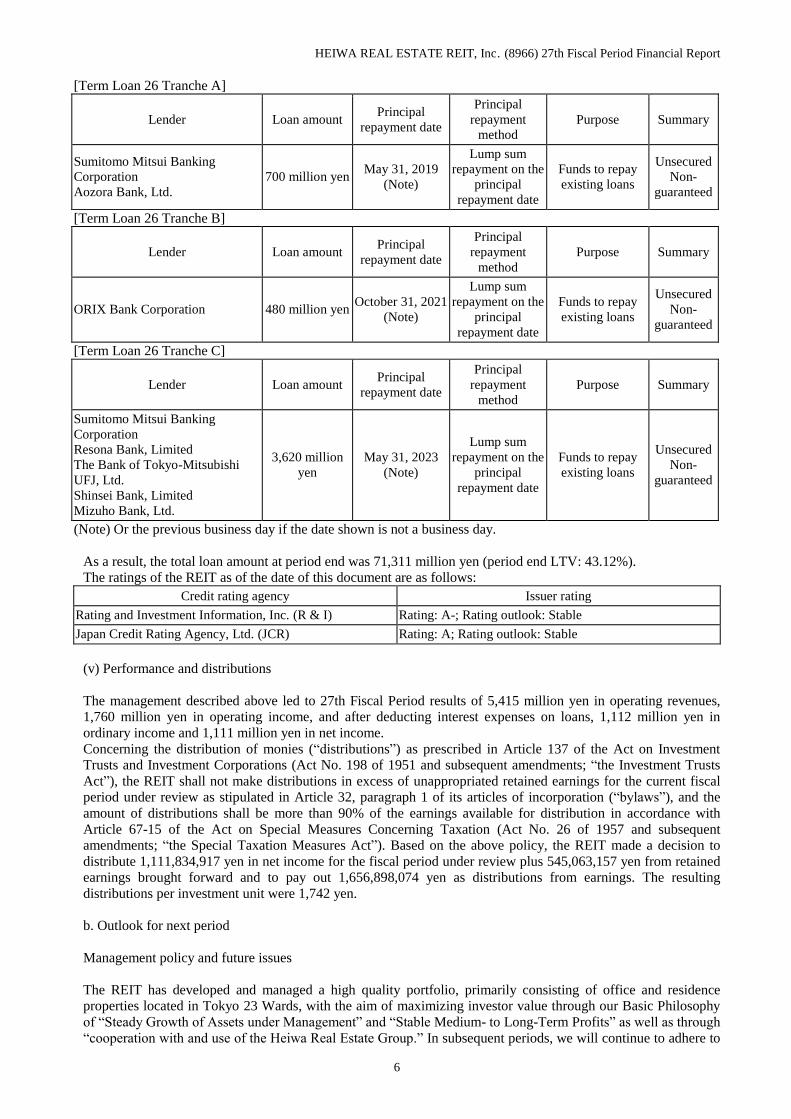
the same day, the REIT took out Term Loan 26 Tranche A (loan amount 700 million yen), Term Loan 26
Tranche B (loan amount 480 million yen) and Term Loan 26 Tranche C (loan amount 3,620 million yen) to repay
Term Loan 13 Tranche B (loan balance 480 million yen), Term Loan 18 (loan balance 1,520 million yen) and
Term Loan 22 Tranche A (loan balance 2,800 million yen), the principal of which was maturing on May 29,
2015. An overview of the loans is provided below. This has enabled the REIT to extend and spread its borrowing
periods and lower its borrowing cost. On the other hand, with the sale of one office building, the REIT made
partial early repayments of loans totaling 1,200 million yen on March 25, 2015 and April 3, 2015. On December
22, 2014 and December 24, 2014, the REIT executed interest rate swap agreements for the previously borrowed
two term loans (loan balance 4,931 million yen) to fix interest rates and to hedge against the risk of higher
interest rate expenses in the event that rates rise in the future. [Term Loan 25 Tranche A]
Lender Loan amount Principal
repayment date
Principal
repayment
method
Purpose Summary
Sumitomo Mitsui Banking
Corporation
Sumitomo Mitsui Trust Bank,
Limited
The Bank of Fukuoka, Ltd.
The Bank of Tokyo-Mitsubishi
UFJ, Ltd.
The 77 Bank, Ltd.
1,300 million
yen
May 31, 2018
(Note)
Lump sum
repayment on the
principal
repayment date
Property
acquisition
funding, etc.
Unsecured
Non-
guaranteed
[Term Loan 25 Tranche B]
Lender Loan amount Principal
repayment date
Principal
repayment
method
Purpose Summary
Sumitomo Mitsui Banking
Corporation
Aozora Bank, Ltd.
Sumitomo Mitsui Trust Bank,
Limited
The Bank of Fukuoka, Ltd.
The Bank of Tokyo-Mitsubishi
UFJ, Ltd.
The 77 Bank, Ltd.
1,300 million
yen
October 31, 2018
(Note)
Lump sum
repayment on the
principal
repayment date
Property
acquisition
funding, etc.
Unsecured
Non-
guaranteed
[Term Loan 25 Tranche C]
Lender Loan amount Principal
repayment date
Principal
repayment
method
Purpose Summary
Development Bank of Japan Inc. 900 million yen October 31, 2022
(Note)
Lump sum
repayment on the
principal
repayment date
Property
acquisition
funding, etc.
Unsecured
Non-
guaranteed
HEIWA REAL ESTATE REIT, Inc. (8966) 27th Fiscal Period Financial Report
6
[Term Loan 26 Tranche A]
Lender Loan amount Principal
repayment date
Principal
repayment
method
Purpose Summary
Sumitomo Mitsui Banking
Corporation
Aozora Bank, Ltd.
700 million yen May 31, 2019
(Note)
Lump sum
repayment on the
principal
repayment date
Funds to repay
existing loans
Unsecured
Non-
guaranteed
[Term Loan 26 Tranche B]
Lender Loan amount Principal
repayment date
Principal
repayment
method
Purpose Summary
ORIX Bank Corporation 480 million yen October 31, 2021
(Note)
Lump sum
repayment on the
principal
repayment date
Funds to repay
existing loans
Unsecured
Non-
guaranteed
[Term Loan 26 Tranche C]
Lender Loan amount Principal
repayment date
Principal
repayment
method
Purpose Summary
Sumitomo Mitsui Banking
Corporation
Resona Bank, Limited
The Bank of Tokyo-Mitsubishi
UFJ, Ltd.
Shinsei Bank, Limited
Mizuho Bank, Ltd.
3,620 million
yen
May 31, 2023
(Note)
Lump sum
repayment on the
principal
repayment date
Funds to repay
existing loans
Unsecured
Non-
guaranteed
(Note) Or the previous business day if the date shown is not a business day.
As a result, the total loan amount at period end was 71,311 million yen (period end LTV: 43.12%).
The ratings of the REIT as of the date of this document are as follows:
Credit rating agency Issuer rating
Rating and Investment Information, Inc. (R & I) Rating: A-; Rating outlook: Stable
Japan Credit Rating Agency, Ltd. (JCR) Rating: A; Rating outlook: Stable
(v) Performance and distributions
The management described above led to 27th Fiscal Period results of 5,415 million yen in operating revenues,
1,760 million yen in operating income, and after deducting interest expenses on loans, 1,112 million yen in
ordinary income and 1,111 million yen in net income.
Concerning the distribution of monies (“distributions”) as prescribed in Article 137 of the Act on Investment
Trusts and Investment Corporations (Act No. 198 of 1951 and subsequent amendments; “the Investment Trusts
Act”), the REIT shall not make distributions in excess of unappropriated retained earnings for the current fiscal
period under review as stipulated in Article 32, paragraph 1 of its articles of incorporation (“bylaws”), and the
amount of distributions shall be more than 90% of the earnings available for distribution in accordance with
Article 67-15 of the Act on Special Measures Concerning Taxation (Act No. 26 of 1957 and subsequent
amendments; “the Special Taxation Measures Act”). Based on the above policy, the REIT made a decision to
distribute 1,111,834,917 yen in net income for the fiscal period under review plus 545,063,157 yen from retained
earnings brought forward and to pay out 1,656,898,074 yen as distributions from earnings. The resulting
distributions per investment unit were 1,742 yen.
b. Outlook for next period
Management policy and future issues
The REIT has developed and managed a high quality portfolio, primarily consisting of office and residence
properties located in Tokyo 23 Wards, with the aim of maximizing investor value through our Basic Philosophy
of “Steady Growth of Assets under Management” and “Stable Medium- to Long-Term Profits” as well as through
“cooperation with and use of the Heiwa Real Estate Group.” In subsequent periods, we will continue to adhere to
HEIWA REAL ESTATE REIT, Inc. (8966) 27th Fiscal Period Financial Report
7
the above philosophy, aiming to further maximize investor value through the stable management of our portfolio
and pursuing a strategy of steady growth.
(a) External growth
The REIT has endeavored in particular to enhance the quality of its portfolio and bolster its financial footing. It
executed a capital increase through public offering during the Fiscal Period under review and applied the
proceeds to acquire quality properties, while selling a property after its profitability declined, thereby
advancing both the quality enhancement of its portfolio and improvement of its financial health. While the
REIT will continue to seek expansion in the scale of its assets in the future, it will also consider the
replacement of assets, strive to enhance its medium- to long-term portfolio quality and aim to maximize
investor value. Given the sound financing environment and the expectations for higher property prices on the
back of the expected economic recovery, competitors are maintaining a strong appetite for the acquisition of
properties. As a result, the property acquisition environment is likely to remain challenging. We will endeavor
to promptly obtain information on excellent properties by using our pipeline with Heiwa Real Estate and
building up our unique information routes as an asset management company. As a basic strategy, we aim to
increase opportunities for primarily acquiring properties owned and developed by Heiwa Real Estate, and
additionally for acquiring properties owned and developed by other developers to expand our portfolio,
contributing to stable profitability over the medium to long term.
(b) Internal growth
The REIT believes that by using the database and information network developed by the Heiwa Real Estate
Group and its property management company, it can quickly detect leasing market trends and conduct precise
property management, enabling it to maintain and increase occupancy rates and rent levels in assets under
management. To maintain and increase occupancy rates, it will deal with tenants by focusing on minimizing
departures and will undertake leasing management, including reducing the period of time for work for
restoration to the original state, to shorten the period between the time when properties are vacated and the
acquisition of new tenants. To make our properties more competitive, we continuously and actively make
value-building investments in repairs and improvements of assets under management to maintain and enhance
their medium- to long-term value, taking into account each property’s asset age, facility level and other aspects.
Through these measures, our goal is to maintain and further improve occupancy rates at high and stable levels.
(c) Financial strategy
The REIT is actively implementing measures in an effort to stabilize its financial foundations and achieve
sustainable growth. Concerning borrowings, the REIT will continue to strive to extend its borrowing periods
and diversify maturities by maintaining an appropriate loan-to-value ratio, while promoting measures to reduce
risks from higher interest rates in the future and cut financial costs. It will also endeavor to further strengthen
its bank formation by strengthening its relationships with financial institutions. By implementing these
measures and initiatives on a continuous basis, the REIT will strive to build sound financial systems that are
resilient to changes in the funding environment.
(d) Promotion of more timely disclosure
We practice information disclosure that is accurate, fair and timely, complying with the TSE’s Securities
Listing Regulations and other regulations, laws, etc. relating to timely disclosure. The REIT discloses
information on its decisions on the acquisition of new properties, etc. as a rule at the time of the decision by a
REIT organization such as the Board of Directors, while events such as damage to assets under management
resulting from incidental occurrences are disclosed at the time they are discovered. As a rule, REIT information
is disclosed through the TSE’s TDnet, press releases to the TSE press club (Kabuto Club), Ministry of Land,
Infrastructure, Transport and Tourism Press Club, etc., and through the REIT’s website.
c. Significant subsequent events
Not applicable
HEIWA REAL ESTATE REIT, Inc. (8966) 27th Fiscal Period Financial Report
8
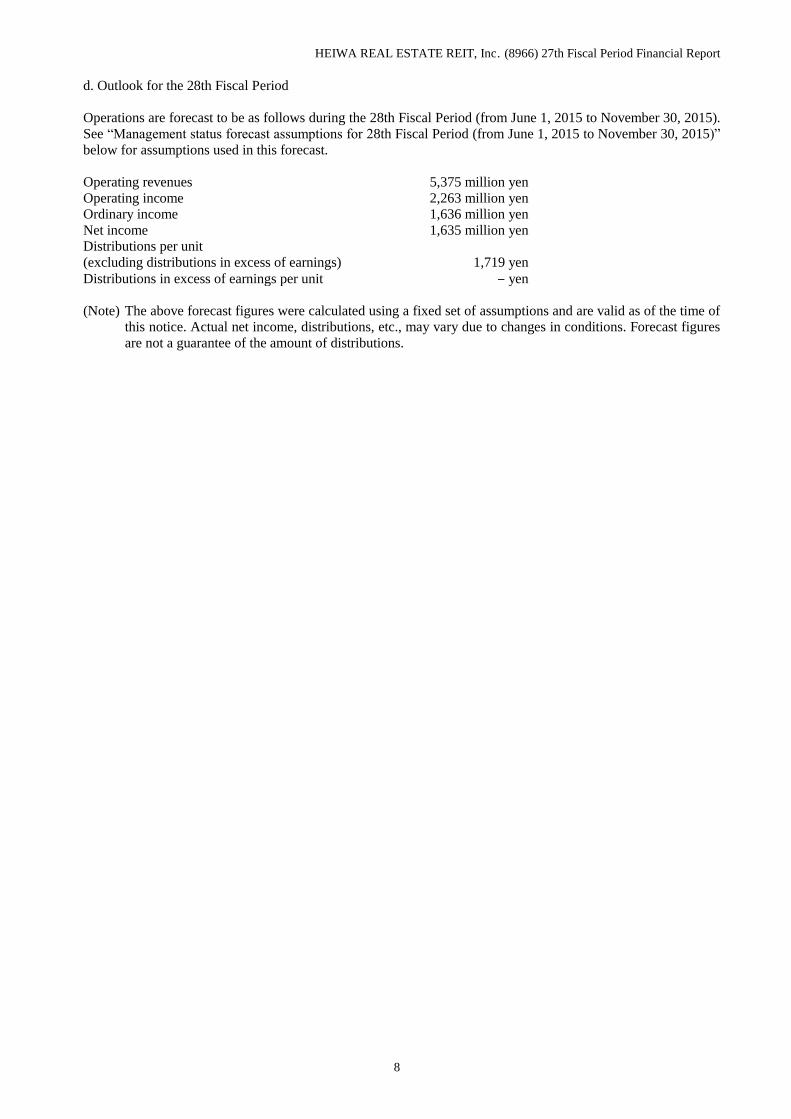
d. Outlook for the 28th Fiscal Period
Operations are forecast to be as follows during the 28th Fiscal Period (from June 1, 2015 to November 30, 2015).
See “Management status forecast assumptions for 28th Fiscal Period (from June 1, 2015 to November 30, 2015)”
below for assumptions used in this forecast.
Operating revenues 5,375 million yen
Operating income 2,263 million yen
Ordinary income 1,636 million yen
Net income 1,635 million yen
Distributions per unit
(excluding distributions in excess of earnings) 1,719 yen
Distributions in excess of earnings per unit ‒ yen
(Note) The above forecast figures were calculated using a fixed set of assumptions and are valid as of the time of
this notice. Actual net income, distributions, etc., may vary due to changes in conditions. Forecast figures
are not a guarantee of the amount of distributions.
HEIWA REAL ESTATE REIT, Inc. (8966) 27th Fiscal Period Financial Report
9
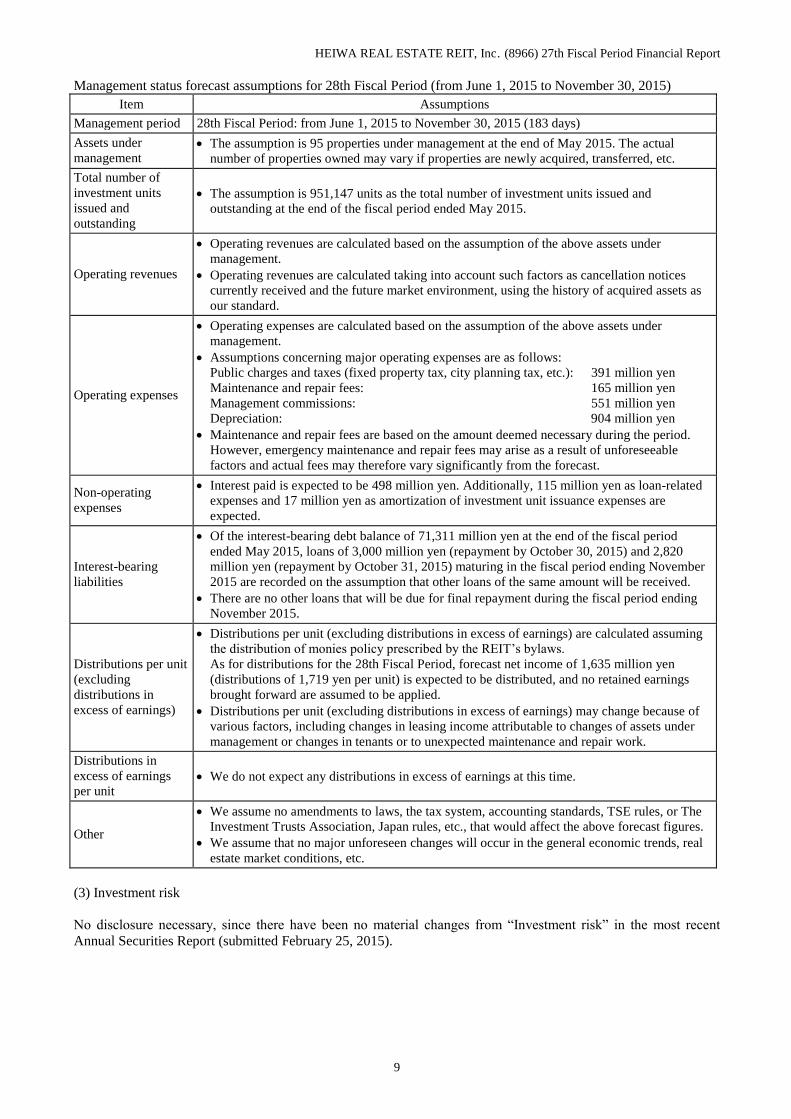
Management status forecast assumptions for 28th Fiscal Period (from June 1, 2015 to November 30, 2015)
Item Assumptions
Management period 28th Fiscal Period: from June 1, 2015 to November 30, 2015 (183 days)
Assets under
management The assumption is 95 properties under management at the end of May 2015. The actual
number of properties owned may vary if properties are newly acquired, transferred, etc.
Total number of
investment units
issued and
outstanding
The assumption is 951,147 units as the total number of investment units issued and
outstanding at the end of the fiscal period ended May 2015.
Operating revenues
Operating revenues are calculated based on the assumption of the above assets under
management.
Operating revenues are calculated taking into account such factors as cancellation notices
currently received and the future market environment, using the history of acquired assets as
our standard.
Operating expenses
Operating expenses are calculated based on the assumption of the above assets under
management.
Assumptions concerning major operating expenses are as follows:
Public charges and taxes (fixed property tax, city planning tax, etc.): 391 million yen
Maintenance and repair fees: 165 million yen
Management commissions: 551 million yen
Depreciation: 904 million yen
Maintenance and repair fees are based on the amount deemed necessary during the period.
However, emergency maintenance and repair fees may arise as a result of unforeseeable
factors and actual fees may therefore vary significantly from the forecast.
Non-operating
expenses
Interest paid is expected to be 498 million yen. Additionally, 115 million yen as loan-related
expenses and 17 million yen as amortization of investment unit issuance expenses are
expected.
Interest-bearing
liabilities
Of the interest-bearing debt balance of 71,311 million yen at the end of the fiscal period
ended May 2015, loans of 3,000 million yen (repayment by October 30, 2015) and 2,820
million yen (repayment by October 31, 2015) maturing in the fiscal period ending November
2015 are recorded on the assumption that other loans of the same amount will be received.
There are no other loans that will be due for final repayment during the fiscal period ending
November 2015.
Distributions per unit
(excluding
distributions in
excess of earnings)
Distributions per unit (excluding distributions in excess of earnings) are calculated assuming
the distribution of monies policy prescribed by the REIT’s bylaws.
As for distributions for the 28th Fiscal Period, forecast net income of 1,635 million yen
(distributions of 1,719 yen per unit) is expected to be distributed, and no retained earnings
brought forward are assumed to be applied.
Distributions per unit (excluding distributions in excess of earnings) may change because of
various factors, including changes in leasing income attributable to changes of assets under
management or changes in tenants or to unexpected maintenance and repair work.
Distributions in
excess of earnings
per unit We do not expect any distributions in excess of earnings at this time.
Other
We assume no amendments to laws, the tax system, accounting standards, TSE rules, or The
Investment Trusts Association, Japan rules, etc., that would affect the above forecast figures.
We assume that no major unforeseen changes will occur in the general economic trends, real
estate market conditions, etc.
(3) Investment risk
No disclosure necessary, since there have been no material changes from “Investment risk” in the most recent
Annual Securities Report (submitted February 25, 2015).
HEIWA REAL ESTATE REIT, Inc. (8966) 27th Fiscal Period Financial Report
10
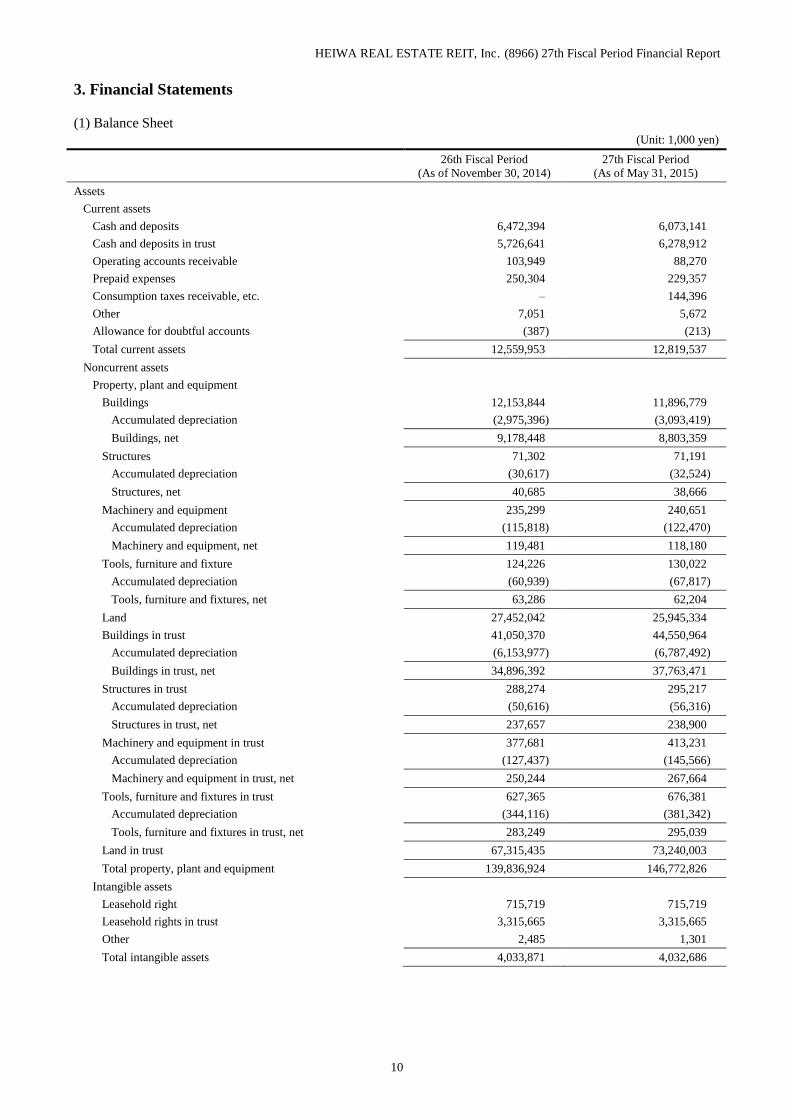
3. Financial Statements
(1) Balance Sheet
(Unit: 1,000 yen)
26th Fiscal Period
(As of November 30, 2014)
27th Fiscal Period
(As of May 31, 2015)
Assets
Current assets
Cash and deposits 6,472,394 6,073,141
Cash and deposits in trust 5,726,641 6,278,912
Operating accounts receivable 103,949 88,270
Prepaid expenses 250,304 229,357
Consumption taxes receivable, etc. – 144,396
Other 7,051 5,672
Allowance for doubtful accounts (387) (213)
Total current assets 12,559,953 12,819,537
Noncurrent assets
Property, plant and equipment
Buildings 12,153,844 11,896,779
Accumulated depreciation (2,975,396) (3,093,419)
Buildings, net 9,178,448 8,803,359
Structures 71,302 71,191
Accumulated depreciation (30,617) (32,524)
Structures, net 40,685 38,666
Machinery and equipment 235,299 240,651
Accumulated depreciation (115,818) (122,470)
Machinery and equipment, net 119,481 118,180
Tools, furniture and fixture 124,226 130,022
Accumulated depreciation (60,939) (67,817)
Tools, furniture and fixtures, net 63,286 62,204
Land 27,452,042 25,945,334
Buildings in trust 41,050,370 44,550,964
Accumulated depreciation (6,153,977) (6,787,492)
Buildings in trust, net 34,896,392 37,763,471
Structures in trust 288,274 295,217
Accumulated depreciation (50,616) (56,316)
Structures in trust, net 237,657 238,900
Machinery and equipment in trust 377,681 413,231
Accumulated depreciation (127,437) (145,566)
Machinery and equipment in trust, net 250,244 267,664
Tools, furniture and fixtures in trust 627,365 676,381
Accumulated depreciation (344,116) (381,342)
Tools, furniture and fixtures in trust, net 283,249 295,039
Land in trust 67,315,435 73,240,003
Total property, plant and equipment 139,836,924 146,772,826
Intangible assets
Leasehold right 715,719 715,719
Leasehold rights in trust 3,315,665 3,315,665
Other 2,485 1,301
Total intangible assets 4,033,871 4,032,686
HEIWA REAL ESTATE REIT, Inc. (8966) 27th Fiscal Period Financial Report
11
(Unit: 1,000 yen)
26th Fiscal Period
(As of November 30, 2014)
27th Fiscal Period
(As of May 31, 2015)
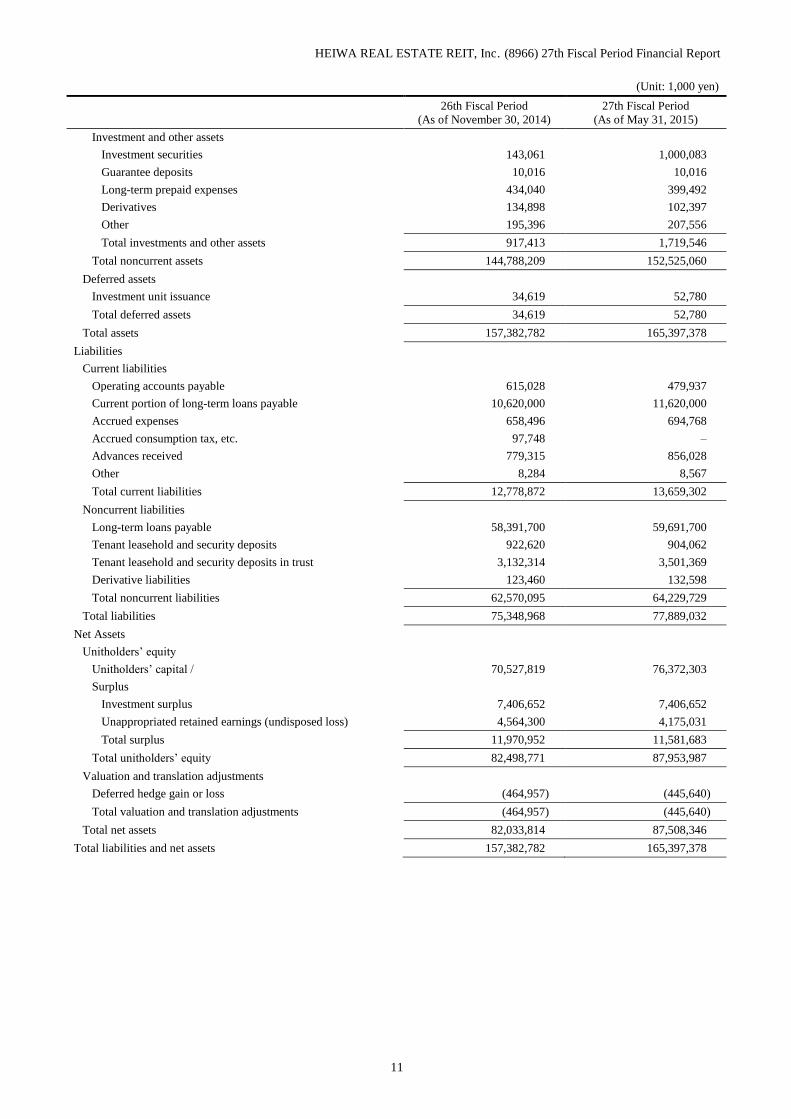
Investment and other assets
Investment securities 143,061 1,000,083
Guarantee deposits 10,016 10,016
Long-term prepaid expenses 434,040 399,492
Derivatives 134,898 102,397
Other 195,396 207,556
Total investments and other assets 917,413 1,719,546
Total noncurrent assets 144,788,209 152,525,060
Deferred assets
Investment unit issuance 34,619 52,780
Total deferred assets 34,619 52,780
Total assets 157,382,782 165,397,378
Liabilities
Current liabilities
Operating accounts payable 615,028 479,937
Current portion of long-term loans payable 10,620,000 11,620,000
Accrued expenses 658,496 694,768
Accrued consumption tax, etc. 97,748 –
Advances received 779,315 856,028
Other 8,284 8,567
Total current liabilities 12,778,872 13,659,302
Noncurrent liabilities
Long-term loans payable 58,391,700 59,691,700
Tenant leasehold and security deposits 922,620 904,062
Tenant leasehold and security deposits in trust 3,132,314 3,501,369
Derivative liabilities 123,460 132,598
Total noncurrent liabilities 62,570,095 64,229,729
Total liabilities 75,348,968 77,889,032
Net Assets
Unitholders’ equity
Unitholders’ capital / 70,527,819 76,372,303
Surplus
Investment surplus 7,406,652 7,406,652
Unappropriated retained earnings (undisposed loss) 4,564,300 4,175,031
Total surplus 11,970,952 11,581,683
Total unitholders’ equity 82,498,771 87,953,987
Valuation and translation adjustments
Deferred hedge gain or loss (464,957) (445,640)
Total valuation and translation adjustments (464,957) (445,640)
Total net assets 82,033,814 87,508,346
Total liabilities and net assets 157,382,782 165,397,378
HEIWA REAL ESTATE REIT, Inc. (8966) 27th Fiscal Period Financial Report
12
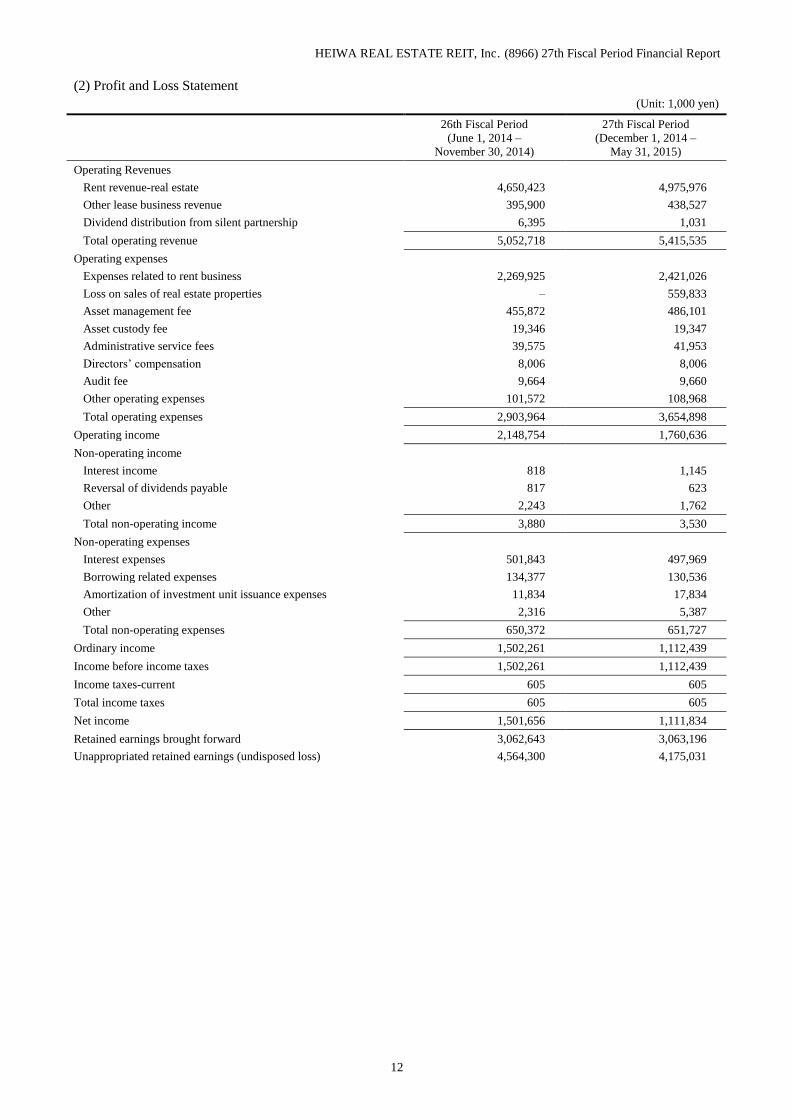
(2) Profit and Loss Statement
(Unit: 1,000 yen)
26th Fiscal Period
(June 1, 2014 –
November 30, 2014)
27th Fiscal Period
(December 1, 2014 –
May 31, 2015)
Operating Revenues
Rent revenue-real estate 4,650,423 4,975,976
Other lease business revenue 395,900 438,527
Dividend distribution from silent partnership 6,395 1,031
Total operating revenue 5,052,718 5,415,535
Operating expenses
Expenses related to rent business 2,269,925 2,421,026
Loss on sales of real estate properties – 559,833
Asset management fee 455,872 486,101
Asset custody fee 19,346 19,347
Administrative service fees 39,575 41,953
Directors’ compensation 8,006 8,006
Audit fee 9,664 9,660
Other operating expenses 101,572 108,968
Total operating expenses 2,903,964 3,654,898
Operating income 2,148,754 1,760,636
Non-operating income
Interest income 818 1,145
Reversal of dividends payable 817 623
Other 2,243 1,762
Total non-operating income 3,880 3,530
Non-operating expenses
Interest expenses 501,843 497,969
Borrowing related expenses 134,377 130,536
Amortization of investment unit issuance expenses 11,834 17,834
Other 2,316 5,387
Total non-operating expenses 650,372 651,727
Ordinary income 1,502,261 1,112,439
Income before income taxes 1,502,261 1,112,439
Income taxes-current 605 605
Total income taxes 605 605
Net income 1,501,656 1,111,834
Retained earnings brought forward 3,062,643 3,063,196
Unappropriated retained earnings (undisposed loss) 4,564,300 4,175,031
HEIWA REAL ESTATE REIT, Inc. (8966) 27th Fiscal Period Financial Report
13
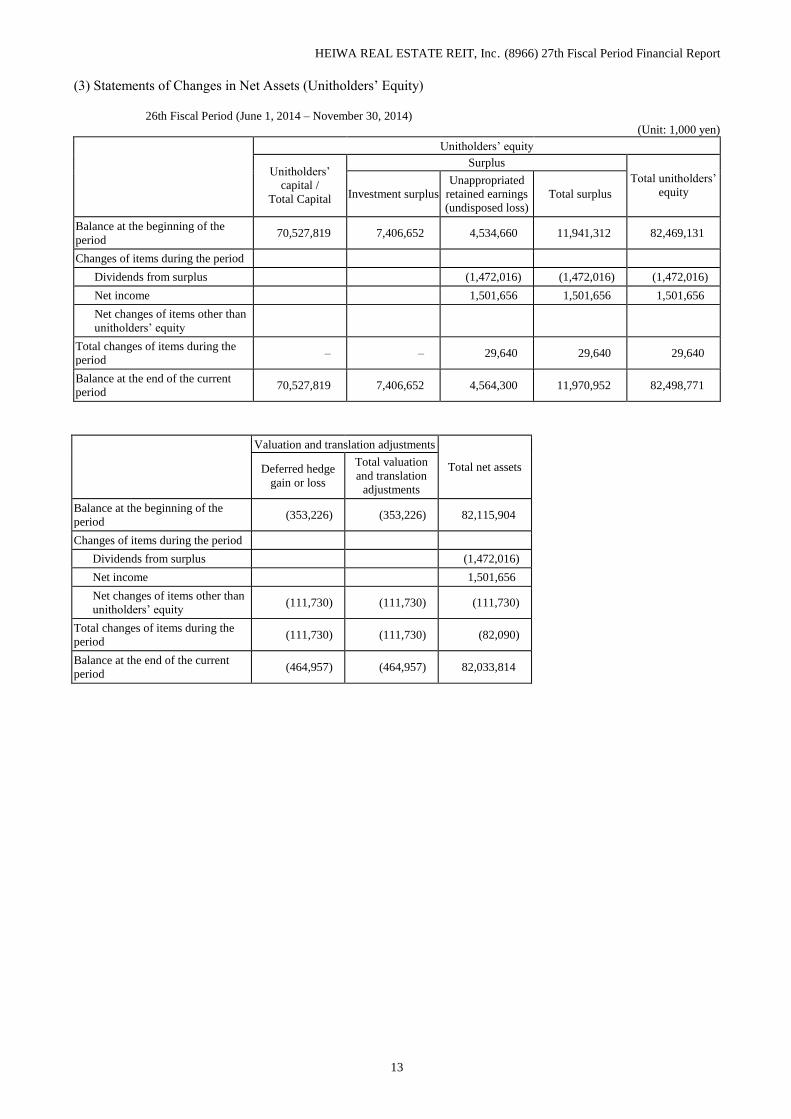
(3) Statements of Changes in Net Assets (Unitholders’ Equity)
26th Fiscal Period (June 1, 2014 – November 30, 2014) (Unit: 1,000 yen)
Unitholders’ equity
Unitholders’
capital /
Total Capital
Surplus
Total unitholders’
equity Investment surplus
Unappropriated
retained earnings
(undisposed loss)
Total surplus
Balance at the beginning of the
period 70,527,819 7,406,652 4,534,660 11,941,312 82,469,131
Changes of items during the period
Dividends from surplus (1,472,016) (1,472,016) (1,472,016)
Net income 1,501,656 1,501,656 1,501,656
Net changes of items other than
unitholders’ equity
Total changes of items during the
period – – 29,640 29,640 29,640
Balance at the end of the current
period 70,527,819 7,406,652 4,564,300 11,970,952 82,498,771
Valuation and translation adjustments
Total net assets
Deferred hedge
gain or loss
Total valuation
and translation
adjustments
Balance at the beginning of the
period (353,226) (353,226) 82,115,904
Changes of items during the period
Dividends from surplus (1,472,016)
Net income 1,501,656
Net changes of items other than
unitholders’ equity (111,730) (111,730) (111,730)
Total changes of items during the
period (111,730) (111,730) (82,090)
Balance at the end of the current
period (464,957) (464,957) 82,033,814
HEIWA REAL ESTATE REIT, Inc. (8966) 27th Fiscal Period Financial Report
14
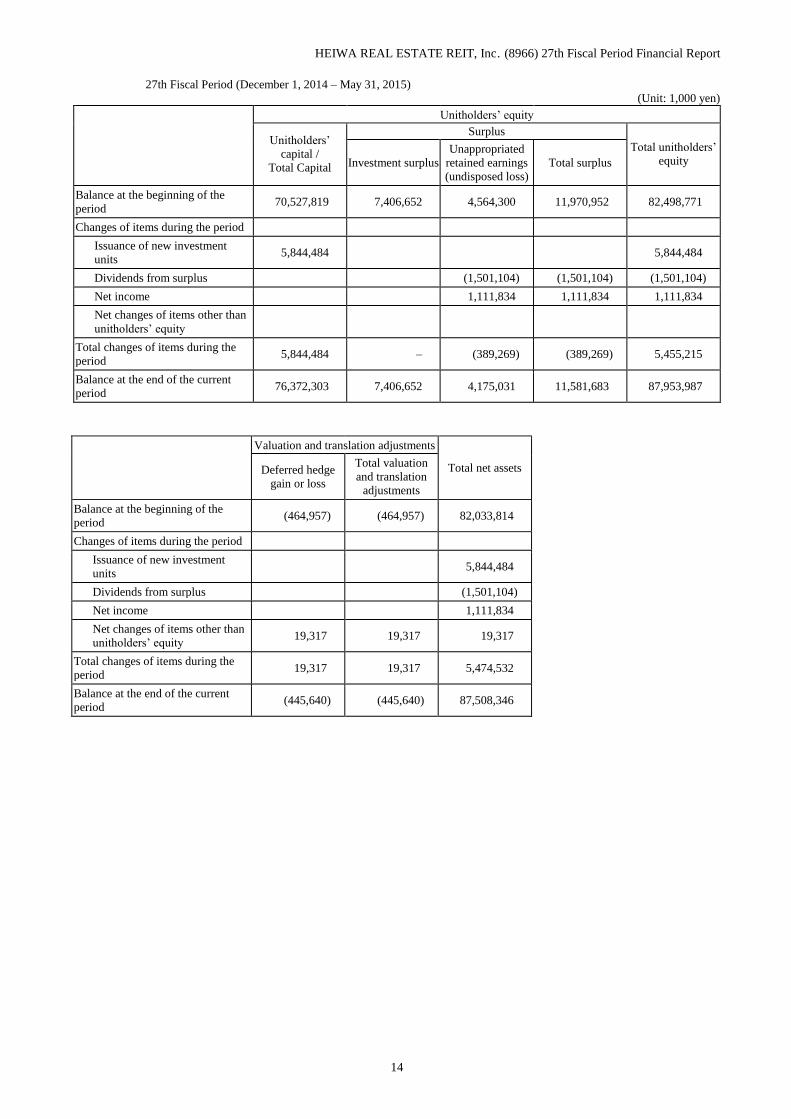
27th Fiscal Period (December 1, 2014 – May 31, 2015) (Unit: 1,000 yen)
Unitholders’ equity
Unitholders’
capital /
Total Capital
Surplus
Total unitholders’
equity Investment surplus
Unappropriated
retained earnings
(undisposed loss)
Total surplus
Balance at the beginning of the
period 70,527,819 7,406,652 4,564,300 11,970,952 82,498,771
Changes of items during the period
Issuance of new investment
units 5,844,484 5,844,484
Dividends from surplus (1,501,104) (1,501,104) (1,501,104)
Net income 1,111,834 1,111,834 1,111,834
Net changes of items other than
unitholders’ equity
Total changes of items during the
period 5,844,484 – (389,269) (389,269) 5,455,215
Balance at the end of the current
period 76,372,303 7,406,652 4,175,031 11,581,683 87,953,987
Valuation and translation adjustments
Total net assets
Deferred hedge
gain or loss
Total valuation
and translation
adjustments
Balance at the beginning of the
period (464,957) (464,957) 82,033,814
Changes of items during the period
Issuance of new investment
units 5,844,484
Dividends from surplus (1,501,104)
Net income 1,111,834
Net changes of items other than
unitholders’ equity 19,317 19,317 19,317
Total changes of items during the
period 19,317 19,317 5,474,532
Balance at the end of the current
period (445,640) (445,640) 87,508,346
HEIWA REAL ESTATE REIT, Inc. (8966) 27th Fiscal Period Financial Report
15
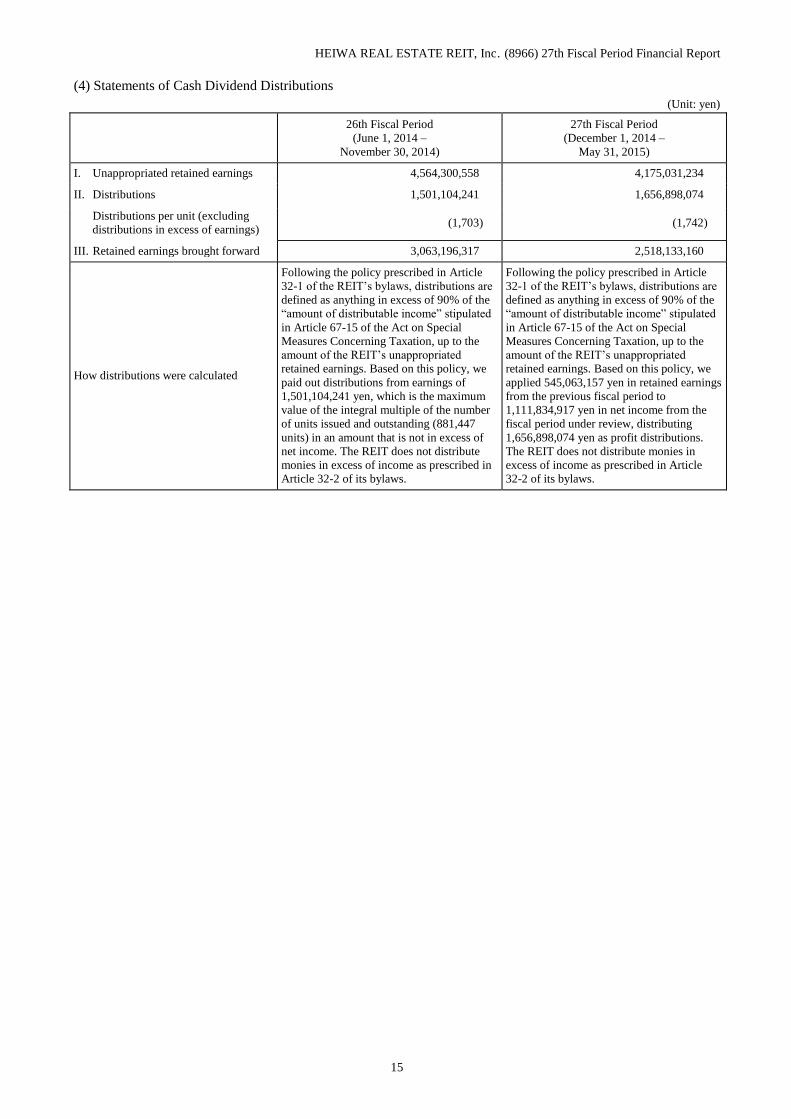
(4) Statements of Cash Dividend Distributions
(Unit: yen)
26th Fiscal Period
(June 1, 2014 –
November 30, 2014)
27th Fiscal Period
(December 1, 2014 –
May 31, 2015)
I. Unappropriated retained earnings 4,564,300,558 4,175,031,234
II. Distributions 1,501,104,241 1,656,898,074
Distributions per unit (excluding
distributions in excess of earnings) (1,703) (1,742)
III. Retained earnings brought forward 3,063,196,317 2,518,133,160
How distributions were calculated
Following the policy prescribed in Article
32-1 of the REIT’s bylaws, distributions are
defined as anything in excess of 90% of the
“amount of distributable income” stipulated
in Article 67-15 of the Act on Special
Measures Concerning Taxation, up to the
amount of the REIT’s unappropriated
retained earnings. Based on this policy, we
paid out distributions from earnings of
1,501,104,241 yen, which is the maximum
value of the integral multiple of the number
of units issued and outstanding (881,447
units) in an amount that is not in excess of
net income. The REIT does not distribute
monies in excess of income as prescribed in
Article 32-2 of its bylaws.
Following the policy prescribed in Article
32-1 of the REIT’s bylaws, distributions are
defined as anything in excess of 90% of the
“amount of distributable income” stipulated
in Article 67-15 of the Act on Special
Measures Concerning Taxation, up to the
amount of the REIT’s unappropriated
retained earnings. Based on this policy, we
applied 545,063,157 yen in retained earnings
from the previous fiscal period to
1,111,834,917 yen in net income from the
fiscal period under review, distributing
1,656,898,074 yen as profit distributions.
The REIT does not distribute monies in
excess of income as prescribed in Article
32-2 of its bylaws.
HEIWA REAL ESTATE REIT, Inc. (8966) 27th Fiscal Period Financial Report
16
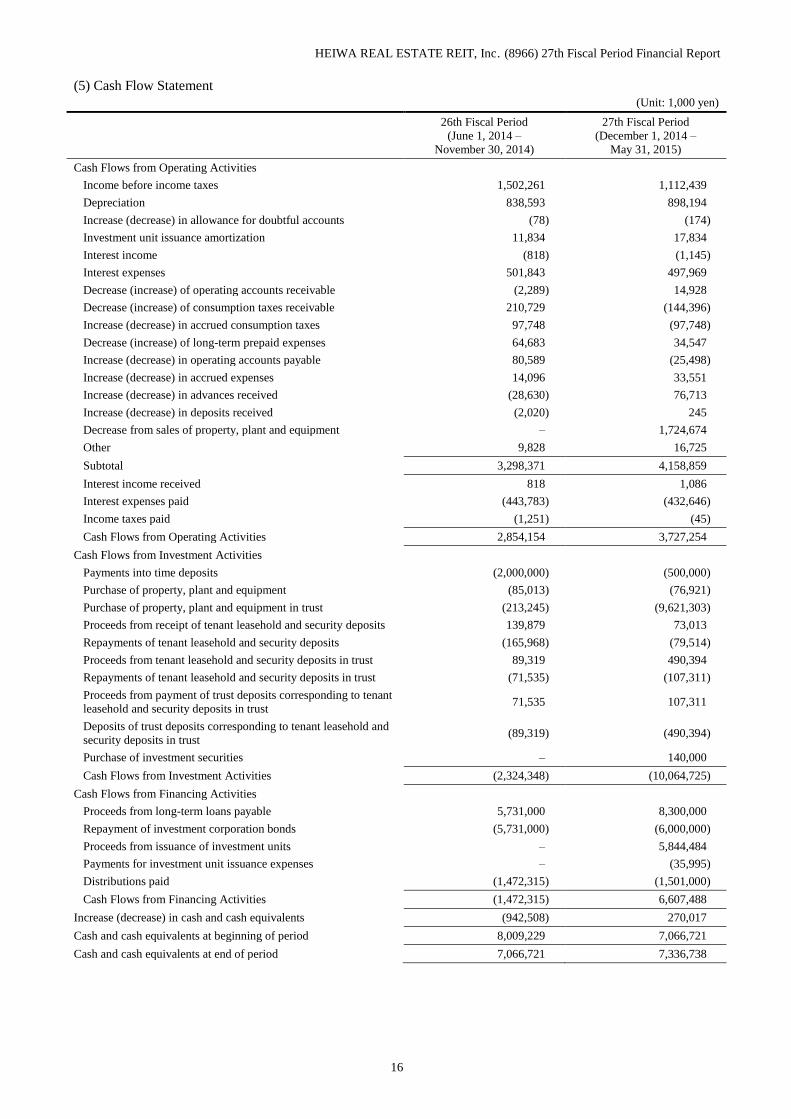
(5) Cash Flow Statement
(Unit: 1,000 yen)
26th Fiscal Period
(June 1, 2014 –
November 30, 2014)
27th Fiscal Period
(December 1, 2014 –
May 31, 2015)
Cash Flows from Operating Activities
Income before income taxes 1,502,261 1,112,439
Depreciation 838,593 898,194
Increase (decrease) in allowance for doubtful accounts (78) (174)
Investment unit issuance amortization 11,834 17,834
Interest income (818) (1,145)
Interest expenses 501,843 497,969
Decrease (increase) of operating accounts receivable (2,289) 14,928
Decrease (increase) of consumption taxes receivable 210,729 (144,396)
Increase (decrease) in accrued consumption taxes 97,748 (97,748)
Decrease (increase) of long-term prepaid expenses 64,683 34,547
Increase (decrease) in operating accounts payable 80,589 (25,498)
Increase (decrease) in accrued expenses 14,096 33,551
Increase (decrease) in advances received (28,630) 76,713
Increase (decrease) in deposits received (2,020) 245
Decrease from sales of property, plant and equipment – 1,724,674
Other 9,828 16,725
Subtotal 3,298,371 4,158,859
Interest income received 818 1,086
Interest expenses paid (443,783) (432,646)
Income taxes paid (1,251) (45)
Cash Flows from Operating Activities 2,854,154 3,727,254
Cash Flows from Investment Activities
Payments into time deposits (2,000,000) (500,000)
Purchase of property, plant and equipment (85,013) (76,921)
Purchase of property, plant and equipment in trust (213,245) (9,621,303)
Proceeds from receipt of tenant leasehold and security deposits 139,879 73,013
Repayments of tenant leasehold and security deposits (165,968) (79,514)
Proceeds from tenant leasehold and security deposits in trust 89,319 490,394
Repayments of tenant leasehold and security deposits in trust (71,535) (107,311)
Proceeds from payment of trust deposits corresponding to tenant
leasehold and security deposits in trust 71,535 107,311
Deposits of trust deposits corresponding to tenant leasehold and
security deposits in trust (89,319) (490,394)
Purchase of investment securities – 140,000
Cash Flows from Investment Activities (2,324,348) (10,064,725)
Cash Flows from Financing Activities
Proceeds from long-term loans payable 5,731,000 8,300,000
Repayment of investment corporation bonds (5,731,000) (6,000,000)
Proceeds from issuance of investment units – 5,844,484
Payments for investment unit issuance expenses – (35,995)
Distributions paid (1,472,315) (1,501,000)
Cash Flows from Financing Activities (1,472,315) 6,607,488
Increase (decrease) in cash and cash equivalents (942,508) 270,017
Cash and cash equivalents at beginning of period 8,009,229 7,066,721
Cash and cash equivalents at end of period 7,066,721 7,336,738
HEIWA REAL ESTATE REIT, Inc. (8966) 27th Fiscal Period Financial Report
17
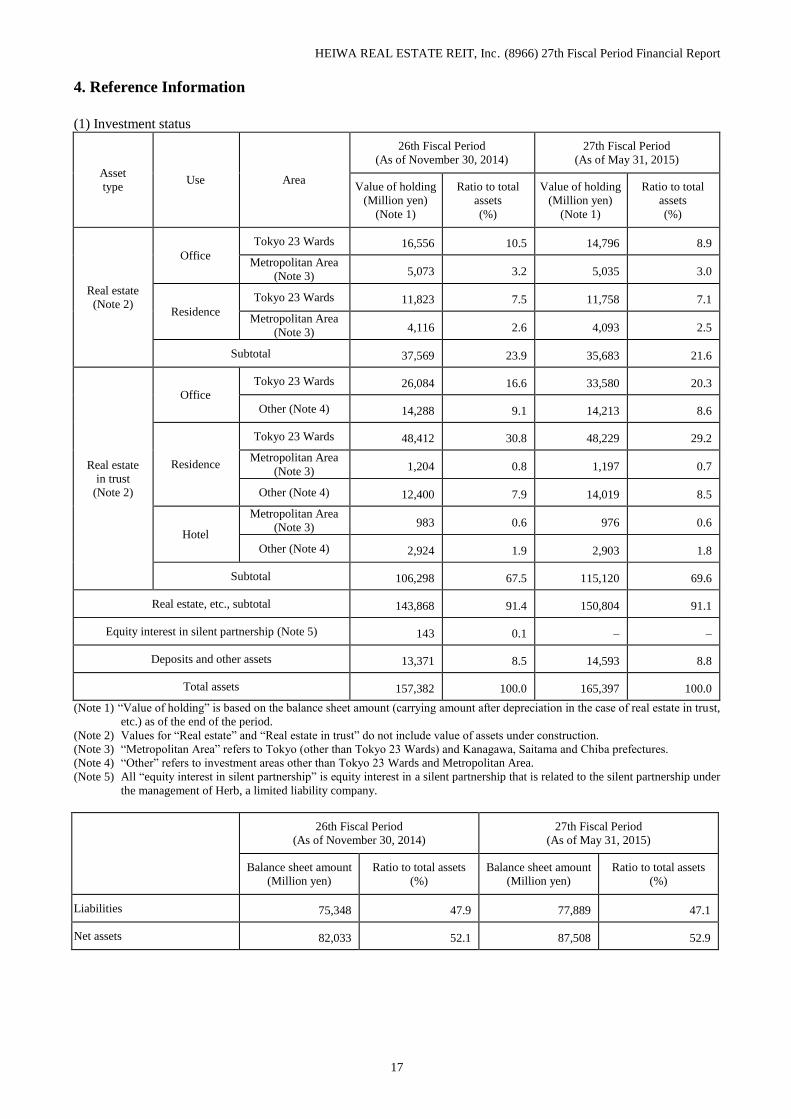
4. Reference Information
(1) Investment status
Asset
type Use Area
26th Fiscal Period
(As of November 30, 2014)
27th Fiscal Period
(As of May 31, 2015)
Value of holding
(Million yen)
(Note 1)
Ratio to total
assets
(%)
Value of holding
(Million yen)
(Note 1)
Ratio to total
assets
(%)
Real estate
(Note 2)
Office
Tokyo 23 Wards 16,556 10.5 14,796 8.9
Metropolitan Area
(Note 3) 5,073 3.2 5,035 3.0
Residence
Tokyo 23 Wards 11,823 7.5 11,758 7.1
Metropolitan Area
(Note 3) 4,116 2.6 4,093 2.5
Subtotal 37,569 23.9 35,683 21.6
Real estate
in trust
(Note 2)
Office
Tokyo 23 Wards 26,084 16.6 33,580 20.3
Other (Note 4) 14,288 9.1 14,213 8.6
Residence
Tokyo 23 Wards 48,412 30.8 48,229 29.2
Metropolitan Area
(Note 3) 1,204 0.8 1,197 0.7
Other (Note 4) 12,400 7.9 14,019 8.5
Hotel
Metropolitan Area
(Note 3) 983 0.6 976 0.6
Other (Note 4) 2,924 1.9 2,903 1.8
Subtotal 106,298 67.5 115,120 69.6
Real estate, etc., subtotal 143,868 91.4 150,804 91.1
Equity interest in silent partnership (Note 5) 143 0.1 – –
Deposits and other assets 13,371 8.5 14,593 8.8
Total assets 157,382 100.0 165,397 100.0
(Note 1) “Value of holding” is based on the balance sheet amount (carrying amount after depreciation in the case of real estate in trust,
etc.) as of the end of the period.
(Note 2) Values for “Real estate” and “Real estate in trust” do not include value of assets under construction.
(Note 3) “Metropolitan Area” refers to Tokyo (other than Tokyo 23 Wards) and Kanagawa, Saitama and Chiba prefectures.
(Note 4) “Other” refers to investment areas other than Tokyo 23 Wards and Metropolitan Area.
(Note 5) All “equity interest in silent partnership” is equity interest in a silent partnership that is related to the silent partnership under
the management of Herb, a limited liability company.
26th Fiscal Period
(As of November 30, 2014)
27th Fiscal Period
(As of May 31, 2015)
Balance sheet amount
(Million yen)
Ratio to total assets
(%)
Balance sheet amount
(Million yen)
Ratio to total assets
(%)
Liabilities 75,348 47.9 77,889 47.1
Net assets 82,033 52.1 87,508 52.9
HEIWA REAL ESTATE REIT, Inc. (8966) 27th Fiscal Period Financial Report
18
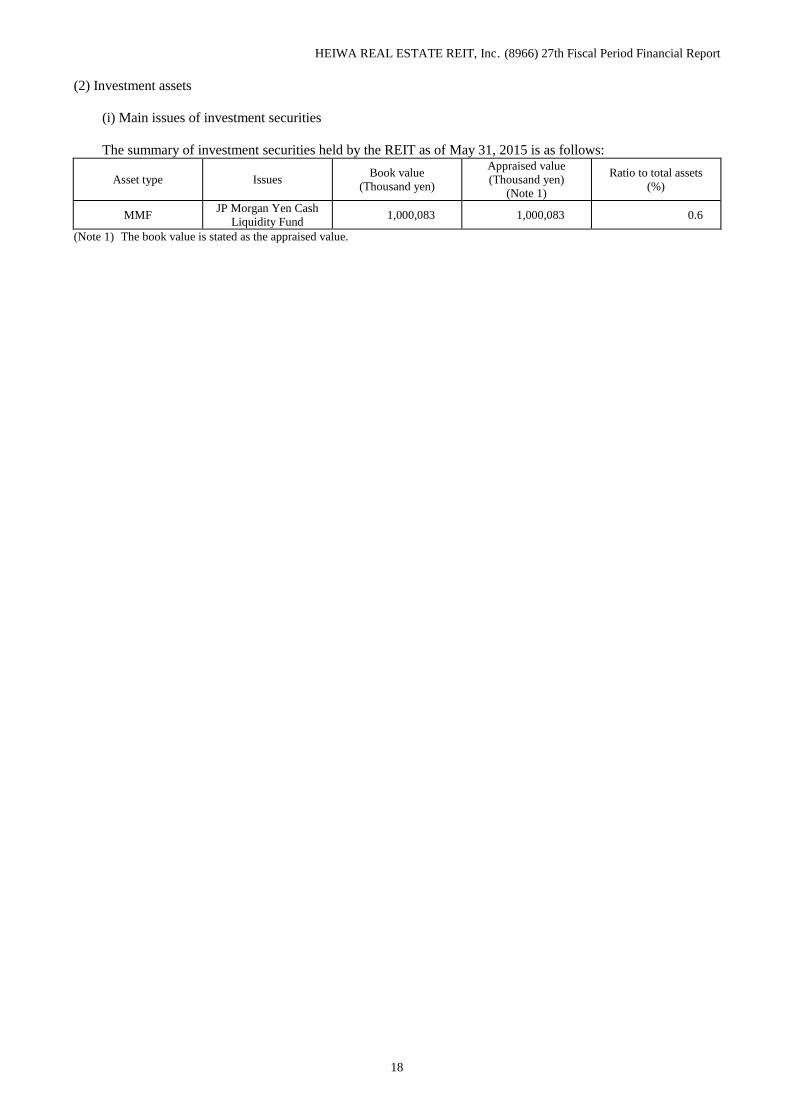
(2) Investment assets
(i) Main issues of investment securities
The summary of investment securities held by the REIT as of May 31, 2015 is as follows:
Asset type Issues Book value
(Thousand yen)
Appraised value
(Thousand yen)
(Note 1)
Ratio to total assets
(%)
MMF JP Morgan Yen Cash
Liquidity Fund 1,000,083 1,000,083 0.6
(Note 1) The book value is stated as the appraised value.
HEIWA REAL ESTATE REIT, Inc. (8966) 27th Fiscal Period Financial Report
19
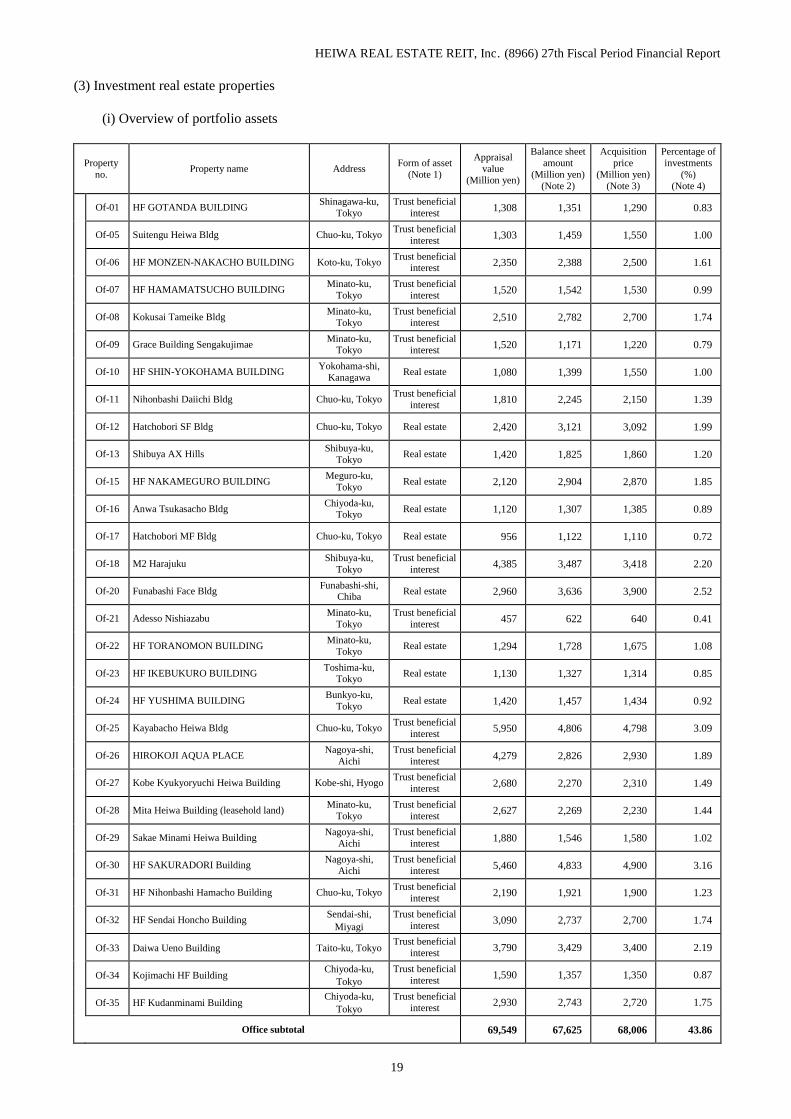
(3) Investment real estate properties
(i) Overview of portfolio assets
Property
no. Property name Address
Form of asset
(Note 1)
Appraisal
value
(Million yen)
Balance sheet
amount
(Million yen)
(Note 2)
Acquisition
price
(Million yen)
(Note 3)
Percentage of
investments
(%)
(Note 4)
Of-01 HF GOTANDA BUILDING Shinagawa-ku,
Tokyo
Trust beneficial
interest 1,308 1,351 1,290 0.83
Of-05 Suitengu Heiwa Bldg Chuo-ku, Tokyo Trust beneficial
interest 1,303 1,459 1,550 1.00
Of-06 HF MONZEN-NAKACHO BUILDING Koto-ku, Tokyo Trust beneficial
interest 2,350 2,388 2,500 1.61
Of-07 HF HAMAMATSUCHO BUILDING Minato-ku,
Tokyo
Trust beneficial
interest 1,520 1,542 1,530 0.99
Of-08 Kokusai Tameike Bldg Minato-ku,
Tokyo
Trust beneficial
interest 2,510 2,782 2,700 1.74
Of-09 Grace Building Sengakujimae Minato-ku,
Tokyo Trust beneficial
interest 1,520 1,171 1,220 0.79
Of-10 HF SHIN-YOKOHAMA BUILDING Yokohama-shi,
Kanagawa Real estate 1,080 1,399 1,550 1.00
Of-11 Nihonbashi Daiichi Bldg Chuo-ku, Tokyo Trust beneficial
interest 1,810 2,245 2,150 1.39
Of-12 Hatchobori SF Bldg Chuo-ku, Tokyo Real estate 2,420 3,121 3,092 1.99
Of-13 Shibuya AX Hills Shibuya-ku,
Tokyo Real estate 1,420 1,825 1,860 1.20
Of-15 HF NAKAMEGURO BUILDING Meguro-ku,
Tokyo Real estate 2,120 2,904 2,870 1.85
Of-16 Anwa Tsukasacho Bldg Chiyoda-ku,
Tokyo Real estate 1,120 1,307 1,385 0.89
Of-17 Hatchobori MF Bldg Chuo-ku, Tokyo Real estate 956 1,122 1,110 0.72
Of-18 M2 Harajuku Shibuya-ku,
Tokyo
Trust beneficial
interest 4,385 3,487 3,418 2.20
Of-20 Funabashi Face Bldg Funabashi-shi,
Chiba Real estate 2,960 3,636 3,900 2.52
Of-21 Adesso Nishiazabu Minato-ku,
Tokyo
Trust beneficial
interest 457 622 640 0.41
Of-22 HF TORANOMON BUILDING Minato-ku,
Tokyo Real estate 1,294 1,728 1,675 1.08
Of-23 HF IKEBUKURO BUILDING Toshima-ku,
Tokyo Real estate 1,130 1,327 1,314 0.85
Of-24 HF YUSHIMA BUILDING Bunkyo-ku,
Tokyo Real estate 1,420 1,457 1,434 0.92
Of-25 Kayabacho Heiwa Bldg Chuo-ku, Tokyo Trust beneficial
interest 5,950 4,806 4,798 3.09
Of-26 HIROKOJI AQUA PLACE Nagoya-shi,
Aichi
Trust beneficial
interest 4,279 2,826 2,930 1.89
Of-27 Kobe Kyukyoryuchi Heiwa Building Kobe-shi, Hyogo Trust beneficial
interest 2,680 2,270 2,310 1.49
Of-28 Mita Heiwa Building (leasehold land) Minato-ku,
Tokyo
Trust beneficial
interest 2,627 2,269 2,230 1.44
Of-29 Sakae Minami Heiwa Building Nagoya-shi,
Aichi
Trust beneficial
interest 1,880 1,546 1,580 1.02
Of-30 HF SAKURADORI Building Nagoya-shi,
Aichi
Trust beneficial
interest 5,460 4,833 4,900 3.16
Of-31 HF Nihonbashi Hamacho Building Chuo-ku, Tokyo Trust beneficial
interest 2,190 1,921 1,900 1.23
Of-32 HF Sendai Honcho Building Sendai-shi,
Miyagi
Trust beneficial
interest 3,090 2,737 2,700 1.74
Of-33 Daiwa Ueno Building Taito-ku, Tokyo Trust beneficial
interest 3,790 3,429 3,400 2.19
Of-34 Kojimachi HF Building Chiyoda-ku,
Tokyo
Trust beneficial
interest 1,590 1,357 1,350 0.87
Of-35 HF Kudanminami Building Chiyoda-ku,
Tokyo
Trust beneficial
interest 2,930 2,743 2,720 1.75
Office subtotal 69,549 67,625 68,006 43.86
HEIWA REAL ESTATE REIT, Inc. (8966) 27th Fiscal Period Financial Report
20
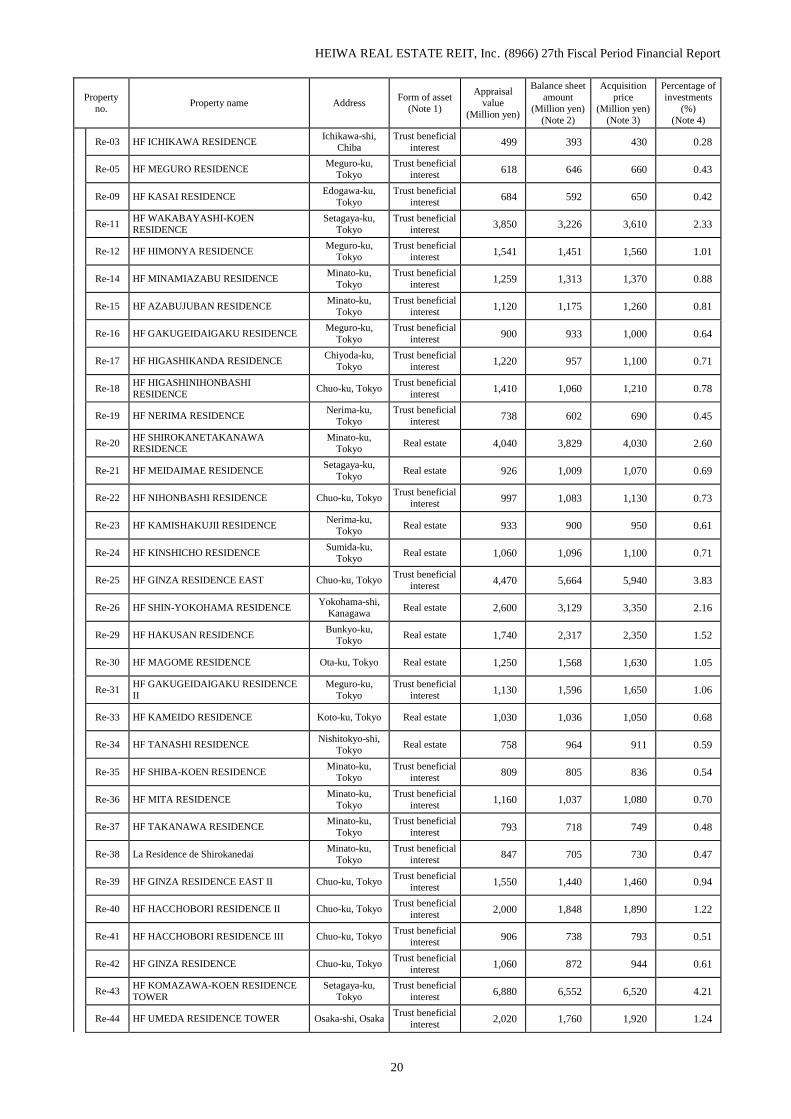
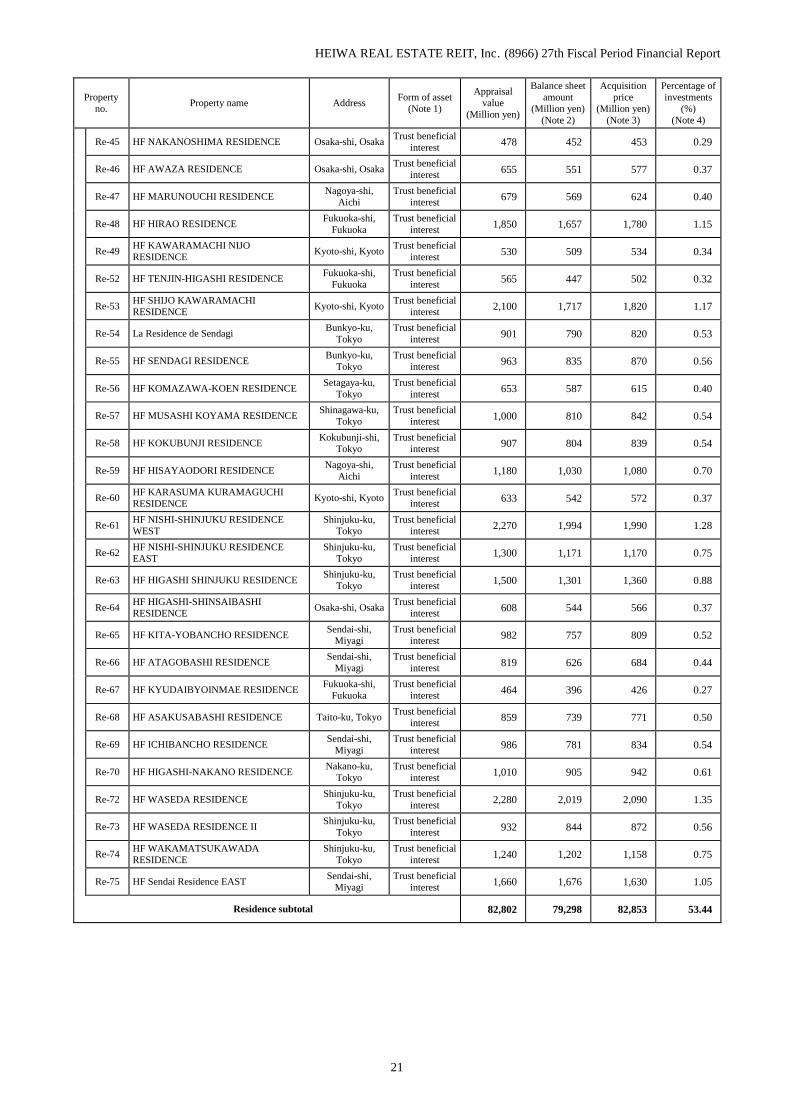
Property
no. Property name Address
Form of asset
(Note 1)
Appraisal
value
(Million yen)
Balance sheet
amount
(Million yen)
(Note 2)
Acquisition
price
(Million yen)
(Note 3)
Percentage of
investments
(%)
(Note 4)
Re-03 HF ICHIKAWA RESIDENCE Ichikawa-shi,
Chiba
Trust beneficial
interest 499 393 430 0.28
Re-05 HF MEGURO RESIDENCE Meguro-ku,
Tokyo
Trust beneficial
interest 618 646 660 0.43
Re-09 HF KASAI RESIDENCE Edogawa-ku,
Tokyo
Trust beneficial
interest 684 592 650 0.42
Re-11 HF WAKABAYASHI-KOEN
RESIDENCE
Setagaya-ku,
Tokyo
Trust beneficial
interest 3,850 3,226 3,610 2.33
Re-12 HF HIMONYA RESIDENCE Meguro-ku,
Tokyo
Trust beneficial
interest 1,541 1,451 1,560 1.01
Re-14 HF MINAMIAZABU RESIDENCE Minato-ku,
Tokyo
Trust beneficial
interest 1,259 1,313 1,370 0.88
Re-15 HF AZABUJUBAN RESIDENCE Minato-ku,
Tokyo
Trust beneficial
interest 1,120 1,175 1,260 0.81
Re-16 HF GAKUGEIDAIGAKU RESIDENCE Meguro-ku,
Tokyo
Trust beneficial
interest 900 933 1,000 0.64
Re-17 HF HIGASHIKANDA RESIDENCE Chiyoda-ku,
Tokyo
Trust beneficial
interest 1,220 957 1,100 0.71
Re-18 HF HIGASHINIHONBASHI
RESIDENCE Chuo-ku, Tokyo
Trust beneficial
interest 1,410 1,060 1,210 0.78
Re-19 HF NERIMA RESIDENCE Nerima-ku,
Tokyo
Trust beneficial
interest 738 602 690 0.45
Re-20 HF SHIROKANETAKANAWA
RESIDENCE
Minato-ku,
Tokyo Real estate 4,040 3,829 4,030 2.60
Re-21 HF MEIDAIMAE RESIDENCE Setagaya-ku,
Tokyo Real estate 926 1,009 1,070 0.69
Re-22 HF NIHONBASHI RESIDENCE Chuo-ku, Tokyo Trust beneficial
interest 997 1,083 1,130 0.73
Re-23 HF KAMISHAKUJII RESIDENCE Nerima-ku,
Tokyo Real estate 933 900 950 0.61
Re-24 HF KINSHICHO RESIDENCE Sumida-ku,
Tokyo Real estate 1,060 1,096 1,100 0.71
Re-25 HF GINZA RESIDENCE EAST Chuo-ku, Tokyo Trust beneficial
interest 4,470 5,664 5,940 3.83
Re-26 HF SHIN-YOKOHAMA RESIDENCE Yokohama-shi,
Kanagawa Real estate 2,600 3,129 3,350 2.16
Re-29 HF HAKUSAN RESIDENCE Bunkyo-ku,
Tokyo Real estate 1,740 2,317 2,350 1.52
Re-30 HF MAGOME RESIDENCE Ota-ku, Tokyo Real estate 1,250 1,568 1,630 1.05
Re-31 HF GAKUGEIDAIGAKU RESIDENCE
II
Meguro-ku,
Tokyo
Trust beneficial
interest 1,130 1,596 1,650 1.06
Re-33 HF KAMEIDO RESIDENCE Koto-ku, Tokyo Real estate 1,030 1,036 1,050 0.68
Re-34 HF TANASHI RESIDENCE Nishitokyo-shi,
Tokyo Real estate 758 964 911 0.59
Re-35 HF SHIBA-KOEN RESIDENCE Minato-ku,
Tokyo
Trust beneficial
interest 809 805 836 0.54
Re-36 HF MITA RESIDENCE Minato-ku,
Tokyo
Trust beneficial
interest 1,160 1,037 1,080 0.70
Re-37 HF TAKANAWA RESIDENCE Minato-ku,
Tokyo
Trust beneficial
interest 793 718 749 0.48
Re-38 La Residence de Shirokanedai Minato-ku,
Tokyo
Trust beneficial
interest 847 705 730 0.47
Re-39 HF GINZA RESIDENCE EAST II Chuo-ku, Tokyo Trust beneficial
interest 1,550 1,440 1,460 0.94
Re-40 HF HACCHOBORI RESIDENCE II Chuo-ku, Tokyo Trust beneficial
interest 2,000 1,848 1,890 1.22
Re-41 HF HACCHOBORI RESIDENCE III Chuo-ku, Tokyo Trust beneficial
interest 906 738 793 0.51
Re-42 HF GINZA RESIDENCE Chuo-ku, Tokyo Trust beneficial
interest 1,060 872 944 0.61
Re-43 HF KOMAZAWA-KOEN RESIDENCE
TOWER
Setagaya-ku,
Tokyo
Trust beneficial
interest 6,880 6,552 6,520 4.21
Re-44 HF UMEDA RESIDENCE TOWER Osaka-shi, Osaka Trust beneficial
interest 2,020 1,760 1,920 1.24
HEIWA REAL ESTATE REIT, Inc. (8966) 27th Fiscal Period Financial Report
21
Property
no. Property name Address
Form of asset
(Note 1)
Appraisal
value
(Million yen)
Balance sheet
amount
(Million yen)
(Note 2)
Acquisition
price
(Million yen)
(Note 3)
Percentage of
investments
(%)
(Note 4)
Re-45 HF NAKANOSHIMA RESIDENCE Osaka-shi, Osaka Trust beneficial
interest 478 452 453 0.29
Re-46 HF AWAZA RESIDENCE Osaka-shi, Osaka Trust beneficial
interest 655 551 577 0.37
Re-47 HF MARUNOUCHI RESIDENCE Nagoya-shi,
Aichi
Trust beneficial
interest 679 569 624 0.40
Re-48 HF HIRAO RESIDENCE Fukuoka-shi,
Fukuoka
Trust beneficial
interest 1,850 1,657 1,780 1.15
Re-49 HF KAWARAMACHI NIJO
RESIDENCE Kyoto-shi, Kyoto
Trust beneficial
interest 530 509 534 0.34
Re-52 HF TENJIN-HIGASHI RESIDENCE Fukuoka-shi,
Fukuoka
Trust beneficial
interest 565 447 502 0.32
Re-53 HF SHIJO KAWARAMACHI
RESIDENCE Kyoto-shi, Kyoto
Trust beneficial
interest 2,100 1,717 1,820 1.17
Re-54 La Residence de Sendagi Bunkyo-ku,
Tokyo
Trust beneficial
interest 901 790 820 0.53
Re-55 HF SENDAGI RESIDENCE Bunkyo-ku,
Tokyo
Trust beneficial
interest 963 835 870 0.56
Re-56 HF KOMAZAWA-KOEN RESIDENCE Setagaya-ku,
Tokyo
Trust beneficial
interest 653 587 615 0.40
Re-57 HF MUSASHI KOYAMA RESIDENCE Shinagawa-ku,
Tokyo
Trust beneficial
interest 1,000 810 842 0.54
Re-58 HF KOKUBUNJI RESIDENCE Kokubunji-shi,
Tokyo
Trust beneficial
interest 907 804 839 0.54
Re-59 HF HISAYAODORI RESIDENCE Nagoya-shi,
Aichi
Trust beneficial
interest 1,180 1,030 1,080 0.70
Re-60 HF KARASUMA KURAMAGUCHI
RESIDENCE Kyoto-shi, Kyoto
Trust beneficial
interest 633 542 572 0.37
Re-61 HF NISHI-SHINJUKU RESIDENCE
WEST
Shinjuku-ku,
Tokyo
Trust beneficial
interest 2,270 1,994 1,990 1.28
Re-62 HF NISHI-SHINJUKU RESIDENCE
EAST
Shinjuku-ku,
Tokyo
Trust beneficial
interest 1,300 1,171 1,170 0.75
Re-63 HF HIGASHI SHINJUKU RESIDENCE Shinjuku-ku,
Tokyo
Trust beneficial
interest 1,500 1,301 1,360 0.88
Re-64 HF HIGASHI-SHINSAIBASHI
RESIDENCE Osaka-shi, Osaka
Trust beneficial
interest 608 544 566 0.37
Re-65 HF KITA-YOBANCHO RESIDENCE Sendai-shi,
Miyagi
Trust beneficial
interest 982 757 809 0.52
Re-66 HF ATAGOBASHI RESIDENCE Sendai-shi,
Miyagi
Trust beneficial
interest 819 626 684 0.44
Re-67 HF KYUDAIBYOINMAE RESIDENCE Fukuoka-shi,
Fukuoka
Trust beneficial
interest 464 396 426 0.27
Re-68 HF ASAKUSABASHI RESIDENCE Taito-ku, Tokyo Trust beneficial
interest 859 739 771 0.50
Re-69 HF ICHIBANCHO RESIDENCE Sendai-shi,
Miyagi
Trust beneficial
interest 986 781 834 0.54
Re-70 HF HIGASHI-NAKANO RESIDENCE Nakano-ku,
Tokyo
Trust beneficial
interest 1,010 905 942 0.61
Re-72 HF WASEDA RESIDENCE Shinjuku-ku,
Tokyo
Trust beneficial
interest 2,280 2,019 2,090 1.35
Re-73 HF WASEDA RESIDENCE II Shinjuku-ku,
Tokyo
Trust beneficial
interest 932 844 872 0.56
Re-74 HF WAKAMATSUKAWADA
RESIDENCE
Shinjuku-ku,
Tokyo
Trust beneficial
interest 1,240 1,202 1,158 0.75
Re-75 HF Sendai Residence EAST Sendai-shi,
Miyagi
Trust beneficial
interest 1,660 1,676 1,630 1.05
Residence subtotal 82,802 79,298 82,853 53.44
HEIWA REAL ESTATE REIT, Inc. (8966) 27th Fiscal Period Financial Report
22
Property
no. Property name Address
Form of asset
(Note 1)
Appraisal
value
(Million yen)
Balance sheet
amount
(Million yen)
(Note 2)
Acquisition
price
(Million yen)
(Note 3)
Percentage of
investments
(%)
(Note 4)
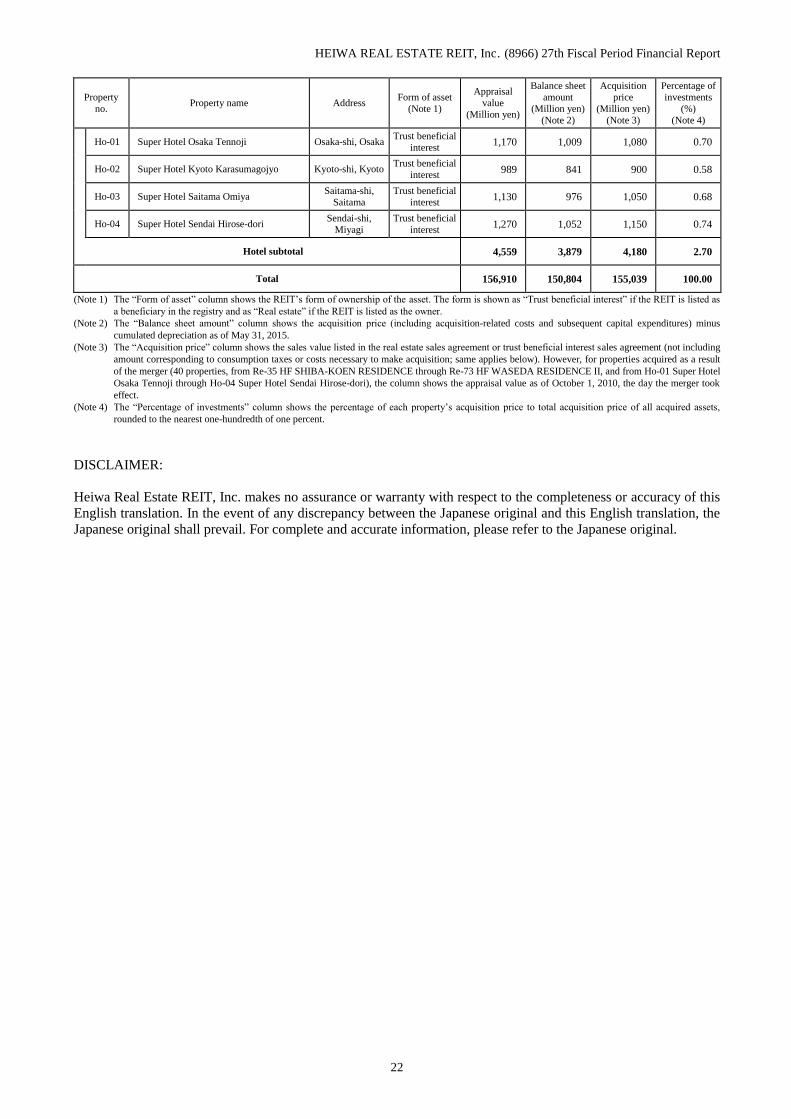
Ho-01 Super Hotel Osaka Tennoji Osaka-shi, Osaka Trust beneficial
interest 1,170 1,009 1,080 0.70
Ho-02 Super Hotel Kyoto Karasumagojyo Kyoto-shi, Kyoto Trust beneficial
interest 989 841 900 0.58
Ho-03 Super Hotel Saitama Omiya Saitama-shi,
Saitama
Trust beneficial
interest 1,130 976 1,050 0.68
Ho-04 Super Hotel Sendai Hirose-dori Sendai-shi,
Miyagi
Trust beneficial
interest 1,270 1,052 1,150 0.74
Hotel subtotal 4,559 3,879 4,180 2.70
Total 156,910 150,804 155,039 100.00
(Note 1) The “Form of asset” column shows the REIT’s form of ownership of the asset. The form is shown as “Trust beneficial interest” if the REIT is listed as
a beneficiary in the registry and as “Real estate” if the REIT is listed as the owner.
(Note 2) The “Balance sheet amount” column shows the acquisition price (including acquisition-related costs and subsequent capital expenditures) minus
cumulated depreciation as of May 31, 2015.
(Note 3) The “Acquisition price” column shows the sales value listed in the real estate sales agreement or trust beneficial interest sales agreement (not including
amount corresponding to consumption taxes or costs necessary to make acquisition; same applies below). However, for properties acquired as a result
of the merger (40 properties, from Re-35 HF SHIBA-KOEN RESIDENCE through Re-73 HF WASEDA RESIDENCE II, and from Ho-01 Super Hotel
Osaka Tennoji through Ho-04 Super Hotel Sendai Hirose-dori), the column shows the appraisal value as of October 1, 2010, the day the merger took
effect.
(Note 4) The “Percentage of investments” column shows the percentage of each property’s acquisition price to total acquisition price of all acquired assets,
rounded to the nearest one-hundredth of one percent.
DISCLAIMER:
Heiwa Real Estate REIT, Inc. makes no assurance or warranty with respect to the completeness or accuracy of this
English translation. In the event of any discrepancy between the Japanese original and this English translation, the
Japanese original shall prevail. For complete and accurate information, please refer to the Japanese original.