Embed Size (px)
Citation preview

Paper 276-2013 10 SAS Skills for Grad Student Survival: A Grad Student “How-To” Paper
Elisa L. Priest1,2 1 University of North Texas School of Public Health
2 Institute for Health Care Research and Improvement, Baylor Health Care System
ABSTRACT Grad students learn the basics of SAS programming in class or on their own. Classroom lessons focus on statistical procedures and the datasets are usually ready for analysis. Students may learn basic coding such as IF-THEN statements, variable creation, and functions. However, real world research projects are usually complex and may require a variety of different SAS tools and techniques for data exploration and analysis. Most of these tools and techniques students have to learn on their own. Throughout the many, many, years that I was in graduate school, I spent a lot of time learning SAS on my own. This paper is a culmination of the SAS challenges I overcame and the SAS skills that I learned outside of the classroom. These 10 SAS skills helped me to survive graduate school and successfully write a complex simulation analysis in SAS for my dissertation. This simulation was one of the most challenging SAS programs that I ever wrote. This paper is the sixth in the ‘Grad Student How-To’ series and provides graduate students with a list of 10 essential SAS skills plus references to find more detailed information on each of the topics.
10 SAS SKILLS 1. Finding SAS information
2. Organization and Documentation
3. Enterprise Guide
4. Program Data Vector
5. Sleuthing
6. Merging and Combining Data
7. Arrays
8. Longitudinal Data
9. Output Delivery System
10. Macros
Poster and Video PresentationsSAS Global Forum 2013
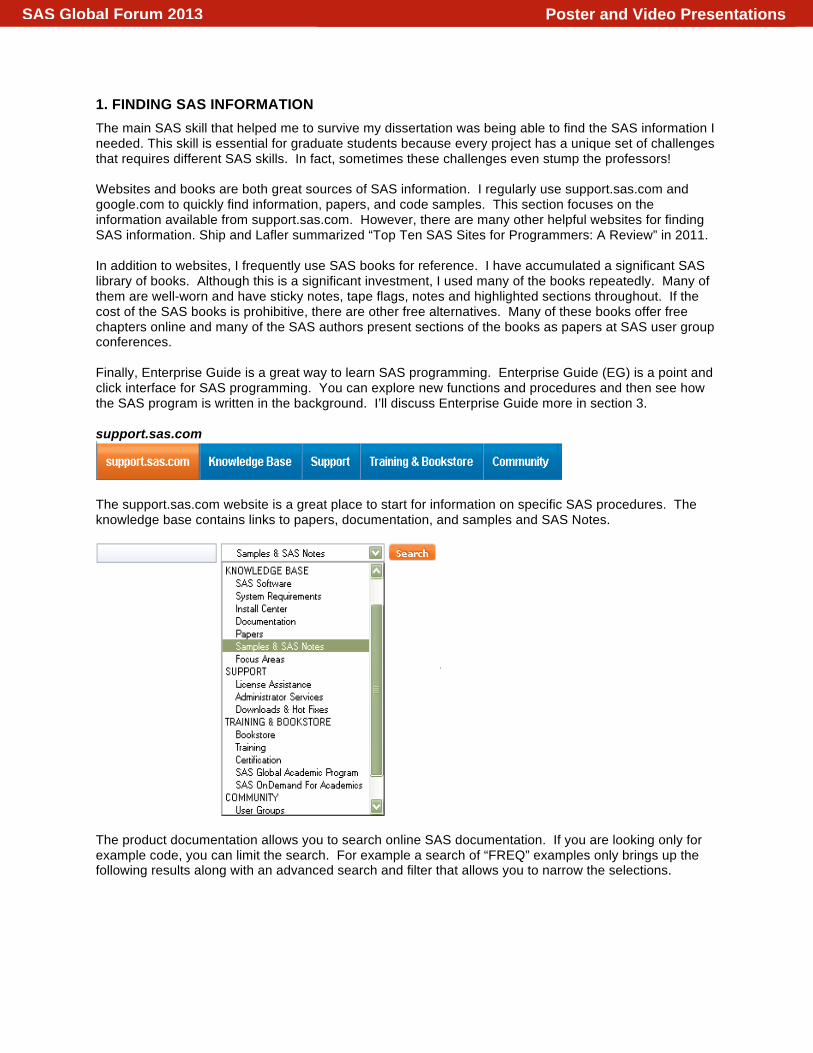
1. FINDING SAS INFORMATION The main SAS skill that helped me to survive my dissertation was being able to find the SAS information I needed. This skill is essential for graduate students because every project has a unique set of challenges that requires different SAS skills. In fact, sometimes these challenges even stump the professors! Websites and books are both great sources of SAS information. I regularly use support.sas.com and google.com to quickly find information, papers, and code samples. This section focuses on the information available from support.sas.com. However, there are many other helpful websites for finding SAS information. Ship and Lafler summarized “Top Ten SAS Sites for Programmers: A Review” in 2011. In addition to websites, I frequently use SAS books for reference. I have accumulated a significant SAS library of books. Although this is a significant investment, I used many of the books repeatedly. Many of them are well-worn and have sticky notes, tape flags, notes and highlighted sections throughout. If the cost of the SAS books is prohibitive, there are other free alternatives. Many of these books offer free chapters online and many of the SAS authors present sections of the books as papers at SAS user group conferences. Finally, Enterprise Guide is a great way to learn SAS programming. Enterprise Guide (EG) is a point and click interface for SAS programming. You can explore new functions and procedures and then see how the SAS program is written in the background. I’ll discuss Enterprise Guide more in section 3. support.sas.com
The support.sas.com website is a great place to start for information on specific SAS procedures. The knowledge base contains links to papers, documentation, and samples and SAS Notes.
The product documentation allows you to search online SAS documentation. If you are looking only for example code, you can limit the search. For example a search of “FREQ” examples only brings up the following results along with an advanced search and filter that allows you to narrow the selections.
Poster and Video PresentationsSAS Global Forum 2013

If you look at the first result, you get a summary of the code example along with the ability to see more information about the syntax.
Poster and Video PresentationsSAS Global Forum 2013

Another very useful area of the knowledge base is the papers section. From this section, you can look at SAS Technical Papers as well as link to the conference proceedings.
Poster and Video PresentationsSAS Global Forum 2013

Learn more about finding SAS information here:
• Ship CE and Lafler KP. Top Ten SAS® Sites for Programmers: A Review. SAS Global Forum 2011. Paper 055-2011.
• Harper R and Hoverstad L. Discovering the Road Less Traveled to SAS information: A Guide for your Journey. SAS Global Forum 2010. Paper 299-2010.
• LeBouton K. Help! My SAS Program Isn’t Working: Where to Turn When You Need Help. SAS Global Forum 2011. Paper 210-2011.
My most used reference books for SAS programming:
• Carpenter A. Carpenter’s Complete Guide to the SAS Macro Language. 2nd Edition. SAS Institute, 2004.
• Cody R. SAS Functions by Example, Second Edition. SAS Institute. 2010. • Cody R. Longitudinal Data and SAS: A Programmer’s Guide. SAS Institute. 2001. • Cody R. Cody’s Data Cleaning Techniques Using SAS, Second Edition. SAS Institute. 2008. • Haworth L and Zander C. Output Delivery System (ODS): The Basics and Beyond. SAS Institute.
2009.
Other useful books for SAS Programming:
• Cody R. Cody’s Collection of Popular SAS Programming Tasks and How to Tackle Them. SAS Institute. 2012.
• Cody R. Learning SAS by Example: A Programmer’s Guide. SAS Institute. 2007. • Carpenter A. Carpenter’s Guide to Innovative SAS Techniques. SAS Institute. 2012. • Delwiche L and Slaughter S. The Little SAS Book: A Primer, Fourth Edition. SAS Institute. 2008. • Delwiche L and Slaughter S. The Little SAS Book for Enterprise Guide 4.2. SAS Institute. 2010.
2. ORGANIZATION AND DOCUMENTATION Although it is easy to overlook as a SAS programming skill at first, organization and documentation practices are key programming skills for graduate students. I learned this the hard way by losing code, misplacing datasets, and not being able to remember what my code did! Fortunately, I learned my lessons many years ago and did not repeat these same mistakes for my dissertation. Each person can develop their own style for organization and documentation. The following information is how I organize all of my SAS programming. I use a standardized header at the start of all of my programs. This header is one large comment section. It includes information on what files are required for the program and what files are produced after running the program. /***************************************************************** TITLE: DISSERATATION Blood Analysis FOLDER: DISSERTATION\SAS\BloodAnalysis09152012.SAS AUTHOR: Elisa L. Priest CREATED: Tuesday, November 9 2010 LAST MODIFIED: September 15, 2012 INPUTS: ACCESS DATABASE "\DISSERTATION\DISSERTATIONDATABASE.mdb" TABLE: BLOODTEST OUTPUTS: DISSERTATION.BLOODANALYSIS09152012 “DISSERTATION\SAS\OUTPUT\BLOODANALYSIS09152012.LST” TEMPORARY: WORK.BLOODANALYSIS MACROS USED: NONE*****************************************************************
Poster and Video PresentationsSAS Global Forum 2013

I also use a “Table of Contents” section and headers for each section. This breaks the program into manageable sections of code. Next, I use comments throughout the code to remind myself of what the code is doing. Comments are also great to include whenever your professor suggests that you do something for your research project! When they change their mind, you can always point to your documentation. *********************TABLE OF CONTENTS*********************** 1. Import Blood Table 2. Recode Blood Table 3. Import Insulin Data 4. Recode Insulin Data 5. Merge and Label ***********************************************************************; *****1. IMPORT BLOODTABLE**********************************; If I have many datasets that I am working with, I document the flow of the project in a visual diagram or data flow diagram. This helps me to keep track of which datasets are being merged together throughout the program. During my dissertation, this was essential to stay organized. This documentation doesn’t have to be formal: I drew my data flow diagrams by hand. When I was troubleshooting problems in my simulation in my dissertation, I frequently referred to these diagrams. Another tool for staying organized is Enterprise Guide (EG). EG allows all of your SAS programs and datasets to be kept together as a project. This greatly simplifies the organization of a research project within SAS. In addition, EG allows you to write notes along with the program code to keep track of important information. EG also creates an organized view of the datasets and code used for the project. When using EG, I don’t need to create the external data flow diagrams that I mentioned above. Learn more about organizing your SAS programs here:
• Priest EL, Mullins B. Keep it Organized- SAS tips for a research project. South Central SAS Users Group 2012 Educational Forum.
• Levin L. SAS Programming Guidelines. SUGI 31 Proceedings. Paper 123-31. • Martin C and Martin L. Cleanup-Comments and Code-Making it Maintainable. NESUG
Proceedings (2000). • Rhodes D. Programming Standards, Style Sheets, and Peer Reviews: A Practical Guide. SUGI
29 Proceedings. Paper 135-29. • Winn T. Guidelines for coding of SAS Programs. SUGI 29 Proceedings. Paper 258-29. • Slaughter S and Delwiche L. Writing Code in SAS Enterprise Guide. SAS Global Forum 2008.
Paper 184-2008.
3. ENTERPRISE GUIDE As I mentioned in earlier sections, Enterprise Guide is a point and click SAS interface. It is becoming more widely used for students through the SAS OnDemand for Academics Program where professors can set up a SAS server for their class “in the cloud”. Students, if your professors aren’t offering you SAS OnDemand for Academics and you don’t have access to Enterprise Guide, you can ask them to set it up. It’s free! I admit it. I was very resistant to using Enterprise Guide. But, Enterprise Guide has many benefits, especially for graduate students. It is a great tool for figuring out difficult tasks in SAS, because you can point and click to explore different options within procedures. EG writes code in the background and you can view the code that SAS wrote and you can even reuse it. Enterprise Guide also has tools that can keep you organized. All data and programs can be stored together along with notes as one project. Voila! No more missing datasets or programs!
Poster and Video PresentationsSAS Global Forum 2013

The screenshot below is from the Free SAS Enterprise Guide Tutorial, available online. It shows multiple process flows within one EG project. All the datasets are visible as well as the results of the SAS programs.
Learn more about Enterprise Guide here:
• Slaughter S and Delwiche L. Writing Code in SAS Enterprise Guide. SAS Global Forum 2008. Paper 184-2008.
• Slaughter S and Delwiche L. The Little SAS Book For Enterprise Guide 4.2. SAS Institute. 2010. • Free SAS Enterprise Guide Tutorial:
http://support.sas.com/documentation/onlinedoc/guide/tut43/en/menu.htm • Hemedinger, C. How to get the Statistics you need from Enterprise Guide.
http://blogs.sas.com/content/sasdummy/2012/07/30/fastats-from-sas-eg/ • SAS Enterprise Guide for Programmers: Webinar Followup
http://support.sas.com/documentation/onlinedoc/guide/sasegforprogrammers.htm • Bangi A, Hemedinger C, Slocum S. New Goodies in SAS Enterprise Guide 4.3. SAS Global Forum 2010.
Paper 137-2010.
Poster and Video PresentationsSAS Global Forum 2013

4. PROGRAM DATA VECTOR The program data vector is an essential component of understanding how SAS actually works. When you submit a SAS program, such as a simple DATA step, SAS first compiles and then executes the program. The program data vector (PDV) is created during compilation and is a key component of how SAS processes data. The SAS language reference defines the program data vector as “ a logical area in memory where SAS builds a data set, one observation at a time.” Understanding basic step processing is important in many areas of SAS programming such as automatic variables that SAS creates (_N_ and _ERROR_), data and set statements, renaming variables, keeping and dropping variables, retaining variables, merging data sets, transposing data, and macro programming, just to name a few. I was recently reviewing the program data vector concepts and I realized that I had forgotten how merges really work. We will discuss merges in section 6.
Data step processing diagram from How the DATA step works: A Basic Introduction.
Poster and Video PresentationsSAS Global Forum 2013

Learn more about the program data vector here: • How the DATA step works: A Basic Introduction.
http://support.sas.com/documentation/cdl/en/basess/58133/HTML/default/viewer.htm#a001290590.htm • Overview of DATA step Processing.
http://support.sas.com/documentation/cdl/en/lrcon/65287/HTML/default/viewer.htm#p08a4x7h9mkwqvn16jg3xqwfxful.htm
• Johnson J. The Use and Abuse of The Program Data Vector. SAS Global Forum 2012. Paper 255-2012. • Howard N. How SAS Thinks or Why the DATA Step Does What it Does. SUGI 29. Paper 252-29.
5. SLEUTHING That’s right- the first 5 SAS skills do not directly involve writing SAS code. However, these skills form a foundation for understanding and programming SAS efficiently. Sleuthing is the ability to figure out why code is not working… and it takes a combination of knowledge, attention to detail, and patience. Sometimes when your brain is tired and sleep and caffeine levels are low, even the simplest problem can take hours to fix. I’m not too proud to admit that I’ve spent over an hour trying to figure out why my newly created variables aren’t showing up in my dataset: only to realize (finally!!) that I didn’t add them to the keep statement. I’ve been asked repeatedly why I can spot many SAS errors easily… its because I have had alot of practice! The key tool to verify that SAS programs are functioning correctly is the SAS LOG. Error messages, warnings, and notes are all color-coded and help to guide you to fix the problems. In Enterprise Guide, long programs can be broken into smaller modules. When there is an error in a program, EG flags just that module with a red ‘X’. In addition, you can modify the formatting of your error messages in your EG log (Aandured 2012) and create one large project log for all aspects of your project.
Learn more about sleuthing here:
• LeBouton K. Help! My SAS Program Isn’t Working: Where to Turn When You Need Help. SAS Global Forum 2011. Paper 210-2011.
• Dilorio F. The SAS Debugging Primer. SUGI 26. Paper 54-26. • Delwiche L and Slaughter S. Errors, Warnings, and Notes (Oh My), A Practical Guide to
Debugging SAS Programs. WUSS Proceedings 2009. • Aandured T. SAS Enterprise Guide: Identifying Errors in the Log.
http://www.bi-notes.com/2012/04/sas-enterprise-guide-log-errors/
6. MERGING AND COMBINING DATA Merging data sets is an essential component of SAS programming. Merging requires you to understand the relationship between the variables in the SAS tables. For example, you may have a table listing all of your study participants and a table that contains lab values for these study participants. When using a complex dataset with many tables, the process of understanding the relationships between the tables can be time consuming. Once again, drawing diagrams of the tables and their relationship can help you to track and document the process of merging datasets. Merging datasets requires you to identify a common variable across datasets, sort both datasets by the common variable, and then perform the merge. The results of merges are very dependent on the program data vector and how SAS builds datasets. The results of a merge should always be carefully be reviewed to ensure that the results are what you expect.
Poster and Video PresentationsSAS Global Forum 2013

Learn more about merging and combining data here: • Priest EL. Collinsworth AW. Intro to Longitudinal Data: A Grad Student “How-To” Paper. South
Central SAS Users Group Educational Forum 2011. • Step-by-Step Programming with Base SAS Software: Merging SAS Data Sets.
http://support.sas.com/documentation/cdl/en/basess/58133/HTML/default/viewer.htm#a001304305.htm
• Lafler KP. Exploring DATA Step Merges and PROC SQL Joins. SAS Global Forum 2012. Paper 251-2012
• Burlew M. Combining and Modifying SAS Datasets: Examples, Second Edition. SAS Institute. 2009.
• Cody R. Longitudinal Data and SAS: A Programmer’s Guide. SAS Institute. 2001. • Cody R. Cody’s Collection of Popular SAS Programming Tasks and How to Tackle Them. SAS
Institute. 2012. • Cody R. Learning SAS by Example: A Programmer’s Guide. SAS Institute. 2007. • Delwiche L and Slaughter S. The Little SAS Book: A Primer, Fourth Edition. SAS Institute. 2008. • Delwiche L and Slaughter S. The Little SAS Book for Enterprise Guide 4.2. SAS Institute. 2010.
7. ARRAYS I am known for using arrays in almost any situation. Arrays can save you hours of effort and multiple pages of code. Arrays are especially high-impact when you have a large group of similar variables and you want to ‘do the same thing’ to all of the variables. This could be performing a calculation, using a SAS function, or simple recoding. Arrays can also be used to create new variables or to restructure datasets. The following lists situations that you might consider using an array (Priest and Harper 2010).
You might need an array if…. You have a list of variables and:
• You need to perform the same comparison, calculation, or function on all of them • You need to recode all of them, like reverse the numbering • You need to code all the ‘.’ (numeric missing) or ‘’(character null) to a missing value like
-9999 or vice versa • You want to look through a list of variables and find a specific value or create a flag • You have multiple records and you want to make a single record • You have a single record and you want to make multiple records
Other signs you might need an array* • You find yourself cutting and pasting code over and over • You are too lazy too efficient to waste time typing repetitive code *these are also signs you might need to learn basic macros!
To fully understand how an array works, you need to know how SAS compiles and executes programs (See 4. The Program Data Vector). I imagine an array as a group of buckets or boxes. You give the array a name so that you have a ‘nickname’ way to reference each box. Next, you tell SAS how many boxes you need and what values to put into the boxes. Technically speaking, each of these boxes is called an ‘element’ and the nickname is the ‘Array reference’. In the diagram below, I have an array called ‘box’ with 5 elements. Once the data is loaded into these boxes, it can be manipulated in many ways. (Priest and Harper 2010).
Poster and Video PresentationsSAS Global Forum 2013

ARRAY: BOX
Array Reference
BOX[1] BOX[2] BOX[3] BOX[4] BOX[5]
Element
Learn more about arrays here:
• Priest EL, Harper JS. Intro to Arrays: A Grad Student ‘How-To’ Paper. South Central SAS Users Group 2010 Educational Forum, Austin TX.
• SAS. ARRAY Statement. SAS® 9.3 Language Reference http://support.sas.com/documentation/cdl/en/lestmtsref/63323/HTML/default/viewer.htm#p08do6szetrxe2n136ush727sbuo.htm
• Waller, J. How to use ARRAYs and DO Loops: Do I DO OVER or Do I DO i? SAS Global Forum 2010. Paper 158-2010.
• First, S. and Schudrowitz, T. Arrays Made Easy: An Introduction to Arrays and Array Processing. SUGI 30. Paper 242-30.
• Keelan, S. Off and Running with Arrays in SAS. SUGI 27. Paper 66-27.
Intermediate/Advanced Application of arrays • Cody, R. Transforming SAS Data Sets Using Arrays. SUGI 25. Paper 1-25. • Scerbo, M. Everyone Needs a Raise (Arrays). SAS Global Forum 2007. Paper 216-2007. • MacDougall, M. Comparing Pairs: The Array’s the Thing. SUGI 26. Paper 106-26. • Leslie, R.S. Using Arrays to Calculate Medication Utilization. SAS Global Forum 2007. Paper 043-2007.
8. LONGITUDINAL DATA Longitudinal data can present a wide range of challenges for graduate students. Often, longitudinal data has been collected as part of a larger study and students are using the data for secondary analysis. The data may be in multiple datasets. Hopefully, the data documentation, including the data dictionary, is complete- but oftentimes it is missing or out of date. Other challenges include combining datasets, counting repeat observations, performing calculations across records, and restructuring repeating data from multiple observations to single observation. Students need to understand how to merge multiple datasets, need tools for data set exploration and data cleaning, a variety of functions to restructure the data and create variables, FIRST. and LAST. variables, and how to transform datasets using PROC TRANSPOSE. Cody has an excellent book focused primarily on techniques that arise frequently in longitudinal data.
This is an example of counting multiple visits for participants.
Poster and Video PresentationsSAS Global Forum 2013
Learn more about longitudinal data here: • Priest EL. Collinsworth AW. Intro to Longitudinal Data: A Grad Student “How-To” Paper. South Central SAS
Users Group Educational Forum 2011. • Cody R. Longitudinal Data and SAS: A Programmer’s Guide. SAS Institute. 2001. • Cody R. Cody’s Data Cleaning Techniques Using SAS, Second Edition. SAS Institute. 2008. • Cody, R. Longitudinal Data Techniques: Looking Across Observations. SAS Global Forum 2011 Paper
265-2011 • Transpose Procedure. Base SAS 9.3 Procedures Guide. Accessed at:
http://support.sas.com/documentation/cdl/en/proc/63079/HTML/default/viewer.htm#n1xno5xgs39b70n0zydov0owajj8.htm
• The LAG and DIF Functions. SAS/ETS 9.2 Users Guide. Accessed at: http://support.sas.com/documentation/cdl/en/etsug/60372/HTML/default/viewer.htm#etsug_tsdata_sect048.htm/
• SAS Date, Time, and Datetime Functions. SAS/ETS 9.2 Users Guide. Accessed at: http://support.sas.com/documentation/cdl/en/etsug/60372/HTML/default/viewer.htm#etsug_intervals_sect014.htm
• Working with Time Series Data. SAS/ETS 9.3 Users Guide: Accessed at: http://support.sas.com/documentation/cdl/en/etsug/63939/HTML/default/viewer.htm#tsdata_toc.htm
9. OUTPUT DELIVERY SYSTEM I’m not sure how I lived without the Output Delivery System. When I was finishing my master’s thesis, I remember pouring through hundreds of pages of output, pulling out specific odds ratios and p-values. It was hours and hours of tedious work. At some point, I read the book by Haworth and Zander (2009) and learned how to use the output delivery system. The output delivery system allows you to output data to other destinations besides the standard listing. For example, you can create rich text format (.RTF) files that can be opened in Microsoft Word. There are many different templates that can be used to customize the format of the SAS output. However, more importantly to me, I learned how to use ODS TRACE ON to identify the data tables that SAS is generating “behind the scenes”. These data tables are then used by SAS to create the output that we are used to. For example, if I wanted to identify the data that is produced from a PROC PHREG, I can use the ODS TRACE statement to do so.
ods trace on; proc phreg data=work.data; model pyrs*progress(0) = acidicbev_fu / risklimits; run; ods trace off;
This results in the following statements in the log, as well as the standard output window output that we are used to:
------------- Name: ParameterEstimates Label: Maximum Likelihood Estimates of Model Parameters Template: Stat.Phreg.ParameterEstimates Path: Phreg.ParameterEstimates -------------
Poster and Video PresentationsSAS Global Forum 2013

If I want to capture this data in a dataset, I use the following statement ODS output PARAMETERESTIMATES=work.overall to output the data table work.overall:
ods output parameterestimates=work.Overall; proc phreg data=work.data; model pyrs*progress(0) = acidicbev_fu / risklimits; run; ods output close;
And I get a dataset with the parameter estimates that I am interested in.
. Once you are able to access all the “data behind the output”, you can take these tables and reformat them. This technique was critical for my dissertation simulation. I was able to take the results of all 10,0000 summarize them to get overall results. In addition to simulations, ODS output is also great for doing exploratory analysis or any other type of project where you need to summarize many different parameters into tables. I frequently combine these ODS techniques with macros (see 10. Macros). Learn more about ODS here:
• Priest EL, Adams B, Fischbach L. Easier Exploratory Analysis for Epidemiology: A Grad Student How To Paper. SAS Global Forum 2009. Paper 241-2009.
• Base SAS. Output Delivery System. http://support.sas.com/rnd/base/ods/index.html
• SAS 9.3 Output Delivery System: User’s Guide, Second Edition http://support.sas.com/documentation/cdl/en/odsug/65308/HTML/default/viewer.htm#odsugwhatsnew93.htm
• ODS Tipsheet. http://support.sas.com/rnd/base/ods/scratch/ods-tips.pdf • Haworth L and Zander C. Output Delivery System (ODS): The Basics and Beyond. SAS Institute. 2009.
10. MACROS Using and understanding SAS macros can same graduate students a lot of time. As I mentioned in 7. Arrays, you may need to consider using macros if you find yourself cutting and pasting a lot of repetitive code. There are actually two different uses of the term “macro” in SAS. Slaughter and Delwiche describe the difference between “macros” and “macro variables”: Macro variable
• Starts with an ampersand (&) • Like a normal variable • Does not belong to a data set • Only can have character (text) values
Macro • Starts with a percent sign (%) • Larger part of a program
Poster and Video PresentationsSAS Global Forum 2013

• Can contain DATA and PROC steps • Can contain macro statements like %IF- %THEN • May contain macro variables.
One simple example of writing a macro is to take a PROC that will be used repetitively and turn it into a macro. The macro “STATS” below takes a simple PROC PHREG and converts it into a macro that can be used multiple times without cutting and pasting the whole PHREG. In the macro STATS, two macro variables are defined: &cvar. (covariate) and &outcome (outcome). The macro is called by the statement: %stats (cvar=acidicbev_fu outcome=progress). Running this statement calls the macro stats and sends it the values for cvar (acidicbev_fu) and outcome (progress) that are then resolved in the PROC PHREG. Thus, you can run the PHREG for multiple variables by writing the %STATS macro call instead of the entire PHREG. This is one of the simplest uses of macros, but it shows how macros can save repetitive coding.
%macro Stats (cvar=, outcome=); *Stats Overall*; ods output parameterestimates=work.Overall; proc phreg data=work.data; model pyrs*&outcome.(0) = &cvar. / risklimits; run; ods output close; %mend stats; *call macro to test*; %stats (cvar=acidicbev_fu, outcome=progress);
Macro resolved and run:
proc phreg data=work.data; model pyrs*progress(0) = acidicbev_fu / risklimits; run;
Learn more about macros here:
• Carpenter A. Carpenter’s Complete Guide to the SAS Macro Language. 2nd Edition. SAS Institute, 2004.
• SAS 9.3 Macro Language: refer • Berlew, M. SAS Macro Programming Made Easy. 2nd Edition. SAS Publishing, 2007. • Slaughter S and Delwiche S. SAS Macro Programming for Beginners. SUGI 29 Proceedings.
Paper 243-29. • Fehd R. List Processing Basics: Creating and Using Lists of Macro Variables. SAS Global Forum
2007. Paper 113-2007. • Priest EL, Adams B, Fischbach L. Easier Exploratory Analysis for Epidemiology: A Grad Student
How To Paper. SAS Global Forum 2009. Paper 241-2009. CONCLUSION In conclusion, this paper is a culmination of the SAS challenges I overcame and many of the SAS skills that I learned outside of the classroom. My goal in this paper was to introduce these concepts to graduate students and to provide them with resources to learn these skills on their own. This paper is the sixth in the ‘Grad Student How-To’ series and provides graduate students with a list of 10 essential SAS skills plus references to find more detailed information on each of the topics.
Poster and Video PresentationsSAS Global Forum 2013

ACKNOWLEDGMENTS Thanks to Dr. Lori Fischbach who provided guidance and SAS challenges throughout my graduate school career. Thanks also to my co-authors on previous papers in the “Grad Student How-To Series” that provided me with examples for many of these topics.
CONTACT INFORMATION Your comments and questions are valued and encouraged. Contact the author at:
Elisa L. Priest, DrPH [email protected]
SAS and all other SAS Institute Inc. product or service names are registered trademarks or trademarks of SAS Institute Inc. in the USA and other countries. ® indicates USA registration. Other brand and product names are trademarks of their respective companies.
Poster and Video PresentationsSAS Global Forum 2013