Embed Size (px)
Citation preview
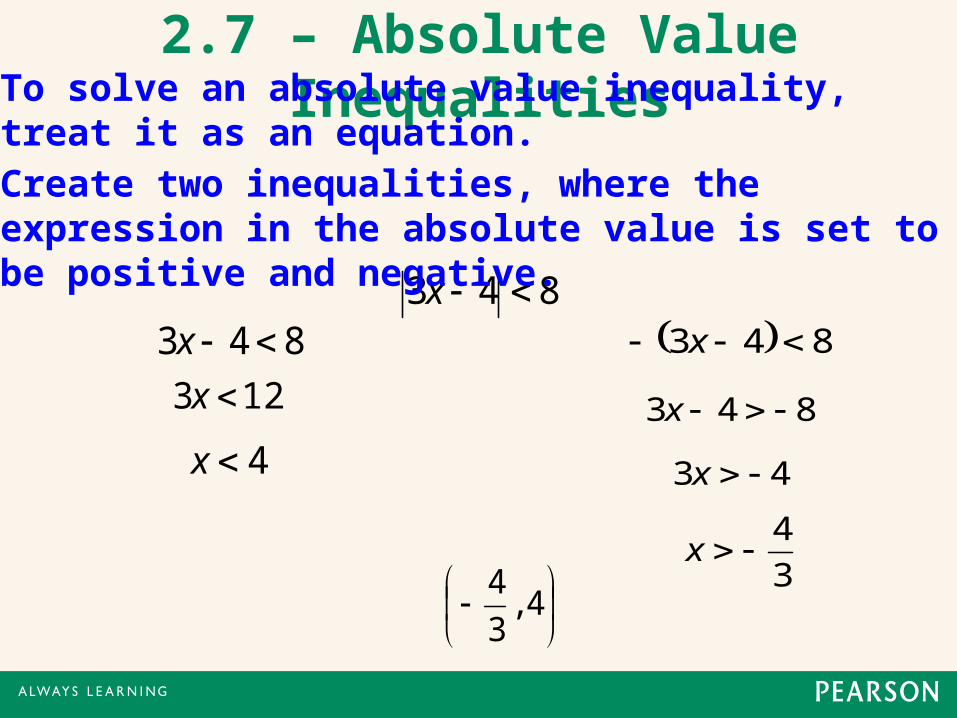
2.7 – Absolute Value InequalitiesTo solve an absolute value inequality, treat it as an equation.
843 x
123 x
843 x
4x
843 x
843 x
43 x
3
4x
4,
3
4
Create two inequalities, where the expression in the absolute value is set to be positive and negative.
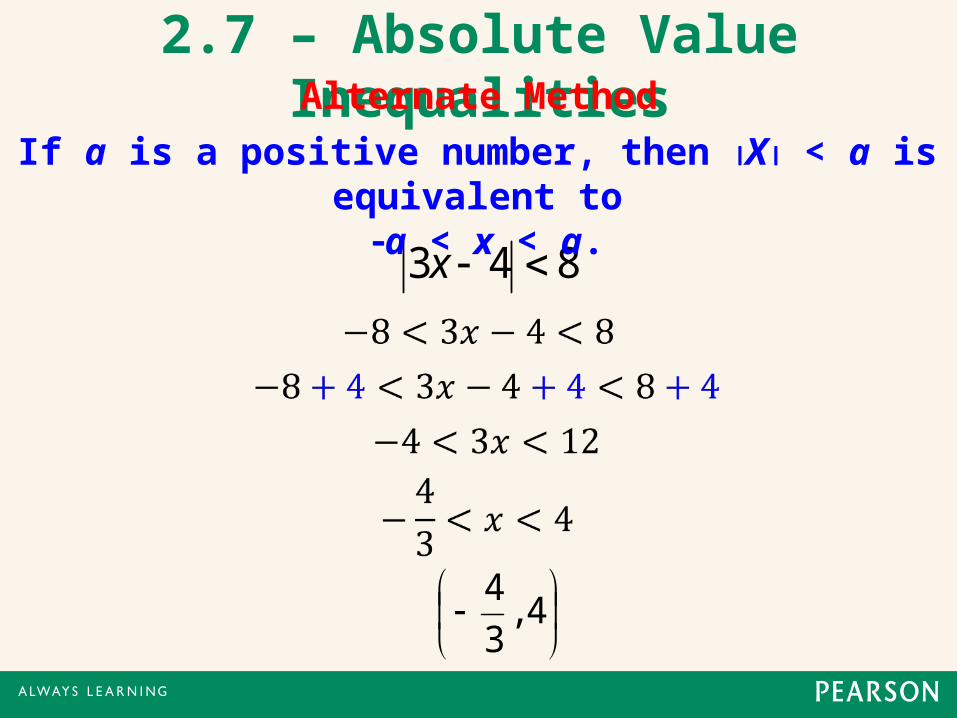
2.7 – Absolute Value InequalitiesAlternate Method
843 x
4,
3
4
If a is a positive number, then X < a is equivalent to a < x < a.
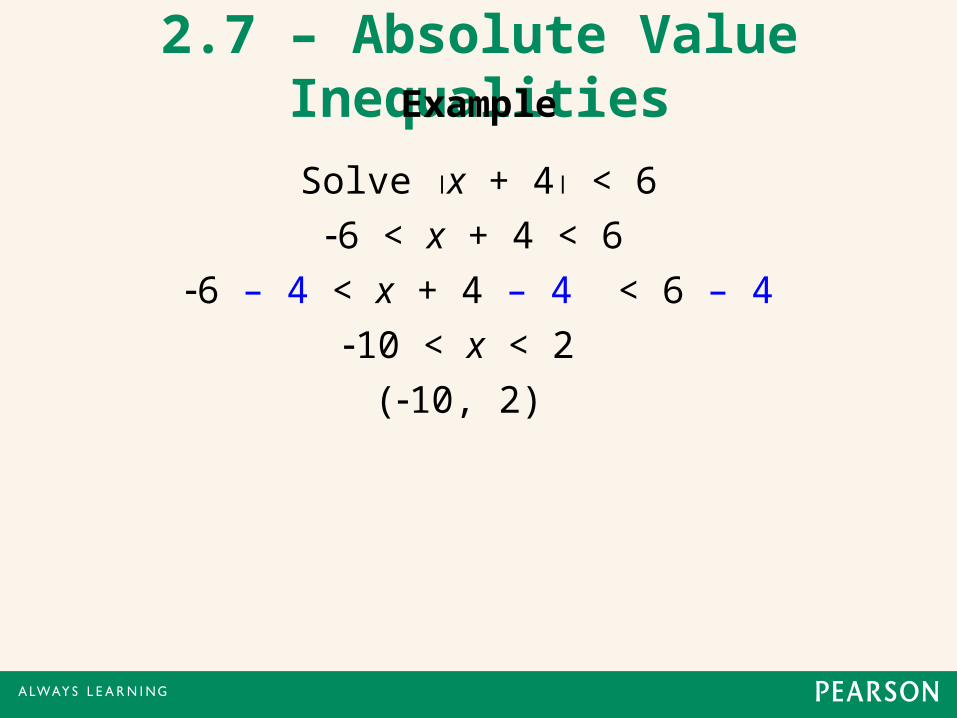
2.7 – Absolute Value InequalitiesExample
Solve x + 4 < 6
6 < x + 4 < 6
6 – 4 < x + 4 – 4 < 6 – 4
10 < x < 2
(10, 2)
2.7 – Absolute Value Inequalities
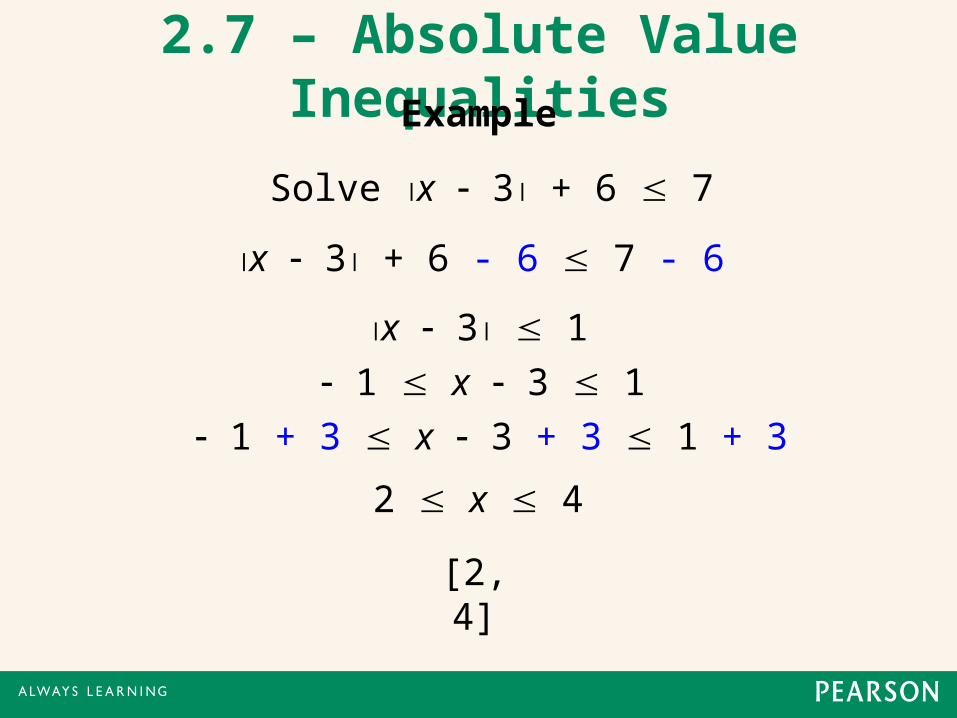
Solve x 3 + 6 7
x 3 1
1 x 3 1
2 x 4
[2, 4]
x 3 + 6 - 6 7 - 6
1 + 3 x 3 + 3 1 + 3
Example
2.7 – Absolute Value Inequalities
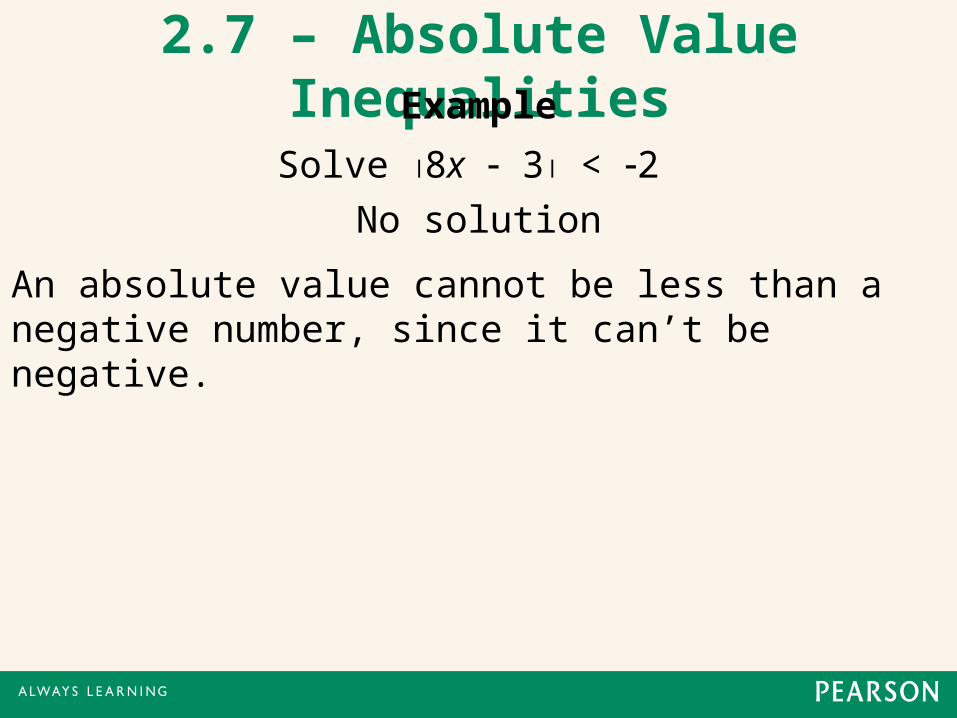
Solve 8x 3 < 2No solution
An absolute value cannot be less than a negative number, since it can’t be negative.
Example
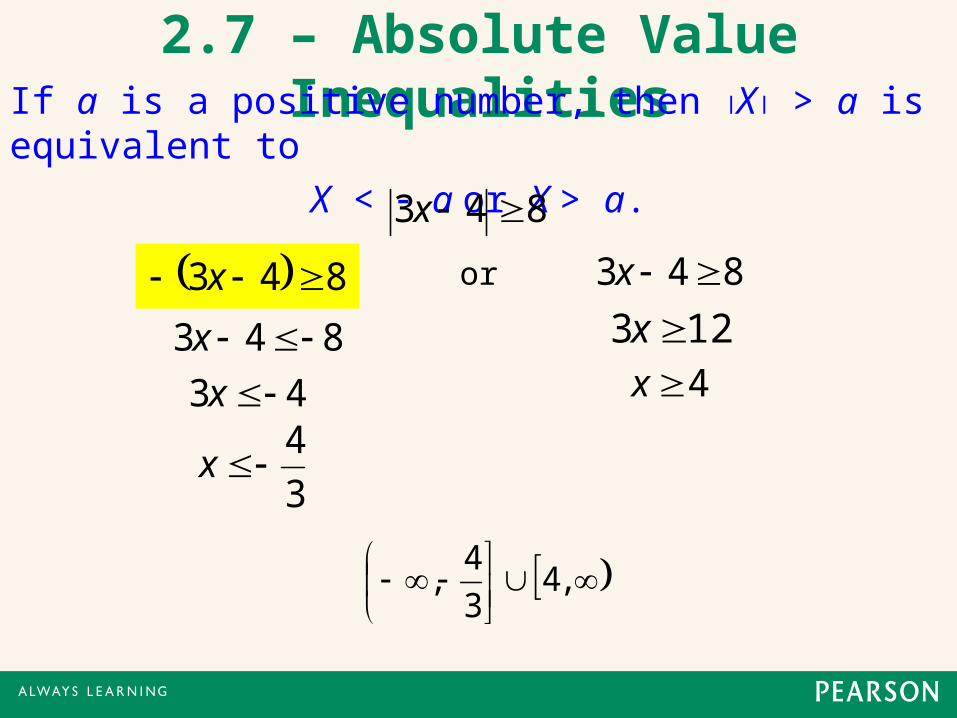
2.7 – Absolute Value InequalitiesIf a is a positive number, then X > a is equivalent to
X < a or X > a.
843 x
123 x
843 x
4x
843 x
843 x
43 x
3
4x
or
,4
3
4,
2.7 – Absolute Value Inequalities
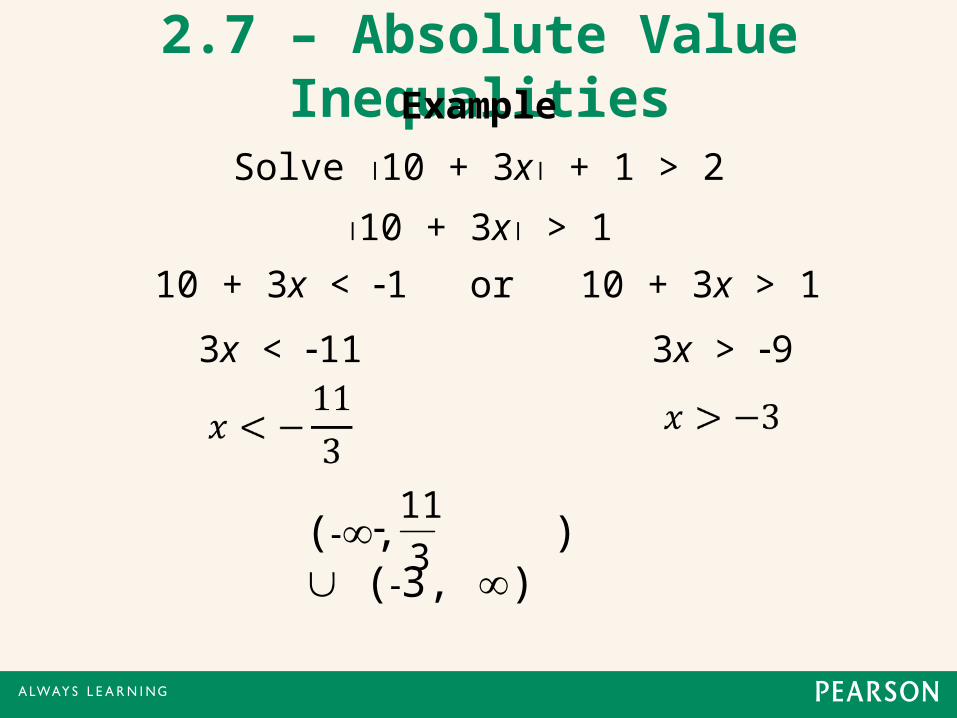
Solve 10 + 3x + 1 > 2
Example
10 + 3x > 1
10 + 3x < 1
3x < 11 3x > 9
(, ) (3, )3
11
or 10 + 3x > 1
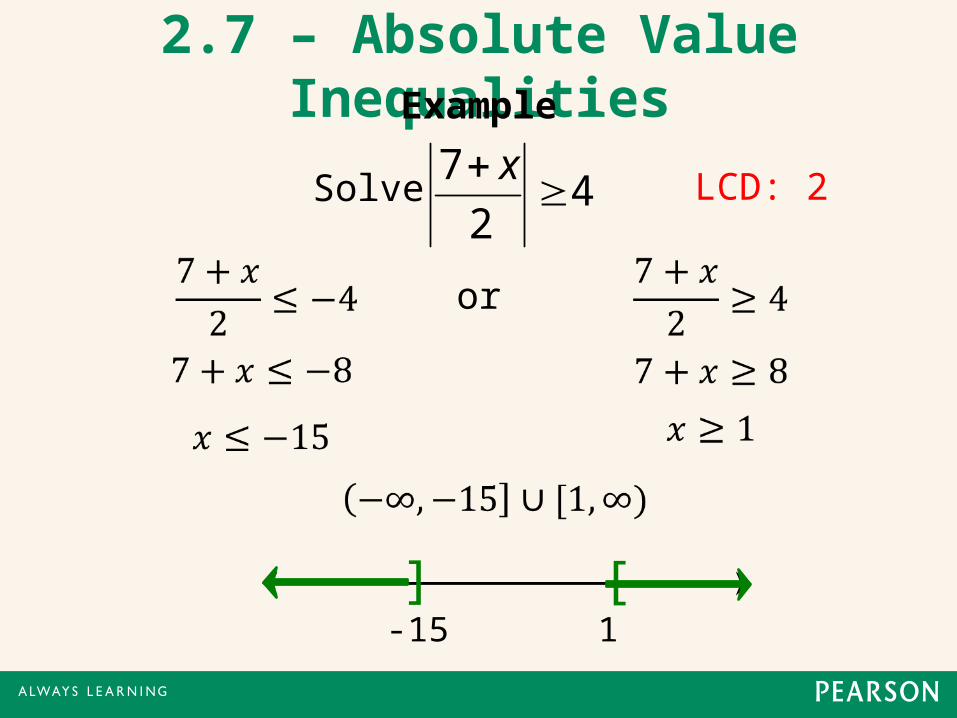
2.7 – Absolute Value InequalitiesExample
42
7
xSolve
1[]
-15
or
LCD: 2
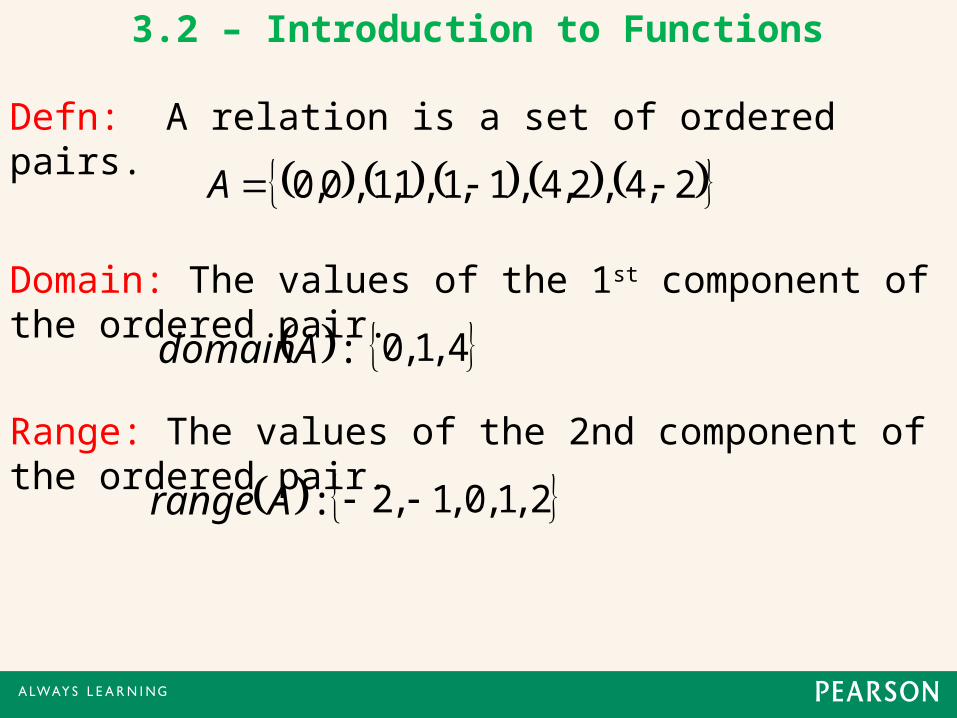
Defn: A relation is a set of ordered pairs.
2,4,2,4,1,1,1,1,0,0 A
:Arange
4,1,0
2,1,0,1,2
Domain: The values of the 1st component of the ordered pair.
:Adomain
Range: The values of the 2nd component of the ordered pair.
3.2 – Introduction to Functions
3.2 – Introduction to Functions
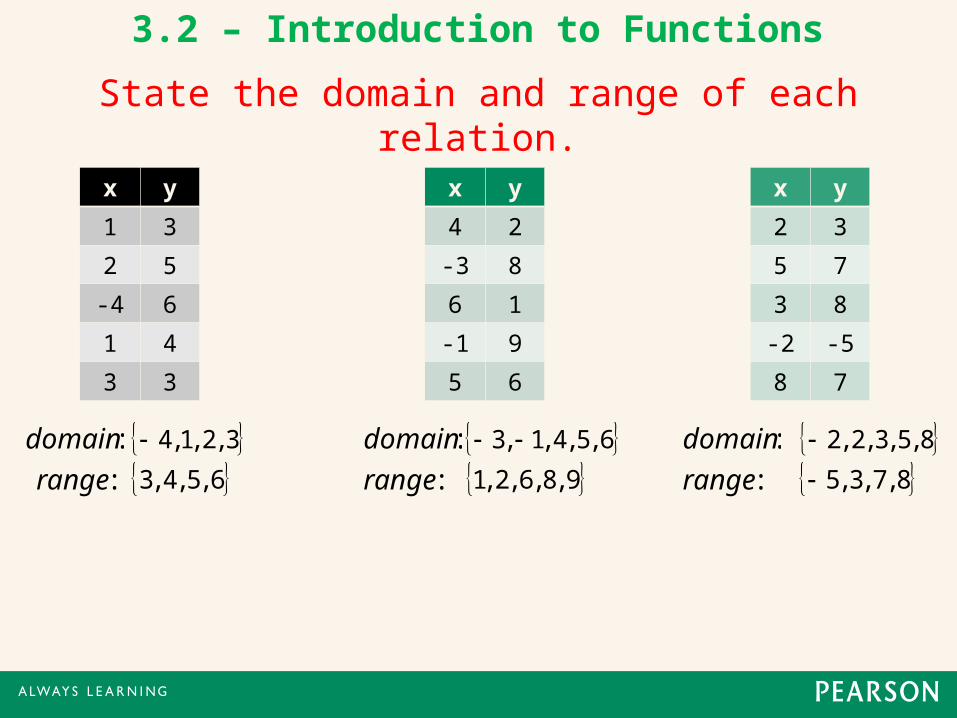
:range 6,5,4,3
3,2,1,4:domain
x y
1 3
2 5
-4 6
1 4
3 3
x y
4 2
-3 8
6 1
-1 9
5 6
x y
2 3
5 7
3 8
-2 -5
8 7
:range 9,8,6,2,1
6,5,4,1,3 :domain
:range 8,7,3,5
8,5,3,2,2:domain
State the domain and range of each relation.
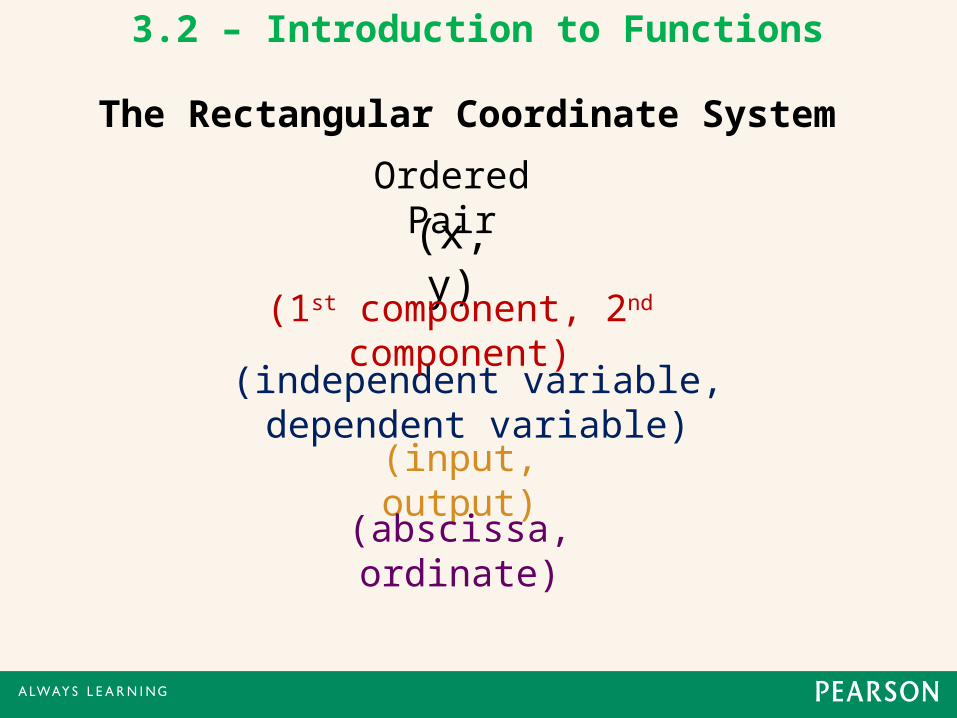
The Rectangular Coordinate System
Ordered Pair
(x, y)
(independent variable, dependent variable)
(1st component, 2nd component)
(input, output)
(abscissa, ordinate)
3.2 – Introduction to Functions
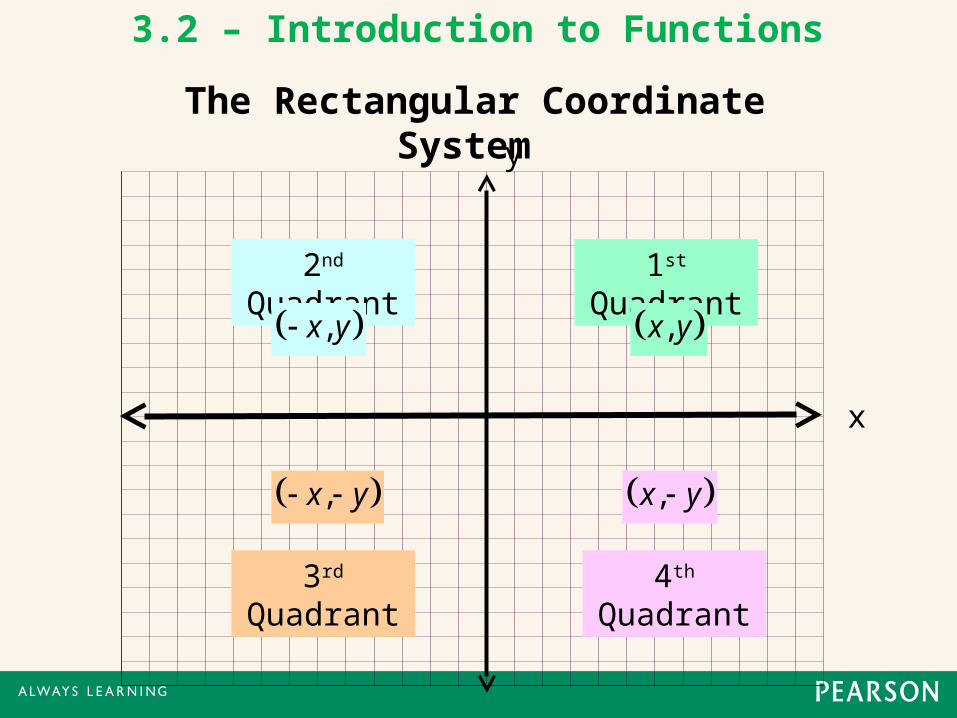
x
y
1st Quadrant2nd Quadrant
3rd Quadrant 4th Quadrant
The Rectangular Coordinate System
,x y ,x y
,x y ,x y
3.2 – Introduction to Functions
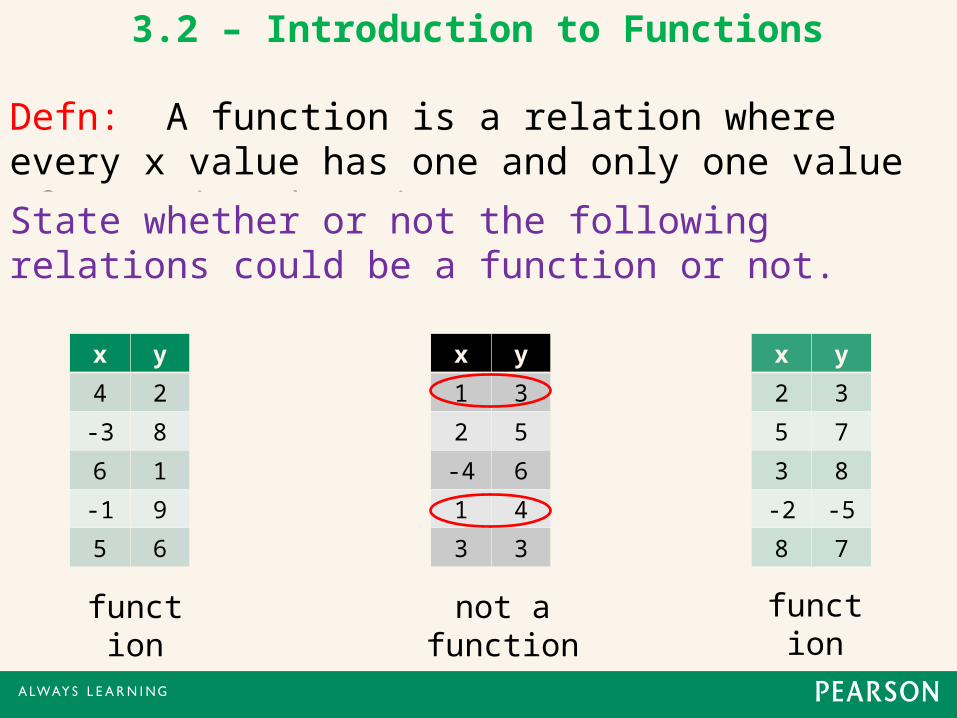
Defn: A function is a relation where every x value has one and only one value of y assigned to it.
x y
1 3
2 5
-4 6
1 4
3 3
x y
4 2
-3 8
6 1
-1 9
5 6
x y
2 3
5 7
3 8
-2 -5
8 7
function not a function function
State whether or not the following relations could be a function or not.
3.2 – Introduction to Functions
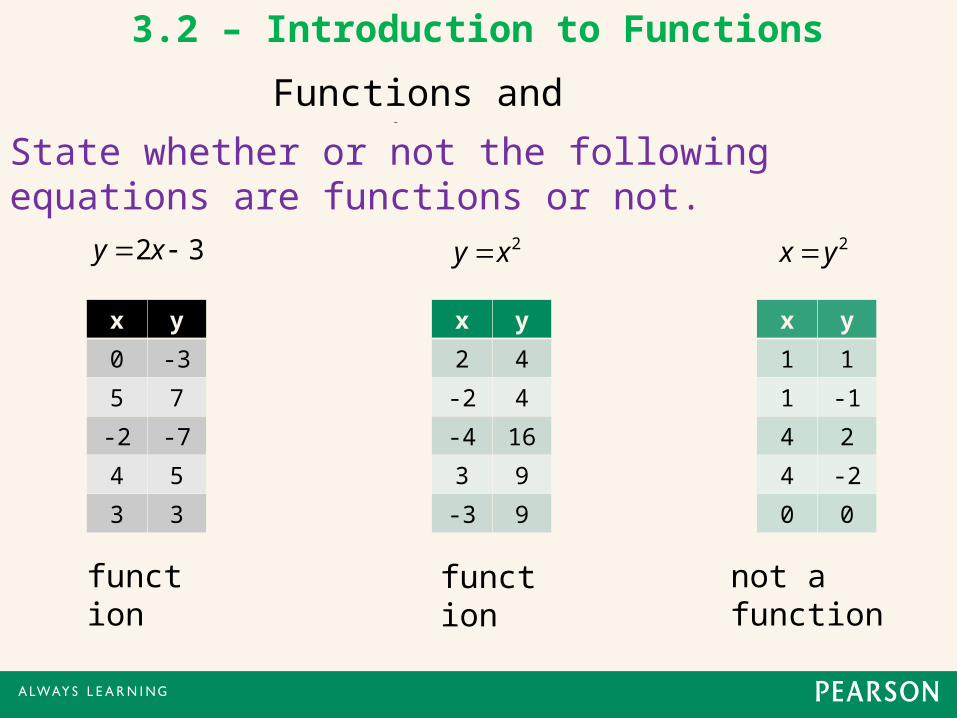
Functions and Equations.
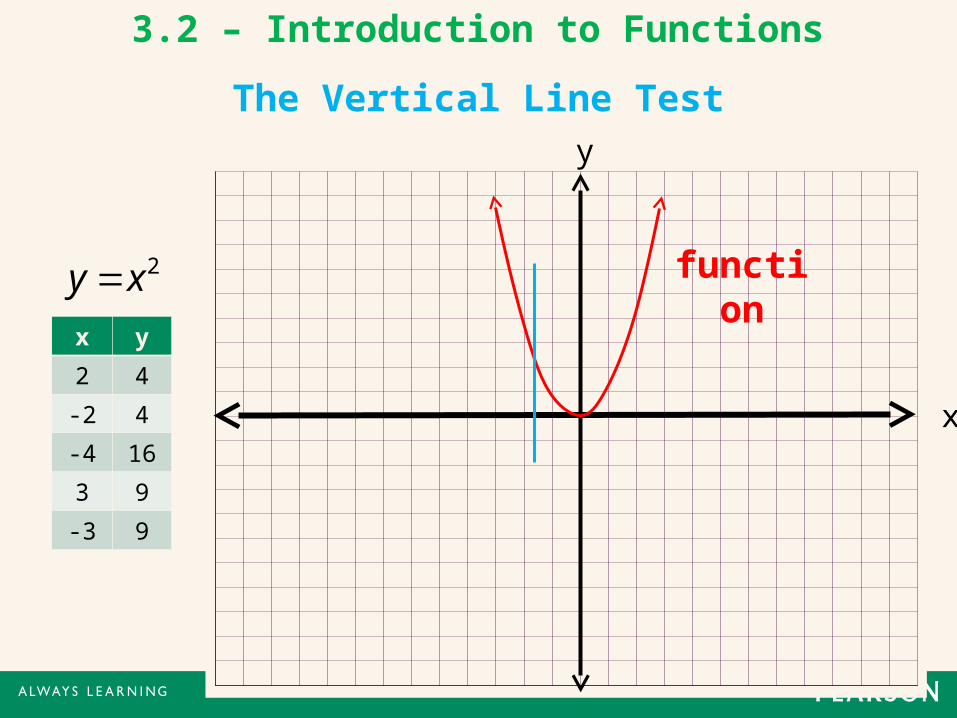
32 xy
x y
0 -3
5 7
-2 -7
4 5
3 3
x y
2 4
-2 4
-4 16
3 9
-3 9
x y
1 1
1 -1
4 2
4 -2
0 0
2xy 2yx
function function not a function
3.2 – Introduction to Functions
State whether or not the following equations are functions or not.
3.2 – Introduction to Functions
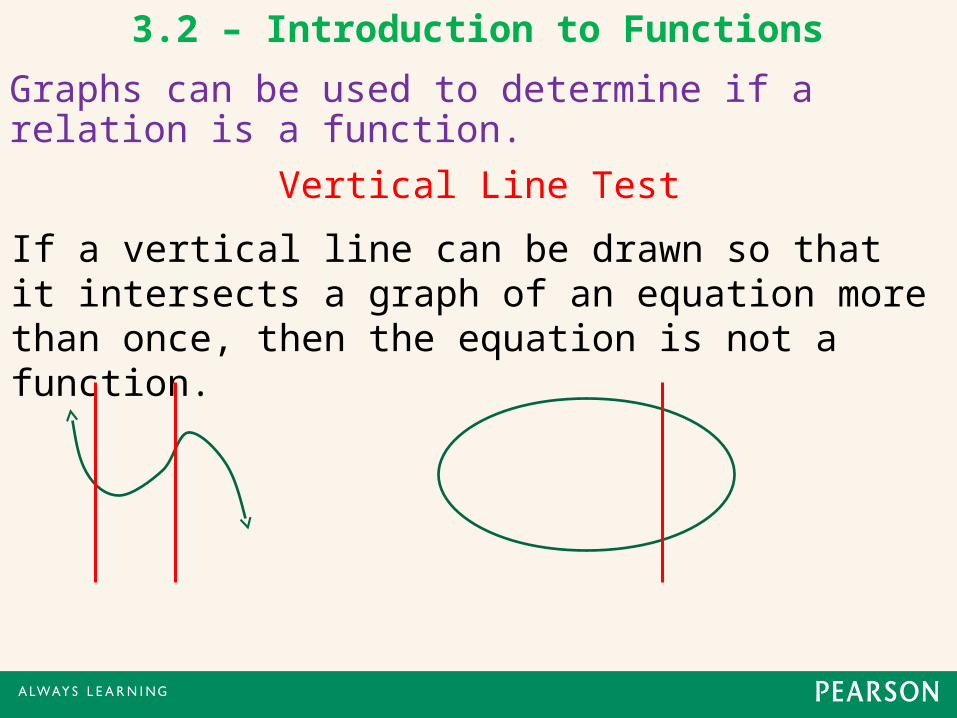
Vertical Line Test
Graphs can be used to determine if a relation is a function.
If a vertical line can be drawn so that it intersects a graph of an equation more than once, then the equation is not a function.
x
y
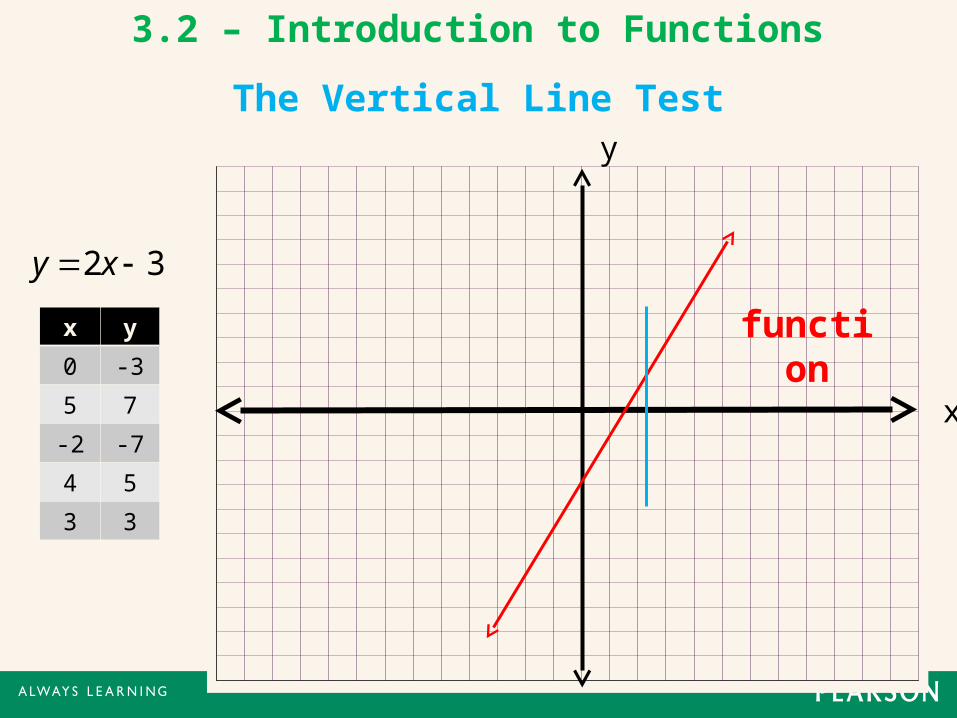
The Vertical Line Test
32 xy
x y
0 -3
5 7
-2 -7
4 5
3 3
3.2 – Introduction to Functions
function
x
y
2xy x y
2 4
-2 4
-4 16
3 9
-3 9
3.2 – Introduction to Functions
The Vertical Line Test
function
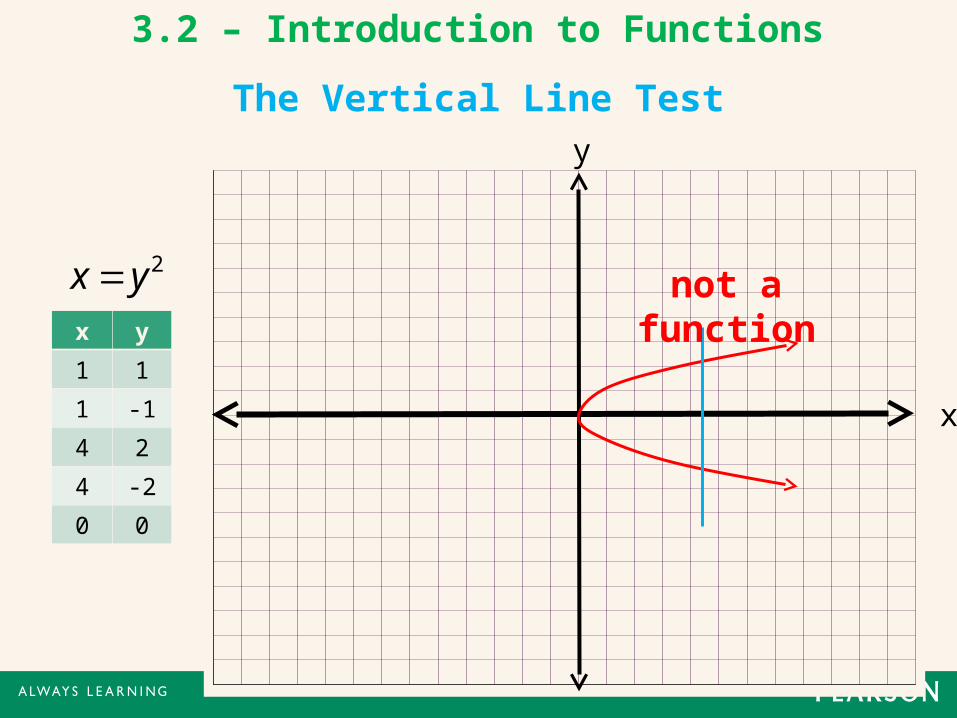
x
y
2yx x y
1 1
1 -1
4 2
4 -2
0 0
3.2 – Introduction to Functions
The Vertical Line Test
not a function
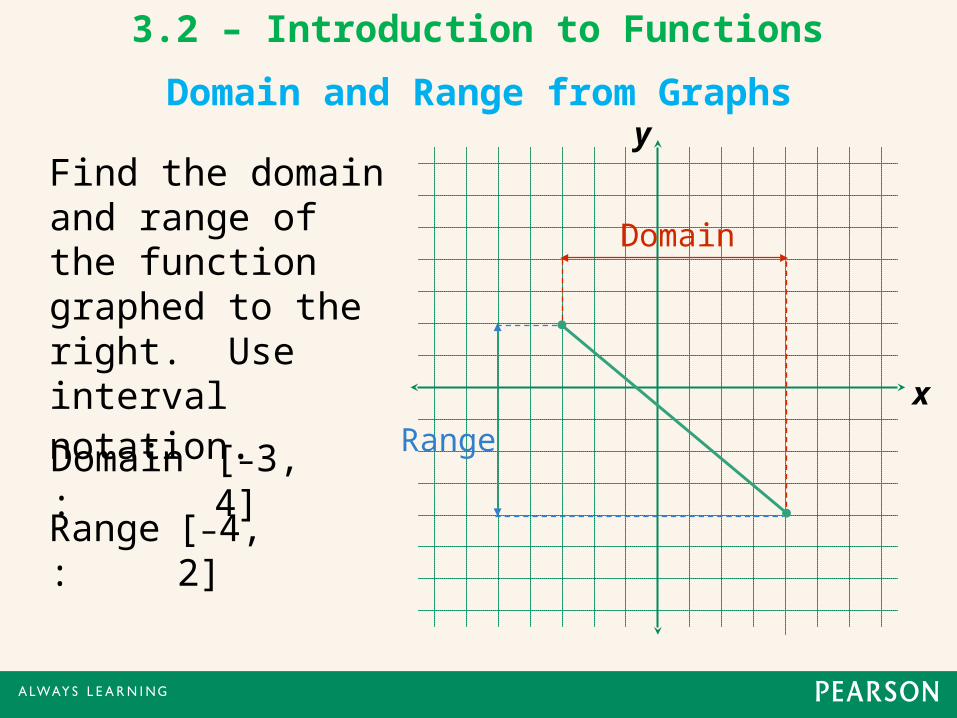
Find the domain and range of the function graphed to the right. Use interval notation.
x
y
Domain:
Domain
Range:
Range[–3, 4]
[–4, 2]
3.2 – Introduction to Functions
Domain and Range from Graphs
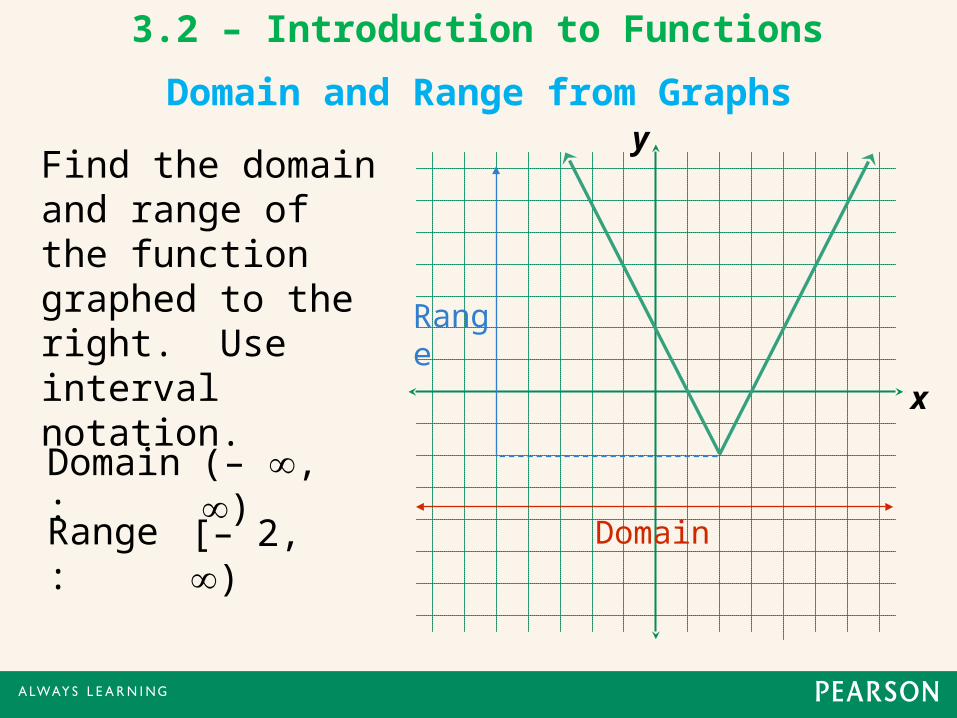
Find the domain and range of the function graphed to the right. Use interval notation.
x
y
Domain:
DomainRange:
Range
(– , )
[– 2, )
3.2 – Introduction to Functions
Domain and Range from Graphs
3.2 – Introduction to Functions
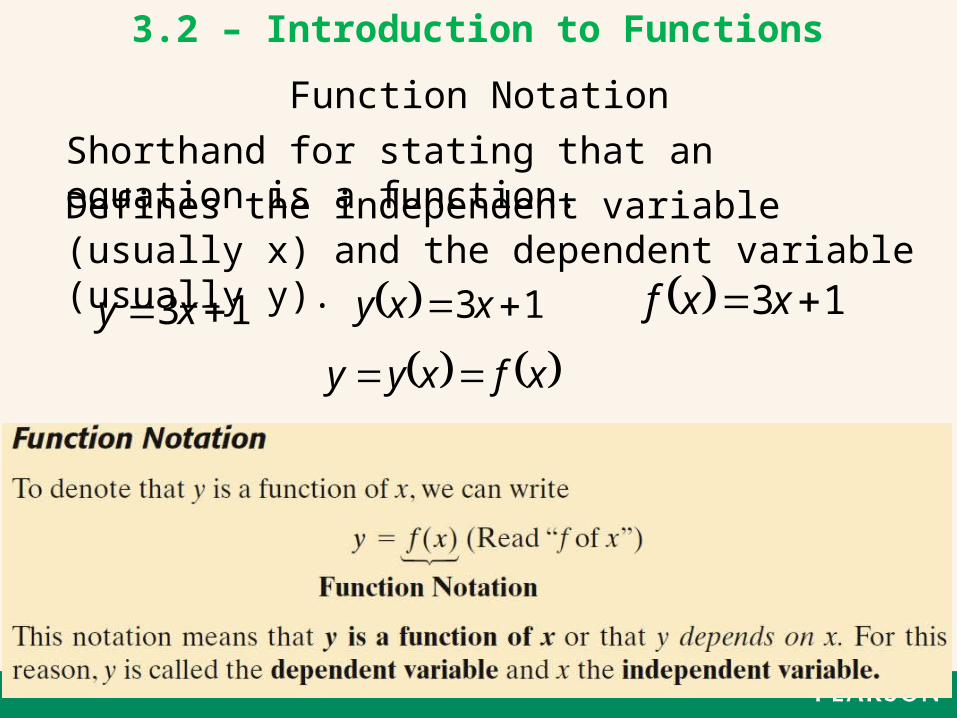
Function Notation
13 xxf 13 xxy
xfxyy
Shorthand for stating that an equation is a function.
13 xy
Defines the independent variable (usually x) and the dependent variable (usually y).
52 xxf
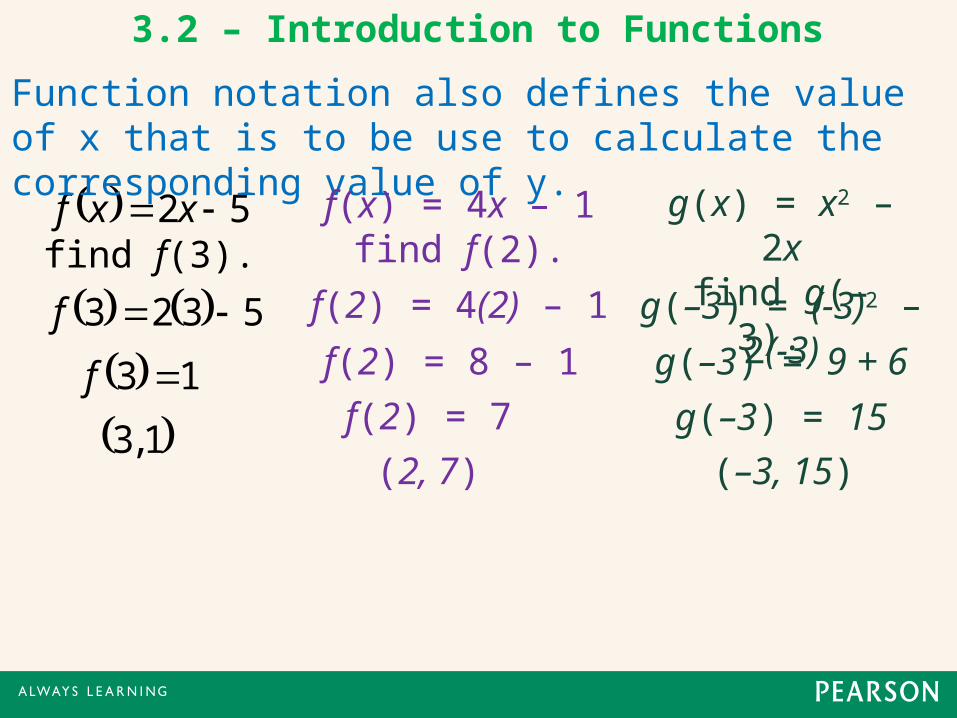
Function notation also defines the value of x that is to be use to calculate the corresponding value of y.
5323 f
13 f
1,3
3.2 – Introduction to Functions
f(x) = 4x – 1find f(2).
f(2) = 4(2) – 1
f(2) = 8 – 1
f(2) = 7
(2, 7)
g(x) = x2 – 2xfind g(–3).
g(–3) = (-3)2 – 2(-3)
g(–3) = 9 + 6
g(–3) = 15
(–3, 15)
find f(3).
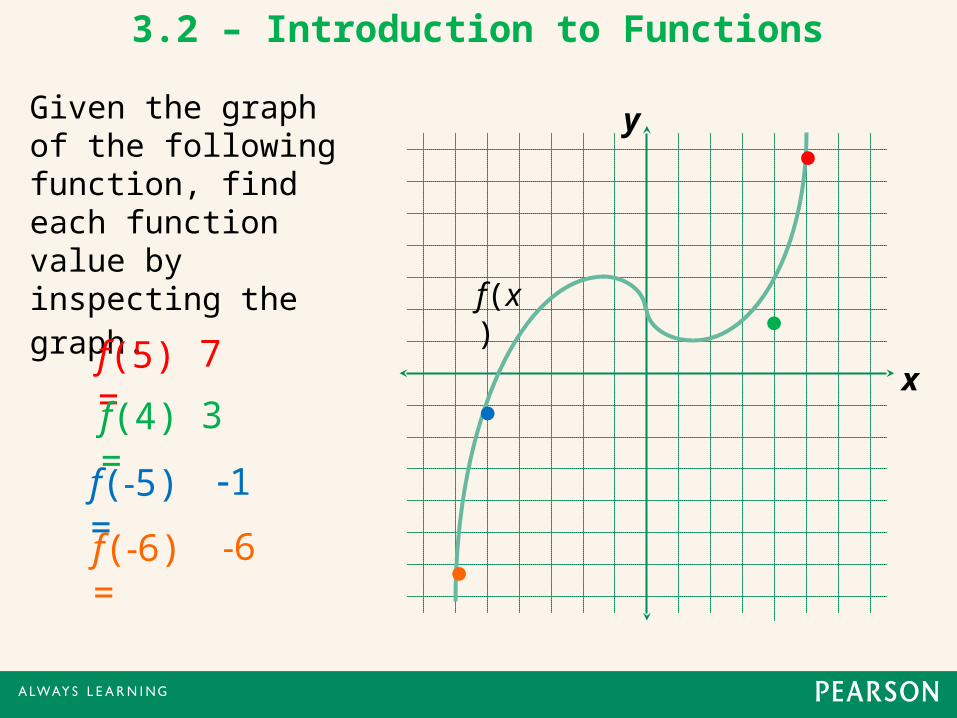
Given the graph of the following function, find each function value by inspecting the graph.
f(5) = 7x
y
f(x)
f(4) = 3
f(5) = 1
f(6) = 6
3.2 – Introduction to Functions
●
●
●
●
3.3 – Graphing Linear Functions
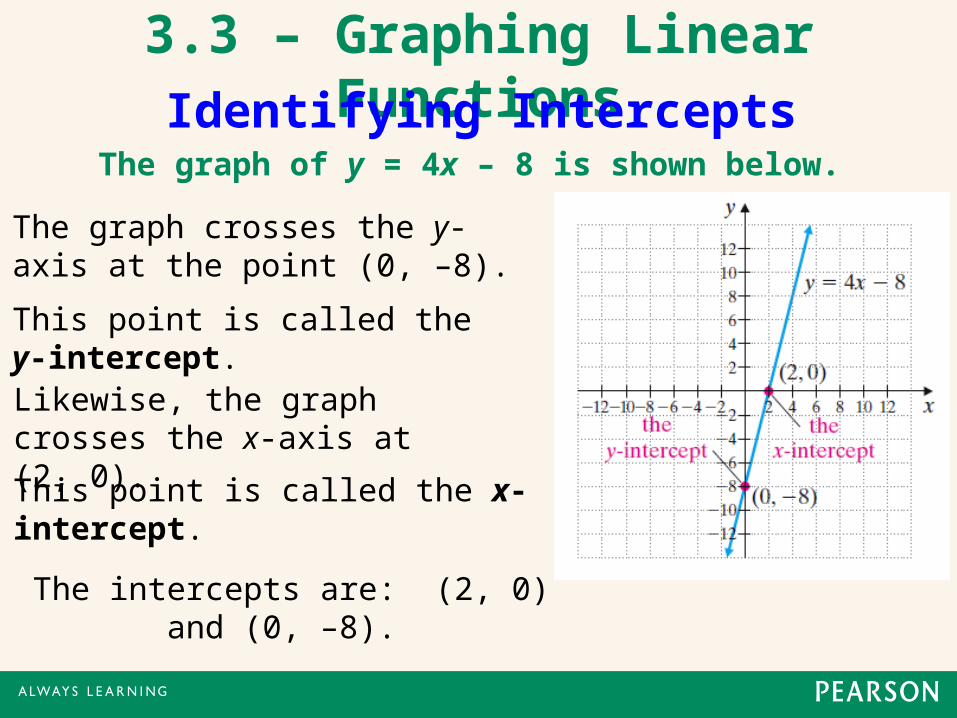
Identifying InterceptsThe graph of y = 4x – 8 is shown below.
The intercepts are: (2, 0) and (0, –8).
The graph crosses the y-axis at the point (0, –8).
Likewise, the graph crosses the x-axis at (2, 0).
This point is called the y-intercept.
This point is called the x-intercept.
3.3 – Graphing Linear Functions
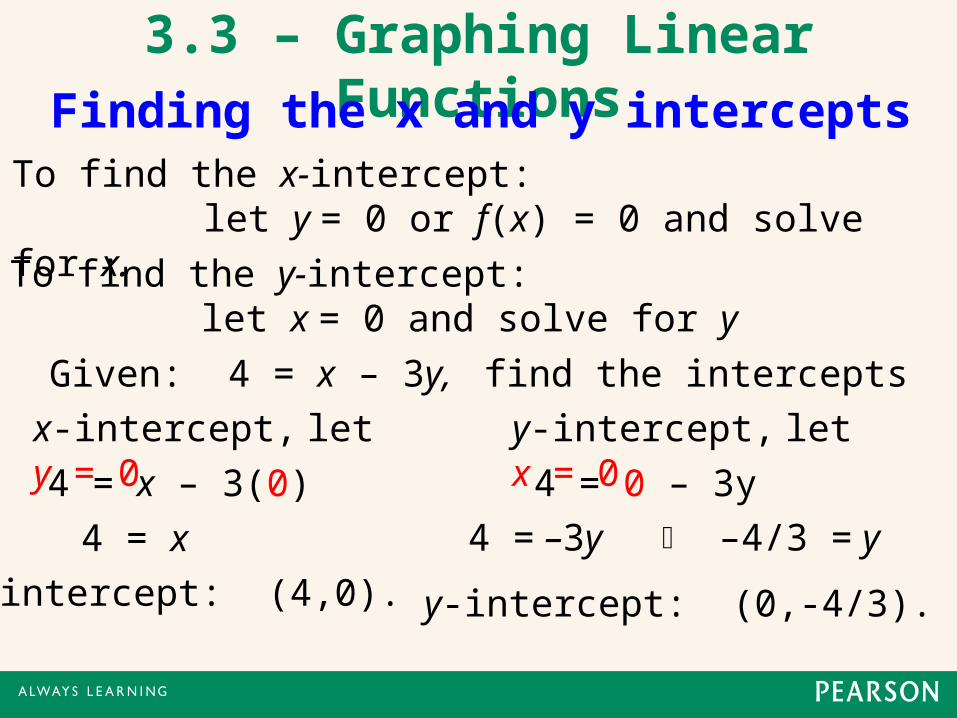
Finding the x and y interceptsTo find the x-intercept:
let y = 0 or f(x) = 0 and solve for x.
To find the y-intercept: let x = 0 and solve for y
Given: 4 = x – 3y, find the intercepts
x-intercept, let y = 0
4 = x – 3(0)
4 = x
x-intercept: (4,0).
y-intercept, let x = 0
4 = 0 – 3y
4 = –3y
y-intercept: (0,-4/3).
–4/3 = y
3.3 – Graphing Linear Functions
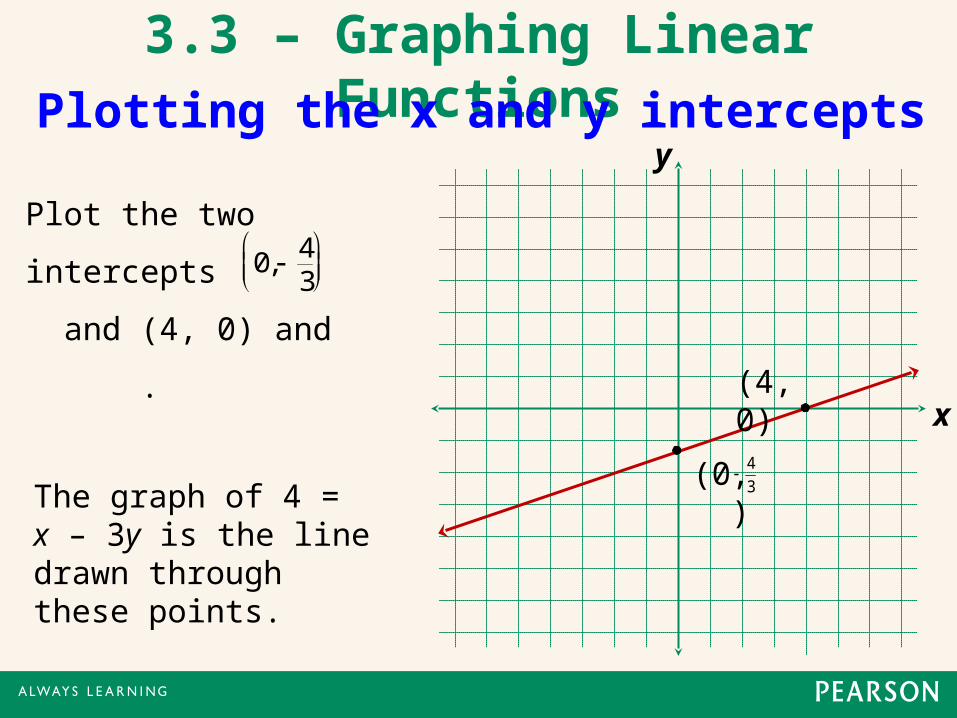
Plotting the x and y intercepts
x
y
The graph of 4 = x – 3y is the line drawn through these points.
Plot the two intercepts
and (4, 0) and . 0, 4
3
(4, 0)
(0, )3
4
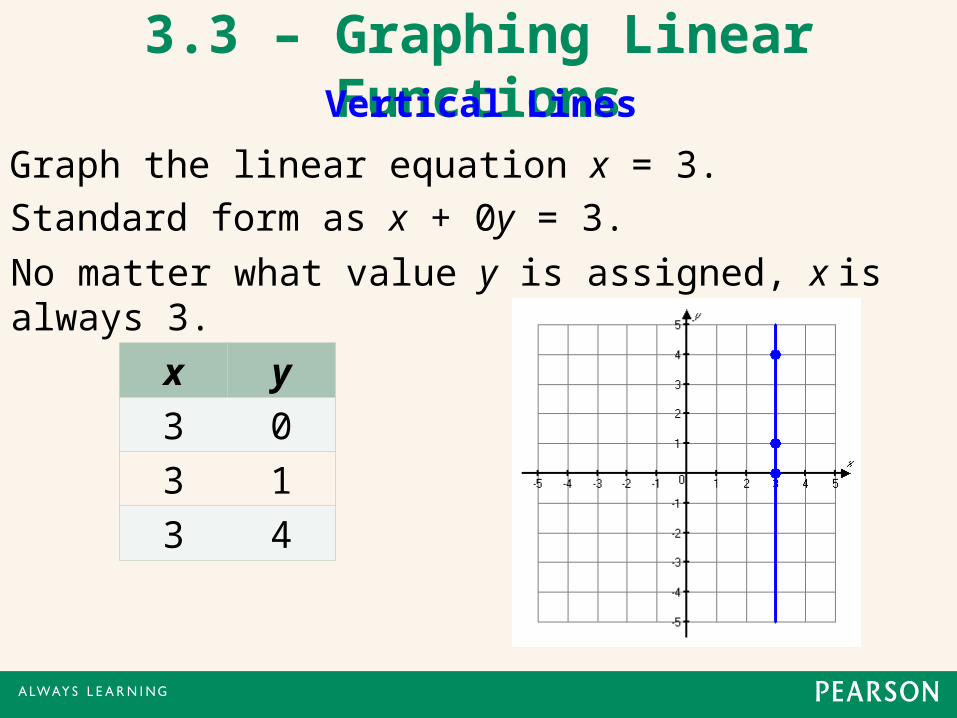
3.3 – Graphing Linear FunctionsVertical Lines
Graph the linear equation x = 3.
x y
3 0
3 1
3 4
Standard form as x + 0y = 3.
No matter what value y is assigned, x is always 3.
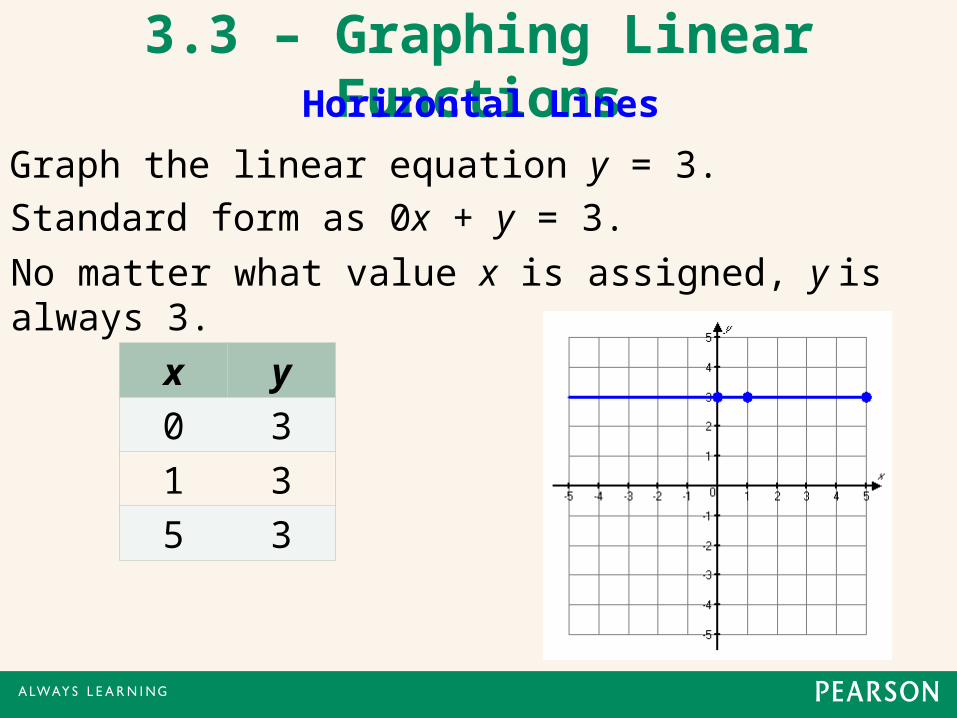
3.3 – Graphing Linear FunctionsHorizontal Lines
Graph the linear equation y = 3.
Standard form as 0x + y = 3.
No matter what value x is assigned, y is always 3.
x y
0 3
1 3
5 3
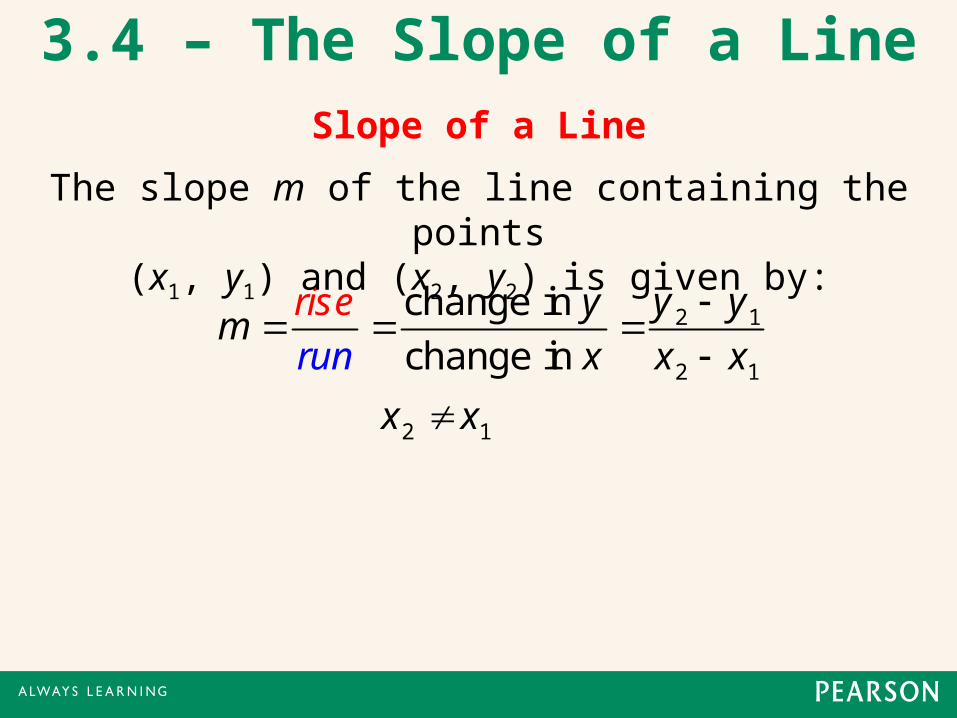
3.4 – The Slope of a LineSlope of a Line
2 1
2 1
2 1
change in
change in
y yym
xr
rise
x
un x x
x
The slope m of the line containing the points (x1, y1) and (x2, y2) is given by:
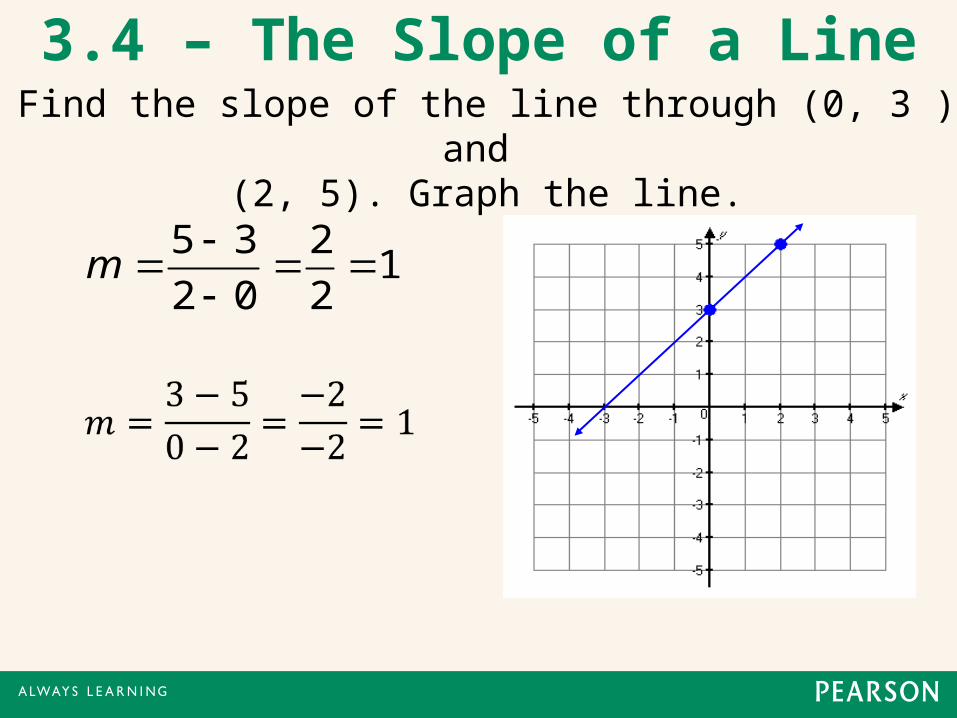
3.4 – The Slope of a LineFind the slope of the line through (0, 3 ) and
(2, 5). Graph the line.
5 3 21
2 0 2m
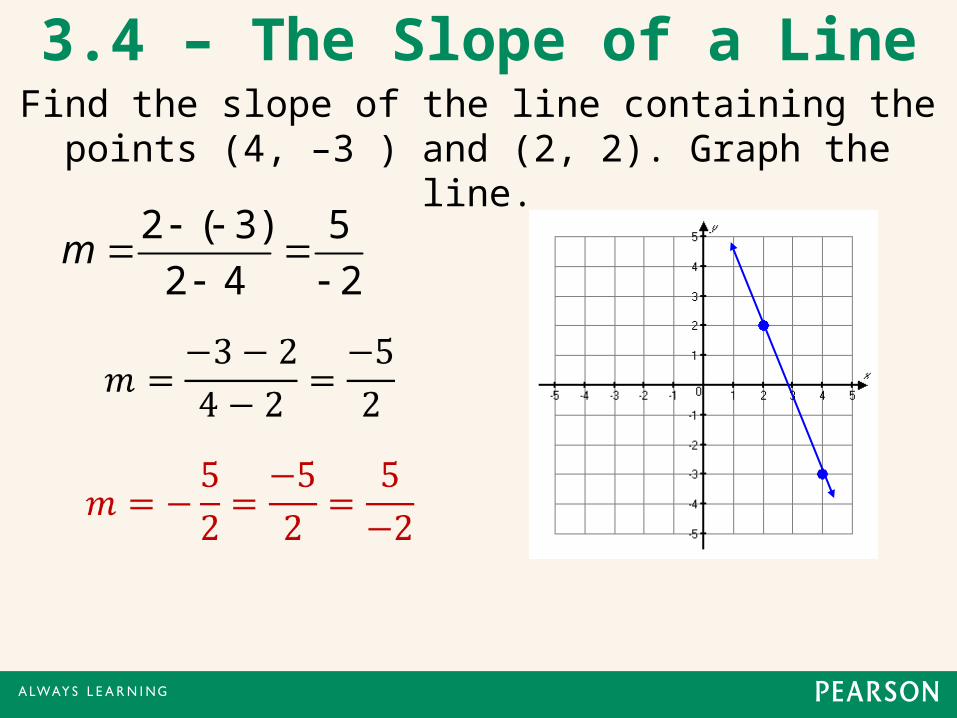
3.4 – The Slope of a LineFind the slope of the line containing the points (4, –3 )
and (2, 2). Graph the line.
2 ( 3) 5
2 4 2m
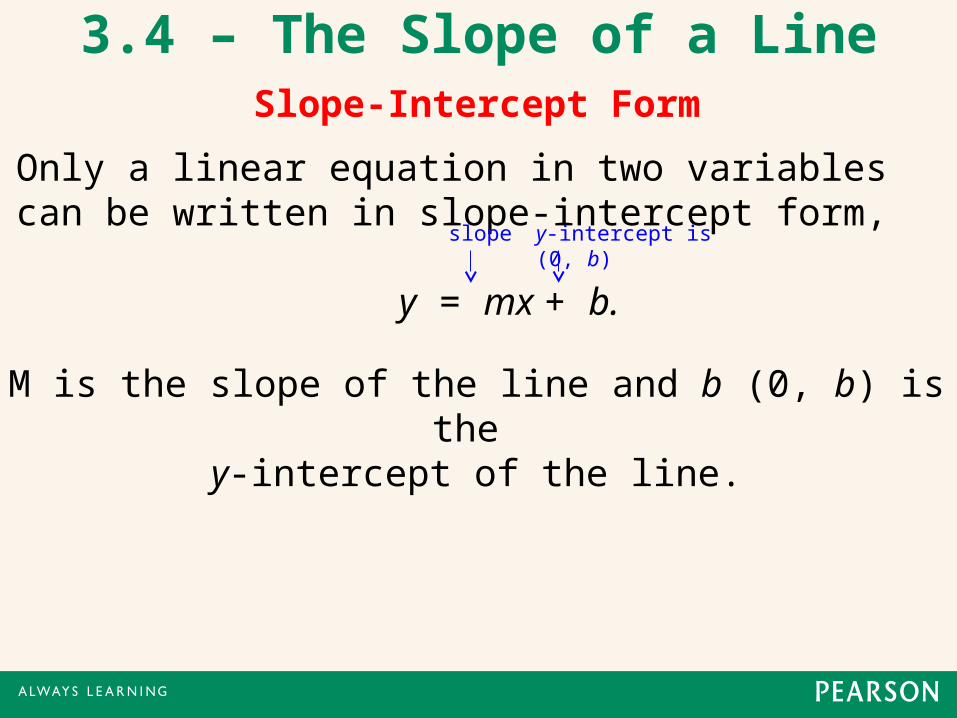
3.4 – The Slope of a Line
Only a linear equation in two variables can be written in slope-intercept form,
y = mx + b.
Slope-Intercept Form
M is the slope of the line and b (0, b) is the y-intercept of the line.
slope y-intercept is (0, b)
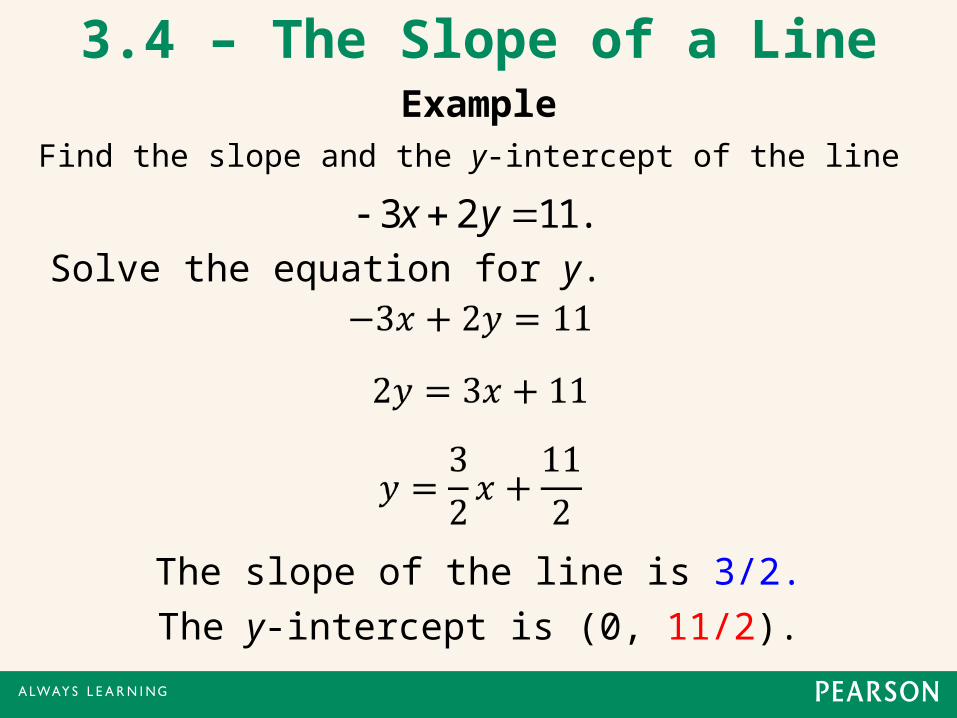
Find the slope and the y-intercept of the line
Example
Solve the equation for y.
3 2 11.x y
3.4 – The Slope of a Line
The slope of the line is 3/2.
The y-intercept is (0, 11/2).
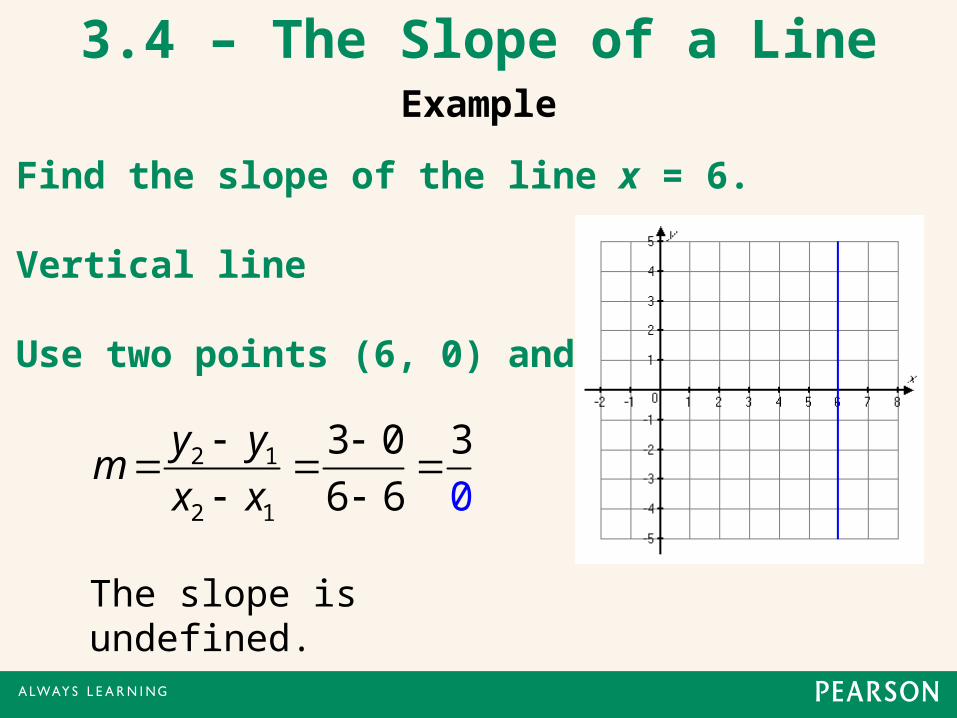
Find the slope of the line x = 6.
Vertical line
Use two points (6, 0) and (6, 3).
Example
2 1
2 1
3 0 3
6 06
y ym
x x
The slope is undefined.
3.4 – The Slope of a Line
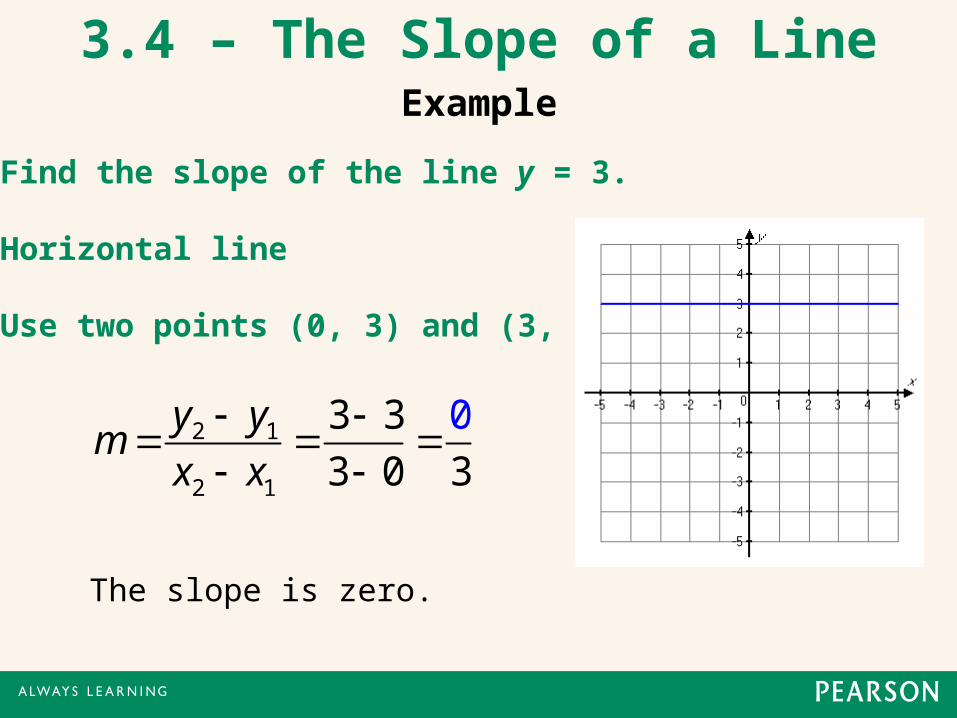
Find the slope of the line y = 3.
Horizontal line
Use two points (0, 3) and (3, 3).
Example
2 1
2 1
3 03
3 0 3
y ym
x x
The slope is zero.
3.4 – The Slope of a Line
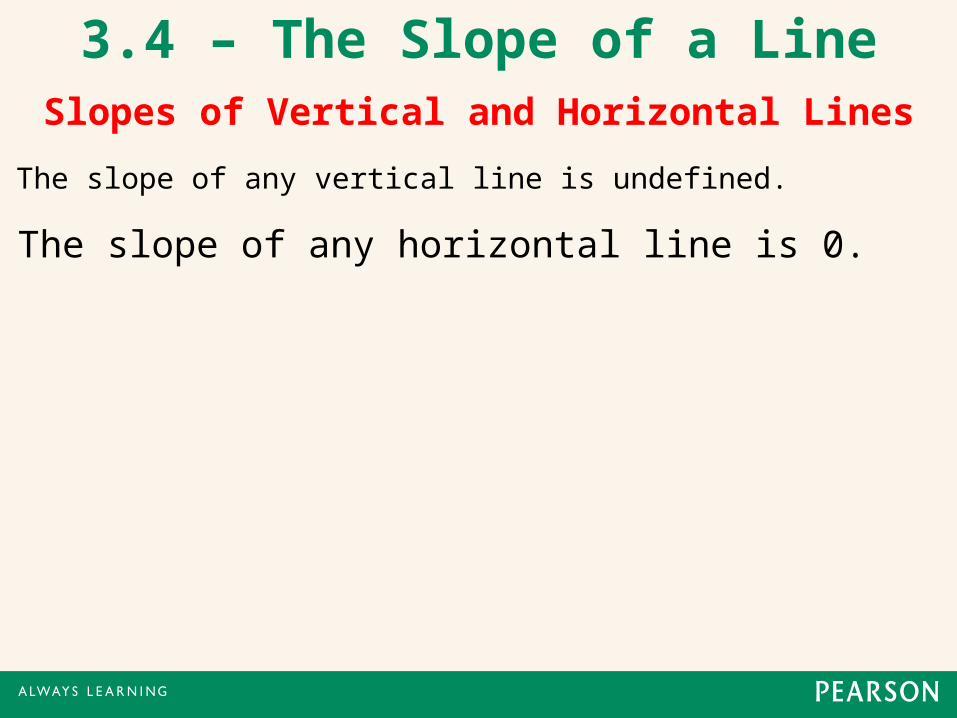
Slopes of Vertical and Horizontal Lines
The slope of any vertical line is undefined.
3.4 – The Slope of a Line
The slope of any horizontal line is 0.
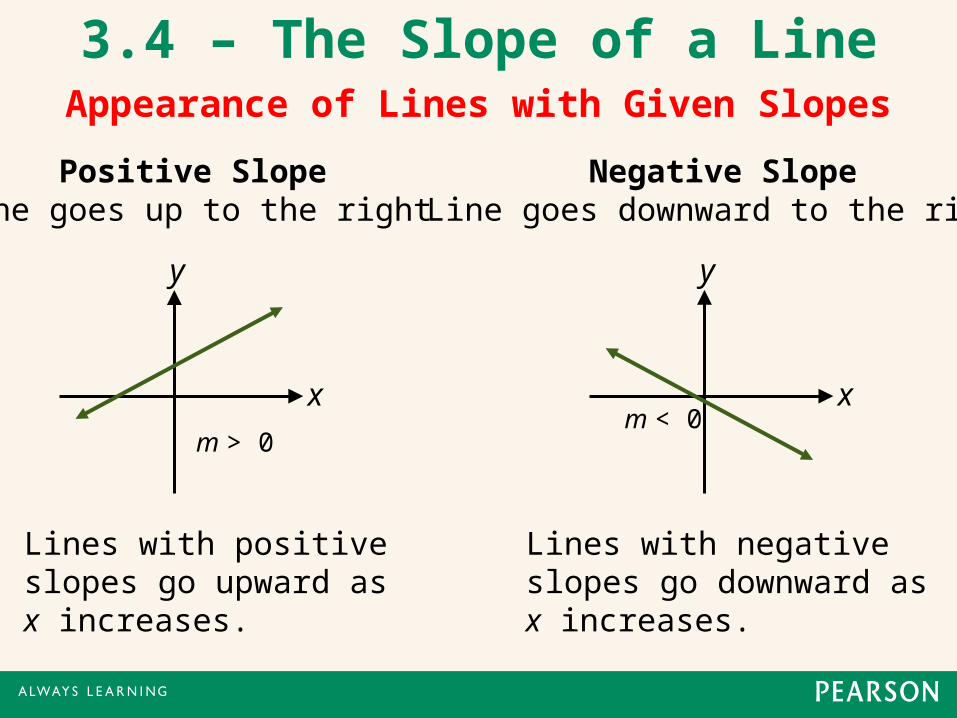
Appearance of Lines with Given Slopes
Positive SlopeLine goes up to the right
x
y
Lines with positive slopes go upward as x increases.
Negative SlopeLine goes downward to the right
x
y
Lines with negative slopes go downward as x increases.
m > 0m < 0
3.4 – The Slope of a Line
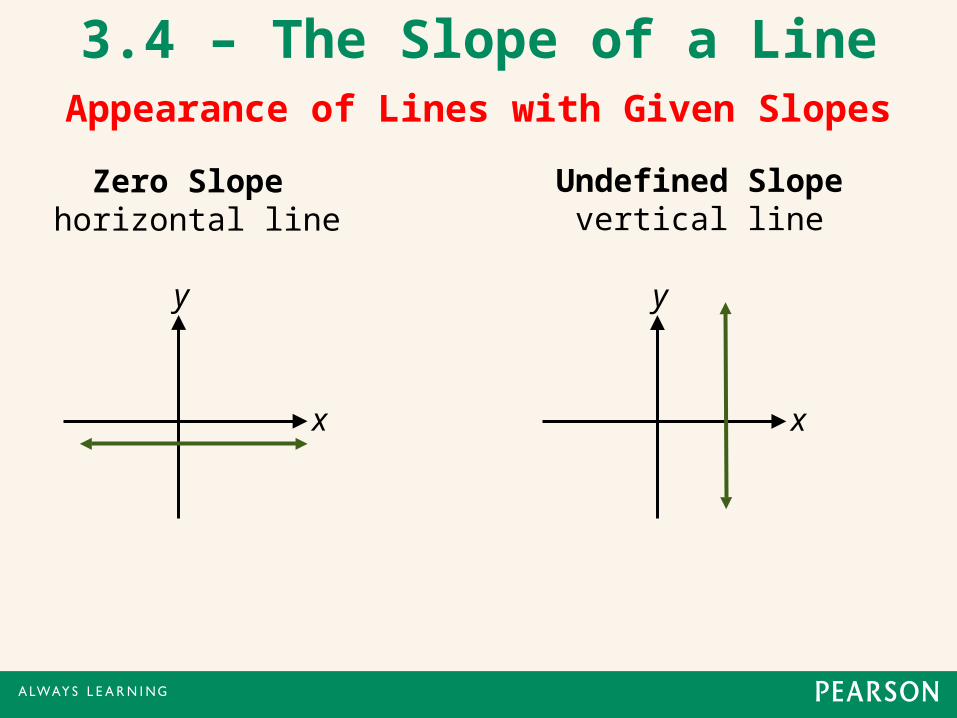
Appearance of Lines with Given Slopes
Zero Slope horizontal line
x
y
Undefined Slopevertical line
x
y
3.4 – The Slope of a Line
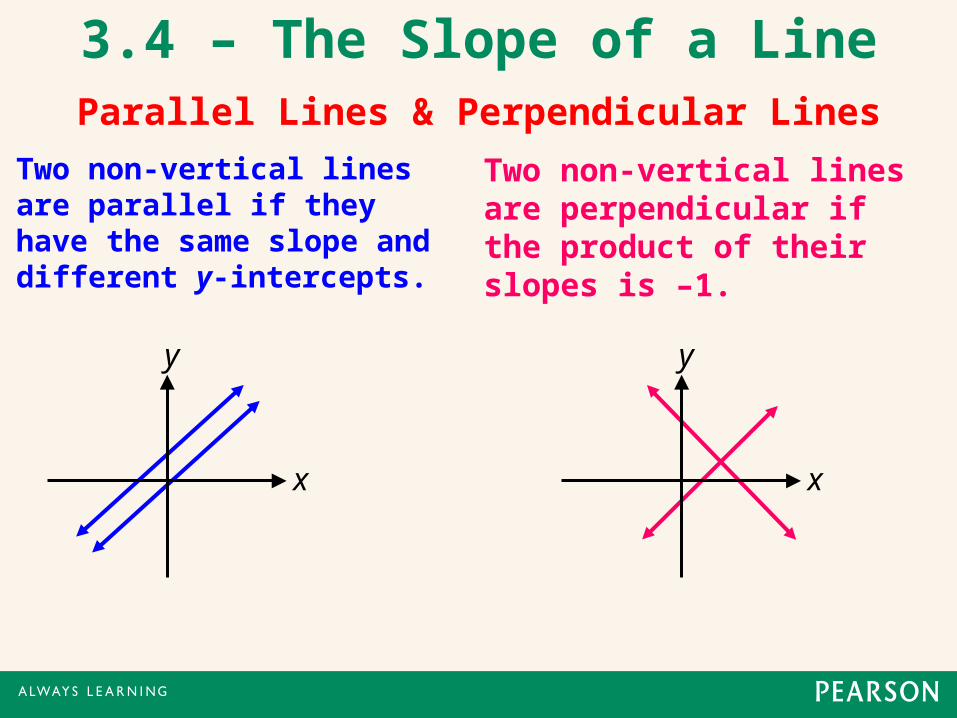
Parallel Lines & Perpendicular Lines
x
y
3.4 – The Slope of a Line
Two non-vertical lines are perpendicular if the product of their slopes is –1.
x
y
Two non-vertical lines are parallel if they have the same slope and different y-intercepts.
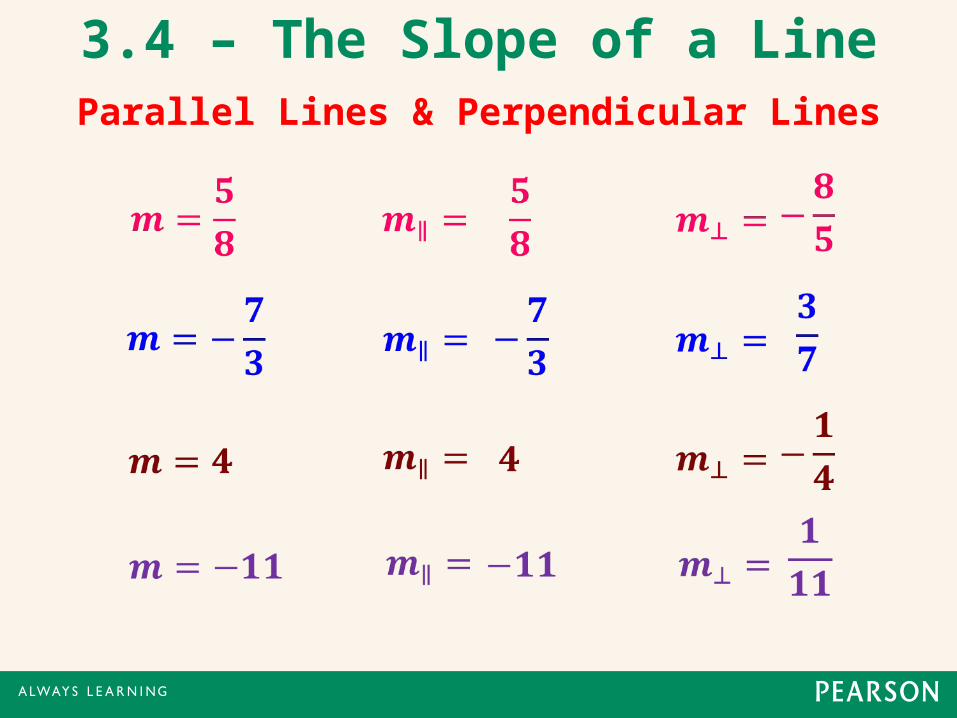
Parallel Lines & Perpendicular Lines
3.4 – The Slope of a Line
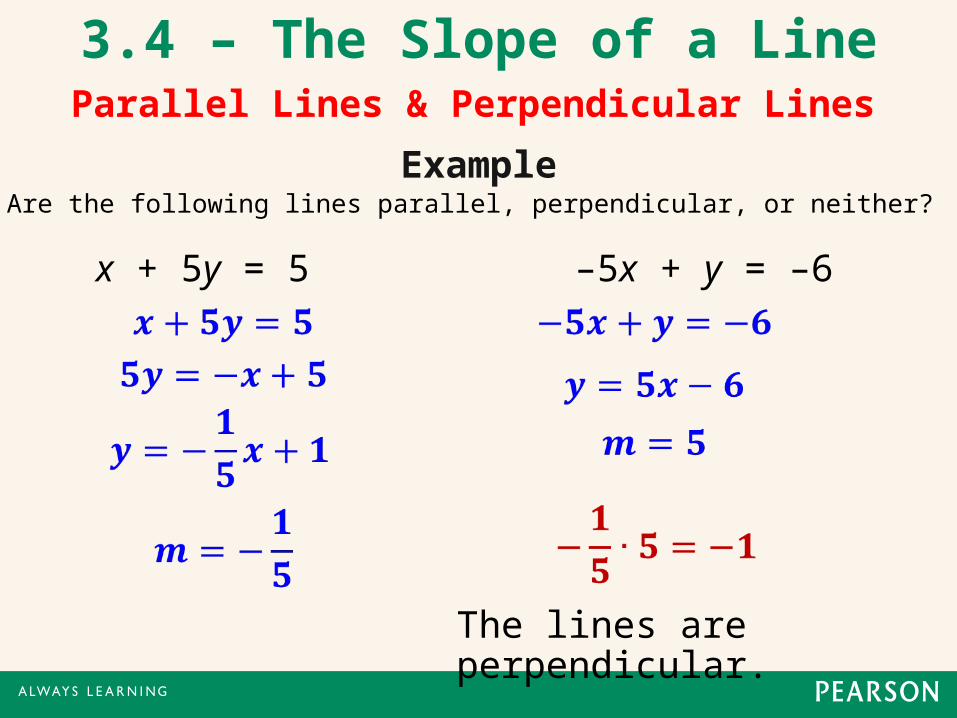
Are the following lines parallel, perpendicular, or neither?Example
The lines are perpendicular.
Parallel Lines & Perpendicular Lines
3.4 – The Slope of a Line
x + 5y = 5 –5x + y = –6
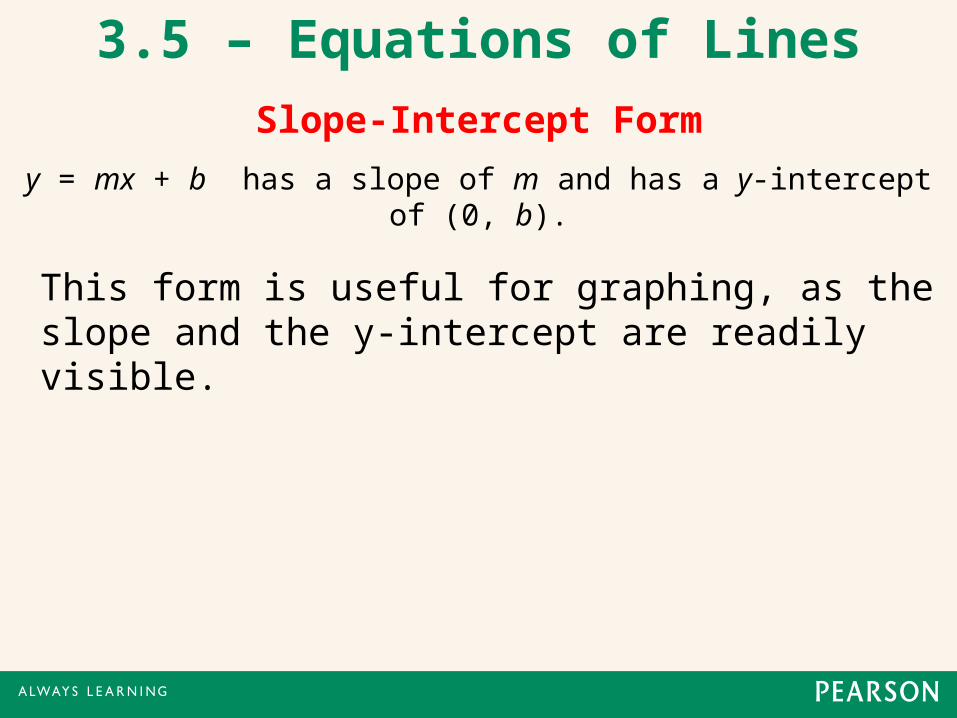
y = mx + b has a slope of m and has a y-interceptof (0, b).
Slope-Intercept Form
3.5 – Equations of Lines
This form is useful for graphing, as the slope and the y-intercept are readily visible.
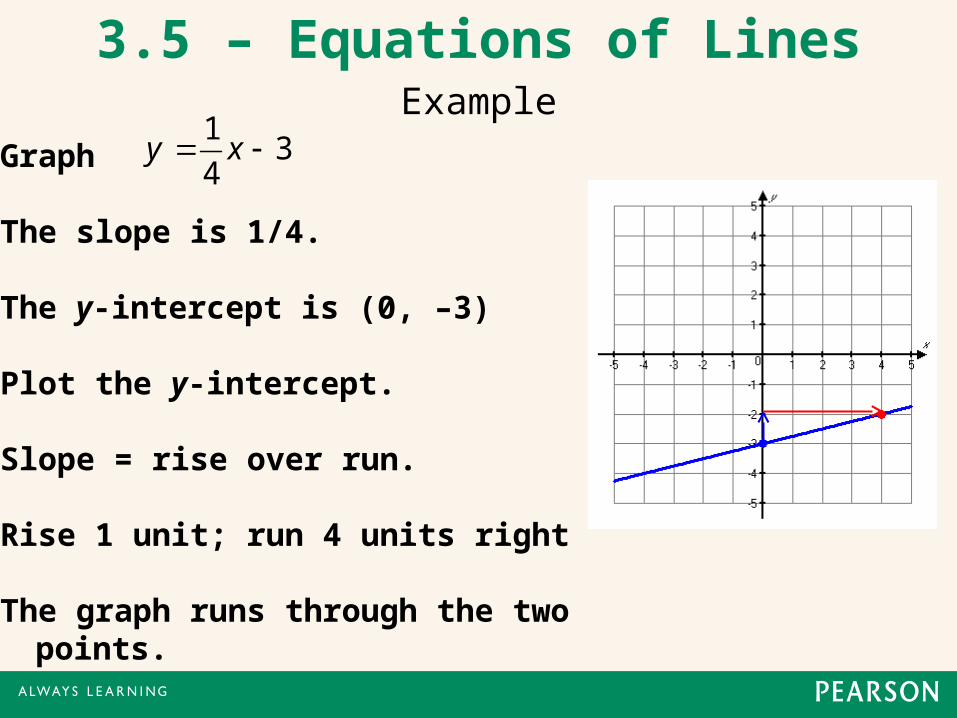
Example
Graph
The slope is 1/4.
The y-intercept is (0, –3)
Plot the y-intercept.
Slope = rise over run.
Rise 1 unit; run 4 units right
The graph runs through the two points.
13
4y x
3.5 – Equations of Lines
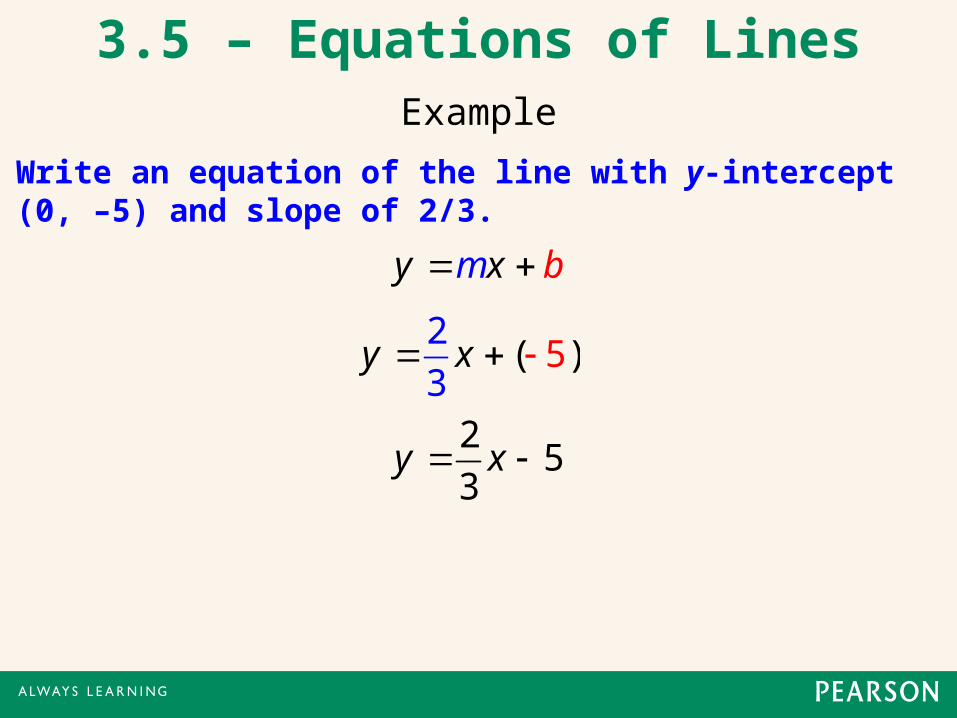
Example
Write an equation of the line with y-intercept (0, –5) and slope of 2/3.
y bmx
5)2
3(y x
25
3y x
3.5 – Equations of Lines
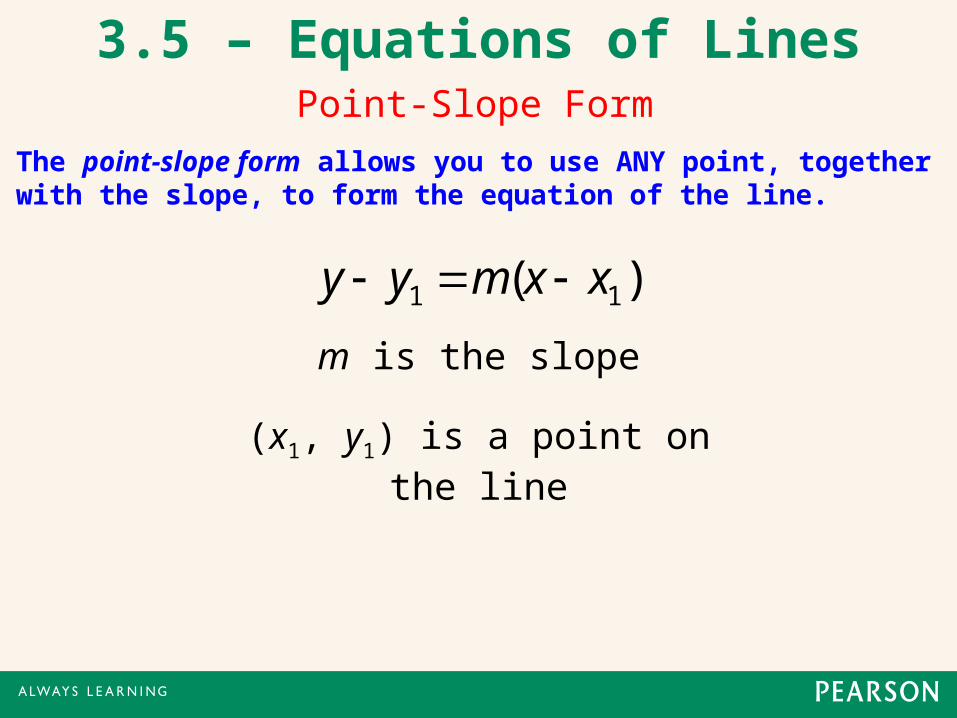
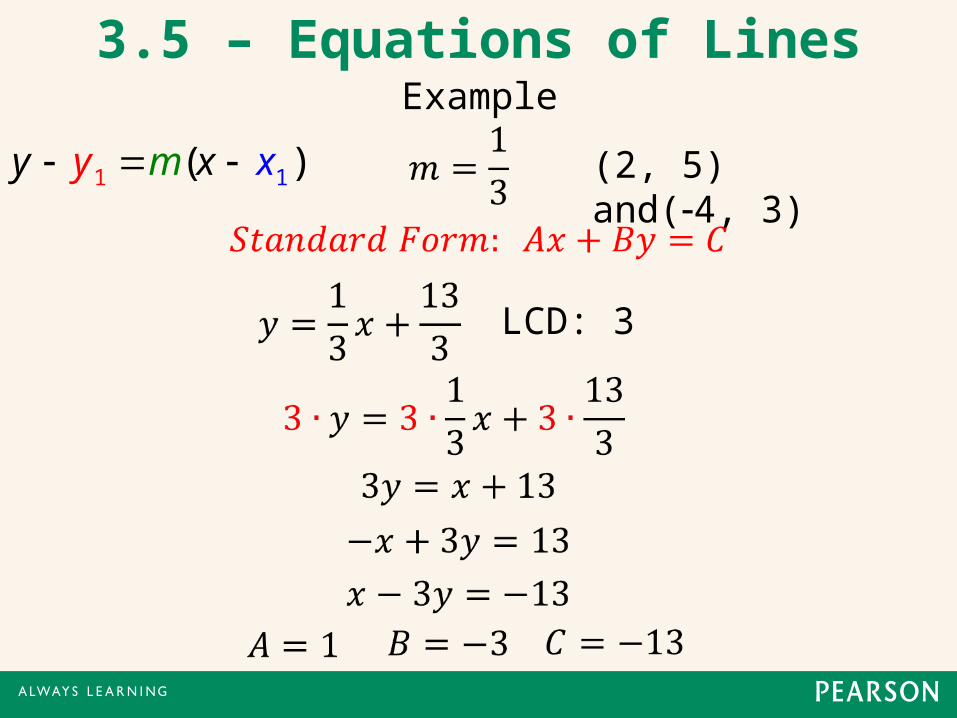
The point-slope form allows you to use ANY point, together with the slope, to form the equation of the line.
Point-Slope Form
)( 11 xxmyy
m is the slope
3.5 – Equations of Lines
(x1, y1) is a point on the line
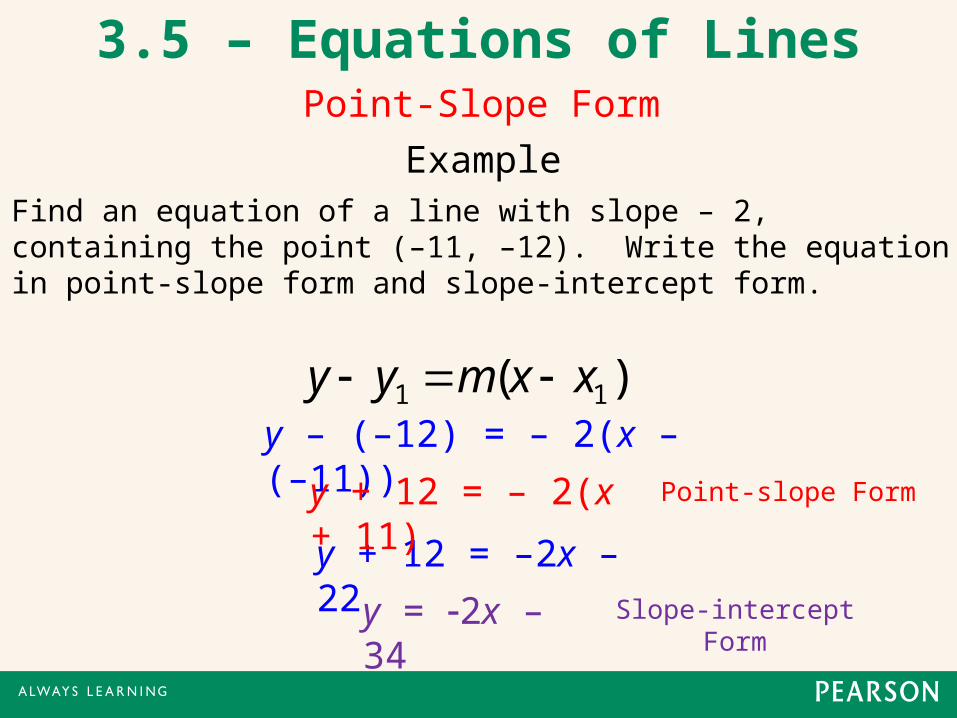
Find an equation of a line with slope – 2, containing the point (–11, –12). Write the equation in point-slope form and slope-intercept form.
Example
Point-Slope Form
3.5 – Equations of Lines
)( 11 xxmyy y – (–12) = – 2(x – (–11))
y + 12 = –2x – 22 y = 2x – 34
y + 12 = – 2(x + 11)
Slope-intercept Form
Point-slope Form
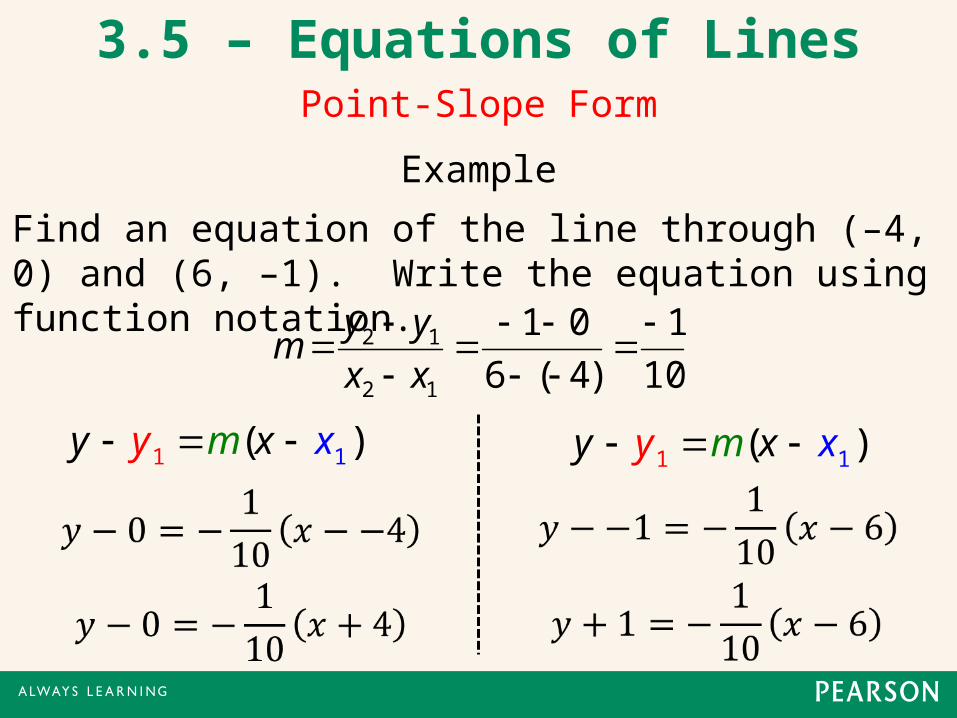
10
1
)4(6
01
12
12
xx
yym
Example
1 1( )y xmy x
Point-Slope Form
3.5 – Equations of Lines
Find an equation of the line through (–4, 0) and (6, –1). Write the equation using function notation.
1 1( )y xmy x
Example
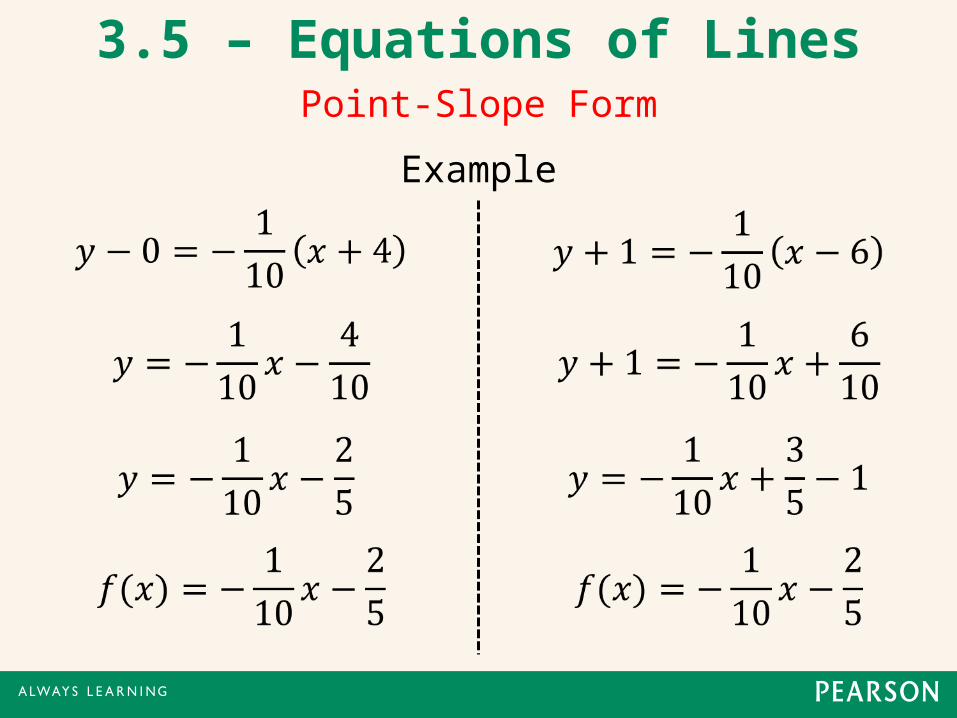
Point-Slope Form
3.5 – Equations of Lines
Example
Point-Slope Form
3.5 – Equations of Lines
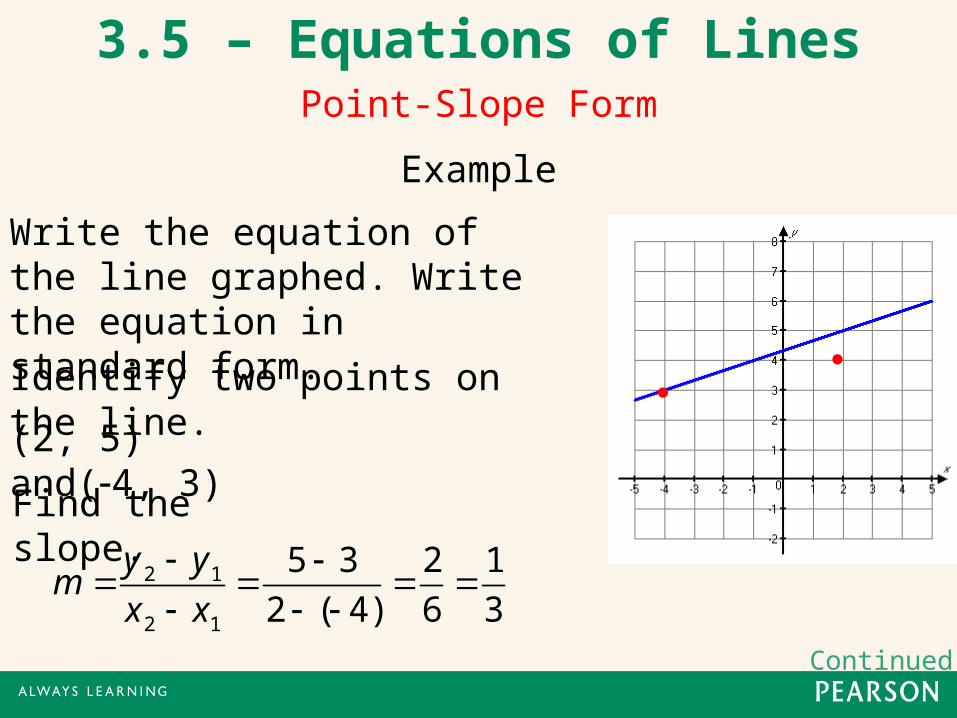
Write the equation of the line graphed. Write the equation in standard form.
2 1
2 1
5 3 2 1
2 ( 4) 6 3
y ym
x x
Continued.
●
●Identify two points on the line.
(2, 5) and(4, 3)
Find the slope.
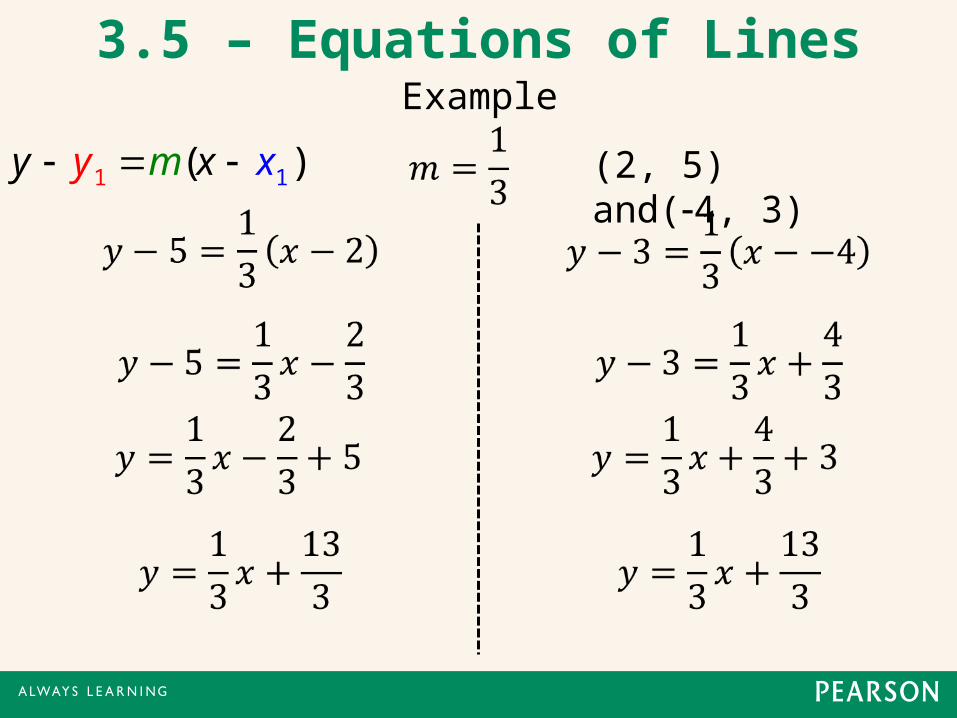
Example3.5 – Equations of Lines
1 1( )y xmy x (2, 5) and(4, 3)
Example3.5 – Equations of Lines
1 1( )y xmy x (2, 5) and(4, 3)
LCD: 3
Example3.5 – Equations of Lines
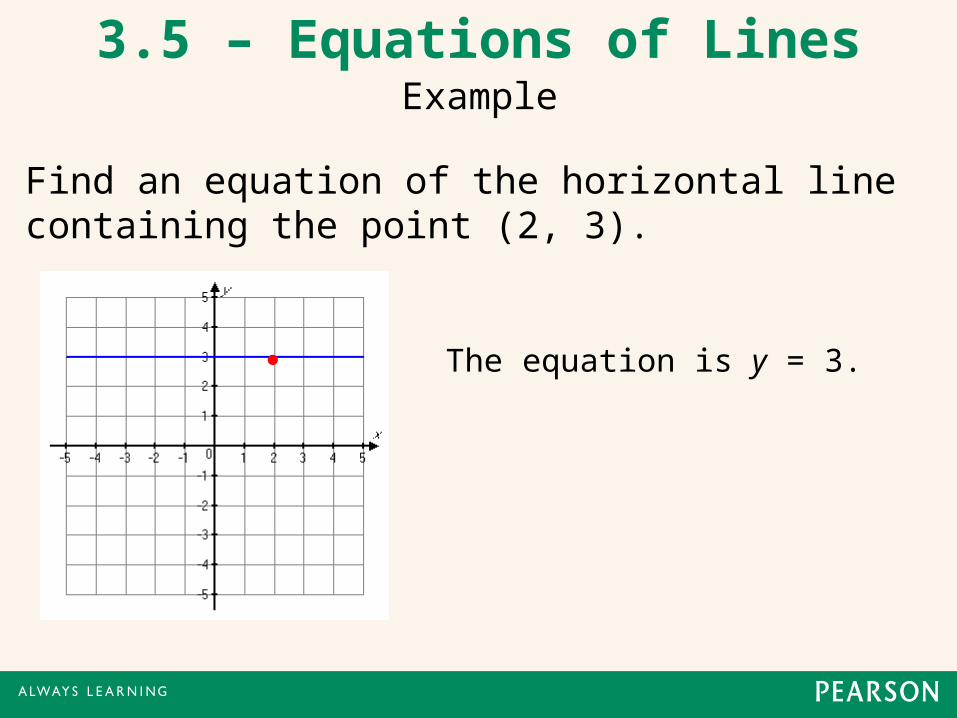
Find an equation of the horizontal line containing the point (2, 3).
● The equation is y = 3.
Example3.5 – Equations of Lines
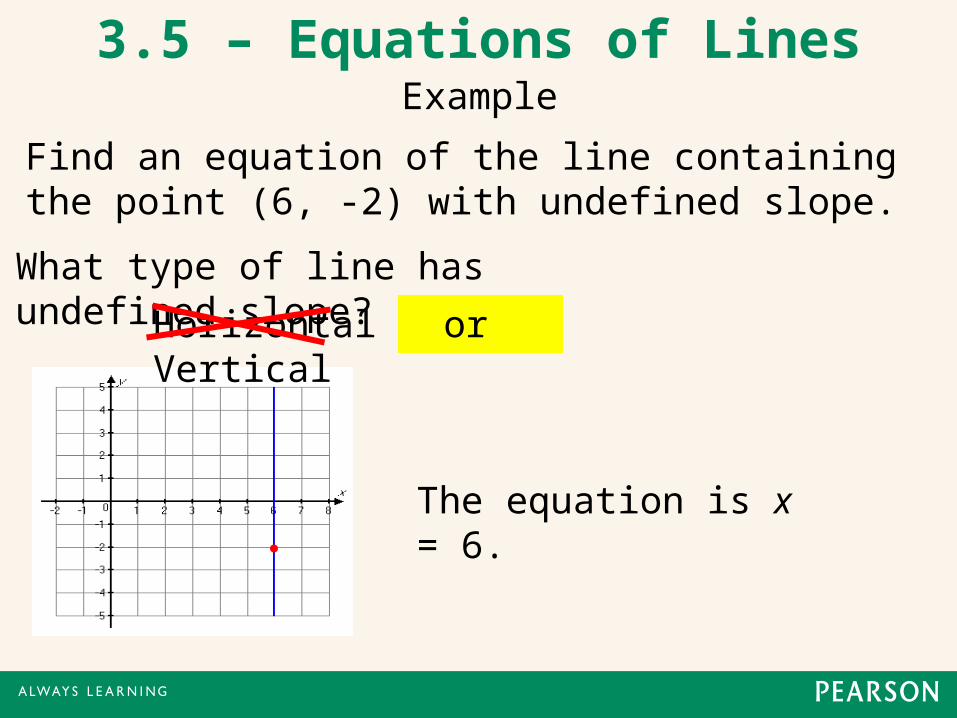
Find an equation of the line containing the point (6, -2) with undefined slope.
●
What type of line has undefined slope?
The equation is x = 6.
Horizontal or Vertical