Embed Size (px)
Citation preview
260
Using PSpice to Simulate the Discharge Behavior of Common Batteries
By Steven C. Hageman APPLIED DC
Note: An article based on this manuscript appeared in EDN Magazine, October 28, 1993
As the use of battery-operated electronic devices become more widespread, so too does the need for simulation models used to analyze the operating characteristics of batteries. The most common batteries in use today are: non-rechargeable Alkaline cells, rechargeable Nickel-Cadmium (NICD) cells, Nickel-Metal-Hydride (NIMH) cells, and sealed Lead-Acid cells.* This article presents PSpice behavioral models for simulating the four battery types mentioned above.
Battery VariablesAll of the battery types modeled here share some common characteristics and deviations from ideal during discharge.
The capacity of any group of cells may vary from +/- 20% up to +/- 50% when shelf time, number of recharge cycles, and manufacturing variances are taken into account. For this reason, parameters that change less than 15% are not considered in these models.
The capacity of a cell decays with time after a complete charge. For Alkaline cells, this decay takes years to affect the usable capacity. For NICD and Lead-Acid batteries, the decay is 10 to 30% per month. This effect may be simulated by specifying a reduced state of charge at the start.
*. The term cell is used to indicate a single energy source. The term battery is used to distinguish a power source composed of a single cell or several cells.
Using PSpice to Simulate the Discharge Behavior of Common Batteries 261
The major deviation from ideal is that the usable capacity of a cell varies depending on the discharge rate. At very low discharge rates (<) 100 hours), all batteries are very efficient. At very fast discharge rates (< 10 hours), the batteries are not as efficient and usable capacity is lost.
For pulsed loads with cycle times greater than 10 seconds, the cell gives more total capacity than under a constant load. The rest portion of the pulsed load allows the battery chemistry to recover some of the lost capacity. But, as the pulsed load cycle time becomes less than 1 second, the cell does not have enough time to recover and usable capacity is not increased. In these cases, the RMS value of the pulsed discharge current should be used in the simulation.
Cell temperature affects both the cell resistance and usable capacity. Low cell temperatures reduce the usable capacity; only a slight decrease is noted at high temperatures. For the battery types modeled here, the change in resistance versus temperature falls below the 15% change threshold, so these effects are not modeled. These changes may be accounted for by adjusting the parameters passed to the various cell subcircuits.
Cell resistance is a function of the cell’s state of charge and, although there is a negligible effect on Lead-Acid and NICD types, Alkaline cells show a 2:1 to 4:1 increase in cell resistance from full charge to full discharge. Still, cell resistance is fairly flat and constant until 80% discharged, then the resistance increases sharply. The sharp fall in cell voltage during discharge can be looked upon as a large increase in cell resistance.
Open circuit cell voltage varies with discharge temperature. But, this variation, even over a 0 to 60 C range, is much less than the difference in actual cell discharge voltage. Therefore, it is not useful to simulate. NICD batteries are the exception; these are used in high-rate discharge applications where the cells may increase in temperature by 25 C during discharge. Cell discharge voltage versus temperature is modeled in the NICD subcircuit.
262
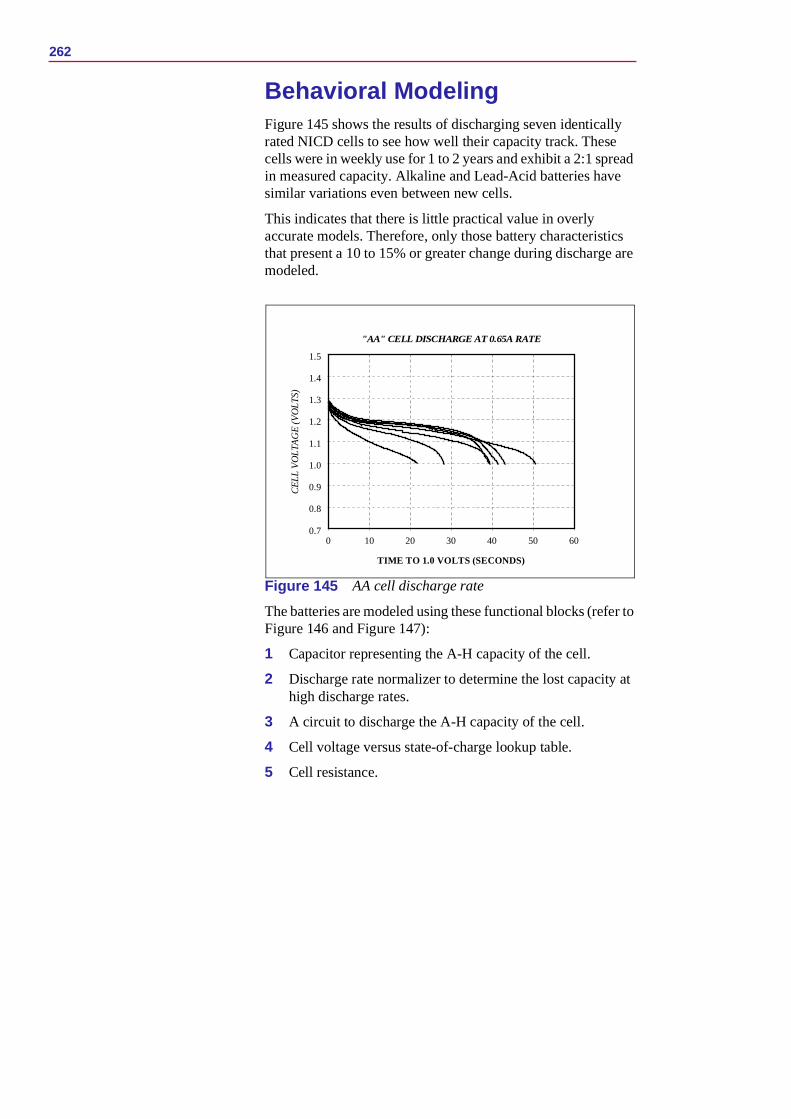
Behavioral ModelingFigure 145 shows the results of discharging seven identically rated NICD cells to see how well their capacity track. These cells were in weekly use for 1 to 2 years and exhibit a 2:1 spread in measured capacity. Alkaline and Lead-Acid batteries have similar variations even between new cells.
This indicates that there is little practical value in overly accurate models. Therefore, only those battery characteristics that present a 10 to 15% or greater change during discharge are modeled.
Figure 145 AA cell discharge rate
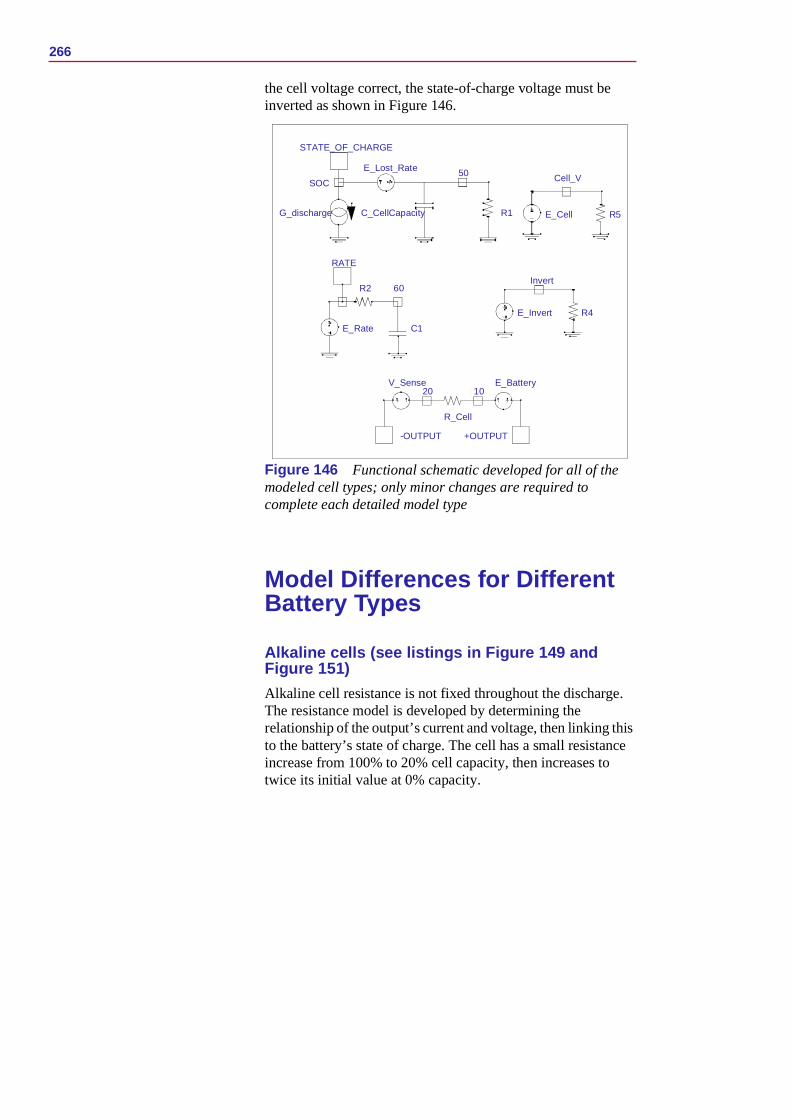
The batteries are modeled using these functional blocks (refer to Figure 146 and Figure 147):
1 Capacitor representing the A-H capacity of the cell.
2 Discharge rate normalizer to determine the lost capacity at high discharge rates.
3 A circuit to discharge the A-H capacity of the cell.
4 Cell voltage versus state-of-charge lookup table.
5 Cell resistance.
0 10 20 30 40 50 60
TIME TO 1.0 VOLTS (SECONDS)
0.7
0.8
0.9
1.0
1.1
1.2
1.3
1.4
1.5
CELL
VO
LTAG
E (V
OLT
S)
"AA" CELL DISCHARGE AT 0.65A RATE
Using PSpice to Simulate the Discharge Behavior of Common Batteries 263
6 For NICD batteries, the thermal effects of the cell under high discharge rates.
To start modeling a cell, several actual discharge curves should be measured on a computerized constant-current load analyzer [1] at a low rate (20 to 200 hours) to get an actual voltage versus capacity curve. A single curve is then made by averaging several curves, or picking a typical curve from the data. This data is then converted into a parameterized PSpice lookup table Voltage-Controlled Voltage Source (VCVS). This models the cell’s output voltage versus the state-of-charge at low discharge rates. A simplified VCVS definition is
E_Cell+OUT -OUTTABLE {V(x)} = (0,1.5) (0.5,1.3) (1.0,0.0)
where:
(0,1.5) (0.5,1.3) (1.0,0.0) are the table pairs that are output to +OUT and -OUT based on the value of V(x). If V(x) is 0, signifying 0% discharge, then E_Cell will have a value of 1.5 Volts (table pair 1). If the cell is 50% discharged then the second table pair will be used and so on. For in-between discharge values, PSpice uses linear interpolation between the table pairs.
Note The actual lookup tables are composed of 30 or more pairs of data to provide finer granularity of the resulting discharge voltage curve.
To model the discharge current sense and the cell resistance, a zero-valued voltage source is added in series with the output voltage. The cell resistance is modeled as a simple resistor for NICD or Lead-Acid cells and as a more complex variable resistance that depends on the cell’s state of charge for Alkaline cells.
To model the state-of-charge, a simple, appropriately sized capacitor is used as the charge storage element that simulates the available charge of the cell. This capacitor is sized so that it has a value of 1 Volt at 100% cell capacity and 0.5 Volts at 50% cell
E_Cell signifies the PSpice call to a VCVS named E_Cell
+OUT and -OUT are the output nodes of the VCVS
TABLE is the PSpice behavioral modeling TABLE directive
{V(x)} is the controlling voltage for the table
264
capacity. This capacitor is given the following value at the start of the simulation by PSpice’s “Parameterization” function:
C_CellCapacity 50 0 {3600*CAPACITY*FudgeFactor}
The capacitor, C_CellCapacity, is connected between nodes 50 and 0 and is given a value of the Amp-hour capacity of the cell times a conversion from hours to seconds (3,600 seconds = 1 hour) times a fudge factor (FudgeFactor). If a cell has a 10 Amp-hour capacity, C_CellCapacity equals 10 * 3,600 or 36,000 Farads; this is a big capacitor, but a workable value that is easy to understand.
FudgeFactor adjusts for the difference in the manufacturer’s listed Amp-hour capacity (i.e., some cutoff voltage with some capacity remaining at the cutoff) and the simulated capacity of 0 Volts output at 0% remaining capacity. To correct for this, and still allow the model user to use the manufacturer’s listed capacity, a FudgeFactor value of 1.01 to 1.1 is included.
The actual usable capacity of a cell depends on the rate at which it is being discharged. Most manufacturers list the capacity at the most favorable rate—usually at greater than 20 hours discharge. At any faster rate, the cell is less efficient and results in a nonlinear function of the discharge rate. This must be characterized as a lookup table at many discharge rates. This inefficiency is modeled as a VCVS in series with the output voltage of the battery state-of-charge node (the voltage on C_CellCapacity). This VCVS subtracts a given amount of capacity from the cell during discharge. The amount subtracted depends on the rate at which the cell is being discharged.
To determine the rate at which the cell is being discharged, it is convenient to normalize the discharge rate in Amps to a more conventional cell rate called the C rate. The C rate is defined as the capacity of the cell in Amp-hours when it is discharged completely in one hour. This normalization makes it easy to determine the cell inefficiency at different rates, and between different cell sizes, because it converts discharge in Amps to discharge in “C” units of the battery capacity at one hour. This conversion is done in the model by the VCVS, E_Rate, as follows.
E_Rate RATE 0 VALUE = {I(V_Sense) / CAPACITY}
Using PSpice to Simulate the Discharge Behavior of Common Batteries 265
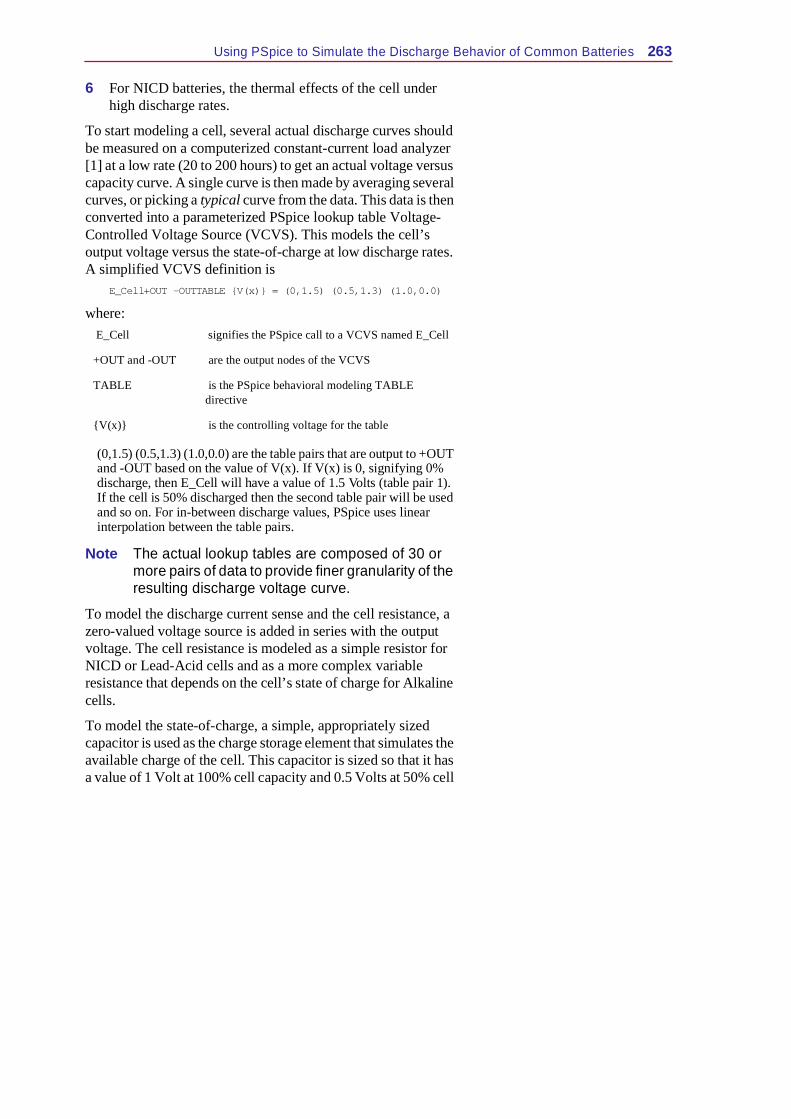
E_Rate is the sensed discharge current in Amps divided by the Amp-hour capacity of the cell. The node, RATE, is the instantaneous rate at which the cell is being discharged (see Figure 146).
This instantaneous rate information can almost be fed directly to E_Lost_Rate to determine the actual available capacity. But, when the discharge is a low duty cycle, high value pulsed load, the cell supplies a large initial current which decays in seconds to a lower value. For pulsed loads, the cell recovers between pulses and delivers a higher proportion of its capacity than a cell under constant discharge. The delayed rate is modeled by an RC lowpass filter (R1 and C1 of Figure 146). The exact value of the RC time constant depends on the type and size of cell being simulated. E_Lost_Rate is built like the E_Cell table as follows.
E_Lost_Rate 50 SOC TABLE { V(x) } = (0.0,0.0) (1.5,0.5)
The table entries indicate the capacity unavailable from the cell at high discharge rates. The table entry shows that at a discharge rate of 0, the cell loses 0% of its capacity (first entry). If the discharge rate is 1.5 times the rated capacity of the cell (1.5 C), the cell loses 50% of its capacity (second entry in the table).
In Figure 146, the State-Of-Charge (SOC) node is the subtraction of the voltage on the capacitor C_CellCapacity and E_Lost_Rate. The SOC node represents the capacity in the cell for a given discharge rate during the simulation. G_Discharge discharges C_CellCapacity at the cell rate. The voltage on node 50 relates to the capacity remaining in the cell if the discharge rate is low enough to actually run the cell dry. At low discharge rates, these two nodes are the same; at high discharge rates, node SOC is at a lower potential than node 50. If, at the end of a high discharge rate the cell reverts to a low discharge, nearly the entire rated capacity can be recovered from the cell. At the high discharge rate, approximately 60% of the cell’s rated capacity can be used.
All that needs to be done now is to link the state of charge with the cell voltage to get an output. The state of charge is 1 Volt for 100%, while the cell voltage table is just the opposite. To make
266
the cell voltage correct, the state-of-charge voltage must be inverted as shown in Figure 146.
Figure 146 Functional schematic developed for all of the modeled cell types; only minor changes are required to complete each detailed model type
Model Differences for Different Battery Types
Alkaline cells (see listings in Figure 149 and Figure 151)Alkaline cell resistance is not fixed throughout the discharge. The resistance model is developed by determining the relationship of the output’s current and voltage, then linking this to the battery’s state of charge. The cell has a small resistance increase from 100% to 20% cell capacity, then increases to twice its initial value at 0% capacity.
R1
50
C_CellCapacity
E_Lost_RateSOC
STATE_OF_CHARGE
G_discharge R5
Cell_V
E_Cell
R4
Invert
E_Invert
C1E_Rate
R2 60
RATE
+OUTPUT-OUTPUT
V_Sense20 10
R_Cell
E_Battery
Using PSpice to Simulate the Discharge Behavior of Common Batteries 267
When the discharge current approaches 100 mA, the discharge capacity versus discharge rate produces a kink in the discharge curve. Below 100 mA, the cell loses capacity gradually; above 100 mA, the rate of lost capacity increases significantly. Despite the 100 mA discharge rate being the same for all of the cell sizes, the C rating is not. Because it isn’t possible to relate this kink to a specific C discharge rate, a separate E_Lost_Rate table must be developed for each cell size.
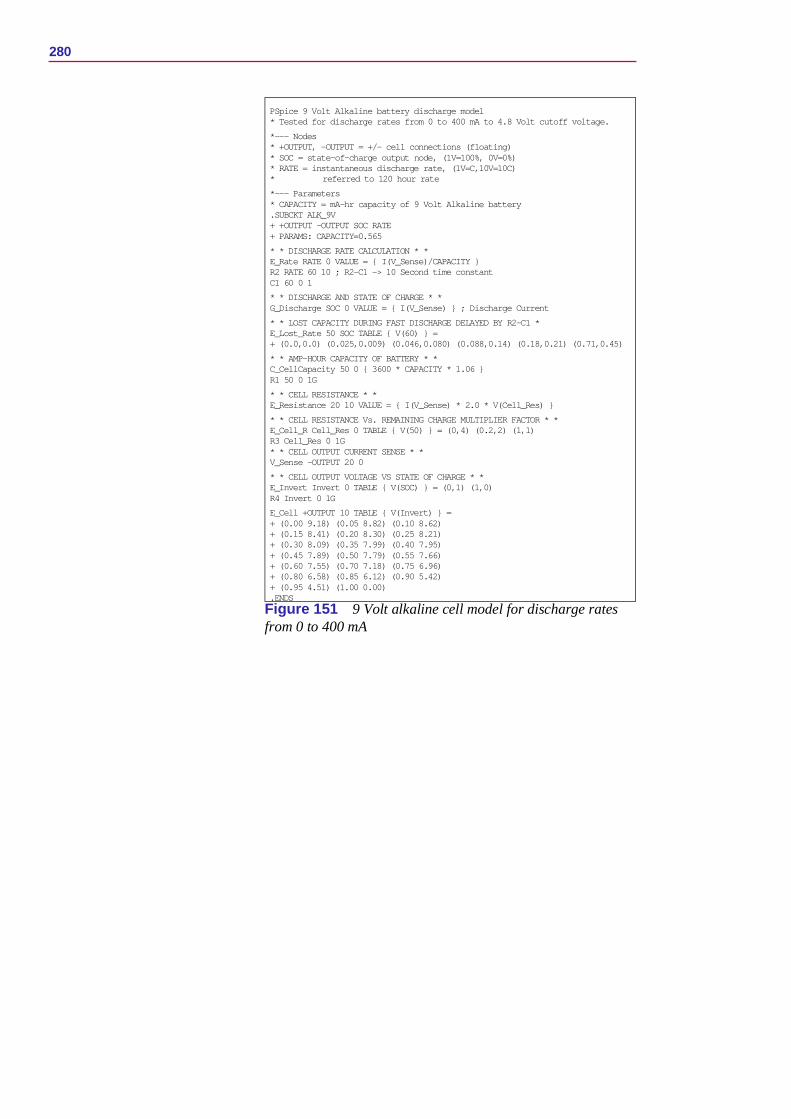
A separate subcircuit model is used to model the 9 Volt Alkaline cell. The cell resistance change versus discharge state is more pronounced in this type of battery, and is modified accordingly in the model shown in Figure 151.
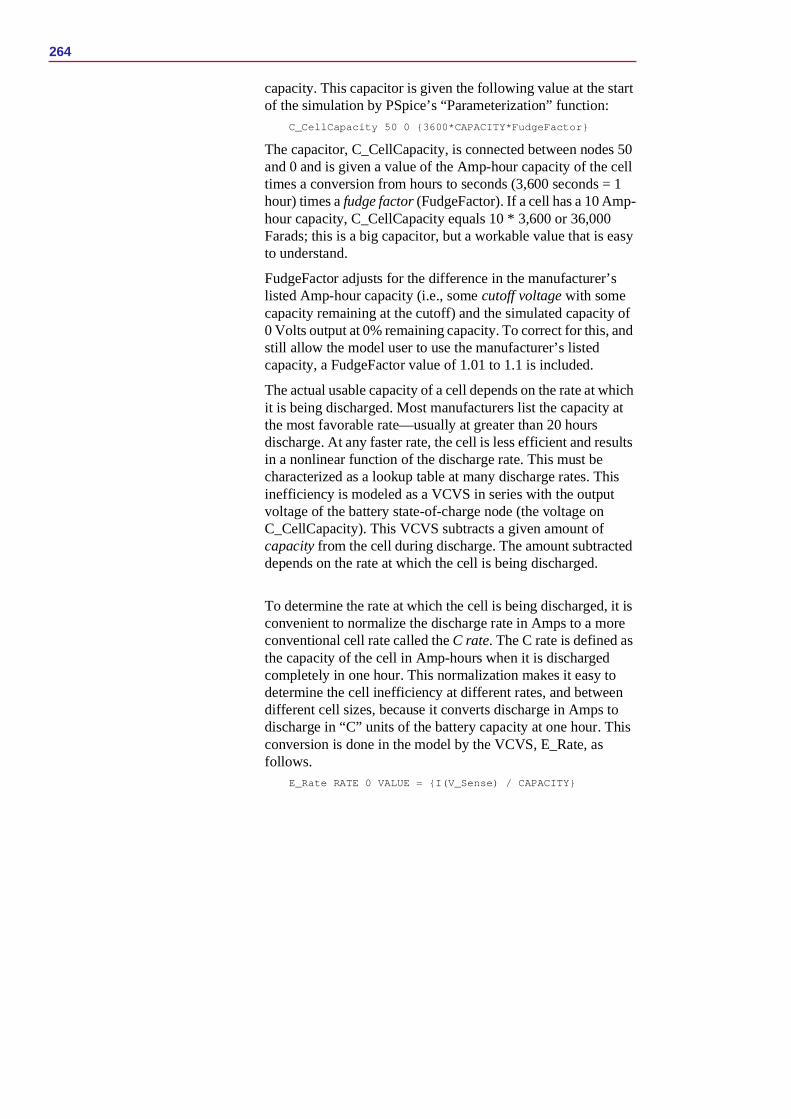
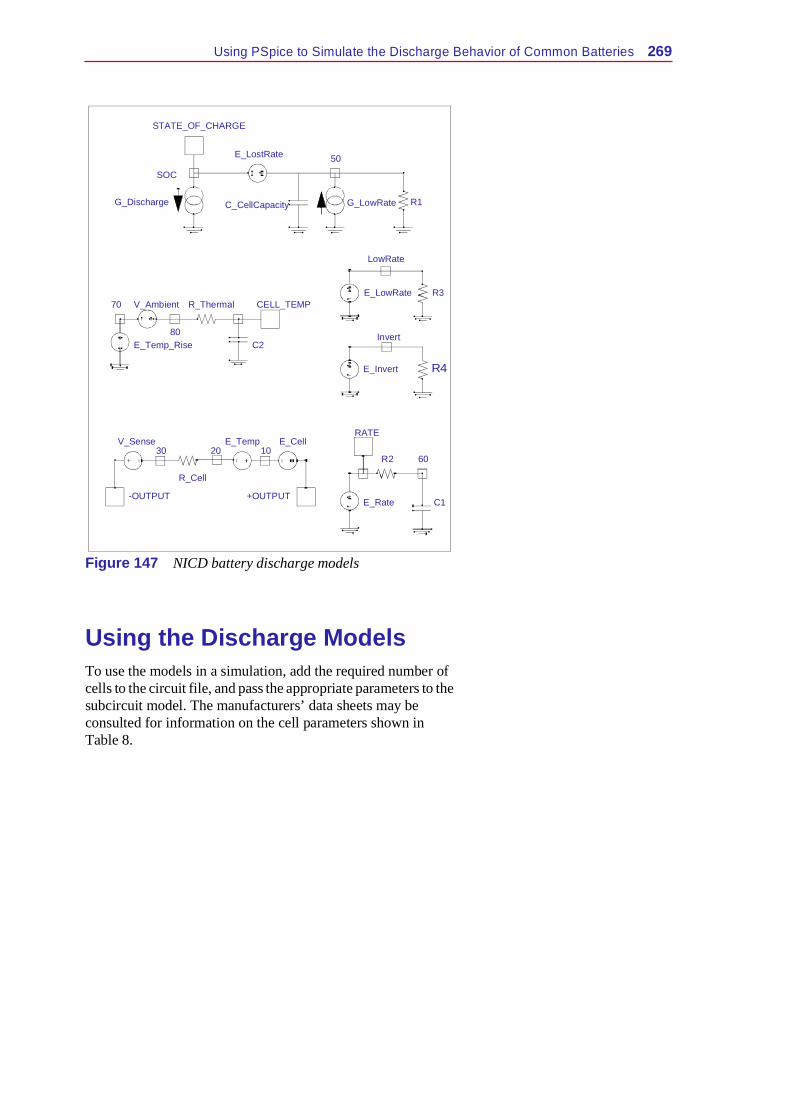
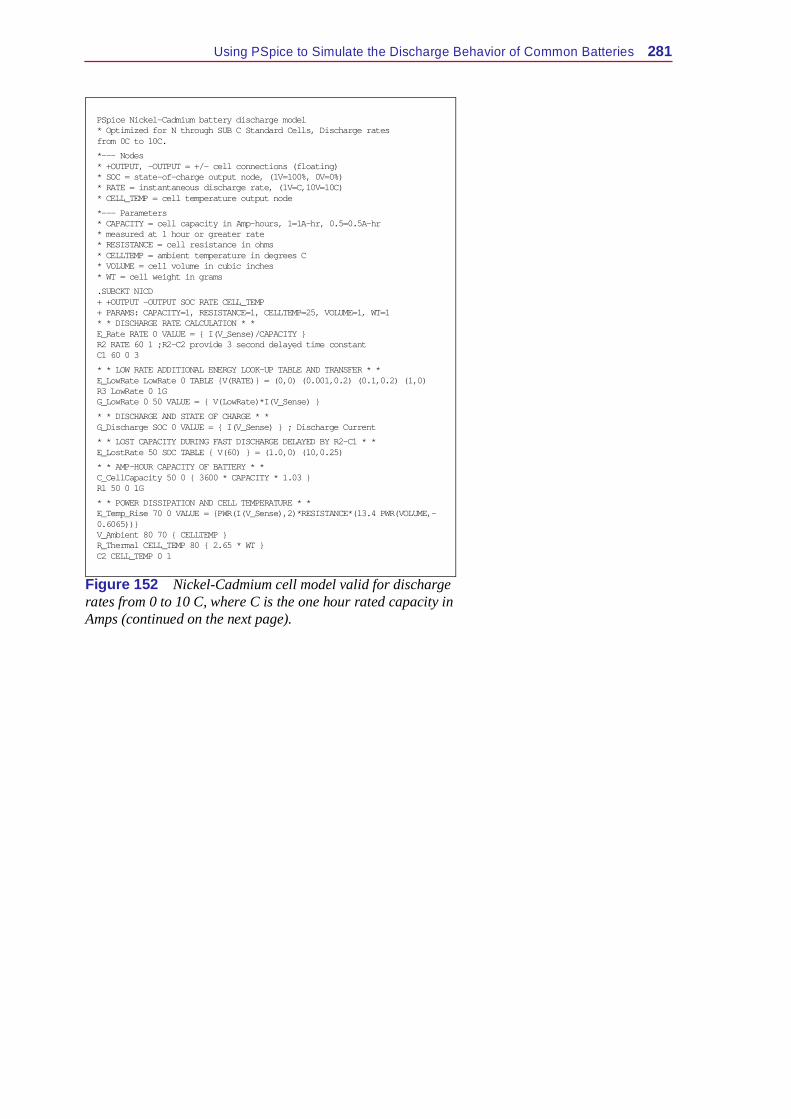
Nickel-cadmium cells (see Figure 147 and listing in Figure 152)These cells are often used at very high discharge rates up to 20 C. Discharging a fully charged cell in 5 or 6 minutes (10 C rate) releases significant amounts of heat. To account for this, a thermal model is included in the cell subcircuit.
The thermal model depends on two fundamental relationships:
The thermal temperature rise of a cell per watt dissipated in free air is approximately
cell = 13.41 * V-0.61 where V is the cell volume in cubic inches, and cell is the thermal rise of the cell in C per watt dissipated.
The thermal time constant for material of the density used in making NICD batteries is approximately 20 minutes per pound, or, expressed in more convenient terms, 2.65 seconds per gram.
These empirical relationships are used with the calculated cell power dissipation (Cell Discharge Current2 * Cell Resistance) to get a temperature rise and time constant model for the cell temperature. The cell temperature rise above ambient temperature is available at node CELL_TEMP in the NICD model. The temperature information is also used to add or subtract from the cell discharge voltage to account for the cell temperature E_Temp in the NICD model.
268
Another small modification was made to the NICD model to facilitate the direct entry of manufacturers’ rated capacity data. Most NICD batteries are not rated at their maximum capacity for low discharge rates. The norm is to rate them at the C to C/5 rate, leaving 30% more than the rated capacity if the cell is used at low discharge rates. To account for this difference a Voltage-Controlled Current Source (VCCS), G_LowRate, is used to add a small amount of current to C_CellCapacity during discharge at rates less than 1 C.
Nickel-Metal-Hydride cells (see listing in Figure 156)These cells are modeled like the NICD cells, but without the fast discharge thermal effects.
Lead-acid cells (see listing in Figure 154)Since these cells are almost universally used in batteries composed of 3, 6, or more cells (6 or 12 Volt batteries), the model is changed slightly. The single cell voltage is multiplied by the number of cells to get the total battery voltage.
Using PSpice to Simulate the Discharge Behavior of Common Batteries 269
Figure 147 NICD battery discharge models
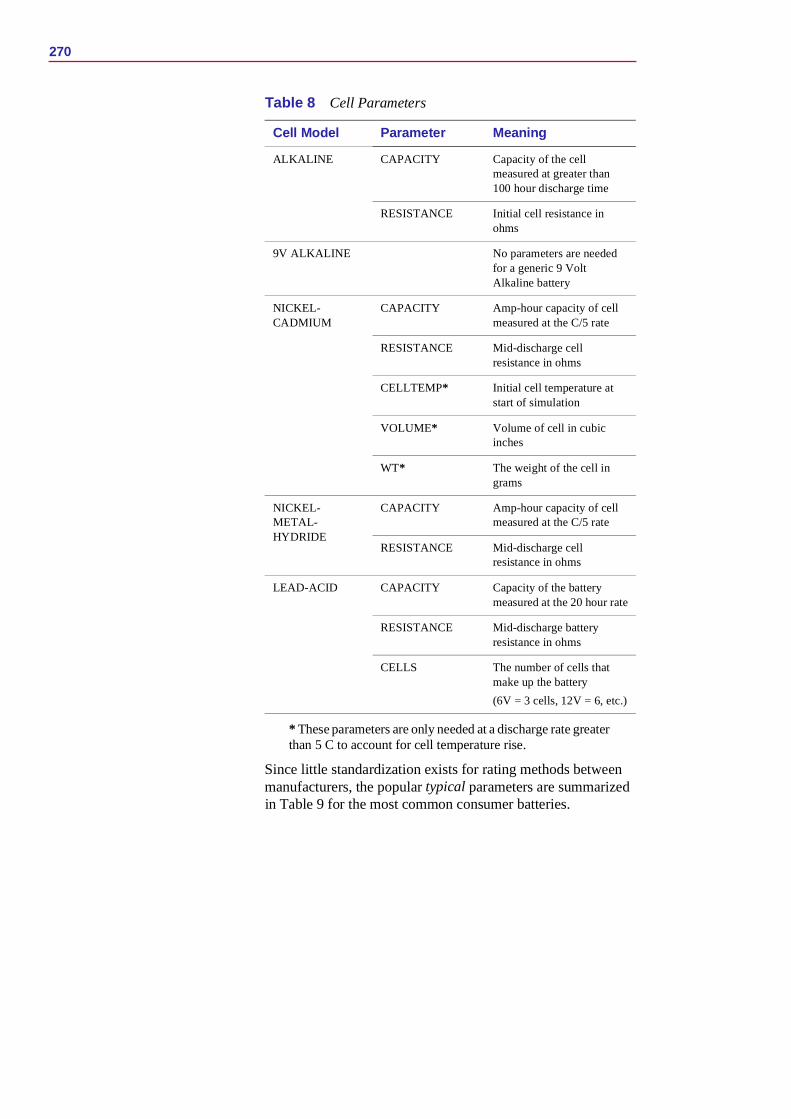
Using the Discharge ModelsTo use the models in a simulation, add the required number of cells to the circuit file, and pass the appropriate parameters to the subcircuit model. The manufacturers’ data sheets may be consulted for information on the cell parameters shown in Table 8.
LowRate
R4
Invert
E_Invert
C1E_Rate
R2 60
RATE
+OUTPUT-OUTPUT
V_Sense30 20
R_Cell
E_Temp E_Cell10
R1
50
G_LowRateC_CellCapacity
E_LostRate
STATE_OF_CHARGE
SOC
G_Discharge
E_Temp_Rise C2
R_ThermalV_Ambient CELL_TEMP
80
70R3E_LowRate
270
* These parameters are only needed at a discharge rate greater than 5 C to account for cell temperature rise.
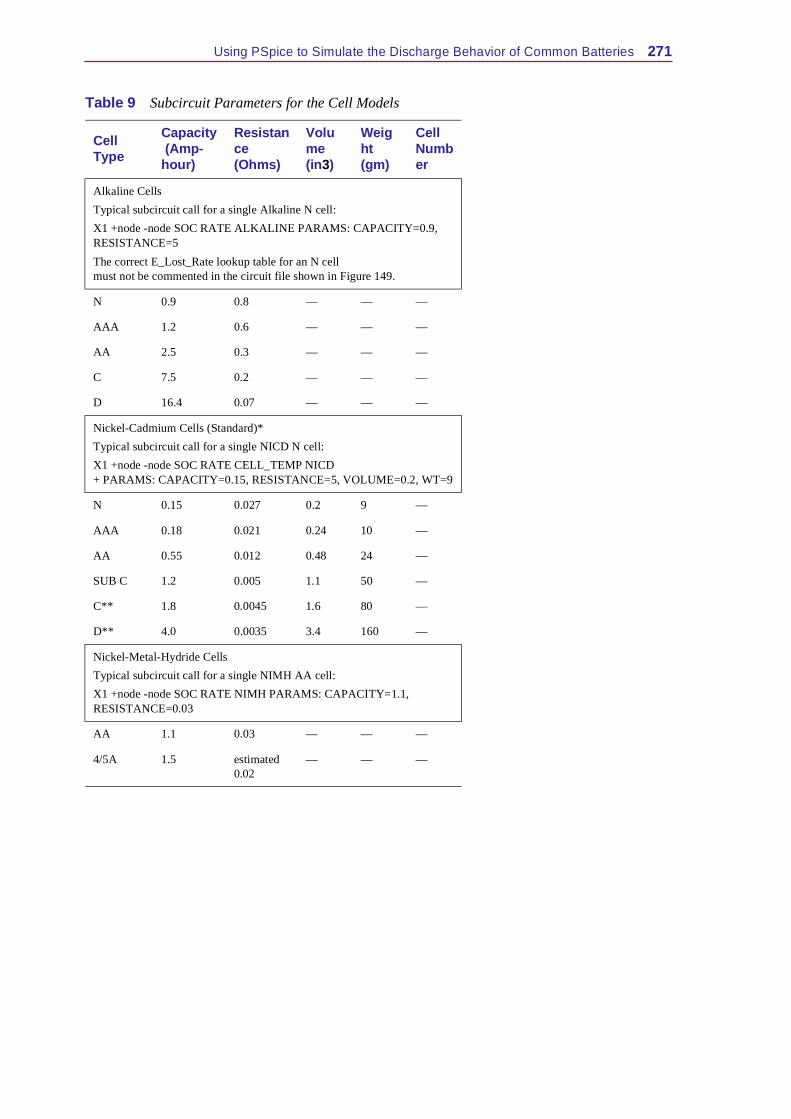
Since little standardization exists for rating methods between manufacturers, the popular typical parameters are summarized in Table 9 for the most common consumer batteries.
Table 8 Cell Parameters
Cell Model Parameter Meaning
ALKALINE CAPACITY Capacity of the cell measured at greater than 100 hour discharge time
RESISTANCE Initial cell resistance in ohms
9V ALKALINE No parameters are needed for a generic 9 Volt Alkaline battery
NICKEL-CADMIUM
CAPACITY Amp-hour capacity of cell measured at the C/5 rate
RESISTANCE Mid-discharge cell resistance in ohms
CELLTEMP* Initial cell temperature at start of simulation
VOLUME* Volume of cell in cubic inches
WT* The weight of the cell in grams
NICKEL-METAL-HYDRIDE
CAPACITY Amp-hour capacity of cell measured at the C/5 rate
RESISTANCE Mid-discharge cell resistance in ohms
LEAD-ACID CAPACITY Capacity of the battery measured at the 20 hour rate
RESISTANCE Mid-discharge battery resistance in ohms
CELLS The number of cells that make up the battery (6V = 3 cells, 12V = 6, etc.)
Using PSpice to Simulate the Discharge Behavior of Common Batteries 271
Table 9 Subcircuit Parameters for the Cell Models
Cell Type
Capacity (Amp-hour)
Resistance (Ohms)
Volume (in3)
Weight (gm)
Cell Number
Alkaline CellsTypical subcircuit call for a single Alkaline N cell:X1 +node -node SOC RATE ALKALINE PARAMS: CAPACITY=0.9, RESISTANCE=5The correct E_Lost_Rate lookup table for an N cellmust not be commented in the circuit file shown in Figure 149.
N 0.9 0.8 — — —
AAA 1.2 0.6 — — —
AA 2.5 0.3 — — —
C 7.5 0.2 — — —
D 16.4 0.07 — — —
Nickel-Cadmium Cells (Standard)*Typical subcircuit call for a single NICD N cell:X1 +node -node SOC RATE CELL_TEMP NICD+ PARAMS: CAPACITY=0.15, RESISTANCE=5, VOLUME=0.2, WT=9
N 0.15 0.027 0.2 9 —
AAA 0.18 0.021 0.24 10 —
AA 0.55 0.012 0.48 24 —
SUB C 1.2 0.005 1.1 50 —
C** 1.8 0.0045 1.6 80 —
D** 4.0 0.0035 3.4 160 —
Nickel-Metal-Hydride CellsTypical subcircuit call for a single NIMH AA cell:X1 +node -node SOC RATE NIMH PARAMS: CAPACITY=1.1, RESISTANCE=0.03
AA 1.1 0.03 — — —
4/5A 1.5 estimated 0.02
— — —
272
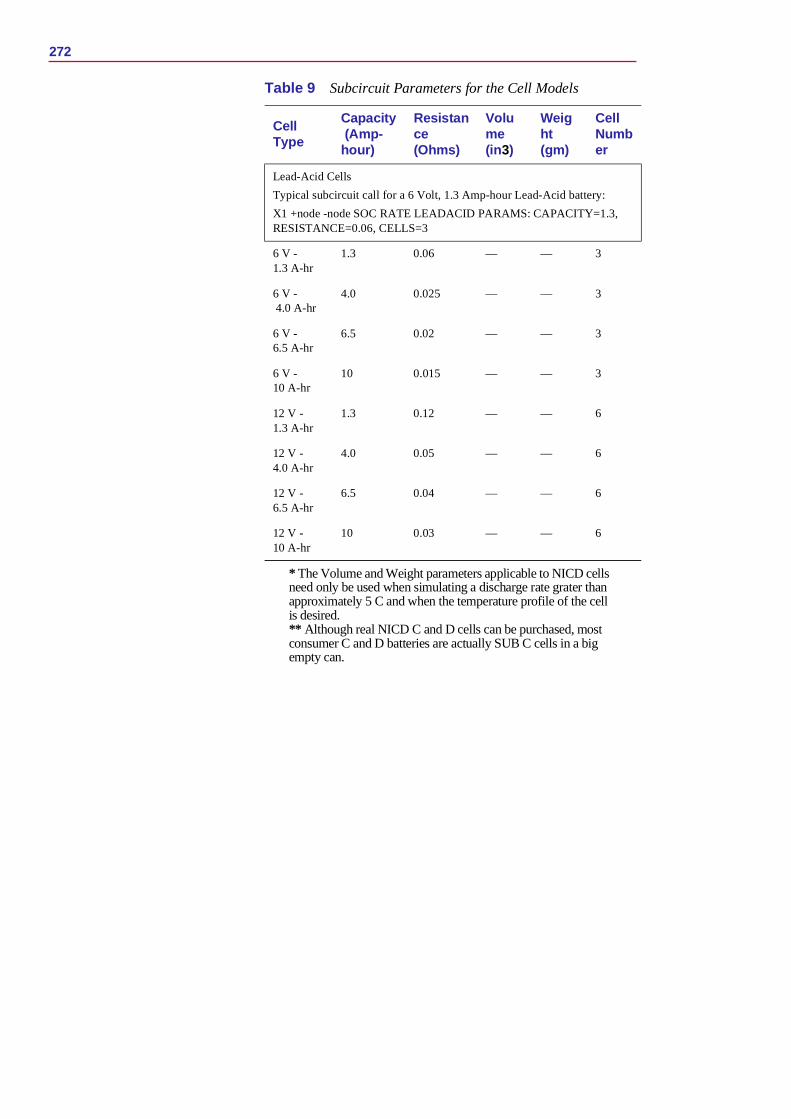
* The Volume and Weight parameters applicable to NICD cells need only be used when simulating a discharge rate grater than approximately 5 C and when the temperature profile of the cell is desired.** Although real NICD C and D cells can be purchased, most consumer C and D batteries are actually SUB C cells in a big empty can.
Lead-Acid CellsTypical subcircuit call for a 6 Volt, 1.3 Amp-hour Lead-Acid battery:X1 +node -node SOC RATE LEADACID PARAMS: CAPACITY=1.3, RESISTANCE=0.06, CELLS=3
6 V - 1.3 A-hr
1.3 0.06 — — 3
6 V - 4.0 A-hr
4.0 0.025 — — 3
6 V - 6.5 A-hr
6.5 0.02 — — 3
6 V - 10 A-hr
10 0.015 — — 3
12 V - 1.3 A-hr
1.3 0.12 — — 6
12 V - 4.0 A-hr
4.0 0.05 — — 6
12 V - 6.5 A-hr
6.5 0.04 — — 6
12 V - 10 A-hr
10 0.03 — — 6
Table 9 Subcircuit Parameters for the Cell Models
Cell Type
Capacity (Amp-hour)
Resistance (Ohms)
Volume (in3)
Weight (gm)
Cell Number
Using PSpice to Simulate the Discharge Behavior of Common Batteries 273
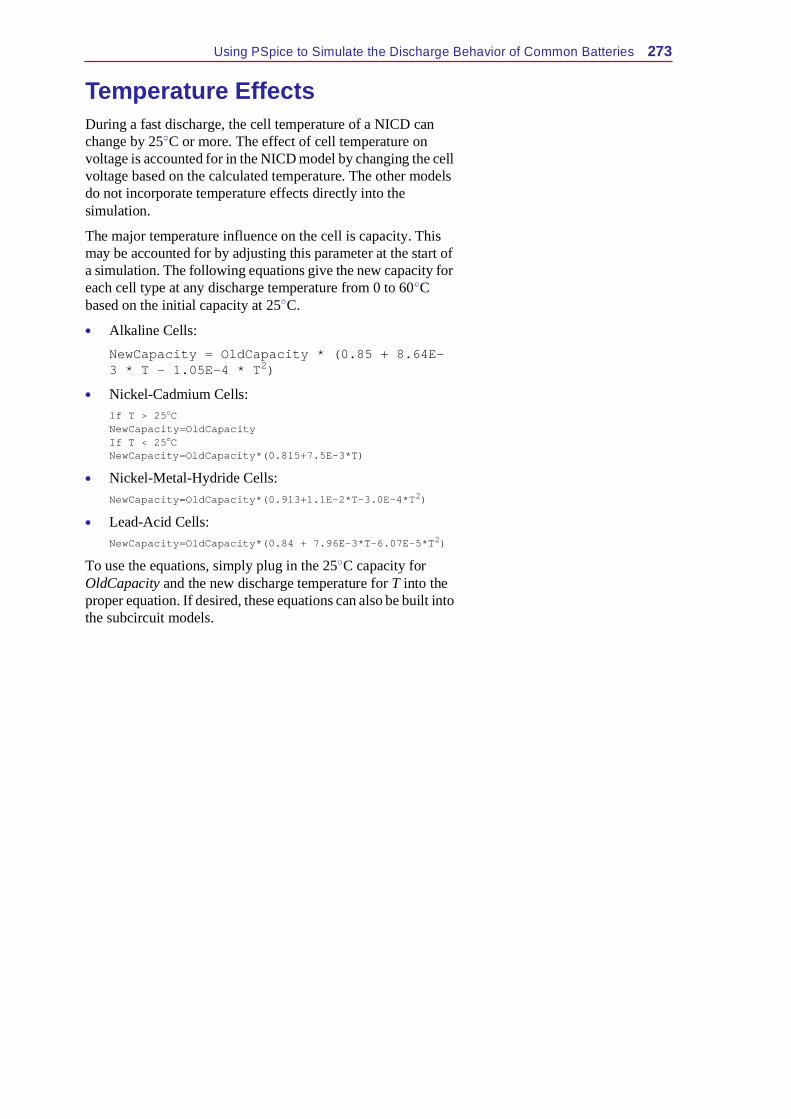
Temperature EffectsDuring a fast discharge, the cell temperature of a NICD can change by 25 C or more. The effect of cell temperature on voltage is accounted for in the NICD model by changing the cell voltage based on the calculated temperature. The other models do not incorporate temperature effects directly into the simulation.
The major temperature influence on the cell is capacity. This may be accounted for by adjusting this parameter at the start of a simulation. The following equations give the new capacity for each cell type at any discharge temperature from 0 to 60 C based on the initial capacity at 25 C.
Alkaline Cells:NewCapacity = OldCapacity * (0.85 + 8.64E-3 * T - 1.05E-4 * T2)Nickel-Cadmium Cells: If T > 25 CNewCapacity=OldCapacityIf T < 25 CNewCapacity=OldCapacity*(0.815+7.5E-3*T)
Nickel-Metal-Hydride Cells: NewCapacity=OldCapacity*(0.913+1.1E-2*T-3.0E-4*T2)
Lead-Acid Cells:NewCapacity=OldCapacity*(0.84 + 7.96E-3*T-6.07E-5*T2)
To use the equations, simply plug in the 25 C capacity for OldCapacity and the new discharge temperature for T into the proper equation. If desired, these equations can also be built into the subcircuit models.
274
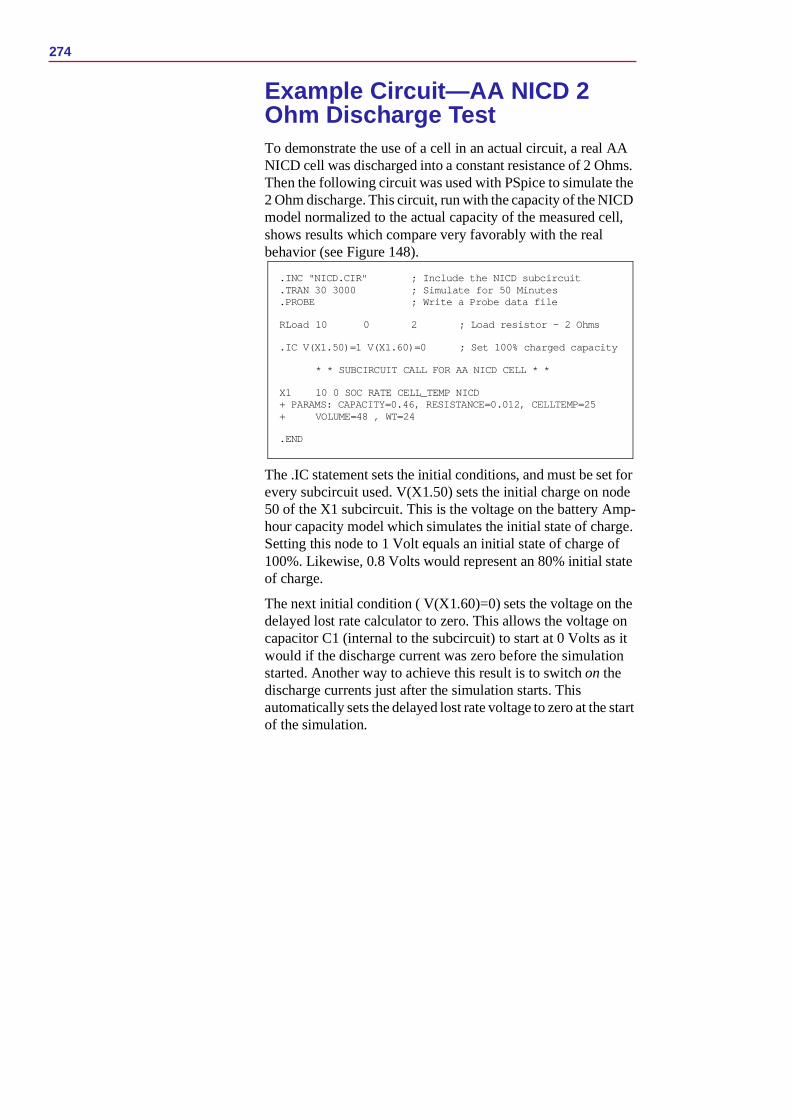
Example Circuit—AA NICD 2 Ohm Discharge TestTo demonstrate the use of a cell in an actual circuit, a real AA NICD cell was discharged into a constant resistance of 2 Ohms. Then the following circuit was used with PSpice to simulate the 2 Ohm discharge. This circuit, run with the capacity of the NICD model normalized to the actual capacity of the measured cell, shows results which compare very favorably with the real behavior (see Figure 148).
The .IC statement sets the initial conditions, and must be set for every subcircuit used. V(X1.50) sets the initial charge on node 50 of the X1 subcircuit. This is the voltage on the battery Amp-hour capacity model which simulates the initial state of charge. Setting this node to 1 Volt equals an initial state of charge of 100%. Likewise, 0.8 Volts would represent an 80% initial state of charge.
The next initial condition ( V(X1.60)=0) sets the voltage on the delayed lost rate calculator to zero. This allows the voltage on capacitor C1 (internal to the subcircuit) to start at 0 Volts as it would if the discharge current was zero before the simulation started. Another way to achieve this result is to switch on the discharge currents just after the simulation starts. This automatically sets the delayed lost rate voltage to zero at the start of the simulation.
.INC "NICD.CIR" ; Include the NICD subcircuit
.TRAN 30 3000 ; Simulate for 50 Minutes
.PROBE ; Write a Probe data file
RLoad 10 0 2 ; Load resistor - 2 Ohms
.IC V(X1.50)=1 V(X1.60)=0 ; Set 100% charged capacity
* * SUBCIRCUIT CALL FOR AA NICD CELL * *
X1 10 0 SOC RATE CELL_TEMP NICD + PARAMS: CAPACITY=0.46, RESISTANCE=0.012, CELLTEMP=25+ VOLUME=48 , WT=24
.END
Using PSpice to Simulate the Discharge Behavior of Common Batteries 275
Figure 148 The 2 Ohm discharge test results using the NICD simulation model closely match discharge data for an actual AA cell
Limitations of the ModelsThe circuits presented here trade off accuracy with simplicity and simulation time. There are several cases where the simulated and actual results vary significantly.
In practice, Alkaline cells are sometimes used in 2 to 8 hour shifts, and rest the remainder of the day. This rest time allows the cell to recover part of its discharge capacity. This phenomenon is not specifically modeled, and when simulated with the alkaline subcircuit (see Figure 149), the observed capacity may be up to 25% short over a cell’s actual performance. Using the Alkaline models in these patterns will give a conservative estimate of capacity.
When a battery is discharged to a low terminal voltage level, then disconnected from the load, the battery voltage will recover to some higher level in an hour or so. This phenomenon is accounted for in these models when they are discharged at high
276
current levels then left to rest. When the models are used at low discharge rates to low terminal voltages however, they do not show this voltage recovery. The battery chemistry tries to make a voltage potential difference even if only a few molecules of unused material remain. In this state of discharge, the internal resistance of the cell can be an order of magnitude, or more, than its initial value. If any load is reconnected, the terminal voltage will quickly collapse again to zero.
The models were designed to be used with the standard cutoff voltages as specified by the battery makers. For NICD batteries, this is 0.8 to 1.1 Volts per cell. For Alkaline cells, the cutoff is 0.8 to 1.2 Volts per cell. For Lead-Acid cells, the cutoff voltage is typically 1.5 to 1.7 Volts per cell. Usage beyond these limits should be studied carefully because they were not specifically examined in the modeling process.
These models were not designed to be connected in parallel. This is not acceptable in consumer design anyway, because there is no way to guard against the end user putting an Alkaline cell in parallel with a NICD or Carbon cell. If these different types of cells are connected together, the charge most likely won’t equalize. This results in overcharging and leakage of the weak cell, thus causing damage.
Using PSpice to Simulate the Discharge Behavior of Common Batteries 277
Simulation SpeedThe goal of simulation is to obtain results faster than can be achieved with the hardware, or to measure behaviors which cannot easily be accessed in the hardware. The following notes should help when making speed/accuracy trade-offs.
Don’t go overboard on the models that you attach to these batteries during a simulation. Simulate the power drain from your circuit, not the transistor-level circuit itself. These models have been tried and verified with many different discharge regimens, and are believed to be accurate enough to allow finding maximum or minimum battery life. The trends these models simulate are believed to be basically accurate, even though the absolute capacity simulated may be 20% or so off.
Don’t simulate pulsed current loads with cycle times less than 5 seconds or so. Using short cycle time pulsed currents may make the simulation run slower than real time. To speed up the simulation with fast pulsed loads, use the RMS average of the pulsed current. This will provide you with a ballpark answer.
Use a minimum of semiconductor models hooked up to these models. Semiconductors contain many internal nonlinear equations that must be solved for each time point, thus slowing simulation time.
To prevent convergence problems, ABSTOL and VNTOL should be set to values about nine orders of magnitude less than the maximum currents and voltages in your circuit.
RELTOL may be relaxed to 1% from its 0.1% default value to speed up the simulation.
If you experience convergence problems, use the .IC directive to set the initial voltages on critical nodes in your circuit.
278
If you still experience convergence problems, use a voltage-controlled switch model (S device type in PSpice) to connect the battery to the load after the simulation starts. Use as slow of a connect transition time as possible to avoid stalling the simulator.
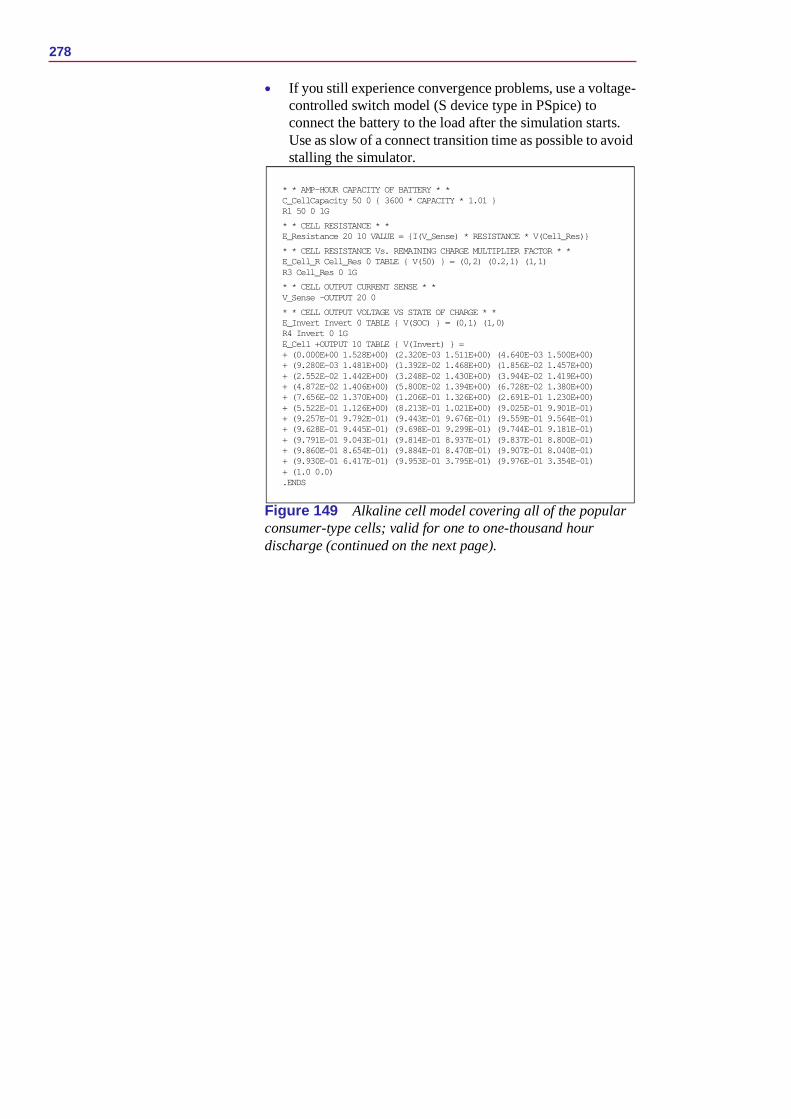
Figure 149 Alkaline cell model covering all of the popular consumer-type cells; valid for one to one-thousand hour discharge (continued on the next page).
* * AMP-HOUR CAPACITY OF BATTERY * *C_CellCapacity 50 0 { 3600 * CAPACITY * 1.01 }R1 50 0 1G* * CELL RESISTANCE * *E_Resistance 20 10 VALUE = {I(V_Sense) * RESISTANCE * V(Cell_Res)}* * CELL RESISTANCE Vs. REMAINING CHARGE MULTIPLIER FACTOR * *E_Cell_R Cell_Res 0 TABLE { V(50) } = (0,2) (0.2,1) (1,1)R3 Cell_Res 0 1G * * CELL OUTPUT CURRENT SENSE * *V_Sense -OUTPUT 20 0* * CELL OUTPUT VOLTAGE VS STATE OF CHARGE * *E_Invert Invert 0 TABLE { V(SOC) } = (0,1) (1,0)R4 Invert 0 1GE_Cell +OUTPUT 10 TABLE { V(Invert) } = + (0.000E+00 1.528E+00) (2.320E-03 1.511E+00) (4.640E-03 1.500E+00)+ (9.280E-03 1.481E+00) (1.392E-02 1.468E+00) (1.856E-02 1.457E+00)+ (2.552E-02 1.442E+00) (3.248E-02 1.430E+00) (3.944E-02 1.419E+00)+ (4.872E-02 1.406E+00) (5.800E-02 1.394E+00) (6.728E-02 1.380E+00)+ (7.656E-02 1.370E+00) (1.206E-01 1.326E+00) (2.691E-01 1.230E+00)+ (5.522E-01 1.126E+00) (8.213E-01 1.021E+00) (9.025E-01 9.901E-01)+ (9.257E-01 9.792E-01) (9.443E-01 9.676E-01) (9.559E-01 9.564E-01)+ (9.628E-01 9.445E-01) (9.698E-01 9.299E-01) (9.744E-01 9.181E-01)+ (9.791E-01 9.043E-01) (9.814E-01 8.937E-01) (9.837E-01 8.800E-01)+ (9.860E-01 8.654E-01) (9.884E-01 8.470E-01) (9.907E-01 8.040E-01)+ (9.930E-01 6.417E-01) (9.953E-01 3.795E-01) (9.976E-01 3.354E-01)+ (1.0 0.0).ENDS
Using PSpice to Simulate the Discharge Behavior of Common Batteries 279
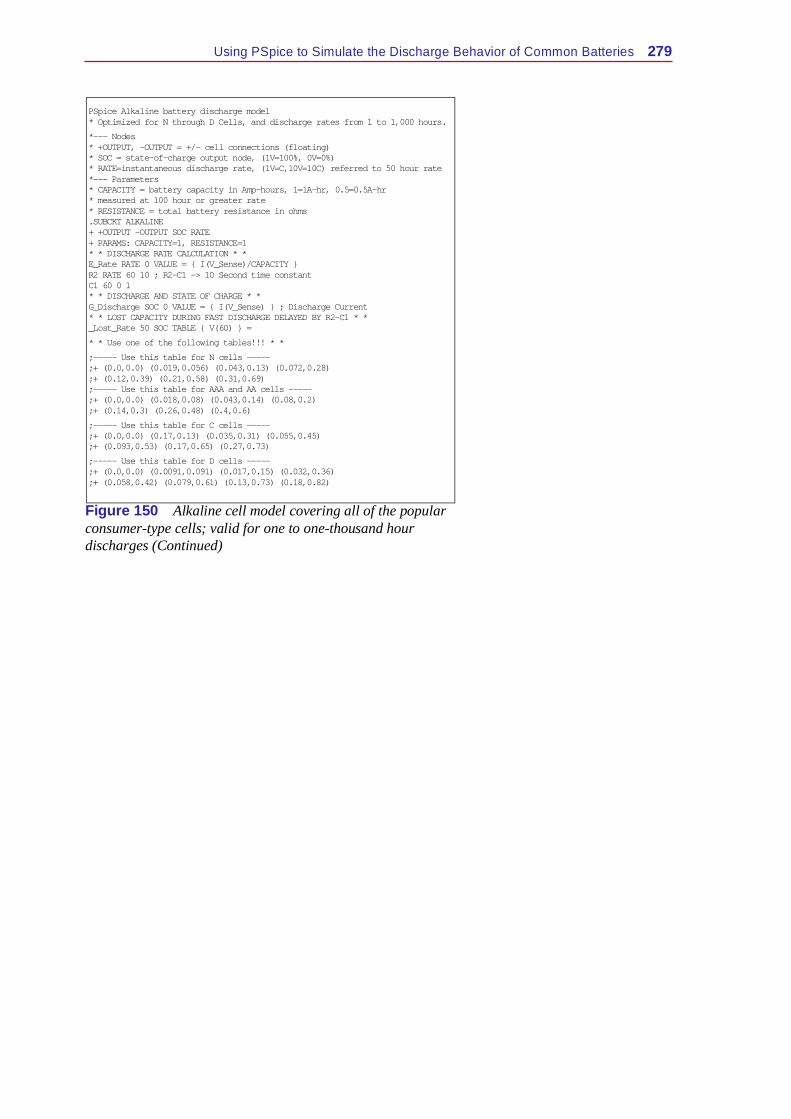
Figure 150 Alkaline cell model covering all of the popular consumer-type cells; valid for one to one-thousand hour discharges (Continued)
PSpice Alkaline battery discharge model* Optimized for N through D Cells, and discharge rates from 1 to 1,000 hours.*--- Nodes* +OUTPUT, -OUTPUT = +/- cell connections (floating)* SOC = state-of-charge output node, (1V=100%, 0V=0%)* RATE=instantaneous discharge rate, (1V=C,10V=10C) referred to 50 hour rate*--- Parameters* CAPACITY = battery capacity in Amp-hours, 1=1A-hr, 0.5=0.5A-hr* measured at 100 hour or greater rate* RESISTANCE = total battery resistance in ohms.SUBCKT ALKALINE+ +OUTPUT -OUTPUT SOC RATE+ PARAMS: CAPACITY=1, RESISTANCE=1* * DISCHARGE RATE CALCULATION * *E_Rate RATE 0 VALUE = { I(V_Sense)/CAPACITY }R2 RATE 60 10 ; R2-C1 -> 10 Second time constant C1 60 0 1* * DISCHARGE AND STATE OF CHARGE * *G_Discharge SOC 0 VALUE = { I(V_Sense) } ; Discharge Current* * LOST CAPACITY DURING FAST DISCHARGE DELAYED BY R2-C1 * *_Lost_Rate 50 SOC TABLE { V(60) } =* * Use one of the following tables!!! * *;----- Use this table for N cells -----;+ (0.0,0.0) (0.019,0.056) (0.043,0.13) (0.072,0.28) ;+ (0.12,0.39) (0.21,0.58) (0.31,0.69);----- Use this table for AAA and AA cells -----;+ (0.0,0.0) (0.018,0.08) (0.043,0.14) (0.08,0.2) ;+ (0.14,0.3) (0.26,0.48) (0.4,0.6);----- Use this table for C cells -----;+ (0.0,0.0) (0.17,0.13) (0.035,0.31) (0.055,0.45) ;+ (0.093,0.53) (0.17,0.65) (0.27,0.73);----- Use this table for D cells -----;+ (0.0,0.0) (0.0091,0.091) (0.017,0.15) (0.032,0.36) ;+ (0.058,0.42) (0.079,0.61) (0.13,0.73) (0.18,0.82)
280
Figure 151 9 Volt alkaline cell model for discharge rates from 0 to 400 mA
PSpice 9 Volt Alkaline battery discharge model* Tested for discharge rates from 0 to 400 mA to 4.8 Volt cutoff voltage.*--- Nodes* +OUTPUT, -OUTPUT = +/- cell connections (floating)* SOC = state-of-charge output node, (1V=100%, 0V=0%)* RATE = instantaneous discharge rate, (1V=C,10V=10C)* referred to 120 hour rate *--- Parameters * CAPACITY = mA-hr capacity of 9 Volt Alkaline battery.SUBCKT ALK_9V + +OUTPUT -OUTPUT SOC RATE+ PARAMS: CAPACITY=0.565* * DISCHARGE RATE CALCULATION * *E_Rate RATE 0 VALUE = { I(V_Sense)/CAPACITY }R2 RATE 60 10 ; R2-C1 -> 10 Second time constant C1 60 0 1 * * DISCHARGE AND STATE OF CHARGE * *G_Discharge SOC 0 VALUE = { I(V_Sense) } ; Discharge Current* * LOST CAPACITY DURING FAST DISCHARGE DELAYED BY R2-C1 *E_Lost_Rate 50 SOC TABLE { V(60) } = + (0.0,0.0) (0.025,0.009) (0.046,0.080) (0.088,0.14) (0.18,0.21) (0.71,0.45)* * AMP-HOUR CAPACITY OF BATTERY * *C_CellCapacity 50 0 { 3600 * CAPACITY * 1.06 }R1 50 0 1G* * CELL RESISTANCE * *E_Resistance 20 10 VALUE = { I(V_Sense) * 2.0 * V(Cell_Res) }* * CELL RESISTANCE Vs. REMAINING CHARGE MULTIPLIER FACTOR * *E_Cell_R Cell_Res 0 TABLE { V(50) } = (0,4) (0.2,2) (1,1)R3 Cell_Res 0 1G * * CELL OUTPUT CURRENT SENSE * *V_Sense -OUTPUT 20 0* * CELL OUTPUT VOLTAGE VS STATE OF CHARGE * *E_Invert Invert 0 TABLE { V(SOC) } = (0,1) (1,0)R4 Invert 0 1GE_Cell +OUTPUT 10 TABLE { V(Invert) } = + (0.00 9.18) (0.05 8.82) (0.10 8.62)+ (0.15 8.41) (0.20 8.30) (0.25 8.21)+ (0.30 8.09) (0.35 7.99) (0.40 7.95)+ (0.45 7.89) (0.50 7.79) (0.55 7.66) + (0.60 7.55) (0.70 7.18) (0.75 6.96) + (0.80 6.58) (0.85 6.12) (0.90 5.42) + (0.95 4.51) (1.00 0.00).ENDS
Using PSpice to Simulate the Discharge Behavior of Common Batteries 281
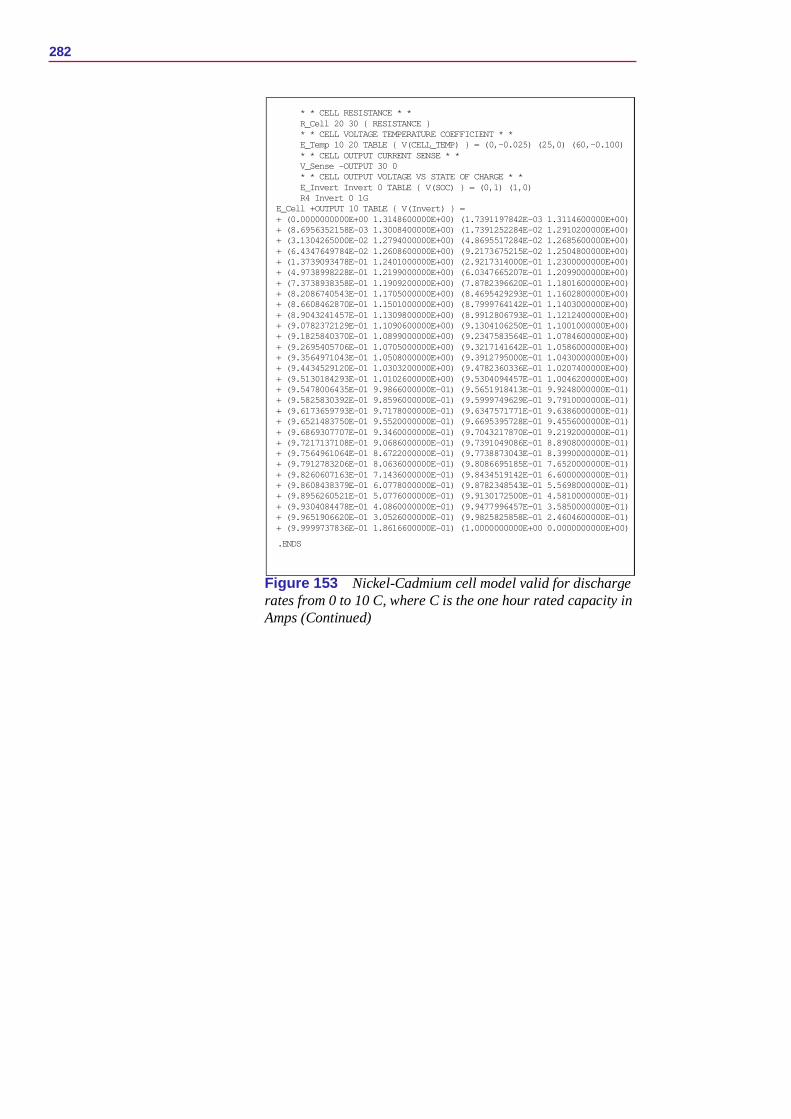
Figure 152 Nickel-Cadmium cell model valid for discharge rates from 0 to 10 C, where C is the one hour rated capacity in Amps (continued on the next page).
PSpice Nickel-Cadmium battery discharge model* Optimized for N through SUB C Standard Cells, Discharge rates from 0C to 10C. *--- Nodes* +OUTPUT, -OUTPUT = +/- cell connections (floating)* SOC = state-of-charge output node, (1V=100%, 0V=0%)* RATE = instantaneous discharge rate, (1V=C,10V=10C)* CELL_TEMP = cell temperature output node*--- Parameters* CAPACITY = cell capacity in Amp-hours, 1=1A-hr, 0.5=0.5A-hr* measured at 1 hour or greater rate* RESISTANCE = cell resistance in ohms* CELLTEMP = ambient temperature in degrees C* VOLUME = cell volume in cubic inches* WT = cell weight in grams.SUBCKT NICD+ +OUTPUT -OUTPUT SOC RATE CELL_TEMP+ PARAMS: CAPACITY=1, RESISTANCE=1, CELLTEMP=25, VOLUME=1, WT=1* * DISCHARGE RATE CALCULATION * *E_Rate RATE 0 VALUE = { I(V_Sense)/CAPACITY }R2 RATE 60 1 ;R2-C2 provide 3 second delayed time constantC1 60 0 3* * LOW RATE ADDITIONAL ENERGY LOOK-UP TABLE AND TRANSFER * *E_LowRate LowRate 0 TABLE {V(RATE)} = (0,0) (0.001,0.2) (0.1,0.2) (1,0)R3 LowRate 0 1GG_LowRate 0 50 VALUE = { V(LowRate)*I(V_Sense) }* * DISCHARGE AND STATE OF CHARGE * *G_Discharge SOC 0 VALUE = { I(V_Sense) } ; Discharge Current* * LOST CAPACITY DURING FAST DISCHARGE DELAYED BY R2-C1 * *E_LostRate 50 SOC TABLE { V(60) } = (1.0,0) (10,0.25)* * AMP-HOUR CAPACITY OF BATTERY * *C_CellCapacity 50 0 { 3600 * CAPACITY * 1.03 }R1 50 0 1G* * POWER DISSIPATION AND CELL TEMPERATURE * *E_Temp_Rise 70 0 VALUE = {PWR(I(V_Sense),2)*RESISTANCE*(13.4 PWR(VOLUME,-0.6065))}V_Ambient 80 70 { CELLTEMP } R_Thermal CELL_TEMP 80 { 2.65 * WT }C2 CELL_TEMP 0 1
282
Figure 153 Nickel-Cadmium cell model valid for discharge rates from 0 to 10 C, where C is the one hour rated capacity in Amps (Continued)
* * CELL RESISTANCE * *R_Cell 20 30 { RESISTANCE }* * CELL VOLTAGE TEMPERATURE COEFFICIENT * *E_Temp 10 20 TABLE { V(CELL_TEMP) } = (0,-0.025) (25,0) (60,-0.100)* * CELL OUTPUT CURRENT SENSE * *V_Sense -OUTPUT 30 0* * CELL OUTPUT VOLTAGE VS STATE OF CHARGE * *E_Invert Invert 0 TABLE { V(SOC) } = (0,1) (1,0)R4 Invert 0 1G
E_Cell +OUTPUT 10 TABLE { V(Invert) } = + (0.0000000000E+00 1.3148600000E+00) (1.7391197842E-03 1.3114600000E+00)+ (8.6956352158E-03 1.3008400000E+00) (1.7391252284E-02 1.2910200000E+00)+ (3.1304265000E-02 1.2794000000E+00) (4.8695517284E-02 1.2685600000E+00)+ (6.4347649784E-02 1.2608600000E+00) (9.2173675215E-02 1.2504800000E+00)+ (1.3739093478E-01 1.2401000000E+00) (2.9217314000E-01 1.2300000000E+00)+ (4.9738998228E-01 1.2199000000E+00) (6.0347665207E-01 1.2099000000E+00)+ (7.3738938358E-01 1.1909200000E+00) (7.8782396620E-01 1.1801600000E+00)+ (8.2086740543E-01 1.1705000000E+00) (8.4695429293E-01 1.1602800000E+00)+ (8.6608462870E-01 1.1501000000E+00) (8.7999764142E-01 1.1403000000E+00)+ (8.9043241457E-01 1.1309800000E+00) (8.9912806793E-01 1.1212400000E+00)+ (9.0782372129E-01 1.1090600000E+00) (9.1304106250E-01 1.1001000000E+00)+ (9.1825840370E-01 1.0899000000E+00) (9.2347583564E-01 1.0784600000E+00)+ (9.2695405706E-01 1.0705000000E+00) (9.3217141642E-01 1.0586000000E+00)+ (9.3564971043E-01 1.0508000000E+00) (9.3912795000E-01 1.0430000000E+00)+ (9.4434529120E-01 1.0303200000E+00) (9.4782360336E-01 1.0207400000E+00)+ (9.5130184293E-01 1.0102600000E+00) (9.5304094457E-01 1.0046200000E+00)+ (9.5478006435E-01 9.9866000000E-01) (9.5651918413E-01 9.9248000000E-01)+ (9.5825830392E-01 9.8596000000E-01) (9.5999749629E-01 9.7910000000E-01)+ (9.6173659793E-01 9.7178000000E-01) (9.6347571771E-01 9.6386000000E-01)+ (9.6521483750E-01 9.5520000000E-01) (9.6695395728E-01 9.4556000000E-01)+ (9.6869307707E-01 9.3460000000E-01) (9.7043217870E-01 9.2192000000E-01)+ (9.7217137108E-01 9.0686000000E-01) (9.7391049086E-01 8.8908000000E-01)+ (9.7564961064E-01 8.6722000000E-01) (9.7738873043E-01 8.3990000000E-01)+ (9.7912783206E-01 8.0636000000E-01) (9.8086695185E-01 7.6520000000E-01)+ (9.8260607163E-01 7.1436000000E-01) (9.8434519142E-01 6.6000000000E-01)+ (9.8608438379E-01 6.0778000000E-01) (9.8782348543E-01 5.5698000000E-01)+ (9.8956260521E-01 5.0776000000E-01) (9.9130172500E-01 4.5810000000E-01)+ (9.9304084478E-01 4.0860000000E-01) (9.9477996457E-01 3.5850000000E-01)+ (9.9651906620E-01 3.0526000000E-01) (9.9825825858E-01 2.4604600000E-01)+ (9.9999737836E-01 1.8616600000E-01) (1.0000000000E+00 0.0000000000E+00) .ENDS
Using PSpice to Simulate the Discharge Behavior of Common Batteries 283
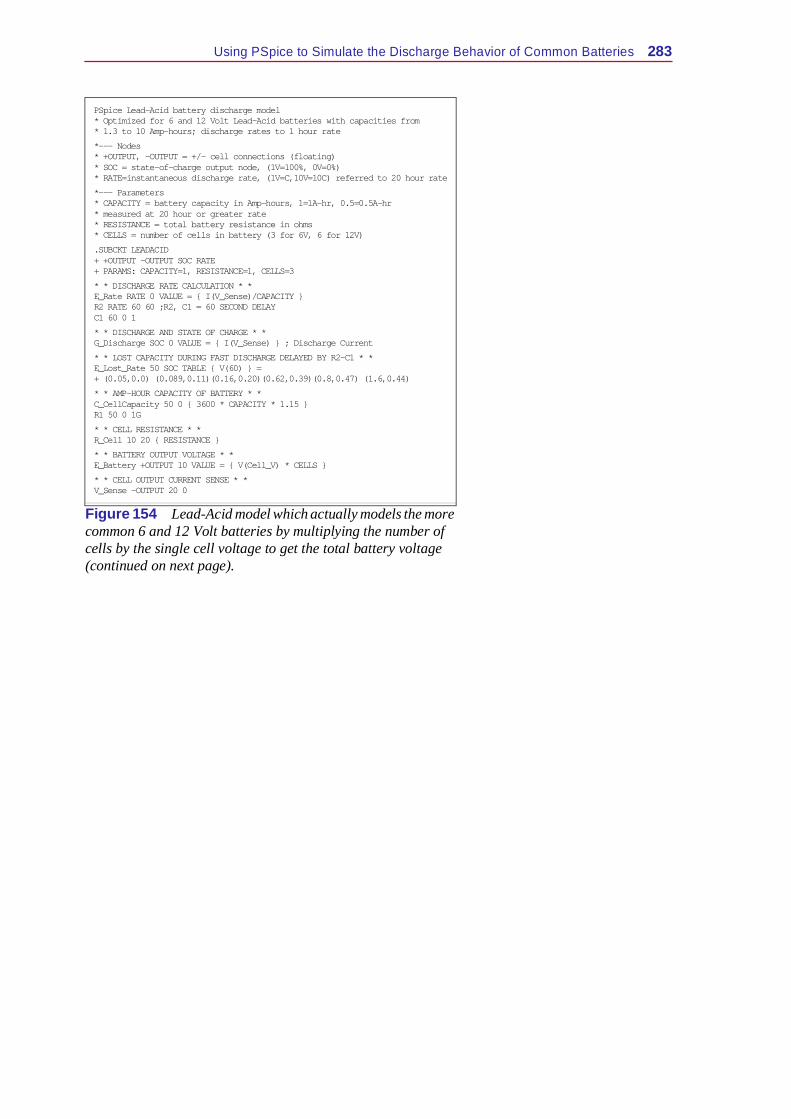
Figure 154 Lead-Acid model which actually models the more common 6 and 12 Volt batteries by multiplying the number of cells by the single cell voltage to get the total battery voltage (continued on next page).
PSpice Lead-Acid battery discharge model* Optimized for 6 and 12 Volt Lead-Acid batteries with capacities from * 1.3 to 10 Amp-hours; discharge rates to 1 hour rate*--- Nodes* +OUTPUT, -OUTPUT = +/- cell connections (floating)* SOC = state-of-charge output node, (1V=100%, 0V=0%)* RATE=instantaneous discharge rate, (1V=C,10V=10C) referred to 20 hour rate*--- Parameters* CAPACITY = battery capacity in Amp-hours, 1=1A-hr, 0.5=0.5A-hr* measured at 20 hour or greater rate* RESISTANCE = total battery resistance in ohms* CELLS = number of cells in battery (3 for 6V, 6 for 12V).SUBCKT LEADACID+ +OUTPUT -OUTPUT SOC RATE+ PARAMS: CAPACITY=1, RESISTANCE=1, CELLS=3* * DISCHARGE RATE CALCULATION * *E_Rate RATE 0 VALUE = { I(V_Sense)/CAPACITY }R2 RATE 60 60 ;R2, C1 = 60 SECOND DELAYC1 60 0 1 * * DISCHARGE AND STATE OF CHARGE * *G_Discharge SOC 0 VALUE = { I(V_Sense) } ; Discharge Current* * LOST CAPACITY DURING FAST DISCHARGE DELAYED BY R2-C1 * *E_Lost_Rate 50 SOC TABLE { V(60) } = + (0.05,0.0) (0.089,0.11)(0.16,0.20)(0.62,0.39)(0.8,0.47) (1.6,0.44)* * AMP-HOUR CAPACITY OF BATTERY * *C_CellCapacity 50 0 { 3600 * CAPACITY * 1.15 }R1 50 0 1G* * CELL RESISTANCE * *R_Cell 10 20 { RESISTANCE }* * BATTERY OUTPUT VOLTAGE * *E_Battery +OUTPUT 10 VALUE = { V(Cell_V) * CELLS }* * CELL OUTPUT CURRENT SENSE * *V_Sense -OUTPUT 20 0
284
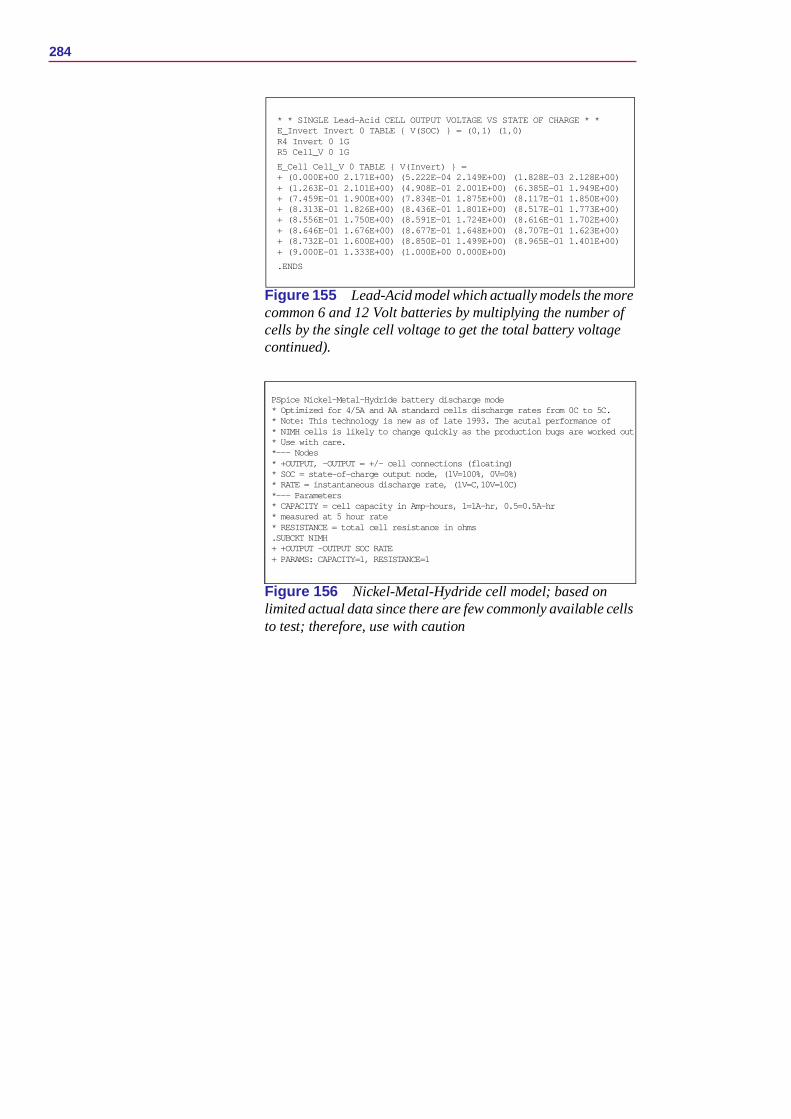
Figure 155 Lead-Acid model which actually models the more common 6 and 12 Volt batteries by multiplying the number of cells by the single cell voltage to get the total battery voltage continued).
Figure 156 Nickel-Metal-Hydride cell model; based on limited actual data since there are few commonly available cells to test; therefore, use with caution
* * SINGLE Lead-Acid CELL OUTPUT VOLTAGE VS STATE OF CHARGE * *E_Invert Invert 0 TABLE { V(SOC) } = (0,1) (1,0)R4 Invert 0 1GR5 Cell_V 0 1GE_Cell Cell_V 0 TABLE { V(Invert) } = + (0.000E+00 2.171E+00) (5.222E-04 2.149E+00) (1.828E-03 2.128E+00)+ (1.263E-01 2.101E+00) (4.908E-01 2.001E+00) (6.385E-01 1.949E+00)+ (7.459E-01 1.900E+00) (7.834E-01 1.875E+00) (8.117E-01 1.850E+00)+ (8.313E-01 1.826E+00) (8.436E-01 1.801E+00) (8.517E-01 1.773E+00)+ (8.556E-01 1.750E+00) (8.591E-01 1.724E+00) (8.616E-01 1.702E+00)+ (8.646E-01 1.676E+00) (8.677E-01 1.648E+00) (8.707E-01 1.623E+00)+ (8.732E-01 1.600E+00) (8.850E-01 1.499E+00) (8.965E-01 1.401E+00)+ (9.000E-01 1.333E+00) (1.000E+00 0.000E+00).ENDS
PSpice Nickel-Metal-Hydride battery discharge mode* Optimized for 4/5A and AA standard cells discharge rates from 0C to 5C.* Note: This technology is new as of late 1993. The acutal performance of * NIMH cells is likely to change quickly as the production bugs are worked out.* Use with care.*--- Nodes* +OUTPUT, -OUTPUT = +/- cell connections (floating)* SOC = state-of-charge output node, (1V=100%, 0V=0%)* RATE = instantaneous discharge rate, (1V=C,10V=10C)*--- Parameters* CAPACITY = cell capacity in Amp-hours, 1=1A-hr, 0.5=0.5A-hr* measured at 5 hour rate* RESISTANCE = total cell resistance in ohms.SUBCKT NIMH+ +OUTPUT -OUTPUT SOC RATE+ PARAMS: CAPACITY=1, RESISTANCE=1
Using PSpice to Simulate the Discharge Behavior of Common Batteries 285
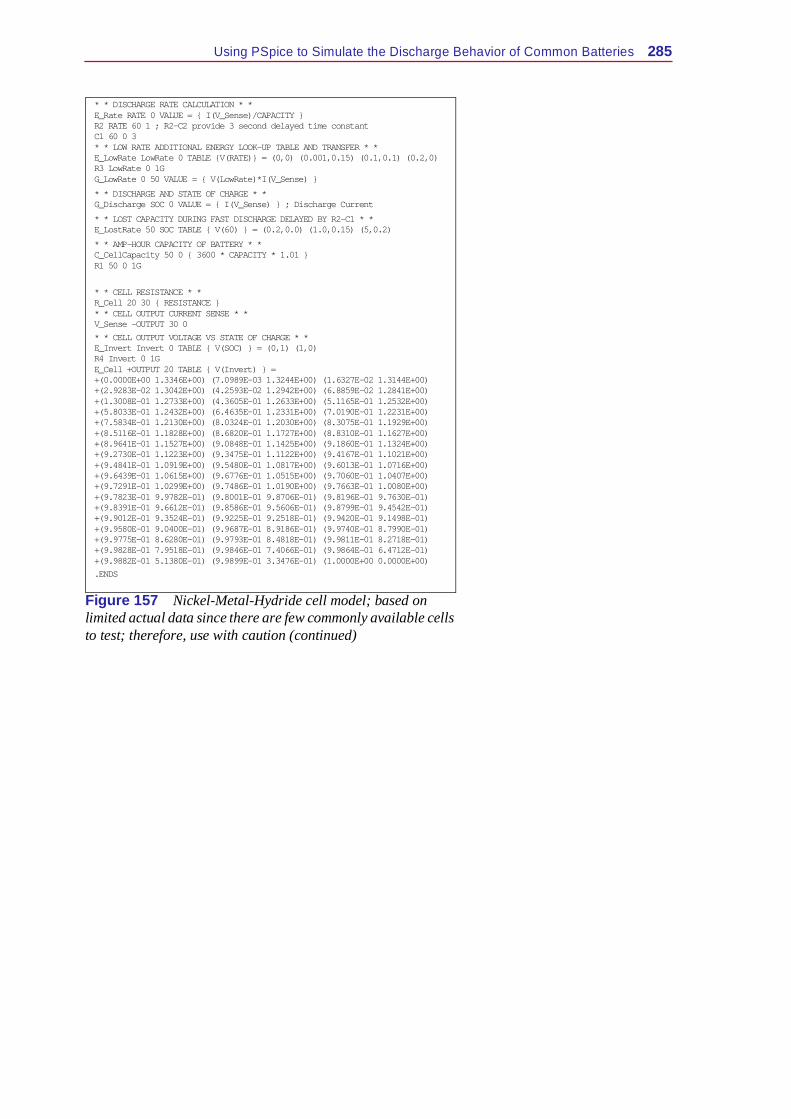
Figure 157 Nickel-Metal-Hydride cell model; based on limited actual data since there are few commonly available cells to test; therefore, use with caution (continued)
* * DISCHARGE RATE CALCULATION * *E_Rate RATE 0 VALUE = { I(V_Sense)/CAPACITY }R2 RATE 60 1 ; R2-C2 provide 3 second delayed time constantC1 60 0 3* * LOW RATE ADDITIONAL ENERGY LOOK-UP TABLE AND TRANSFER * *E_LowRate LowRate 0 TABLE {V(RATE)} = (0,0) (0.001,0.15) (0.1,0.1) (0.2,0)R3 LowRate 0 1GG_LowRate 0 50 VALUE = { V(LowRate)*I(V_Sense) }* * DISCHARGE AND STATE OF CHARGE * *G_Discharge SOC 0 VALUE = { I(V_Sense) } ; Discharge Current* * LOST CAPACITY DURING FAST DISCHARGE DELAYED BY R2-C1 * *E_LostRate 50 SOC TABLE { V(60) } = (0.2,0.0) (1.0,0.15) (5,0.2)* * AMP-HOUR CAPACITY OF BATTERY * *C_CellCapacity 50 0 { 3600 * CAPACITY * 1.01 }R1 50 0 1G
* * CELL RESISTANCE * *R_Cell 20 30 { RESISTANCE }* * CELL OUTPUT CURRENT SENSE * *V_Sense -OUTPUT 30 0* * CELL OUTPUT VOLTAGE VS STATE OF CHARGE * *E_Invert Invert 0 TABLE { V(SOC) } = (0,1) (1,0)R4 Invert 0 1GE_Cell +OUTPUT 20 TABLE { V(Invert) } = +(0.0000E+00 1.3346E+00) (7.0989E-03 1.3244E+00) (1.6327E-02 1.3144E+00)+(2.9283E-02 1.3042E+00) (4.2593E-02 1.2942E+00) (6.8859E-02 1.2841E+00)+(1.3008E-01 1.2733E+00) (4.3605E-01 1.2633E+00) (5.1165E-01 1.2532E+00)+(5.8033E-01 1.2432E+00) (6.4635E-01 1.2331E+00) (7.0190E-01 1.2231E+00)+(7.5834E-01 1.2130E+00) (8.0324E-01 1.2030E+00) (8.3075E-01 1.1929E+00)+(8.5116E-01 1.1828E+00) (8.6820E-01 1.1727E+00) (8.8310E-01 1.1627E+00)+(8.9641E-01 1.1527E+00) (9.0848E-01 1.1425E+00) (9.1860E-01 1.1324E+00)+(9.2730E-01 1.1223E+00) (9.3475E-01 1.1122E+00) (9.4167E-01 1.1021E+00)+(9.4841E-01 1.0919E+00) (9.5480E-01 1.0817E+00) (9.6013E-01 1.0716E+00)+(9.6439E-01 1.0615E+00) (9.6776E-01 1.0515E+00) (9.7060E-01 1.0407E+00)+(9.7291E-01 1.0299E+00) (9.7486E-01 1.0190E+00) (9.7663E-01 1.0080E+00)+(9.7823E-01 9.9782E-01) (9.8001E-01 9.8706E-01) (9.8196E-01 9.7630E-01)+(9.8391E-01 9.6612E-01) (9.8586E-01 9.5606E-01) (9.8799E-01 9.4542E-01)+(9.9012E-01 9.3524E-01) (9.9225E-01 9.2518E-01) (9.9420E-01 9.1498E-01)+(9.9580E-01 9.0400E-01) (9.9687E-01 8.9186E-01) (9.9740E-01 8.7990E-01)+(9.9775E-01 8.6280E-01) (9.9793E-01 8.4818E-01) (9.9811E-01 8.2718E-01)+(9.9828E-01 7.9518E-01) (9.9846E-01 7.4066E-01) (9.9864E-01 6.4712E-01)+(9.9882E-01 5.1380E-01) (9.9899E-01 3.3476E-01) (1.0000E+00 0.0000E+00).ENDS
286
References[1] Hageman, S.C. “PC-based power supply tester slashes setup time to minutes,” Personal Engineering & Instrumentation News, December 1990, Pages 65-66.
MicroSim, Circuit Analysis Reference Manual, Version 5.3, 1993, MicroSim Corporation, Irvine, CA.
DURACELL, Alkaline Dioxide Batteries, DURACELL INC., Bethel, CT.
SANYO, Various literature on Nickel-Cadmium batteries, Sanyo Electric Inc., Little Ferry, NJ.
Panasonic, Sealed Lead-Acid Batteries - Technical Handbook, Panasonic Industrial Co. Secaucus, NJ.
Panasonic, Batteries, Panasonic Industrial Co. Secaucus, NJ.
GATES, Rechargeable Batteries - Applications Handbook, 1992, ISBN 0-7506-9228-6, Butterworth-Heinemann, Stoneham, MA
General Electric, Nickel-Cadmium Battery Application Engineering Handbook, 1975, General Electric Company. (The GATES book above contains most if not all of the information from this discontinued publication)
Power-Sonic, Battery Selector Guide, Power-Sonic Corp., Redwood City, CA.


![How to simulate using PSPICE at Uconn ECEmam10069/Docs/PSPICE Tutorial.pdf · C L_E] skybox.uconn.edu ... FPGA System Planner ... Create based upon an existing proiect AnalogGNDSymboL](https://img.pdfslide.us/doc/110x75/5aabf58e7f8b9a2e088c7ca6/how-to-simulate-using-pspice-at-uconn-mam10069docspspice-tutorialpdfc-le-skyboxuconnedu.jpg)