Embed Size (px)
Citation preview
126 June 2007 UM-07 tutorial 3: Chin
UMAP 2012 Tutorial 2
Empirical Evaluation of User Modeling Systems
David N. Chin
Univ. of Hawaii
Dept. of Information & Computer Sciences

UM-07 tutorial 3: Chin 226 June 2007
Introduction
• Do UMs help/hinder your system?
Experiment design
How to run your experiments
Statistical data analysis
• No background in statistics needed
UM-07 tutorial 3: Chin 326 June 2007
Agenda
I. Experiment Design A. Independent vs. dependent variables
B. Nuisance variables
C. Between-subjects vs. within-subjects designs
D. Estimating sensitivity
E. Factorial designs
F. Caveats
II. Running Experiments A. Participants
B. Controlling the environment
C. Recording data
III. Experiment Analysis A. Means and variance
B. Statistical tests
C. ANOVA
D. Explained variance
IV. Summary

UM-07 tutorial 3: Chin 426 June 2007
Agenda
I. Experiment Design A. Independent vs. dependent variables
B. Nuisance variables
C. Between-subjects vs. within-subjects designs
D. Estimating sensitivity
E. Factorial designs
F. Caveats
II. Running Experiments A. Participants
B. Controlling the environment
C. Recording data
III. Experiment Analysis A. Means and variance
B. Statistical tests
C. ANOVA
D. Explained variance
IV. Summary
UM-07 tutorial 3: Chin 526 June 2007
Independent Variables
• Conditions varied by experimenter
Absence or presence of a user model
User model A vs. user model B (vs. UM C)
Different levels of user modeling
Different UM parameter settings
Different user interfaces

UM-07 tutorial 3: Chin 626 June 2007
Dependent Variables
• Response variables or recorded measures: Frequency certain behaviors occur Qualities of a behavior in a particular situation Number of errors Time to complete tasks Quality of task results Interaction patterns Subjective evaluations

UM-07 tutorial 3: Chin 726 June 2007
Covariant Variables
• Concomitant variables (covariates)
Not under experimental control
Age, gender, socioeconomic status, education, learning
styles, previous experience, prior knowledge, aptitudes
Statistics: Analysis of covariance (ANCOVA)
UM-07 tutorial 3: Chin 826 June 2007
Cognitive Tests
• Kit of Factor-Referenced Cognitive Tests
Visualization, visual memory, memory span, perceptual speed, etc.
Ekstrom & French, Educational Testing Service
• Human Information Processing Survey
Left/right brain, integrated or mixed
Taggart & Torrance, Scholastic Testing Service

UM-07 tutorial 3: Chin 926 June 2007
More Cognitive Tests
• Group Embedded Figures Test Field independence
Witkin, Oltman, Raskin & Karp, mind garden
• Nelson-Denny Reading Test Reading ability
Riverside Publishing

UM-07 tutorial 3: Chin 1026 June 2007
Personality Tests
• Meyers-Briggs Type Indicator (MBTI) Extraversion/Introversion
Sensing/Intuition
Thinking/Feeling
Judgment/Perception
CAPT
Must be trained to give MBTI

UM-07 tutorial 3: Chin 1126 June 2007
More Personality Tests
• Locus of Control
Attribution theory
Rotter, Queendom
UM-07 tutorial 3: Chin 1226 June 2007
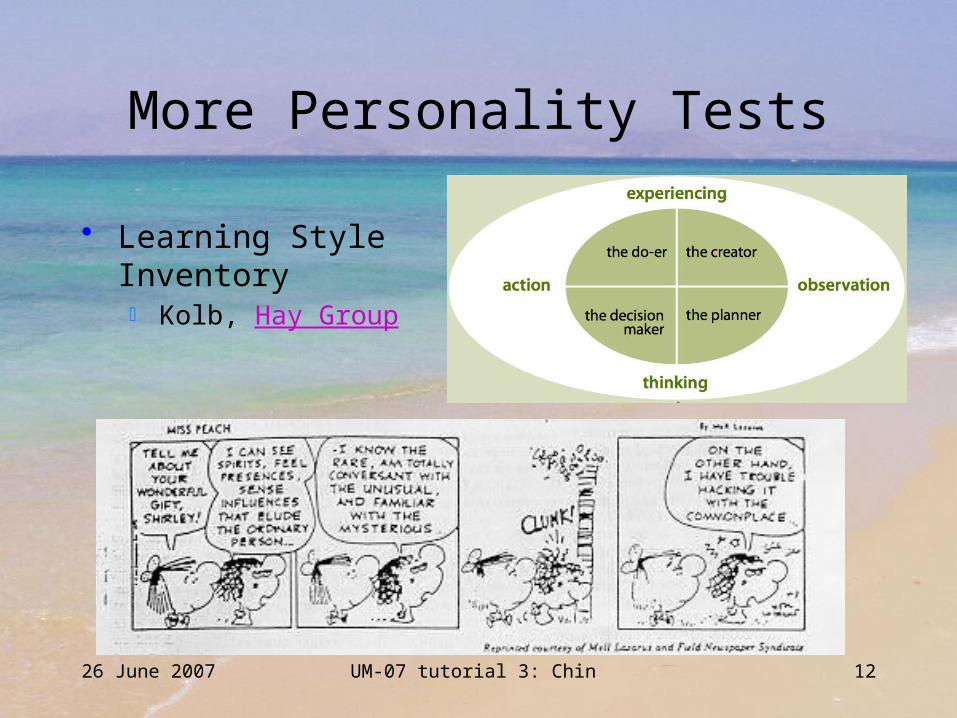
More Personality Tests
• Learning Style Inventory Kolb, Hay Group
UM-07 tutorial 3: Chin 1326 June 2007
Agenda
I. Experiment Design A. Independent vs. dependent variables
B. Nuisance variables
C. Between-subjects vs. within-subjects designs
D. Estimating sensitivity
E. Factorial designs
F. Caveats
II. Running Experiments A. Participants
B. Controlling the environment
C. Recording data
III. Experiment Analysis A. Means and variance
B. Statistical tests
C. ANOVA
D. Explained variance
IV. Summary
UM-07 tutorial 3: Chin 1426 June 2007
Nuisance Variables
• Make your data impossible to analyze
contribute unevenly to dependent variable values
• Major types of nuisance variables
Individual differences among participants
Environmental influences
UM-07 tutorial 3: Chin 1526 June 2007
Individual Differences
• People differ Intelligence, reading ability, perception (e.g., color
blind, poor eyesight, poor hearing), spatial reasoning Variability adds noise to measured variables
• Group experiments: Interpersonal interactions can bias results Leaders vs. followers Personality clashes Communication skills vary

UM-07 tutorial 3: Chin 1626 June 2007
Environmental Influences
• People are more tired certain times of the day certain days of the week
• Time sensitive influences Construction jackhammers in afternoon only Network slows at start of lab class
• Others (experimenter) bias the participants Words, tone, body language
UM-07 tutorial 3: Chin 1726 June 2007
Control of Nuisance Variables
• Randomization “Average out” nuisance vars over many participants
• Blind: participant does not know if system has UM So not influenced by which is “supposed to be better”
• Double-blind: experimenter does not know So cannot inadvertently influence participant
Standard practice for drug trials
UM-07 tutorial 3: Chin 1826 June 2007
Caveats
• Non-random scheduling
Friendly, beautiful assistant runs no UM cases; rude,
dirty assistant with bad body-odor runs UM cases
UM requiring Internet run with UM cases in the
morning with high-load, no UM cases in afternoon
UM-07 tutorial 3: Chin 1926 June 2007
More Caveats
• In medical tests: Placebos can lead to significant improvements
(belief that UM/advanced tech. is being used) So nicer computers, neater desks bias
• In audio tests: Imperceptibly louder (.1 dB) better sounding Experimenter body language biased participants,
even when experimenters were trying NOT to

UM-07 tutorial 3: Chin 2026 June 2007
Experiment Rules
• Randomly assign enough participants to groups
• Randomly assign time slots to participants
• No distractions in test area (windows, noise)
• Experimenters should be blind
• Brainstorm about possible nuisance variables

UM-07 tutorial 3: Chin 2126 June 2007
Agenda
I. Experiment Design A. Independent vs. dependent variables
B. Nuisance variables
C. Between-subjects vs. within-subjects designs
D. Estimating sensitivity
E. Factorial designs
F. Caveats
II. Running Experiments A. Participants
B. Controlling the environment
C. Recording data
III. Experiment Analysis A. Means and variance
B. Statistical tests
C. ANOVA
D. Explained variance
IV. Summary
UM-07 tutorial 3: Chin 2226 June 2007
Between Subjects Designs
• Different participants in experimental conditions
• Randomly assigned participants
• No learning effect
• More participants needed
• Individual differences can swamp measurements

UM-07 tutorial 3: Chin 2326 June 2007
Within Subjects Designs
• Participants exposed to several conditions
• Transfer of learning effects Controlled by varying condition order
• Controls for variation among participants
• Fewer participants needed
• Effective for tasks that involve learning
or changes over time

UM-07 tutorial 3: Chin 2426 June 2007
Agenda
I. Experiment Design A. Independent vs. dependent variables
B. Nuisance variables
C. Between-subjects vs. within-subjects designs
D. Estimating sensitivity
E. Factorial designs
F. Caveats
II. Running Experiments A. Participants
B. Controlling the environment
C. Recording data
III. Experiment Analysis A. Means and variance
B. Statistical tests
C. ANOVA
D. Explained variance
IV. Summary
UM-07 tutorial 3: Chin 2526 June 2007
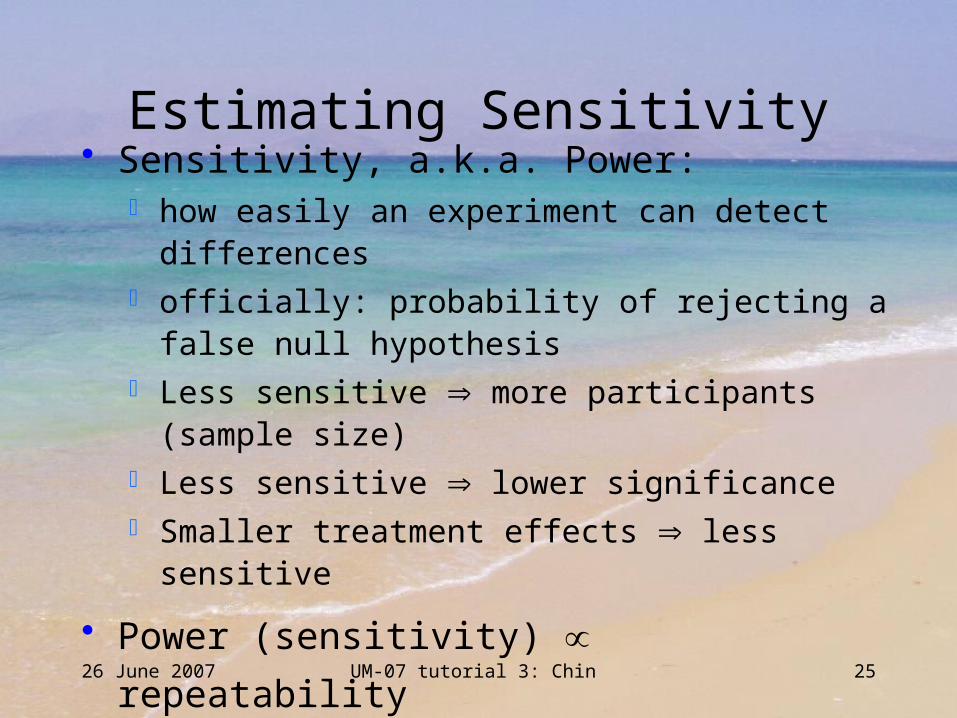
Estimating Sensitivity
• Sensitivity, a.k.a. Power: how easily an experiment can detect differences officially: probability of rejecting a false null hypothesis Less sensitive more participants (sample size) Less sensitive lower significance Smaller treatment effects less sensitive
• Power (sensitivity) repeatability

UM-07 tutorial 3: Chin 2626 June 2007
Power Measure
Fraction of experiments for the given design, sample size and treatment effect would produce the given significance
• Power 0.5 1/2 experiments give non-significant results
• Journal of Abnormal and Social Psychology averages 0.5
• Should use power ≥ 0.8
(80% of repeat experiments give significant results)
UM-07 tutorial 3: Chin 2726 June 2007
Why Power ≥ 0.8?
• High likelihood to successfully repeat experiment
• If there is an effect, better chance of finding it

UM-07 tutorial 3: Chin 2826 June 2007
Power Calculation
• Use pilot study to estimate effect size
• Best to use programs to calculate power:
G .G. Gatti & M. Harwell (1998), “Advantages of Computer Progr
ams Over Power Charts for the Estimation of Power” In
Journal of Statistics Education 6(3).
UCSF’s list of Power and Sample Size Programs
Statpages.org’s list

UM-07 tutorial 3: Chin 2926 June 2007
Effect Size 2
Fraction of variance due to experimental treatment (UM)
• Aka treatment magnitude (2)• 2 = A
2 / (A 2 + S/A
2), where A
2 is the variance due to user modeling
S/A 2 is the random variance among participants
• Typical 2 for social science effects: .01 small, .06 medium, ≥ .15 large

UM-07 tutorial 3: Chin 3026 June 2007
Power Tradeoffs
• For better power: more participants or lower significance
Power 0.05 0.01 0.05 0.01 0.05 0.010.7 219 323 36 53 14 200.8 271 384 44 62 17 240.9 354 478 57 77 22 29
.15 (large)Significance LevelSignificance LevelSignificance Level
.01 (small) .06 (medium)Effect Size ( 2)

UM-07 tutorial 3: Chin 3126 June 2007
Agenda
I. Experiment Design A. Independent vs. dependent variables
B. Nuisance variables
C. Between-subjects vs. within-subjects designs
D. Estimating sensitivity
E. Factorial designs
F. Caveats
II. Running Experiments A. Participants
B. Controlling the environment
C. Recording data
III. Experiment Analysis A. Means and variance
B. Statistical tests
C. ANOVA
D. Explained variance
IV. Summary

UM-07 tutorial 3: Chin 3226 June 2007
Factorial Designs
• Treatments combine levels of 2 or more factors
E.g., different interfaces, different UM parameters,
different tasks, amount of UM feedback, etc.

UM-07 tutorial 3: Chin 3326 June 2007
Why Factorial Designs?
• Advantages Simultaneously study effects of all factors
Gives information about interaction among factors
• Disadvantages Number of combinations large:
2n conditions for n factors of 2 levels each
Conducting experiments very detailed
UM-07 tutorial 3: Chin 3426 June 2007
Randomized Block Designs
• Homogeneous groups are called blocks
• Treatments are assigned randomly to blocks
• Reduces variability
• Common factorial designs: Nested block design
Latin square design

UM-07 tutorial 3: Chin 3526 June 2007
Nested Block Design
• A block is broken up into sub-blocks Based on a 2nd treatment or covariate variable
• Sub-blocks do not have every case of the 2nd var So fewer participants are needed
versus a fully cross-randomized block design
• More participants needed with more nesting levels Exponentially more
UM-07 tutorial 3: Chin 3626 June 2007
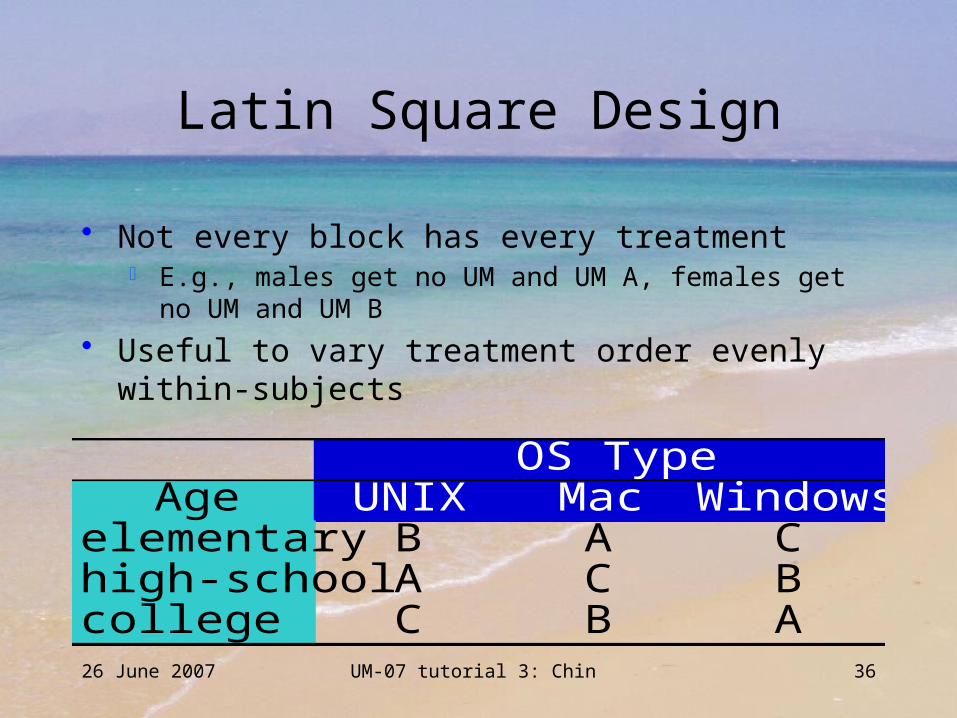
Latin Square Design
• Not every block has every treatment E.g., males get no UM and UM A, females get no UM and UM B
• Useful to vary treatment order evenly within-subjects
Age UNIX Mac Windowselementary B A Chigh-school A C Bcollege C B A
OS Type

UM-07 tutorial 3: Chin 3726 June 2007
Agenda
I. Experiment Design A. Independent vs. dependent variables
B. Nuisance variables
C. Between-subjects vs. within-subjects designs
D. Estimating sensitivity
E. Factorial designs
F. Caveats
II. Running Experiments A. Participants
B. Controlling the environment
C. Recording data
III. Experiment Analysis A. Means and variance
B. Statistical tests
C. ANOVA
D. Explained variance
IV. Summary

UM-07 tutorial 3: Chin 3826 June 2007
Caveats
• Failure to include a control group when needed
Missing no UM control group
• Experimental procedure itself generates a variable
Thinking aloud modifies problem solving strategy
UM-07 tutorial 3: Chin 3926 June 2007
More Caveats
• Contamination of data
Incorrect recording/transcription
• Unwarranted assumptions about scales
E.g., eye blink rates are not linearly related
• Confounding nuisance vars with relevant vars
LAN busy at start of hour during UM treatment
UM-07 tutorial 3: Chin 4026 June 2007
More Caveats 2
• Failure to take into account transfer of training
Participants who have used a similar system do better
• Insufficient observations for needed precision
• Tendency to favor one outcome over another
UM-07 tutorial 3: Chin 4126 June 2007
More Caveats 3
• Observer or experimenter bias
• Not recognizing the rarity of an event
Gambling wins expectations of winning > actual odds
• Experimental procedure affects observed conditions
Knowledge of video camera affects behavior
UM-07 tutorial 3: Chin 4226 June 2007
Internal Validity
• Did the independent variables make a difference?
• Can you infer a cause and effect relationship?
• Did you control: Extraneous variables?
Selection procedures?
Measurement procedures?
• Results hard to interpret without internal validity

UM-07 tutorial 3: Chin 4326 June 2007
Threats to Internal Validity
• History Some other event affects the dependent variable Time between pretest and posttest The longer the time, the great the chance of history
• Maturation Biological or psychological processes over time Independent of external events
UM-07 tutorial 3: Chin 4426 June 2007
More Threats to Internal Validity
• Testing Tendency to score higher on similar subsequent tests
• Instrumentation Any change in observation (machines or judges)
• Statistical regression Extreme score means tends to drift back to the middle
UM-07 tutorial 3: Chin 4526 June 2007
Other Internal Validity Threats
• Mortality Loss of subjects between a pretest and a posttest Drop-outs may differ from those who remain Mean scores between the tests could differ
• Selection Participants seek/do not seek exposure to the treatment Likely differ in motivational levels, so don’t compare

UM-07 tutorial 3: Chin 4626 June 2007
External Validity
• Can results be generalized?
• How representative are the results to:
Other populations?
Other variables?
Other situations?

UM-07 tutorial 3: Chin 4726 June 2007
Threats to External Validity
• Population
Experimentally accessible pop. differs from target pop.
Treatment effects interact w. participant characteristics
• Ecological
Incorrectly describing independent variable(s)
Incorrectly describing or measuring dependent
variable(s)

UM-07 tutorial 3: Chin 4826 June 2007
More Ecological Validity Threats
• Multiple-treatment interference
• Interaction of history and treatment effects
• Interaction of time of measurement and treatment
• Pretest and posttest sensitization
• Hawthorne effect (expectation improvement)
• Novelty and disruption effect
• Experimenter influence (Rosenthal/Pygmalion, Golem effects)

UM-07 tutorial 3: Chin 4926 June 2007
Agenda
I. Experiment Design A. Independent vs. dependent variables
B. Nuisance variables
C. Between-subjects vs. within-subjects designs
D. Estimating sensitivity
E. Factorial designs
F. Caveats
II. Running Experiments A. Participants
B. Controlling the environment
C. Recording data
III. Experiment Analysis A. Means and variance
B. Statistical tests
C. ANOVA
D. Explained variance
IV. Summary

UM-07 tutorial 3: Chin 5026 June 2007
Participants
• Participants must represent target population• Participant sources
University laboratory schools Introductory psychology participant pools Public schools Newspaper advertisements Corporations Internet sites
UM-07 tutorial 3: Chin 5126 June 2007
Participant Incentives
• Payment
• Gifts
• Class credit
• Desire to help state-of-the-art research

UM-07 tutorial 3: Chin 5226 June 2007
Consent Agreement
• Participants should sign a consent form: I have freely volunteered to participate I have been informed about the tasks and the procedures I have had a chance to ask questions about my concerns I know that at any time I may discontinue participation
in this experiment without prejudice My signature below may be taken as an affirmation of
all of the above, prior to participation

UM-07 tutorial 3: Chin 5326 June 2007
USA Federal Mandates
• Local institutional review board (IRB)
Required for all US institutions receiving federal funds
Approves all proposed human-subject studies beforehand
Poor IRB oversight has led to Federal funding cutoffs
UM-07 tutorial 3: Chin 5426 June 2007
Agenda
I. Experiment Design A. Independent vs. dependent variables
B. Nuisance variables
C. Between-subjects vs. within-subjects designs
D. Estimating sensitivity
E. Factorial designs
F. Caveats
II. Running Experiments A. Participants
B. Controlling the environment
C. Recording data
III. Experiment Analysis A. Means and variance
B. Statistical tests
C. ANOVA
D. Explained variance
IV. Summary
UM-07 tutorial 3: Chin 5526 June 2007
Controlling the Environment
• Needed to control nuisance variables
• Factors include:
Room selection & preparation
Uniform instructions
Experimenter behavior
UM-07 tutorial 3: Chin 5626 June 2007
Room Selection & Preparation
• Select room to minimize distractions: Audio: noise
Visual: no windows, posters, etc.
Isolate participants as much as possible
• Prepare computer area ergonomically Anticipate different size participants
If network is used, avoid high load times

UM-07 tutorial 3: Chin 5726 June 2007
Uniform Instructions
• Written/taped instructions are more consistent
• Check instructions for clarity
• Debug instructions with pilot study
• Computer playback of instructions is very helpful
• Each experimenter runs equal #s of each treatment

UM-07 tutorial 3: Chin 5826 June 2007
Experimenter Behavior
• Strive for uniformity Plan to minimize interactions with participants All experimenters should be consistent in approach Experimenters must be able to answer questions
• Interaction during experiment is bad Strive to answer all questions beforehand Pilot studies help catch unanticipated questions Be prepared to discard participant data if necessary
UM-07 tutorial 3: Chin 5926 June 2007
Agenda
I. Experiment Design A. Independent vs. dependent variables
B. Nuisance variables
C. Between-subjects vs. within-subjects designs
D. Estimating sensitivity
E. Factorial designs
F. Caveats
II. Running Experiments A. Participants
B. Controlling the environment
C. Recording data
III. Experiment Analysis A. Means and variance
B. Statistical tests
C. ANOVA
D. Explained variance
IV. Summary

UM-07 tutorial 3: Chin 6026 June 2007
Recording Data
• Qualitative data
• Quantitative data
UM-07 tutorial 3: Chin 6126 June 2007
Qualitative Data
• Ethnographic field studies
Content analysis
• Case Studies
• Self reports
• Interviews

UM-07 tutorial 3: Chin 6226 June 2007
Qualitative Sources
• R.K. Yin (1988) Case Study Research: Design and Methods• M.B. Miles & A.H. Huberman (1994) Qualitative Data
Analysis: A Sourcebook of New Methods• M. Meyers (ed.) Qualitative Research in Information
Systems• C. Marshall & G. Rossman (1989) Designing Qualitative
Research • D. Silverman (1993) Interpreting Qualitative Data• R.P. Weber (1990) Basic Content Analysis, 2nd edition• Qualitative Research in Information Systems journal and
web links, www.qual.auckland.ac.nz

UM-07 tutorial 3: Chin 6326 June 2007
Sequential Data
• Think aloud tasks• Video or audio taped records• Recorded computer interactions
Record & replay GUI events(keystrokes, mouse movements, buttons, menus, etc.)
• Retroactive interview with playback records• Eye movement monitors

UM-07 tutorial 3: Chin 6426 June 2007
Agenda
I. Experiment Design A. Independent vs. dependent variables
B. Nuisance variables
C. Between-subjects vs. within-subjects designs
D. Estimating sensitivity
E. Factorial designs
F. Caveats
II. Running Experiments A. Participants
B. Controlling the environment
C. Recording data
III. Experiment Analysis A. Means and variance
B. Statistical tests
C. ANOVA
D. Explained variance
IV. Summary
UM-07 tutorial 3: Chin 6526 June 2007
Experiment Analysis
• The simplest experiment has:
One independent variable w. 2 values (with/without UM)
Same # of participants in each group (with/without UM)
One dependent variable (e.g., task quality)
Analyze more dependent variables as if new experiment
UM-07 tutorial 3: Chin 6626 June 2007
Sample Dependent Variables
• Subjective evaluation of the system Likert scale of 1 to 7 reduces biases of 1-5/1-10 scales
• Task speed• Task quality (e.g., accuracy)• Pupil dilation
Shown to be correlated with cognitive load
UM-07 tutorial 3: Chin 6726 June 2007
Mean and Variance
• Mean = average of dependent variable values
• Variance = average difference of values from mean
• There are two types of variance:
Between groups (due to the UM)
Within groups (due to “random” fluctuations)
UM-07 tutorial 3: Chin 6826 June 2007
Null Hypothesis
• Conjecture that the independent variable (e.g. UM/no UM) makes no difference in the dependent variable(s) values
• Rejecting the null hypothesis depends on computing the likelihood that the difference in the means of the groups is not due to natural variations

UM-07 tutorial 3: Chin 6926 June 2007
Why Analysis?
• If the means of UM differs from no UM
So UM has a positive or negative effect
• Might this be caused by random fluctuations?
E.g., by chance more optimists were randomly assigned
to the UM group, leading to higher subjective
evaluations for the UM case

UM-07 tutorial 3: Chin 7026 June 2007
Agenda
I. Experiment Design A. Independent vs. dependent variables
B. Nuisance variables
C. Between-subjects vs. within-subjects designs
D. Estimating sensitivity
E. Factorial designs
F. Caveats
II. Running Experiments A. Participants
B. Controlling the environment
C. Recording data
III. Experiment Analysis A. Means and variance
B. Statistical tests
C. ANOVA
D. Explained variance
IV. Summary
UM-07 tutorial 3: Chin 7126 June 2007
Statistical Tests
• Non-parametric tests
Fewer assumptions about data
But less powerful
• Parametric tests
Preferred for data with normal (Gaussian) distribution
• Statpages.org’s Choose the right test! list

UM-07 tutorial 3: Chin 7226 June 2007
Non-parametric Tests
• Assumptions:
Independent observations
Distribution free
Suitable for ordinal / ranked data

UM-07 tutorial 3: Chin 7326 June 2007
Common Non-Parametric Tests
• Chi-square Compares how each measure differs from expected Goodness of fit and independence of random variables
• Median or Sign Test Compares medians of two independent values
• Mann-Whitney U Test Tests if 2 samples come from the same distribution
• Kruskal-Wallis 1-way ANOVA of Ranks • Friedman 2-way ANOVA of Ranks

UM-07 tutorial 3: Chin 7426 June 2007
Parametric Tests of Significance
• Assumptions:
Independent observations
Observations from normal distribution
Homogeneity of variance in populations
Variables measured on equal unit interval scale
Null hypothesis tests for equal means or variances
between independent samples

UM-07 tutorial 3: Chin 7526 June 2007
Common One/Two Sample Tests
• Difference from the mean (Z-test)
• Difference between 2 sample means (T-test)
• Variability differences in 2 samples (F-test)
• Analysis of Variance (ANOVA)
• Multivariate Analysis of Variance (MANOVA)
• Analysis of Covariance (ANCOVA)

UM-07 tutorial 3: Chin 7626 June 2007
Directional vs. Non-directional
• Directional (one-tail)
Hypothesis predicts direction of estimates
Easier to achieve significance
• Non-directional (two-tail)
No basis for deciding direction of the difference
GraphPad.com has a good faq on this

UM-07 tutorial 3: Chin 7726 June 2007
Agenda
I. Experiment Design A. Independent vs. dependent variables
B. Nuisance variables
C. Between-subjects vs. within-subjects designs
D. Estimating sensitivity
E. Factorial designs
F. Caveats
II. Running Experiments A. Participants
B. Controlling the environment
C. Recording data
III. Experiment Analysis A. Means and variance
B. Statistical tests
C. ANOVA
D. Explained variance
IV. Summary
UM-07 tutorial 3: Chin 7826 June 2007
ANOVA Assumptions
• Linear model
• Independence of scores
• Normal distribution
• Heterogeneity of variance
UM-07 tutorial 3: Chin 7926 June 2007
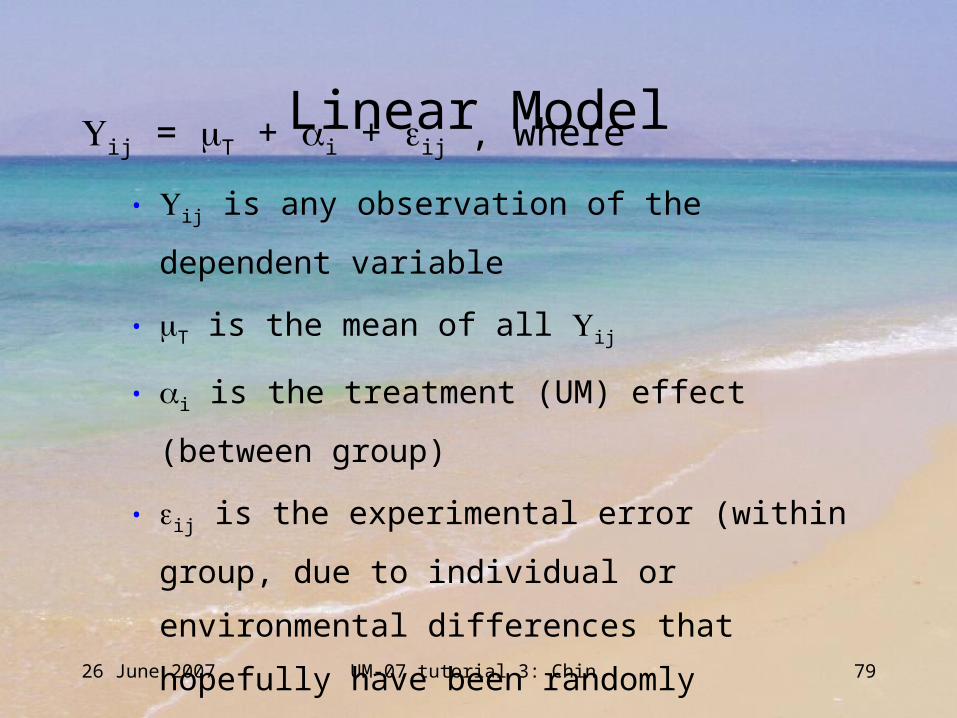
Linear Model
ij = T + i + ij , where
• ij is any observation of the dependent variable
• T is the mean of all ij
• i is the treatment (UM) effect (between group)
• ij is the experimental error (within group, due to
individual or environmental differences that hopefully
have been randomly distributed among the ij)

UM-07 tutorial 3: Chin 8026 June 2007
Independence of Scores
• The scores (ij) are independent both within and
between treatment groups (UM and no UM), i.e.,
each observation is not related in any way to any
other observation participants are randomly assigned to UM/no UM
participants are tested individually
participants do not discuss system with others
(e.g., students in a class will talk, creating bias)

UM-07 tutorial 3: Chin 8126 June 2007
Normal Distribution
• Participant population is normally distributed
Verify by plotting ij scores
Look for bell-shaped normal curve
(x-axis = scores, y-axis = count of each score)
Symmetrical shapes with ≥ 12 participants are fine
Asymmetrical shapes require higher significance levels

UM-07 tutorial 3: Chin 8226 June 2007
Normal Curve Example
• One of a family of Normal curves

UM-07 tutorial 3: Chin 8326 June 2007
Homogeneity of Variance
• Suppose UM helps some but confuses others
If these occur equally frequently,
then the mean is unchanged for UM vs. no UM
But the variance of ij would be much higher for UM
• Heterogeneity of variance invalidates analysis
UM-07 tutorial 3: Chin 8426 June 2007
Variants of ANOVA
• Multivariate Analysis of Variance (MANOVA)
For multiple dependent variables and their interactions
• Kruskal-Wallis (one-way ANOVA) by ranks
Uses rank order rather than actual values
E.g., web search results by list order vs. similarity scores
UM-07 tutorial 3: Chin 8526 June 2007
Analysis of Covariance
• ANCOVA combines Analysis of variance (ANOVA)
Regression analysis
• Allows reduction of error term ij
Improves effect size relative to error (A2 vs. S/A
2 )
Improves power
• Corrects ij using covariant variable(s)

UM-07 tutorial 3: Chin 8626 June 2007
ANCOVA Example
• UM system that hides less relevant hyperlinks
Independent variable: UM or no UM
Dependent variable: speed to find information
Covariant variable: participant reading speed
• ANCOVA corrects search times for reading speed,
eliminating the variance due to reading speeds

UM-07 tutorial 3: Chin 8726 June 2007
ANCOVA Assumptions
• All ANOVA assumptions
• Linear regression Dependent scores vary linearly with covariant variable
Equal population regression slopes for all groups
Unequal ANCOVA cannot be used
e.g., for whatever reason, the UM group did not
improve search times as much for faster readers as the
no UM group
UM-07 tutorial 3: Chin 8826 June 2007
ANCOVA Rules
• Gather covariate(s) before the experiment Avoids UM/no UM affecting covariate
After is possible for “permanent” characteristics like IQ
• Test linearity and equal slope assumptions By computer program and visually
• Different formulas for effect size and power Use correct setup of computer programs
UM-07 tutorial 3: Chin 8926 June 2007
Agenda
I. Experiment Design A. Independent vs. dependent variables
B. Nuisance variables
C. Between-subjects vs. within-subjects designs
D. Estimating sensitivity
E. Factorial designs
F. Caveats
II. Running Experiments A. Participants
B. Controlling the environment
C. Recording data
III. Experiment Analysis A. Means and variance
B. Statistical tests
C. ANOVA
D. Explained variance
IV. Summary

UM-07 tutorial 3: Chin 9026 June 2007
Explained Variance
• Two possible analysis results: significant or not• Significant results
Likelihood(difference in means is due to random fluctuations) < selected significance level (typically .05)
• Calculate and report: post-hoc probability effect size power

UM-07 tutorial 3: Chin 9126 June 2007
Non-Significant Results
• If calc. power is low, maybe need more participants
Use effect size to determine # of participants needed
If # too large, consider relaxing significance level to 0.1
Very difficult to prove effect does not exist
(requires very many participants)
UM-07 tutorial 3: Chin 9226 June 2007
Interpreting Significant Results
• Statistically significant ≠ important differences
• Treatment effect may be increased variability
• Which 0.05 significance test is more impressive: A
with 5 participants or B with 20?
A, because if A were increased to 20 participants,
it would likely have better significance than B
UM-07 tutorial 3: Chin 9326 June 2007
Agenda
I. Experiment Design A. Independent vs. dependent variables
B. Nuisance variables
C. Between-subjects vs. within-subjects designs
D. Estimating sensitivity
E. Factorial designs
F. Caveats
II. Running Experiments A. Participants
B. Controlling the environment
C. Recording data
III. Experiment Analysis A. Means and variance
B. Statistical tests
C. ANOVA
D. Explained variance
IV. Summary

UM-07 tutorial 3: Chin 9426 June 2007
Summary
• Experiments require careful planning
Pilot studies prevent poorly designed main studies
• Experiments take a long time
Typically months
• Experiments are the only way

UM-07 tutorial 3: Chin 9526 June 2007
Where to Get More Information
• Books
• Web Sites
• People from your Psych. or Statistics depts. or
human-factors group
• Software

UM-07 tutorial 3: Chin 9626 June 2007
Books
• G. Keppel (1991) Design and Analysis: A Researcher's Handbook (3rd ed.), Englewood Cliffs, NJ: Prentice-Hall.
• J. Stevens (1992) Applied Multivariate Statistics for the Social Sciences (2nd ed.), Hillsdale, NJ: Lawrence Erlbaum.
• J. Neter, W. Wasserman, M.H. Kutner (1985) Applied Linear Statistical Models (2nd ed.) Homewood, IL: Richard D. Irvin.
• D. Campbell, J. Stanley (1963) Experimental and Quasi-Experimental Designs for Research in Handbook of Research on Teaching N. L. Gage editor, Rand McNally & Co.
• S. Huck, W. Cormier, W. Bounds(1974) Reading Statistics and Research, New York, Harper & Row.
UM-07 tutorial 3: Chin 9726 June 2007
Web Sites
• Interactive Statistical Calculation Pages
• The World Wide Web Virtual Library: Statistics
• Electronic Textbook StatSoft
• OATIES (Online Analysis Tools in Excel Spreadsheets)
• Ball Aptitude Battery
UM-07 tutorial 3: Chin 9826 June 2007
After Your Experiment
Publish in:
• User Modeling and User-Adapted Interaction
• Next UMAP Conference
• SIGCHI (ACM) Bulletin or Conference

9916 July 2012 UMAP 2012 tutorial 2: Chin
Acknowledgements
• Sponsored by: UMAP 2012, the 20th
Conference on User Modeling, Adaptation, and Personalization, Montreal, Canada
User Modeling, Inc. University of Hawaii
UM-07 tutorial 3: Chin 10026 June 2007
Your Copy
www2.hawaii.edu/~chin/UMAP2012/tutorial.pptx
www2.hawaii.edu/~chin/UMAP2012/tutorial-notes.pdf