Embed Size (px)
Citation preview

2-331
2.5.4 Stability of Subsurface Materials and Foundations
SSAR Section 2.5.4 presents the applicant’s evaluation of the stability of subsurface materialsthat underlie the VEGP ESP site. There are a total of 12 subsections within SSARSection 2.5.4. Among them, Section 2.5.4.1 does not contain any specific details, but refers toSSAR Sections 2.5.1.1 and 2.5.1.2 regarding regional (within a 320-kilometer (km) (200-mile(mi)) radius) and site area (within an 8-km (5-mi) radius) geology and tectonics for the ESP site. Section 2.5.4.9 cross-references SSAR Sections 2.5.2.6, 2.5.2.7, and 2.5.2.8 for determinationof the SSE and operating-basis earthquake (OBE). Section 2.5.4.2 describes the engineeringproperties of the subsurface materials. Section 2.5.4.3 describes subsurface explorationsperformed at the ESP site, and Section 2.5.4.4 describes geophysical surveys performed by theapplicant to determine shear and compressional wave velocities of the soil and rocks beneaththe ESP site. Section 2.5.4.5 describes excavation and backfill work for the ESP site. Section 2.5.4.6 describes local ground water conditions. Section 2.5.4.7 describes site-specificshear wave velocity profile, shear modulus, and damping. Section 2.5.4.8 describes theapplicant’s evaluation of liquefaction potential, and Section 2.5.4.10 describes the bearingcapacity and settlement analysis for the ESP site. Section 2.5.4.11 describes limitations indesign values, such as settlements and factors of safety, and Section 2.5.4.12 describes brieflythe methods to be used to improve the subsurface conditions at the ESP site.
This section describes the applicant’s geotechnical investigation at the ESP site. In summary,the applicant conducted 14 exploratory borings, performed 10 CPTs, including 3 down-holeseismic CPTs, and suspension P-S velocity logging in 5 boreholes. The applicant alsoperformed laboratory testing on grain size (61 tests), unit weight (31), natural moisture content(75), and Atterberg limits (27), and conducted 15 unconsolidated undrained triaxial tests. Theapplicant installed 15 ground water observation wells.
The applicant described the main load-bearing layers and their geotechnical properties at theESP site. From top to bottom, they are the Upper Sand Stratum (Barnwell Group), Blue BluffMarl (Lisbon Formation), and Lower Sand Stratum (Still Branch Formation), overlying theDunbarton Triassic basin rock/Paleozoic rock.
• the Upper Sand Stratum is predominately sands, silty sands with occasional clayeyseams.
• the Blue Bluff Marl is slightly sandy, cemented calcareous clay.
• the Lower Sand Stratum comprises fine-to-course sand with interbedded silty clay andclayey silt.
The applicant stated that it will replace the Upper Sand Stratum with engineering compactedfills. The applicant established the site-specific shear wave velocity profile and soil degradationand damping curves that feed into the site response study to obtain the site-specific GRMS. The applicant also proposed the settlement guidelines and derived key engineering parametersusing the data from previous investigations for the existing VEGP Units 1 and 2. In addition,the applicant concluded that the Blue Bluff Marl is not liquefiable irrespective of ground motionlevel.

2-332
2.5.4.1 Technical Information in the Application
2.5.4.1.1 Description of Site Geologic Features
SSAR Section 2.5.4.1 refers to SSAR Sections 2.5.1.1 and 2.5.1.2 for the description ofgeologic and tectonic features within the ESP site region (320-km (200-mi) radius) and withinthe immediate ESP site area (8-km (5-mi) radius).
2.5.4.1.2 Properties of Subsurface Materials
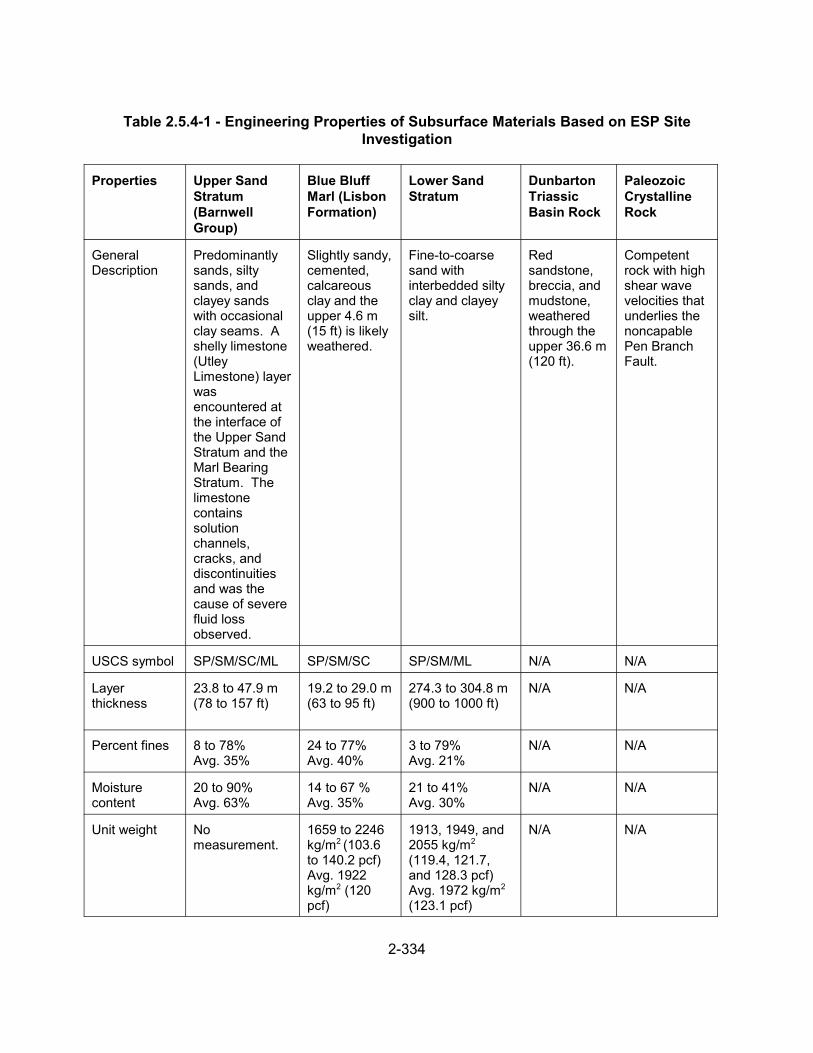
SSAR Sections 2.5.4.2.2 and 2.5.4.2.3 describe in detail the engineering properties of thesubsurface materials at the ESP site. The applicant stated that soils encountered during theESP subsurface investigation constitute alluvial and Coastal Plain deposits, which include theUpper Sand Stratum, Blue Bluff Marl, and Lower Sand Stratum, from top to bottom. Figure 2.5.4-1 of this SER illustrates the relative position and thickness of these subsurfacestrata. Dunbarton Triassic (206 to 24 million years ago (mya)) basin rock and Paleozoic (543 to248 mya) crystalline rock underlie these soil layers at the ESP site.
The applicant performed laboratory testing for the ESP investigation in accordance withRG 1.138, “Laboratory Investigations of Soils for Engineering Analysis and Design of NuclearPower Plants,” Revision 2, issued December 2003. The applicant stated that these ESP testsfocused primarily on verifying basic properties of the Upper Sand Stratum and the Blue BluffMarl, as well as the upper portion of the Lower Sand Stratum. The applicant also performedlaboratory testing on grain size, unit weight, natural moisture content, and Atterberg limits andconducted unconsolidated undrained triaxial tests for the ESP site. The applicant concludedthat the engineering properties obtained from the ESP subsurface investigation and laboratorytesting program were similar to those obtained from the previous field and laboratory testingprograms for VEGP Units 1 and 2. SER Table 2.5.4-1 summarizes the geotechnical features ofthe five major geologic units and their corresponding engineering properties obtained throughthe ESP investigations.
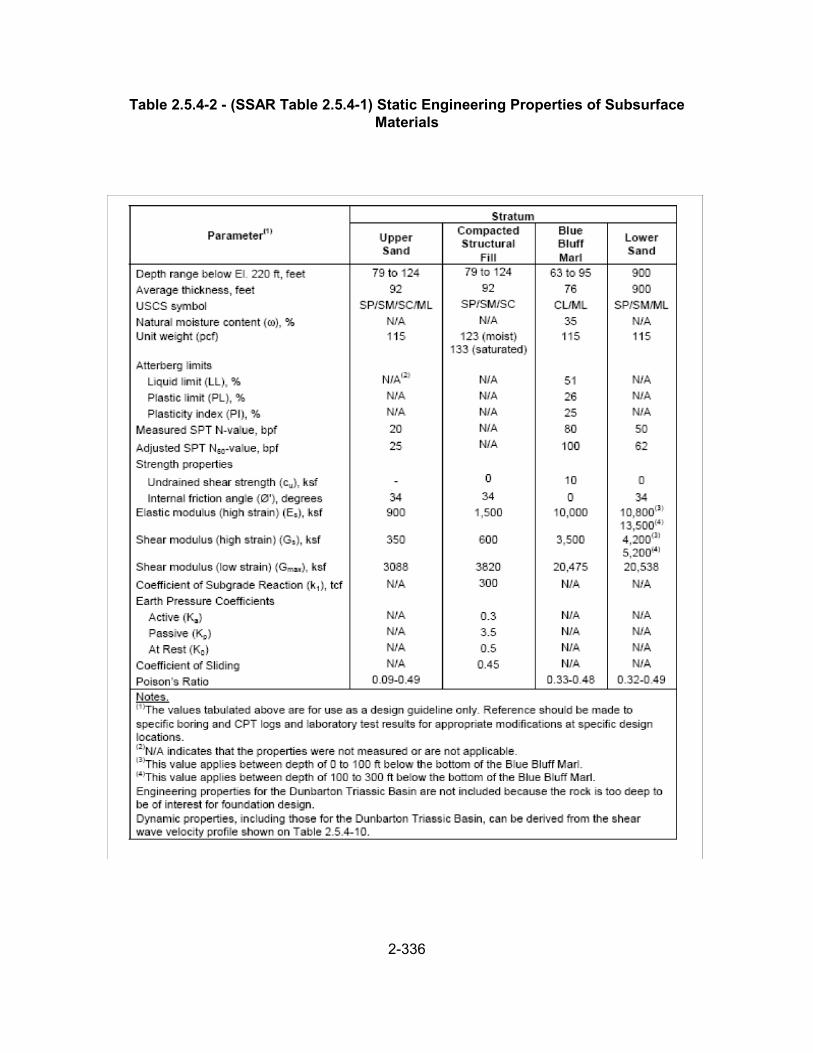
The applicant also listed engineering properties and design values from the previous VEGPUnits 1 and 2 investigation for the Upper Sand Stratum, compacted fills, Blue Bluff Marl, andLower Sand Stratum as summarized in SER Table 2.5.4-2. The applicant stated that theengineering properties obtained from the ESP investigations were similar to those obtainedfrom previous investigations. However, the applicant also stated that it will perform additionalconfirmatory tests during the COL application phase to support, for example, the use of a 478.9kilopascal (kPa) (10,000 pounds per square foot (psf)) design shear strength value because itdiffers significantly from the values obtained during the ESP investigation. The applicantindicated in SSAR Section 2.5.4.2.3 that it referred to previous borings, but did not include themin the SSAR. Finally, the applicant stated that it did not include chemical tests in the ESPlaboratory testing program, but that it would conduct such chemical tests as part of the COLinvestigation because of the backfill materials placed in the proximity of planned concretefoundations and buried metal pipes.

2-333
Figure 2.5.4-1 - Subsurface Profile (Reproduced from SSAR Figure 2.5.4-3, position of the profile shown in Figure 2.5.4-2 from A to A’)
2-334
Table 2.5.4-1 - Engineering Properties of Subsurface Materials Based on ESP SiteInvestigation
Properties Upper SandStratum(BarnwellGroup)
Blue BluffMarl (LisbonFormation)
Lower SandStratum
DunbartonTriassicBasin Rock
PaleozoicCrystallineRock
GeneralDescription
Predominantlysands, siltysands, andclayey sandswith occasionalclay seams. Ashelly limestone(UtleyLimestone) layerwasencountered atthe interface ofthe Upper SandStratum and theMarl BearingStratum. Thelimestonecontainssolutionchannels,cracks, anddiscontinuitiesand was thecause of severefluid lossobserved.
Slightly sandy,cemented,calcareousclay and theupper 4.6 m(15 ft) is likelyweathered.
Fine-to-coarsesand withinterbedded siltyclay and clayeysilt.
Redsandstone,breccia, andmudstone,weatheredthrough theupper 36.6 m(120 ft).
Competentrock with highshear wavevelocities thatunderlies thenoncapablePen BranchFault.
USCS symbol SP/SM/SC/ML SP/SM/SC SP/SM/ML N/A N/A
Layerthickness
23.8 to 47.9 m(78 to 157 ft)
19.2 to 29.0 m(63 to 95 ft)
274.3 to 304.8 m(900 to 1000 ft)
N/A N/A
Percent fines 8 to 78%Avg. 35%
24 to 77%Avg. 40%
3 to 79%Avg. 21%
N/A N/A
Moisturecontent
20 to 90%Avg. 63%
14 to 67 %Avg. 35%
21 to 41%Avg. 30%
N/A N/A
Unit weight Nomeasurement.
1659 to 2246kg/m2 (103.6to 140.2 pcf)Avg. 1922kg/m2 (120pcf)
1913, 1949, and2055 kg/m2
(119.4, 121.7,and 128.3 pcf)Avg. 1972 kg/m2
(123.1 pcf)
N/A N/A

Properties Upper SandStratum(BarnwellGroup)
Blue BluffMarl (LisbonFormation)
Lower SandStratum
DunbartonTriassicBasin Rock
PaleozoicCrystallineRock
2-335
Plastic Index(PI)
21 to 67%Avg. 37%
NP to 58 %Avg. 22%
NP to 19%Avg. 17%
N/A N/A
MeasuredSPT N-Value(medianenergytransferefficiency0.75)
From weight ofrod to 50 blowsfor 0-in.penetration(50/0”)
Avg. 21 bpf
From 26 bpfto 50 blowsfor 1-in.penetration(50/1”)
Avg. 83 bpf
From 9 bpf to 50blows for 4-in.penetration(50/4”)
Avg. 59 bpf
N/A N/A
Shear wavevelocity
173.7 to 1008.9 m/s(570 to 3310fps)
323.1 to1298.4 m/s (1060 to 4260fps)
283.5 to 1423.4m/s(930 to 4670 fps)
707.1 to2849.9 m/s(2320 to9350 fps)
N/A
Compressional wave velocity
396.2 to 2426.2 m/s(1300 to 7960fps)
1414.3 to2996.2 m/s (4640 to 9830fps)
1521.0 to 2752.3m/s(4990 to 9030fps)
2225.0 to5596.1 m/s(7,300 to18,360 fps)
N/A
Possion’sratio(calculated)
0.09 to 0.49 0.33 to 0.48 0.32 to 0.49 0.10 to 0.46 N/A
Strength Properties
Internalfriction angle
34 degree(determinedbased on N-values)
0 41 degree(determinedbased on N-values)
N/A N/A
Undrainedshearstrength
Nomeasurement
7.18 to 205.94kPa (150 to 4300psf)
No measurement N/A N/A
Elasticmodulus
137.9 to 1378.9MPa(0.2 x 10⁵ to 2.0x 10⁵ psi)
1585.8 Mpa(2.3 x 10⁵ psi)
No measurement N/A N/A
Shearmodulus
55.2 to 468.8MPa(0.8 x 10⁴ to 6.8x 10⁴ psi)
551.6 Mpa(8.0 x 10⁴ psi)
No measurement N/A N/A
Note: The parameters listed in this table are based on ESP site investigation and they aredifferent from the design values listed in SSAR Table 2.5.4-1, which are mostly based on datafrom the previous investigation.
2-336
Table 2.5.4-2 - (SSAR Table 2.5.4-1) Static Engineering Properties of SubsurfaceMaterials

2-337
2.5.4.1.3 Site Exploration
In SSAR Section 2.5.4.3, the applicant summarized subsurface investigation programs for boththe existing VEGP Units 1 and 2 and for the ESP site. The applicant stated that the fieldinvestigations for VEGP Units 1 and 2 started in 1971. At the time, the field investigationsincluded a total of 585 borings and 18,288 meters (60,000 ft) of drilling, as well as 8,656 meters(28,400 ft) of shallow refraction lines and 1,524 meters (5,000 ft) of deep refraction lines. Theapplicant deployed various investigation methods, including electric logging, natural gamma,density, neutron, caliper, three-dimensional velocity logs, and cross-hole velocities of thesubsurface (to a depth of 88.4 meters (290 ft)). The applicant emphasized that it used theresults from previous investigations to supplement subsurface data obtained during the ESPinvestigation.
The ESP investigation started in September 2005. The applicant performed the subsurfaceinvestigation over the area that would house the prospective reactors and switchyard, as well asthe cooling towers. The applicant stated that this investigation consisted of exploration pointsthat were selected primarily to confirm the results obtained from previous extensiveinvestigations implemented for VEGP Units 1 and 2. In addition, the applicant stated that it willperform additional structure-specific explorations at the COL phase. The applicant alsoemphasized that it followed the guidelines in RG 1.132, Revision 2, issued October 2003. SERFigure 2.5.4-2 shows the locations of the borings for the ESP subsurface investigation.
In summary, the applicant conducted 14 exploratory borings with depths ranging from27.4 meters (90 ft) to 407.8 meters (1338 ft), but only sampled 12 of them. The applicant alsoperformed 10 CPTs, including 3 down-hole seismic CPTs, and suspension P-S velocity loggingin 5 of the boreholes. In addition, the applicant implemented seismic reflection and refractionsurveys in order to collect data to delineate the Pen Branch fault, discussed in detail in SSARSections 2.5.2.4 and 2.5.3.
Boring and Sampling
The applicant stated that it sampled 13 borings (excluding boring B-1003) using a standardpenetration test (SPT) sampler at continuous intervals to a 4.6-meter (m) (15-foot (ft)) depthand then at 1.5- to 3.0-m (5- or 10-ft) intervals below that depth, and that it operated the SPT inaccordance with American Society for Testing and Materials (ASTM) D 1586 (1999), “StandardTest Method for Penetration Resistance and Split Barrel Sampling of Soil.” The applicantrecovered soil samples in accordance with ASTM D 2488 (2000), “Standard Practice forDescription and Identification of Soils.” The applicant performed a continuous core boring forboring B-1003 with an average core recovery rate of 77 percent.
CPT
The applicant described that it performed CPT testing at the ESP site, in accordance withASTM D 5578 (2000), “Standard Test Method of Performing Electronic Friction Cone andPiezocone Penetration Testing of Soils.” The applicant also stated that it advanced each of theCPTs to refusals at depths ranging from 1.8 to 35.6 meters (6 to 116.7 ft). Most CPT locationsmet refusals at or near the top of the Blue Bluff Marl.

2-338
The applicant performed pore pressure dissipation tests at a depth of 20.7 and 24.1 meters (68ft and 79 ft) in C-1003; 20.0 m (66-ft) depth in C-1004; 17.1 m (56 ft), 22.3 m (73 ft), and 25.0m (82 ft) depths in C-1005; and 18.3 m (60 ft), 23.5 m (77 ft), 27.4 m (90 ft), and 30.2 m (99 ft)depths in C-1009A.

2-339
Figure 2.5.4-2 - ESP Boring Location (Reproduced from SSAR Figure 2.5.4-1)
2-340
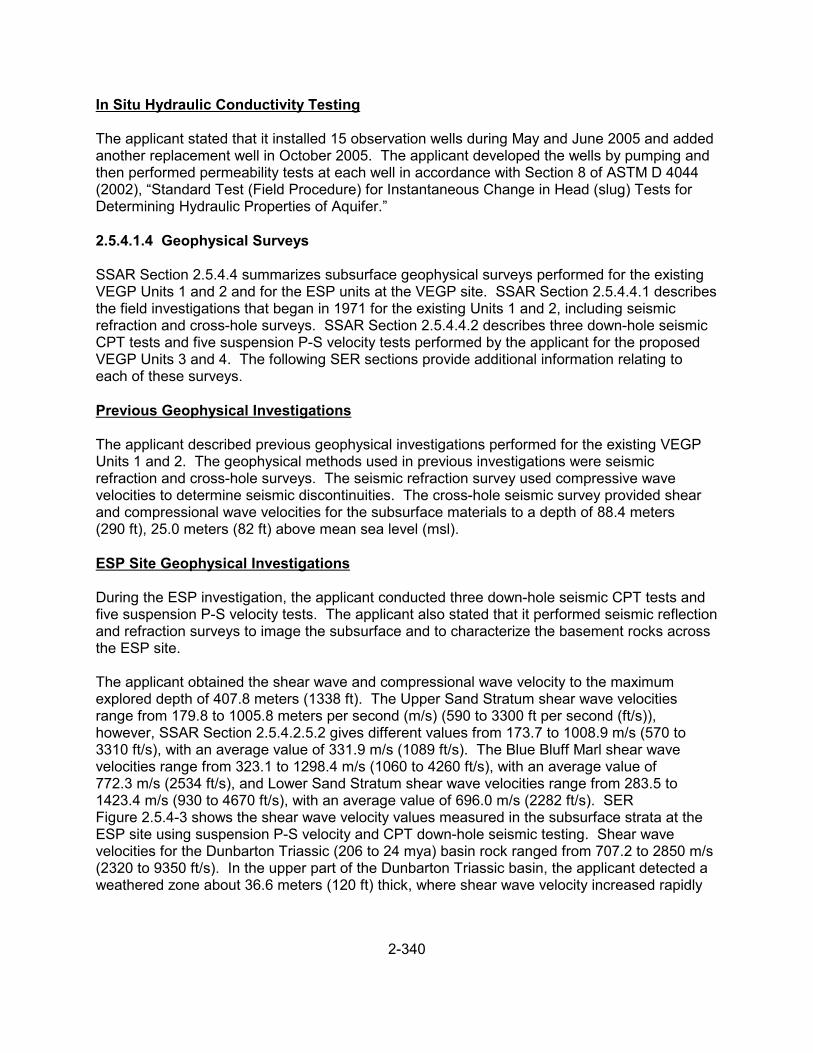
In Situ Hydraulic Conductivity Testing
The applicant stated that it installed 15 observation wells during May and June 2005 and addedanother replacement well in October 2005. The applicant developed the wells by pumping andthen performed permeability tests at each well in accordance with Section 8 of ASTM D 4044(2002), “Standard Test (Field Procedure) for Instantaneous Change in Head (slug) Tests forDetermining Hydraulic Properties of Aquifer.”
2.5.4.1.4 Geophysical Surveys
SSAR Section 2.5.4.4 summarizes subsurface geophysical surveys performed for the existingVEGP Units 1 and 2 and for the ESP units at the VEGP site. SSAR Section 2.5.4.4.1 describesthe field investigations that began in 1971 for the existing Units 1 and 2, including seismicrefraction and cross-hole surveys. SSAR Section 2.5.4.4.2 describes three down-hole seismicCPT tests and five suspension P-S velocity tests performed by the applicant for the proposedVEGP Units 3 and 4. The following SER sections provide additional information relating toeach of these surveys.
Previous Geophysical Investigations
The applicant described previous geophysical investigations performed for the existing VEGPUnits 1 and 2. The geophysical methods used in previous investigations were seismicrefraction and cross-hole surveys. The seismic refraction survey used compressive wavevelocities to determine seismic discontinuities. The cross-hole seismic survey provided shearand compressional wave velocities for the subsurface materials to a depth of 88.4 meters(290 ft), 25.0 meters (82 ft) above mean sea level (msl).
ESP Site Geophysical Investigations
During the ESP investigation, the applicant conducted three down-hole seismic CPT tests andfive suspension P-S velocity tests. The applicant also stated that it performed seismic reflectionand refraction surveys to image the subsurface and to characterize the basement rocks acrossthe ESP site.
The applicant obtained the shear wave and compressional wave velocity to the maximumexplored depth of 407.8 meters (1338 ft). The Upper Sand Stratum shear wave velocitiesrange from 179.8 to 1005.8 meters per second (m/s) (590 to 3300 ft per second (ft/s)),however, SSAR Section 2.5.4.2.5.2 gives different values from 173.7 to 1008.9 m/s (570 to3310 ft/s), with an average value of 331.9 m/s (1089 ft/s). The Blue Bluff Marl shear wavevelocities range from 323.1 to 1298.4 m/s (1060 to 4260 ft/s), with an average value of772.3 m/s (2534 ft/s), and Lower Sand Stratum shear wave velocities range from 283.5 to1423.4 m/s (930 to 4670 ft/s), with an average value of 696.0 m/s (2282 ft/s). SERFigure 2.5.4-3 shows the shear wave velocity values measured in the subsurface strata at theESP site using suspension P-S velocity and CPT down-hole seismic testing. Shear wavevelocities for the Dunbarton Triassic (206 to 24 mya) basin rock ranged from 707.2 to 2850 m/s(2320 to 9350 ft/s). In the upper part of the Dunbarton Triassic basin, the applicant detected aweathered zone about 36.6 meters (120 ft) thick, where shear wave velocity increased rapidly

2-341
with depth. The applicant did not directly detect the rock with a shear wave velocity of 2.8 km/s(9200 ft/s), but extrapolated linearly to the corresponding rock horizon.
The applicant stated that the shear wave velocity was measured through down-hole seismictests, but that CPT measurements are limited to the Upper Sand Stratum because all CPTsreached refusal at the top of the Blue Bluff Marl. The shear wave velocity values obtained fromCPT measurements are lower than those obtained from suspension P-S velocity tests, whichmay reflect site variability.
The applicant indicated that it used shear wave velocities measured from both CPTs andsuspension logging to develop the design values for the Upper Sand Stratum, but only usedshear wave velocities from suspension logging for the Blue Bluff Marl and Lower Sand Stratum. The applicant also stated that it will use shear wave velocities obtained for the compacted fill forthe existing VEGP Units 1 and 2.
2.5.4.1.5 Excavation and Backfill
In SSAR Section 2.5.4.5, the applicant discussed future excavation, fills and slopes (forstability), excavation methods and stability issues, back fill sources and quality control, and theimpact of dewatering. The applicant stated in SSAR Section 2.5.4.5.1 that a substantialamount of excavation to completely remove the Upper Sand Stratum and filling is warranted forconstruction purposes at the proposed VEGP Units 3 and 4. Additional planning for excavationand filling will take place during the COL phase. SSAR Section 2.5.4.5.2 describes theapplicant’s excavation methods that include excavating the Upper Sand Stratum usingconventional excavation equipment and dewatering once the excavation reaches depthsbeneath the ground water table. SSAR Section 2.5.4.5.3 describes backfill methods that theapplicant plans to follow at the proposed VEGP Units 3 and 4. These methods are similar tothe guidelines used during construction of the existing Units 1 and 2. The applicant also statedthat it will establish an onsite soils testing laboratory and will use a contractor with an approvedquality control program. SSAR Section 2.5.4.5.4 refers to SSAR Section 2.5.4.6.2 for adiscussion on the control of ground water and dewatering during the excavation phase.
Extent of Excavation
The applicant indicated that the plant grade will be at 67.1 meters (220 ft) above msl, and thebase for the containment and auxiliary building foundations will be at 54.9 meters (180 ft) abovemsl, which corresponds to a depth of 12.2 meters (40 ft) below the final grade or approximately15.2–18.3 meters (50–60 ft) above the Blue Bluff Marl. Other foundations in the power blockwill be at nominal depths near final grade.
The applicant stated that it will completely remove the Upper Sand Stratum during excavation. The total depth of excavation to the Blue Bluff Marl will range from approximately 24.4 to27.4 meters (80 to 90 ft) below existing grade, based on the borings completed during the ESPsubsurface investigation. The applicant also indicated that it may need to remove shelly andporous material near the top surface of the Blue Bluff Marl using deeper, localized excavationsand that it will develop a detailed excavation plan during the COL stage.

2-342
Excavation Methods and Stability
The applicant indicated that it will use conventional excavating equipment to remove the UpperSand Stratum and will follow the Occupational Safety and Health Administration’s regulationsduring the excavation. The excavation will be open-cut with slopes no steeper than 2:1(horizontal-to-vertical ratio). The applicant stated that it will seal and protect each temporaryslope cut into the Upper Sand Stratum and will use sheet piles or soldier piles and lagging wallswhere there is insufficient space for open-cut excavation. The applicant will implement adewatering plan once the excavation progresses beneath the ground water table, approximately50.3 meters (165 ft) above msl. The applicant also committed that it will remove possible softzones in the upper portion of the Blue Bluff Marl with conventional equipment, maintain properslopes for the compacted fill, and clean up the excavation area thoroughly before the placementof structural fill.
Backfill Sources and Quality Control
The applicant indicated that compacted fill, to be used for the proposed Units 3 and 4, will becomposed of sandy or silty sand material that contains no more than 25 percent fines (relatedto particle size) that are smaller than a No. 200 sieve. These guidelines proposed by theapplicant follow those used during the backfill phase for the existing Units 1 and 2. Theapplicant stated that it will evaluate old borrows from previous construction, as well as newborrows if warranted, for potential backfill source material. In addition, the applicant stated thatit will compact the fills, using the VEGP criteria (defined in ASTM D 1557, “Standard TestMethod for Laboratory Compaction Characteristics of Soil Using Modified Effort (56000 ft-lbf/ft2
(2700 kN-m/m3)”) to within 3 percent of its optimum moisture content. In addition, the applicantwill develop a test fill program similar to the one used for VEGP Units 1 and 2. The applicantwill also establish an onsite testing laboratory to control the quality of the fill materials and thedegree of compaction, as well as to ensure that the fill conforms to the requirement of theearthwork specification. The applicant will deploy a soil testing firm (other than the earthworkcontracting firm) that has an established quality control program. Finally, the applicant statedthat it will implement sufficient laboratory compaction and grain size distribution tests to ensurethat variations in the fill material are considered, and it will perform sufficient density tests toensure a minimum test per lift of one per 929.0 square meters (10,000 square ft) of fill placed.
2.5.4.1.6 Ground Water Conditions
SSAR Section 2.5.4.6 describes the applicant’s ground water measurements and constructiondewatering plan. SSAR Section 2.5.4.6.1 presents a summary of the ground water conditionsat the ESP site and references SSAR Section 2.4.12 for a detailed discussion of thoseconditions. SSAR Section 2.5.4.6.2 discusses the construction dewatering methods used forthe existing VEGP Units 1 and 2. The applicant plans to implement similar procedures duringexcavation for the proposed Units 3 and 4.
Ground Water Measurements and Elevations
Ground water is in unconfined conditions in the Upper Sand Stratum and in confined conditionsin the Lower Sand Stratum at the ESP site. The Blue Bluff Marl is an aquaclude that separates

2-343
the unconfined and confined aquifers. The ground water table occurs at a depth of about18.3 meters (60 ft) below the existing ground surface.

2-344
Figure 2.5.4-3 - ESP Site Shear Wave Velocity Measurements

2-345
Figure 2.5.4-4 - ESP Site-Specific Base Shear Wave Velocity Profile

2-346
The applicant stated, in SSAR Section 2.5.4.6.1, that it installed 15 observation wells for itsESP subsurface investigation program, 10 wells in the unconfined aquifer and 5 wells in theconfined aquifer. In addition to these wells, 22 existing wells (13 in unconfined aquifers and 9 inconfined aquifers) were used as part of the ground water monitoring program for this ESPstudy. The applicant indicated that the wells exhibited ground water levels ranging from about39.3 to 51.0 meters (128.2 to 167.2 ft) above msl during their installation The applicant alsonoted that it replaced one of the observation wells, but did not mention its reasoning for doingso. The applicant stated that the hydraulic conductivity (k-value) for the unconfined aquiferranges from 1.13 x 10⁻⁵ to 9.34 x 10⁻⁴ centimeters per second (cm/s) and that the k-value for theconfined aquifer ranges from 1.25 x 10⁻⁵ to 7.49 x 10⁻⁴ cm/s. The applicant referred to SSARSection 2.4.12 for a more detailed description of ground water conditions at the ESP site.
Construction Dewatering Plan
The applicant stated that the design ground water level for the ESP site will be 50.3 meters(165 ft) above msl, based on the 10 years of ground water observations made prior to the ESPinvestigation and on the ground water monitoring program observations made for this ESPinvestigation. This ground water level (50.3 meters (165 ft) above msl) corresponds to thedesign ground water level for the existing VEGP Units 1 and 2. The applicant stated that it willdewater all of the major excavations using gravity systems. The applicant believed that, due tothe relatively impermeable nature of the Upper Sand Stratum, sump-pumping of ditches will beadequate to dewater the soils. The applicant stated that it will use the same kind of ditch layoutand pump numbers as used in the Unit 1 and 2 construction to remove ground water inflows. Inaddition, the applicant emphasized that it will dewater during new construction in a manner thatminimizes the draw-down effects on the surrounding environment and on Units 1 and 2.
2.5.4.1.7 Response of Soil and Rock to Dynamic Loading
SSAR Section 2.5.4.7 describes the development of the site-specific base shear wave velocityprofile, variations of the shear modulus and soil damping values with shear strain, and soil/rockcolumn amplification analysis. SSAR Section 2.5.4.7.1.1 describes various measurements thatwere made at the ESP site to obtain estimates of the shear wave velocity for the soil, whileSSAR Section 2.5.4.7.1.2 describes the shear wave velocities measured for the DunbartonTriassic basin and Paleozoic crystalline rocks. SSAR Section 2.5.4.7.2.1 describes thevariation of soil shear modulus with shear strain, and SSAR Section 2.5.4.7.2.2 addresses thevariation of soil damping with cyclic shear strain. SSAR Section 2.5.4.7.3 discusses the sitedynamic responses for the soil/rock profiles described by the applicant in SSAR Section2.5.4.7.1. The applicant computed these responses in the frequency domain by using acomplex response method and the SHAKE2000 computer program. The applicant presentedthe following information related to the response of soil and rock to dynamic loading.
Shear Wave Velocity Profile
The applicant stated that it used previous shear wave velocity determined for the existing unitsfor the compacted fill at the ESP site and that it will do additional evaluation during the COLstage to confirm its shear wave velocities. Figure 2.5.4-3 shows the site-specific shear wavevelocity profile based on the ESP investigation. The applicant indicated that Figure 2.5.4-4(SSAR Figure 2.5.4-7) shows the profile used in the site seismic amplification analysis.
2-347
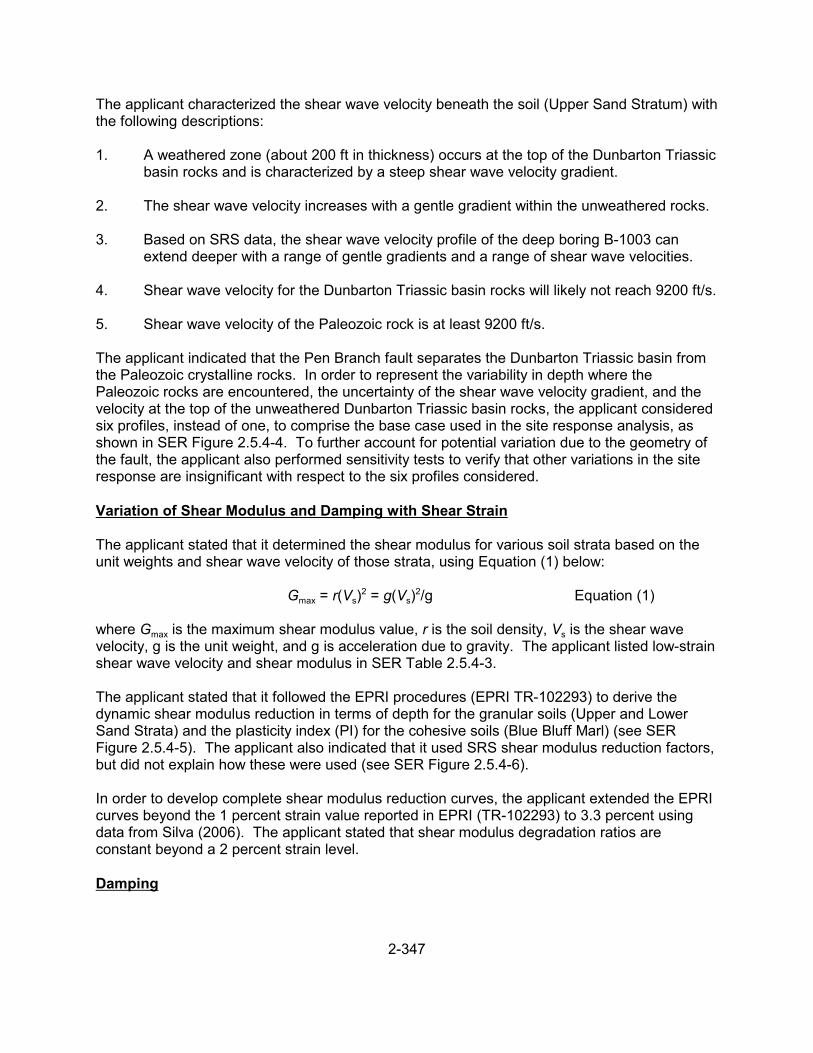
The applicant characterized the shear wave velocity beneath the soil (Upper Sand Stratum) withthe following descriptions:
1. A weathered zone (about 200 ft in thickness) occurs at the top of the Dunbarton Triassicbasin rocks and is characterized by a steep shear wave velocity gradient.
2. The shear wave velocity increases with a gentle gradient within the unweathered rocks.
3. Based on SRS data, the shear wave velocity profile of the deep boring B-1003 canextend deeper with a range of gentle gradients and a range of shear wave velocities.
4. Shear wave velocity for the Dunbarton Triassic basin rocks will likely not reach 9200 ft/s. 5. Shear wave velocity of the Paleozoic rock is at least 9200 ft/s.
The applicant indicated that the Pen Branch fault separates the Dunbarton Triassic basin fromthe Paleozoic crystalline rocks. In order to represent the variability in depth where thePaleozoic rocks are encountered, the uncertainty of the shear wave velocity gradient, and thevelocity at the top of the unweathered Dunbarton Triassic basin rocks, the applicant consideredsix profiles, instead of one, to comprise the base case used in the site response analysis, asshown in SER Figure 2.5.4-4. To further account for potential variation due to the geometry ofthe fault, the applicant also performed sensitivity tests to verify that other variations in the siteresponse are insignificant with respect to the six profiles considered.
Variation of Shear Modulus and Damping with Shear Strain
The applicant stated that it determined the shear modulus for various soil strata based on theunit weights and shear wave velocity of those strata, using Equation (1) below:
Gmax = r(Vs)2 = g(Vs)
2/g Equation (1)
where Gmax is the maximum shear modulus value, r is the soil density, Vs is the shear wavevelocity, g is the unit weight, and g is acceleration due to gravity. The applicant listed low-strainshear wave velocity and shear modulus in SER Table 2.5.4-3.
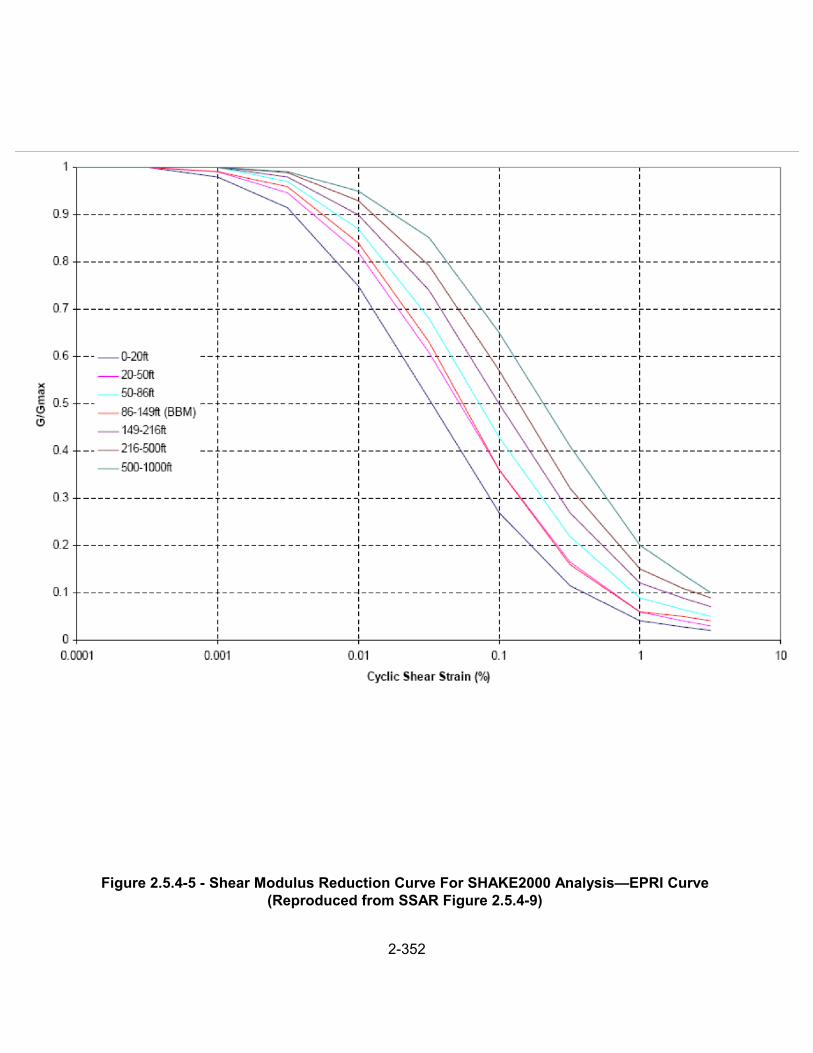
The applicant stated that it followed the EPRI procedures (EPRI TR-102293) to derive thedynamic shear modulus reduction in terms of depth for the granular soils (Upper and LowerSand Strata) and the plasticity index (PI) for the cohesive soils (Blue Bluff Marl) (see SERFigure 2.5.4-5). The applicant also indicated that it used SRS shear modulus reduction factors,but did not explain how these were used (see SER Figure 2.5.4-6).
In order to develop complete shear modulus reduction curves, the applicant extended the EPRIcurves beyond the 1 percent strain value reported in EPRI (TR-102293) to 3.3 percent usingdata from Silva (2006). The applicant stated that shear modulus degradation ratios areconstant beyond a 2 percent strain level.
Damping
2-348
To determine the damping ratio, x, as a function of the cyclic shear strain, the applicantfollowed EPRI procedures (EPRI TR-102293). It also derived the damping ratio in terms ofdepth for granular soils (Upper and Lower Sand Strata) and PI for cohesive soils (Blue BluffMarl), shown in SER Figure 2.5.4-7. The applicant stated that it also used the SRSrelationships (Lee 1996) shown in SER Figure 2.5.4-8, but the applicant did not explain inSSAR Section 2.5.4.7.2.2 how the SRS relationships were used. Similarly, the applicantextended the damping curves beyond the 1 percent strain level, as described above, for theshear modulus reduction curves. The applicant then used these damping curves to determinethe site response to dynamic loading, which is described in SSAR Section 2.5.2.5.1.5.
Soil/Rock Column Amplification
The applicant described that it used the SHAKE2000 (Bechtel 2000) computer program tocompute dynamic response at the ESP site. SHAKE2000 uses an equivalent-linear procedureto account for the nonlinearity of soils by employing an iterative process used to obtain valuesfor shear modulus and damping that are compatible with the equivalent strain induced in eachsublayer.
2.5.4.1.8 Liquefaction Potential
In Section 2.5.4.8 of the SSAR, the applicant explained that soil liquefaction can occur when allof the following three criteria are met:
1. Design ground acceleration is high.2. Soil is saturated (i.e., close to or below the water table).3. Site soils are sands or silty sands in a loose or medium-dense condition.
The applicant stated that the Upper Sand Stratum at the ESP site meets these criteria. Thesesoils consist of sands with a varying fines (particle size) content. Approximately 9.1 meters(30 ft) of the Upper Sand Stratum occurs beneath the ground water table at a depth of 18.3meters (60 ft) beneath the ground surface. The average corrected SPT N-value within theUpper Sand Stratum was 25 blows per foot (bpf), indicating a medium-dense condition. However, the applicant indicated that the underlying Blue Bluff Marl is significantly cohesive,and the Lower Sand Stratum is sufficiently dense and deep; therefore, the applicant concludedthat liquefaction is not a concern for these strata.
Previous Liquefaction Analysis
Previous investigations for the existing VEGP Units 1 and 2 evaluated the liquefaction potentialfor the Upper Sand Stratum using SPT blow counts and the simplified procedure of Seed andIdriss (1970). The evaluation indicated that, below the ground water table, the Upper SandStratum was susceptible to liquefaction when subjected to the maximum SSE acceleration(0.2 g) developed for the existing VEGP units. The applicant also used the analysis performedon borrow sources to conclude that there is an adequate factor of safety against liquefaction forbackfill materials compacted to 97 percent of the maximum density obtained by ASTM D 1557.

2-349
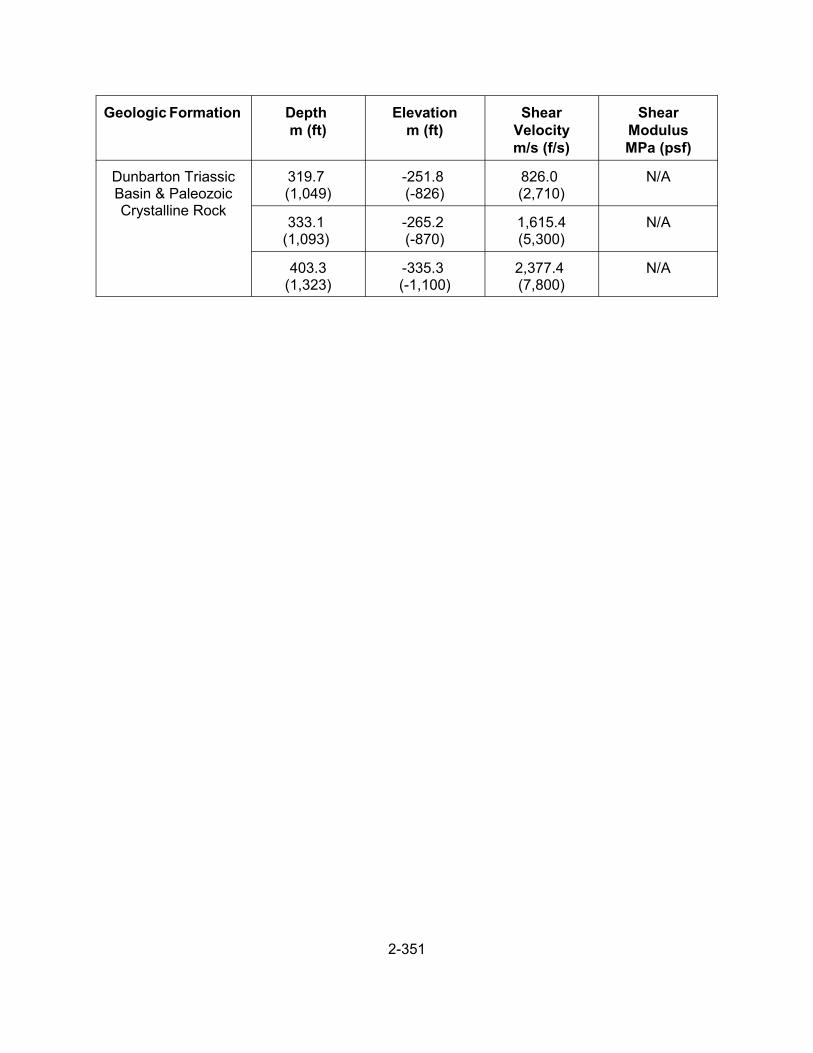
Table 2.5.4-3 - Shear Wave Velocity and Dynamic Shear Modulus (Based on SSARTables 2.5.4-2 and 2.5.4-10)
Geologic Formation Depth m (ft)
Elevationm (ft)
ShearVelocitym/s (f/s)
ShearModulusMPa (psf)
Compacted Backfill 0 to 1.8 (0 to 6)
68.0 to 66.1 (223 to 217)
174.7(573)
60.09 (1,255)
1.8 to 3.0 (6 to 10)
66.1 to 64.9 (217 to 213)
223.1 (732)
98.11 (2,049)
3.0 to 4.3 (10 to 14)
64.9 to 63.7 (213 to 209)
247.2 (811)
120.18 (2,510)
4.3 to 5.5 (14 to 18)
63.7 to 62.5 (209 to 205)
265.5 (871)
138.76 (2,898)
5.5 to 7.0 (18 to 23)
62.5 to 61.0 (205 to 200)
282.5 (927)
157.05 (3,280)
7.0 to 8.8 (23 to 29)
61.0 to 59.1 (200 to 194)
299.6 (983)
176.87 (3,694)
8.8 to 11.0 (29 to 36)
59.1 to 57.0 (194 to 187)
317.0 (1,040)
197.75 (4,130)
11.0 to 13.1 (36 to 43)
57.0 to 54.9 (187 to 180)
332.8 (1,092)
218.00 (4,553)
13.1 to 15.2 (43 to 50)
54.9 to 52.7 (180 to 173)
346.6 (1,137)
236.53 (4,940)
15.2 to 17.1 (50 to 56)
52.7 to 50.9 (173 to 167)
538.1 (1,175)
252.52 (5,274)
17.1 to 19.2 (56 to 63)
50.9 to 48.8 (167 to 160)
368.5 (1,209)
267.55 (5,588)
19.2 to 21.6 (63 to 71)
48.8 to 46.3 (160 to 152)
375.5 (1,232)
277.51 (5,796)
21.6 to 24.1 (71 to 79)
46.3 to 43.9 (152 to 144)
381.9 (1,253)
287.33 (6,001)
24.1 to 26.2 (79 to 86)
43.9 to 41.8 (144 to 137)
388.0 (1,273)
296.19 (6,186)
Blue Bluff Marl (Lisbon Formation)
26.2 to 28.0 (86 to 92)
41.8 to 39.9 (137 to 131)
426.7 (1,400)
334.11 (6,978)

Geologic Formation Depth m (ft)
Elevationm (ft)
ShearVelocitym/s (f/s)
ShearModulusMPa (psf)
2-350
28.0 to 29.6 (92 to 97)
39.9 to 38.4 (131 to 126)
518.2 (1,700)
494.17 (10,321)
29.6 to 31.1 (97 to 102)
38.4 to 36.9 (126 to 121)
640.1 (2,100)
754.11 (15,750)
31.1 to 32.0 (102 to 105)
36.9 to 36.0 (121 to 118)
518.2 (1,700)
494.17 (10,321)
32.0 to 33.8 (105 to 111)
36.0 to 33.8 (118 to 112)
670.6 (2,200)
827.66 (17,286)
33.8 to 37.5 (111 to 123)
33.8 to 30.5 (112 to 100)
716.3 (2,350)
944.34 (19,723)
37.5 to 45.4 (123 to 149)
30.5 to 22.6 (100 to 74)
807.7 (2,650)
1,200.83 (25,080)
Lower Sand Stratum (Still Branch)
45.4 to 47.5 (149 to 156)
22.6 to 20.4(74 to 67)
609.6 (2,000)
684.02 (14,286)
47.5 to 65.8 (156 to 216)
20.4 to 2.1(67 to 7)
502.9 (1,650)
465.54 (9,723)
(Congaree) 65.8 to 100.9(216 to 331)
2.1 to -32.9 (7 to -108)
594.4 (1,950)
650.21 (13,580)
(Snapp) 100.9 to 133.5(331 to 438)
-32.9 to -65.5 (-108 to -215)
624.8 (2,050)
718.63 (15,009)
(Black Mingo) 133.5 to 145.4(438 to 477)
-65.5 to -77.4 (-215 to -254)
716.3 (2,350)
944.34 (19,723)
(Steel Creek) 145.4 to 178.9(477 to 587)
-77.4 to -110.9(-254 to -364)
807.7 (2,650)
1,200.83 (25,080)
(Gaillard/BlackCreek)
178.9 to 243.2(587 to 798)
-110.9 to -175.3 (-364 to
-575)
868.7 (2,850)
1,388.96 (29,009)
(Pio Nono) 243.2 to 261.5(798 to 858)
-175.3 to -193.5 (-575 to
-635)
874.8 (2,870)
1,408.54 (29,418)
(Cape Fear) 261.5 to 319.7(858 to 1,049)
-193.5 to -251.8 (-635 to
-826)
826.0 (2,710)
1,255.85 (26,229)
Geologic Formation Depth m (ft)
Elevationm (ft)
ShearVelocitym/s (f/s)
ShearModulusMPa (psf)
2-351
Dunbarton TriassicBasin & PaleozoicCrystalline Rock
319.7 (1,049)
-251.8 (-826)
826.0 (2,710)
N/A
333.1 (1,093)
-265.2 (-870)
1,615.4(5,300)
N/A
403.3(1,323)
-335.3 (-1,100)
2,377.4 (7,800)
N/A
2-352
Figure 2.5.4-5 - Shear Modulus Reduction Curve For SHAKE2000 Analysis—EPRI Curve (Reproduced from SSAR Figure 2.5.4-9)

2-353
Figure 2.5.4-6 - Shear Modulus Reduction Curve for SHAKE2000 Analysis—SRS Curve

2-354
(Reproduced from SSAR Figure 2.5.4-10)
Figure 2.5.4 - Damping Curve For SHAKE2000 Analysis—EPRI Curve(Reproduced from SSAR Figure 2.5.4-11)

2-355
Figure 2.5.4-8 - Damping Curve For SHAKE2000 Analysis—SRS Curve (Reproduced from SSAR Figure 2.5.4-12)
2-356
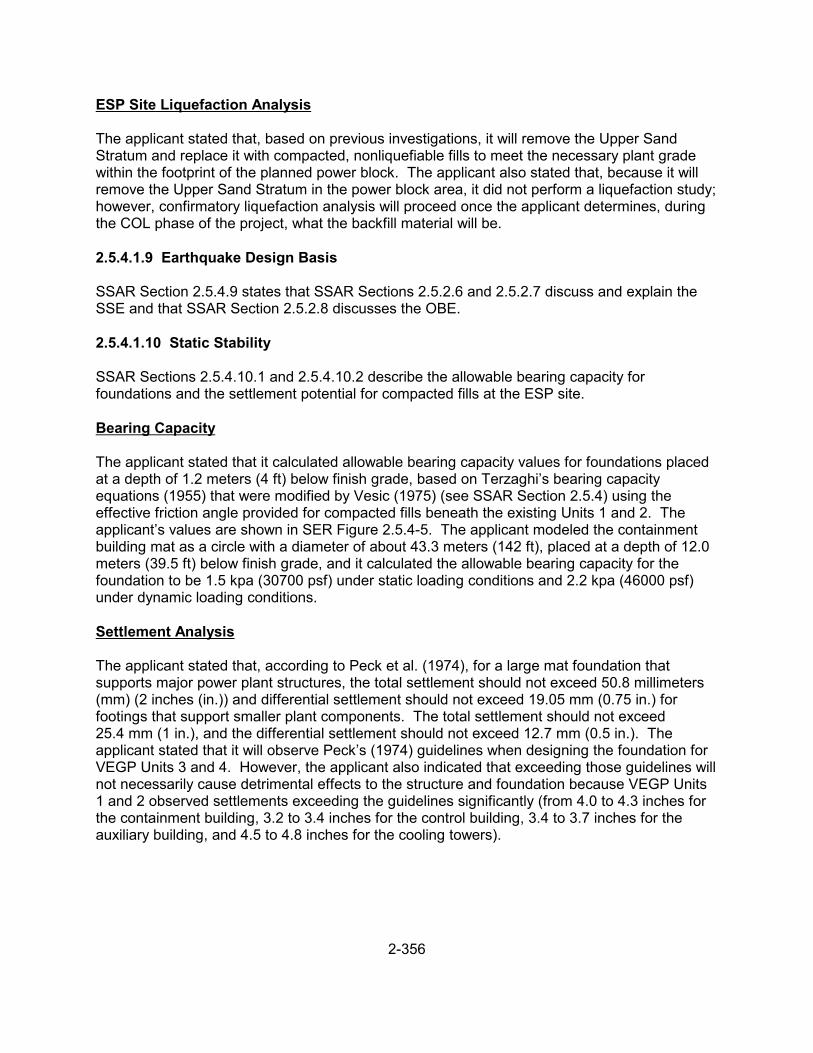
ESP Site Liquefaction Analysis
The applicant stated that, based on previous investigations, it will remove the Upper SandStratum and replace it with compacted, nonliquefiable fills to meet the necessary plant gradewithin the footprint of the planned power block. The applicant also stated that, because it willremove the Upper Sand Stratum in the power block area, it did not perform a liquefaction study;however, confirmatory liquefaction analysis will proceed once the applicant determines, duringthe COL phase of the project, what the backfill material will be.
2.5.4.1.9 Earthquake Design Basis
SSAR Section 2.5.4.9 states that SSAR Sections 2.5.2.6 and 2.5.2.7 discuss and explain theSSE and that SSAR Section 2.5.2.8 discusses the OBE.
2.5.4.1.10 Static Stability
SSAR Sections 2.5.4.10.1 and 2.5.4.10.2 describe the allowable bearing capacity forfoundations and the settlement potential for compacted fills at the ESP site.
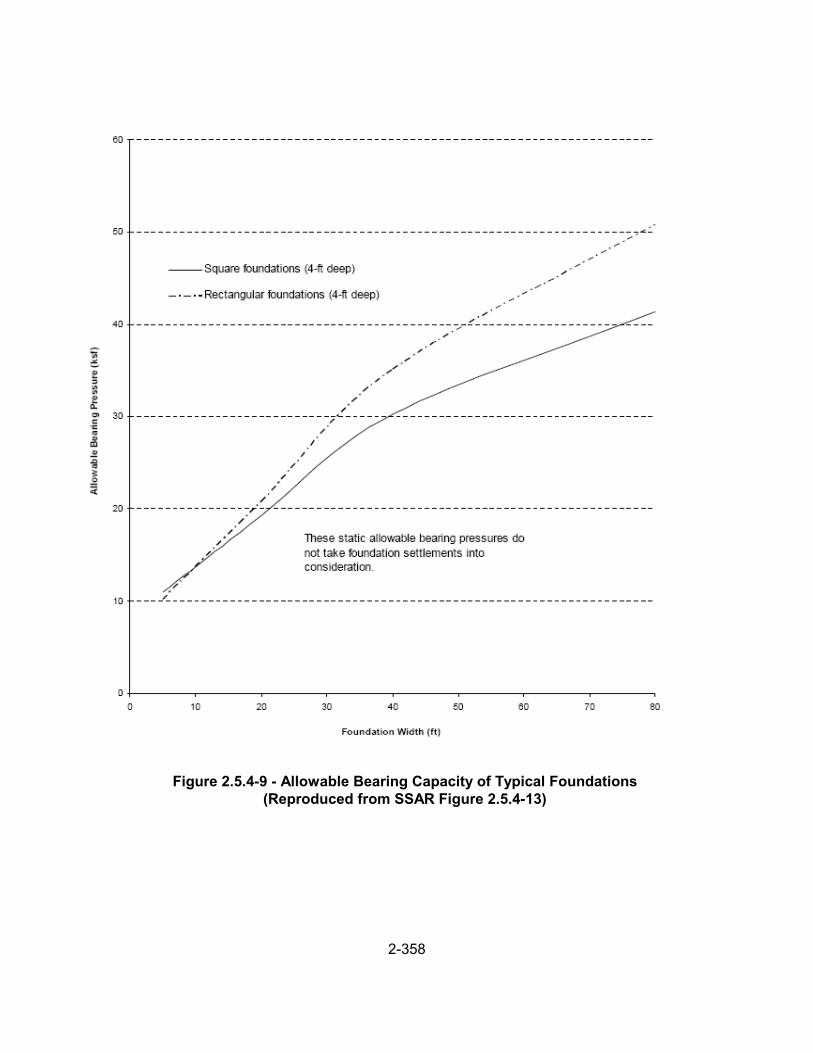
Bearing Capacity
The applicant stated that it calculated allowable bearing capacity values for foundations placedat a depth of 1.2 meters (4 ft) below finish grade, based on Terzaghi’s bearing capacityequations (1955) that were modified by Vesic (1975) (see SSAR Section 2.5.4) using theeffective friction angle provided for compacted fills beneath the existing Units 1 and 2. Theapplicant’s values are shown in SER Figure 2.5.4-5. The applicant modeled the containmentbuilding mat as a circle with a diameter of about 43.3 meters (142 ft), placed at a depth of 12.0meters (39.5 ft) below finish grade, and it calculated the allowable bearing capacity for thefoundation to be 1.5 kpa (30700 psf) under static loading conditions and 2.2 kpa (46000 psf)under dynamic loading conditions.
Settlement Analysis
The applicant stated that, according to Peck et al. (1974), for a large mat foundation thatsupports major power plant structures, the total settlement should not exceed 50.8 millimeters(mm) (2 inches (in.)) and differential settlement should not exceed 19.05 mm (0.75 in.) forfootings that support smaller plant components. The total settlement should not exceed25.4 mm (1 in.), and the differential settlement should not exceed 12.7 mm (0.5 in.). Theapplicant stated that it will observe Peck’s (1974) guidelines when designing the foundation forVEGP Units 3 and 4. However, the applicant also indicated that exceeding those guidelines willnot necessarily cause detrimental effects to the structure and foundation because VEGP Units1 and 2 observed settlements exceeding the guidelines significantly (from 4.0 to 4.3 inches forthe containment building, 3.2 to 3.4 inches for the control building, 3.4 to 3.7 inches for theauxiliary building, and 4.5 to 4.8 inches for the cooling towers).

2-357
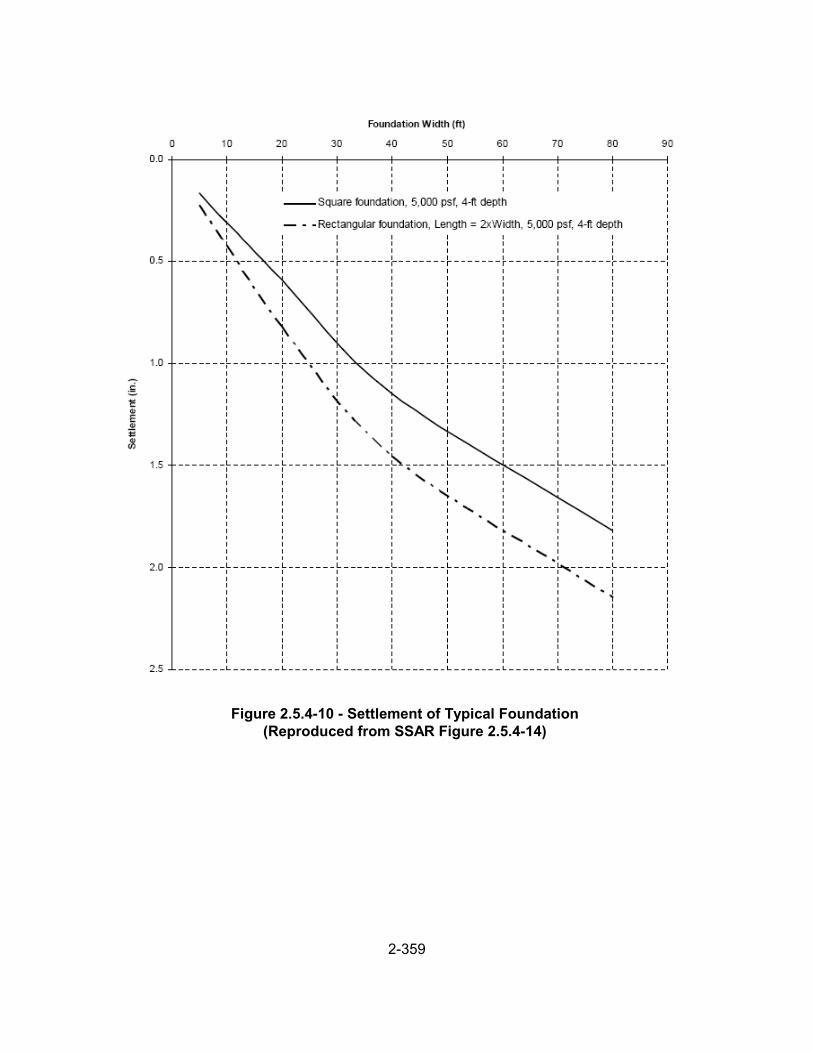
Settlement of Soils Beneath the Site
The applicant stated that any settlement of the compacted fill is essentially elastic and wouldoccur during the construction period. The applicant also stated that settlement for the BlueBluff Marl and Lower Sand Stratum should be minimal because of the approximately 27.4-m(90-ft) overburden and the dense Lower Sand Stratum. The applicant also analyzed typicalfoundations for settlement, assuming a profile consisting of 24.1 meters (79 ft) of fills underlainby the Blue Bluff Marl and Lower Sand Stratum. SER Figure 2.5.4-10 shows computed totalsettlement of these typical foundations.
2-358
Figure 2.5.4-9 - Allowable Bearing Capacity of Typical Foundations (Reproduced from SSAR Figure 2.5.4-13)
2-359
Figure 2.5.4-10 - Settlement of Typical Foundation (Reproduced from SSAR Figure 2.5.4-14)
2-360
2.5.4.1.11 Design Criteria
In SSAR Section 2.5.4.11, the applicant summarized the geotechnical design criteria.The applicant stated that the acceptable factor of safety against liquefaction for the site soils isgreater than or equal to 1.35. SSAR Section 2.5.4.10 presents bearing capacity and settlementcriteria. Generally acceptable total and differential settlements are limited to 50.8 mm (2 in.)and 19.1 mm (0.75 in.) for mat foundations and 25.4 mm (1 in.) and 12.7 mm (0.5 in.),respectively, for footings. The applicant indicated that SSAR Section 2.5.5.2 specifies that theminimum acceptable long-term static factor against slope stability failure is 1.5; SSAR Section2.5.5.3 specifies that the minimum acceptable long-term seismic factor for safety against slopestability is 1.1.
2.5.4.1.12 Techniques to Improve Subsurface Conditions
SSAR Section 2.5.4.12 states that the applicant did not consider any ground improvementbeyond removing and replacing the Upper Sand Stratum, but that it will consider additionalground improvement methods, as warranted for specific locations, during the COL phase. Theapplicant stated that, for areas outside the power block excavation, it can improve surficialground by densification with heavy vibratory rollers. Finally, the applicant stated that it will applyother ground improvement methods as needed.
2.5.4.2 Regulatory Basis
SSAR Section 2.5.4 describes the applicant’s evaluation of the stability of the subsurfacematerials and foundations at the ESP site. In SSAR Section 1.8, the applicant stated that itdeveloped the geological, geophysical, and geotechnical information used to evaluate thestability of the subsurface materials in accordance with the requirements of 10 CFR 100.23,“Geologic and Seismic Siting Criteria.” The applicant also applied the guidance in the followingdocuments:
• NUREG-0800, issued March 2007
• RG 1.70, Revision 3, issued November 1978
• RG 1.198, “Procedures and Criteria for Assessing Seismic Soil Liquefaction at NuclearPower Plant Sites,” issued November 2003
• RG 1.132, Revision 2, issued in 2003
• RG 1.138, Revision 2, issued in 2003
The staff reviewed SSAR Section 2.5.4 for conformance with the regulatory requirements andguidance applicable to the characterization of the stability of subsurface materials, as identifiedbelow. In its review of SSAR Section 2.5.4, the staff considered the regulatory requirements in10 CFR 100.23(c) and 10 CFR 100.23(d)(4). According to 10 CFR 100.23(c), applicants mustinvestigate the engineering characteristics of a site and its environs in sufficient scope anddetail to permit an adequate evaluation of the proposed site. Pursuant to 10 CFR 100.23(d)(4),applicants must evaluate siting factors such as soil and rock stability, liquefaction potential, and

2-361
natural and artificial slope stability. Section 2.5.4 of NUREG-0800 provides specific guidanceconcerning the evaluation of information characterizing the stability of subsurface materials,including the need for geotechnical field and laboratory tests as well as geophysicalinvestigations.
2.5.4.3 Technical Evaluation
This SER section provides the staff’s evaluation of the geotechnical investigations conducted bythe applicant to determine the static and dynamic engineering properties of the subsurfacematerials at the ESP site. The technical information presented in SSAR Section 2.5.4 resultedfrom the applicant’s field and laboratory investigations performed for the ESP. The applicantintended these investigations to confirm the large volume of geotechnical data obtained by theSNC for the existing VEGP Units 1 and 2. The applicant used the subsurface materialproperties from its limited field and laboratory testings to evaluate the site geotechnicalconditions and to derive various design values for the ESP application.
Based on its review of SSAR Section 2.5.4, the staff determined whether the applicantadequately demonstrated the stability of the subsurface materials responding to static anddynamic loading at the ESP site. The staff also reviewed the applicant’s field and laboratoryinvestigations and its determination of the geotechnical engineering properties of the soils androcks underlying the ESP site. In addition, the staff made multiple trips to the site to observesome of the applicant’s onsite borings and field explorations as well as to observe the sitegeotechnical conditions in order to determine whether the applicant followed the guidance ofRG 1.132 and other relevant guidance in its site-specific investigations.
2.5.4.3.1 Description of Site Geologic Features
SSAR Section 2.5.4.1 refers to SSAR Section 2.5.1.1 for a description of the regional and sitegeology. Section 2.5.1.3 of this SER presents the staff’s evaluation of the regional and sitegeology.
2.5.4.3.2 Properties of Subsurface Materials
The staff focused its review of SSAR Sections 2.5.4.2 and 2.5.4.3 on the applicant’s descriptionof (1) subsurface materials, (2) field investigations, (3) laboratory testing, and (4) static anddynamic engineering properties of the ESP site subsurface materials. In general, the applicantrelied heavily on the previous field and laboratory investigations for the existing VEGP Units 1and 2 to evaluate the engineering properties and the stability of the soils and rocks underlyingthe ESP site, instead of implementing a complete field investigation and sampling program.
The applicant drilled 12 borings and sampled at regular depth intervals. The depths of theseborings ranged from 30.1 to 92.7 meters (98.9 to 304 ft), except for boring B-1003, whichreached a depth of 407.8 meters (1338 ft). The applicant drilled two additional borings withoutsampling to depths of 32.0 meters (105 ft) (B-1002A) and 18.3 meters (60 ft) (C-1005A) toperform suspension P-S velocity tests. The applicant also performed limited engineeringproperty tests on the Upper Sand Stratum, Blue Bluff Marl, and Lower Sand Stratum, including15 undrained shear strength tests for the Blue Bluff Marl. The field tests included SPTs,suspension P-S velocity, and static and seismic CPTs.

2-362
In RAI 2.5.4-1, the staff asked the applicant to clarify the discrepancy in different SSARsections concerning the number of borings drilled during the ESP field investigation. Theapplicant explained in its response that in one section it referred to the total number of boringsas 14, which included the 2 borings without any sampling. In other SSAR sections, theapplicant did not include these two additional borings. With this clarification, the staff considersRAI 2.5.4-1 resolved.
In RAI 2.5.4-3, the staff asked the applicant to provide justification for developing geotechnicalparameters for the Blue Bluff Marl and Lower Sand Stratum (the main load-bearing layers)using only the data from four borings with no significant sampling in the Lower Sand Stratum. In its response, the applicant stated that three ESP borings completely penetrated the BlueBluff Marl and another nine borings extended partially into the marl. Among the three, boringsB-1002 and B-1004 penetrated through the marl into the Still Branch and Congaree Formationsand boring B-1003 went as deep as 407.8 meters (1338 ft) into the bedrock. The applicantobtained a total of 58 SPT N-values and corresponding samples, as well as 12 tube samplesfrom the Blue Bluff Marl and the Lower Sand Stratum, and performed P-S velocity logging in thethree borings that penetrated the marl. Despite its ESP investigation, the applicant stated that itconsidered the soil engineering properties from the previous investigations of Units 1 and 2.
From its review of SSAR Section 2.5.4 and the applicant’s response to this and other RAIs, thestaff finds that the applicant actually relied more on the previous investigations for the existingUnits 1 and 2 than on its ESP field investigations to obtain geotechnical parameters for the ESPsite. The staff believes that, while the applicant can use data from the previous investigationsas a reference to support the current site characterization, the applicant should not have reliedon the previous data to demonstrate the suitability of the ESP site because those data weregenerated following different regulatory requirements, regulatory guidelines, different industrystandards, and different investigation technologies. In addition, soil property variation betweenthe two sites may also make reliance on the previous data inappropriate. Therefore, the staffconcludes that the applicant did not conduct sufficient field and laboratory tests to reliablydetermine the subsurface soil static and dynamic properties for the soils beneath the Blue BluffMarl at the ESP site. This is Open Item 2.5-11.
In RAI 2.5.4-3, the staff also asked the applicant to explain the low SPT blow count values (aslow as 9 bpf) in the Lower Sand Stratum below the Blue Bluff Marl because low SPT blow countvalue indicate the presence of soft soil layers. For comparison, the average blow count for thesame layer is about 60 bpf. The applicant explained that this low SPT N-value (9 bpf) in theLower Sand Stratum could be due to the existence of disturbed materials at the bottom of thedrill hole because other geophysical measurements at the same depth showed no physical orstrength abnormalities. After reviewing the applicant’s response, the staff concurs that thedisturbed materials at the bottom of the drill hole may have caused this anomalously low SPTvalue in the Lower Sand Stratum. However, because the Lower Sand Stratum is one of theload-bearing layers and the applicant is also committed to performing more borings during theCOL stage, the staff considers that to obtain additional data on the Blue Bluff Marl and LowerSand Stratum during the COL stage to confirm the absence of soft materials in these load-bearing layers is acceptable. This is COL Action Item 2.5-1.
Considering the existence of the very low SPT N-values measured from the ESP field tests, inRAI 2.5.4-3(c), the staff asked the applicant to explain if there were any indications of soft

2-363
zones in the Upper Sand Stratum, such as those encountered at the SRS. In its response toRAI 2.5.4.-3(c), the applicant stated that it encountered “soft zones” with SPT N–values of 5 bpfin the Upper Sands at ESP boreholes B-1001, B-1004, B-1005, and B-1006. The applicant alsostated that if these kinds of soil are saturated with water they would liquefy during certainseismic events, which may result in surface settlement of several inches. The applicant thenreferred to its RAI 2.5.4-2(a) response, which provided further details about the extent of thesoil replacement in the power block area that will occur during the COL stage.
After reviewing the applicant’s response to RAI 2.5.4-3, the staff concludes that, because theextent of the excavation and backfill will be limited in both the vertical and horizontal directionsat the ESP site, it is not clear from the response that the purpose of the placement of backfillmaterial is to eliminate the existence of such soft zones located outside the foundation area. Although these soft zones are outside of the immediate foundation area, these soft zones canstill have potential adverse impacts on the foundation and the structures of the nuclear powerplant. Since the applicant, in its response, committed to take six more deep borings (250ft to400 ft deep) during the COL subsurface investigation, and this information is not necessary todetermine whether 10 CFR Part 100 is satisfied, the issue of confirming the locations of the softzones and to evaluate the potential impact of the soft zones on the foundation and structures isCOL Action Item 2.5-2.
In RAI 2.5.4-7, the staff asked the applicant to explain why the undrained shear strength values(7.2 kpa (150 psf) to 205.9 kPa (4300 psf)) from the unconsolidated undrained tests performedon the Blue Bluff Marl samples were significantly lower than the SSAR specified design value,478.9 kPa (10,000 psf), and to explain why these values differed substantially from the values(12.0 kpa (250 psf) to 23,946.4 kPa (500,000 psf)) obtained from previous investigations forUnits 1 and 2. The staff also asked the applicant to justify the use of a 478.9 kPa (10,000 psf)design value based on the SPT N-values measured during the ESP investigations. In itsresponse to RAI 2.5.4-7, the applicant stated that the laboratory measurements of undrainedshear strength for the Blue Bluff Marl (Lisbon Formation) yielded low values because itperformed the tests using one confining pressure corresponding to the overburden pressure. The applicant also listed some qualitative factors to explain why these laboratory values werelow. These factors included (1) being unable to push the CPTs below the Barnwell Group andinto the Lisbon Formation (Blue Bluff Marl), (2) Shelby tubes being unable to penetrate into theLisbon Formation without being damaged, which indicated that the soils were very hard, and (3)possible disturbance of samples obtained by pitcher barrel due to sampling, storage, andtransportation processes. Therefore, the applicant adopted an undrained shear strength designvalue for the Blue Bluff Marl from the FSAR for VEGP Units 1 and 2. The applicant furtherprovided empirical correlations between the PI value, SPT N-value, shear wave velocity, andthe undrained shear strength to justify the use of the SSAR design value of 478.9 kPa (10,000psf).
From its review of the applicant’s response to RAI 2.5.4-7, the staff finds that the qualitative andquantitative information provided by the applicant do not justify the use of the SSAR designstrength value of 478.9 kpa (10,000 psf) for the Blue Bluff Marl, based on the following fiveconsiderations:
1. The design strength value obtained from the previous investigation for Units 1 and 2was generated using different regulatory requirements, different industry standards, and

2-364
different testing technologies. The applicant can use the data or engineering valuesfrom the previous investigation as a reference to support the current decision, but maynot use the data as a direct input to calculate engineering parameters or previousengineering values directly for the ESP site.
2. As for the qualitative reasoning presented by the applicant, being unable to push theCPT and Shelby tubes through the Blue Bluff Marl does not justify the applicant’s use ofa design strength value much higher than the values obtained from the testing. According to Appendix 2.5 A to the SSAR, because soil samples collected from the BlueBluff Marl contain gravels, it is possible that the CPT and Shelby tubes engaged gravelscausing it to be difficult for them to push through the soil. Therefore, this factor does notsupport the adoption of a specific value of 478.93 kPa (10,000 psf) as the design shearstrength for the Blue Bluff Marl.
3. If, as the applicant implied, the samples used in the ESP tests were disturbed becauseof the sampling, storage, and transportation processes, then there would be no reliableESP laboratory test results to support the determination of the design value for the ESPsite.
4. The applicant did not justify the applicability of the empirical correlations used in itsresponse, such as the correlations between the undrained shear strength and PI,N-value, or shear wave velocity. Specifically, Mayne (2006) developed the correlationbetween shear wave velocity and shear strength from one group of clays, and theapplicant used this correlation in its response to RAI 2.5.4-7, but this correlation may notbe applicable to the Blue Bluff Marl at the ESP site. Furthermore, Mayne recentlyrecommended another correlation developed by Laval University Group (2007) based ondata from three groups of clays. This correlation resulted in a lower shear strengthvalue than the one originally developed by Mayne (2006).
5. Even if an empirical correlation is applicable, the applicant did not use appropriate inputparameters. The applicant, instead used inappropriate input parameters, based on verylimited data, and values which vary significantly. For example, the design PI value of 25is an average value based on 18 data points ranging from 5 to 58, with 3 points above50. The applicant obtained the N-value 80 from a total of 58 samples; among thesamples there were only 23 actual measured N-values, ranging from 27 to 81. Theapplicant extrapolated the N-values linearly for 35 measurements in which the samplerdid not penetrate 12 inches, and most of those data ended up having the cutoff value of100. As mentioned previously, most of the 35 SPT measurements did not penetrate12 inches because the samplers were in contact with gravels. Therefore, the averageN-value does not meaningfully represent the general soil properties due to the lack ofactual measurement and possible gravel engagement during the SPT tests.
Based on the above considerations, the staff concludes that the applicant did not providesufficient data to reliably derive the undrained shear strength value for the Blue Bluff Marl forthe design. This is Open Item 2.5-12.
2-365
In RAI 2.5.4-8, the staff asked the applicant for the following:
1. a description of the previous laboratory testing methods and results which indicate thatthe Blue Bluff Marl is highly preconsolidated
2. justification for the assumption of an undrained shear strength of 766.3 kPa (16,000 psf)
while the undrained unconsolidated test results yielded values from 7.2 to 205.9 kPa(150 to 4,300 psf)
3. justification for the conclusion that “the pre-consolidation pressure of the Blue Bluff Marl
was estimated to be 3831.4 kPa (80,000 psf)”
4. justification for the conclusion that “settlements due to loadings from new structureswould be small due to this pre-consolidation pressure” for the Blue Bluff Marl
In its response to RAI 2.5.4-8, the applicant provided the following information:
1. The original data and interpretation were based on laboratory tests performed for VEGPUnits 1 and 2, which included 191 one-point unconsolidated undrained triaxial tests and38 consolidation tests. It used vertical pressures that reached 3065.1 kPa (64000 psf)to perform consolidation tests for all 38 samples. Most of the test results (void ratioversus vertical effective stress curves) showed very flat curves which indicated that thepreconsolidation pressure had not been achieved.
2. The undrained shear strength of 766.3 kPa (16,000 psf) was an average value based onVEGP Unit 1 and 2 test data calculated from 185 one-point unconsolidated undrainedtriaxial tests that disclosed undrained shear strength values of less than 2,394.6 kPa(50,000 psf).
3. The applicant used the Skempton (1957) method to estimate the preconsolidationpressure of the Blue Bluff Marl by relating the preconsolidation pressure to the PI valueand the undrained shear strength. The applicant concluded that the Lisbon Formationwas highly overconsolidated because its calculations showed that the overconsolidationratios (OCRs) were in the range of 3.6 to 5, and most of the consolidation test results on38 samples from the Lisbon Formation, reported in Bechtel (1974b), showed very flatcurves which indicated that the preconsolidation pressure exceeded 3,065.1 kPa(64,000 psf).
4. The applicant also concluded that the settlement due to loadings from new structureswould be small based on observation of VEGP Units 1 and 2 and that the settlementswould take place during the construction phase.
Based on its review of the applicant’s response to RAI 2.5.4-8, the staff finds that it isinappropriate to use the average undrained shear strength value for VEGP Units 1 and 2 as aninput value to calculate preconsolidation pressure and OCRs for the Blue Bluff Marl at the ESPsite. The staff finds it inappropriate because the previous value was obtained based ondifferent regulatory requirements, regulatory guidelines, industry standards, and testingtechnologies. In addition, the spatial variation of the soil properties also makes reliance on theVEGP Units 1 and 2 values inappropriate. Moreover, the previous shear strength value differs

2-366
significantly from the one obtained during the ESP testing. Therefore, the applicant did nothave sufficient sampling and testing results to reliably derive the input undrained shear strengthused in calculating the precoconsolidation pressure and OCRs of the Blue Bluff Marl. The issuediscussed above is designated as Open Item 2.5-13.
In RAI 2.5.4-9, the staff asked the applicant to clarify how the effective angle of internal frictionwas determined for the soils underlying the ESP site. The applicant responded that it estimatedthe effective angle of internal friction of 34E using an empirical correlation associated with SPTN-values (Bowles 1982). From its review of the applicant’s response, the staff considers thatthe internal friction angle calculated based on SPT N-values varies significantly, depending onthe correlations used. For example, for N-values between 10 and 40, the corresponding soilinternal friction angle values vary from 30E to 36E (Peck 1974) or from 35E to 40E (Bowles1982). More importantly, the N-values measured for the ESP site are all below 20 (from 3 to19), according to SER Table 2.5.4-4. Therefore, the use of a friction angle of 34E based on anN-value of 25 for the Upper Sand Stratum appears to be inappropriate. The staff concludesthat the applicant did not provide reliable effective angles of internal friction for the subsurfacesoils because it did not have sufficient SPT N-values from the ESP investigation to support itscalculation. The internal friction angle for the subsurface soils is one of the input parameters incalculating bearing capacity and settlement, as well as liquefaction potential. The issueregarding the effective angles of internal friction for the subsurface soils is designated as OpenItem 2.5-14.
In RAI 2.5.4-10, the staff asked the applicant to provide relative density for the Blue Bluff Marl. The applicant stated in its response that the design value of the undrained shear strength forthe soil was 478.9 kPa (10000 psf) and its preconsolidation pressure could be as high as3831.4 kPa (80000 psf); therefore, the Blue Bluff Marl was highly overconsolidated andbehaves as hard clay or soft rock material, not as a granular material. The applicant furtherstated that relative density did not apply to the Blue Bluff Marl. From its review of theapplicant’s response, the staff concludes that test data for the Blue Bluff Marl are very limited. As described in the SSAR, the limited laboratory test data showed that the percent fines contentranged from 24 to 77 percent, the moisture content ranged from 14 to 67 percent, and the PIranged from nonplastic to 58 percent. Each of the above-mentioned parameters does notexclude the possibility of the marl being liquefied. In addition, the undrained unconsolidatedtests yielded undrained shear strength values from 7.2 to 205.9 kPa (150 to 4300 psf), whichsignificantly differ from the design shear strength value of 478.9 kPa (10000 psf), as indicatedin the discussion of RAI 2.5.4-7. Therefore, the applicant’s response did not support itsconclusion that the Blue Bluff Marl will behave as a hard clay or soft rock material because it didnot use its own ESP soil engineering values to calculate relative density for the Blue Bluff Marl. The issue of demonstrating that the Blue Bluff Marl will behave as a hard clay or soft rockmaterial thus not need to be addressed using relative density is designated as Open Item 2.5-15.
In RAI 2.5.4-11, the staff asked the applicant to explain: (1) why it used the Davie and Lewis’(1988) relationship to estimate the high strain elastic modulus (E) for the Upper and LowerSand Strata underlying the ESP site; (2) what the consensus is about using the Davie andLewis relationship between SPT and elastic modulus E; (3) and the extent of the application ofthe Davie and Lewis relationship. In response to RAI 2.5.4-11, the applicant stated that Bechtelused the relationship extensively to estimate settlement when compared to observed

2-367
settlements for a wide range of foundation sizes on granular materials from clean sands to siltysands to gravels. The Upper Sand Stratum is a medium-dense, silty sand and the Lower SandStratum is a very dense silty sand. Therefore, the applicant believed that the Davie and Lewisrelationship is applicable to those sands. In addition, the applicant found that the Davie andLewis relationship provided an E value that was closer to the median value of five differentrelationships for both sand strata than the four other E and N (the SPT N-value) relationshipsdetailed in SER Table 2.5.4-4, which is taken from the applicant’s response to RAI 2.5.4-11. The applicant also pointed out that Davie and Lewis’ relationship provided reasonablepredictions of settlement when compared to measured settlements, and it has a reasonableconsensus.
Table 2.5.4-4 - Summary of Calculation of Elastic Modulus E
Based on its review of the applicant’s response to RAI 2.5.4-11, the staff concurs with theapplicant’s conclusion about the applicability of the Davie and Lewis’ relationship in estimatingelastic modulus E. However, the applicant needs to use appropriate SPT N-values to obtain areasonable E value. Since the N-values obtained from the ESP investigation and the designundrained shear strength values determined by the applicant for the ESP soils are not reliablefor very limited data, the applicant did not have sufficient site-specific data to justify thedetermination of the design parameter E for the Upper and Lower Sand Strata. The issue ofusing appropriate SPT N-values to determine a reasonable elastic modulus value E for theUpper and Lower Sand Strata is designated as Open Item 2.5-16.
In RAI 2.5.4-12, the staff asked the applicant to explain how it determined the unit weight valuesfor different soils and why there was a discrepancy between the average values given in theSSAR text and those listed in SSAR Table 2.5.4-1. The applicant explained in its response thatit determined the unit weight values based on the laboratory test during the ESP subsurfaceinvestigation. However, the applicant used the average values of unit weight based on VEGPUnit 1 and 2 laboratory test results because there were more test data available, despite resultsthat differed from those obtained from ESP tests. The staff considers that the unit weightvalues for underlying soils are very basic soil property parameters used in manycalculations/analyses. However, the applicant did not have sufficient data to calculate the unitweight values for the ESP subsurface soils and instead used the values from previous

2-368
investigations. The staff concludes that it is not acceptable for the applicant to use thesepreviously determined engineering parameters in this manner. This issue is designated asOpen Item 2.5-17.
The staff noted that, in SSAR Section 2.5.4.2.5.3, the applicant stated that chemical tests werenot included in the ESP laboratory testing program. The SSAR also states that chemical testswould be required for the backfill materials placed in proximity of planned concrete foundationsand buried metal piping, and commits to conduct these chemical tests in the COL investigationphase. The need to provide chemical test results on the backfill is COL Action Item 2.5-3.
As discussed above, the staff concludes that the applicant performed limited field andlaboratory tests during the ESP subsurface investigation, and therefore, did not providesufficient and reliable data in characterizing the engineering properties of subsurface materials. Instead, the applicant relied significantly on the test data for the existing VEGP Units 1 and 2(obtained more than 20 years ago) to determine engineering properties of the subsurfacematerials. Therefore, the applicant’s ESP investigation data became reference data and VEGPUnits 1 and 2 became the critical input data used to calculate the soil engineering properties. Considering that the engineering properties of the subsurface material, especially the load-bearing layers, provide critical information on bearing capacity and foundation settlement, andthat those parameters directly relate to soil-structure interaction (SSI) analysis as well asfoundation stability, the information provided by the applicant is inadequate to establish reliableengineering properties for the subsurface material at the ESP site. The staff concludes that theapplicant did not conduct sufficient field and laboratory tests to reliably determine subsurfacesoil static and dynamic properties.
2.5.4.3.3 Foundation Interfaces
Section 2.5.4.3 of NUREG-0800 directs the staff to compare the applicant’s plot plans andprofiles of seismic Category I facilities with the subsurface profile and material properties. Based on the comparison, the staff can determine if (1) the applicant performed sufficientexploration of the subsurface materials and (2) if the applicant’s foundation design assumptionscontain an adequate margin of safety.
In RAI 2.5.4-20, the staff asked the applicant to justify why it did not provide the relationship offoundations to the underlying materials in the form of plot plans and profiles, the foundationstability with respect to ground water conditions, and a detailed dewatering plan. In itsresponse, the applicant stated that it would provide this information as part of a COLapplication, once more details become available regarding the foundation and site interaction. The staff agrees with the applicant that this design-related information is not necessary todetermine whether 10 CFR Part 100 is satisfied. This is COL Action Item 2.5-4.
2.5.4.3.4 Geophysical Surveys
The staff focused its review of SSAR Section 2.5.4.3 on the adequacy of the applicant’sgeophysical investigations to determine the soil and rock dynamic properties. The applicantconducted three down-hole seismic CPT tests and five suspension P-S velocity tests during theESP site investigation. The applicant compared the soil and rock dynamic properties obtained
2-369
from the tests with the results from the previous geophysical surveys for the existing Units 1and 2.
In RAI 2.5.4-3, the staff asked the applicant to explain how it developed the base case shearwave velocity profile based on only 12 borings, since most of them did not go deeper than 91.4meters (300 ft). In its response to RAI 2.5.4-3, the applicant stated that it developed the basecase shear wave velocity profile associated with the Lisbon Formation (Blue Bluff Marl), StillBranch Formation, and the upper portion of the Congaree Formation from the results of thethree suspension P-S velocity logging tests performed at the ESP site. One of the suspensionP-S velocity logging tests extended into bedrock below the Lower Sand Stratum, and theapplicant used those results to derive the base case shear wave velocity profile below the top ofthe Congaree Formation. The applicant explained that its randomization model, which capturesthe uncertainty in the base case shear wave velocity profile for the in situ soils, used logarithmicstandard deviation of shear wave velocity as a function of depth, which is set to values obtainedfrom soil randomization performed at SRS. After reviewing the applicant’s response, the staff,however, finds that shear wave velocities vary significantly among the three profiles (ESP, VEGP,Units 1 and 2 and SRS, most of them terminate at a depth of about 85.34 to 60.96 meters (280 to300 ft)), shear wave velocities measured from down-hole seismic tests are lower than thesuspension P-S velocity measurements. Furthermore, the shear wave velocities from previousinvestigations were relatively lower than those obtained from the ESP investigations. Therefore,the staff concludes that the applicant did not provide sufficient shear wave velocity measurementsto define the site-specific shear wave velocity profile. This is Open Item 2.5-18.
Based on its review of SSAR Section 2.5.4.4 and the applicant’s response to RAI 2.5.4-3,described above, the staff concludes that the applicant used various methods to determinecompressional and shear wave velocities, including some of the latest technologiesrecommended in RG 1.132. However, the applicant did not provide sufficient shear wave velocitymeasurements to define the site-specific shear wave velocity profile and address the velocitydifference from different methods.
2.5.4.3.5 Excavation and Backfill
The staff reviewed SSAR Section 2.5.4.5 focusing on the applicant’s description of anticipatedfoundation excavations for safety-related structures, backfills, and slopes; excavation methodsand stability; backfill sources and quality control; and control of ground water during excavation. The applicant stated that it would remove the Upper Sand Stratum and perform filling from the topof the Blue Bluff Marl to the bottom of the containment and auxiliary buildings at a depth of about12.19 meters (40 ft) below the final grade. Filling would continue up around those structures tofinal grade. The excavation would be open-cut, with slopes no steeper than2:1 (horizontal-to-vertical ratio). The applicant indicated that it would follow the guidelines used forVEGP Units 1 and 2 to develop excavation and backfill plans during the COL application phase.
Since there was no specific description on excavation, in RAI 2.5.4-2, the staff asked theapplicant to clarify whether the excavation and backfill would only cover the footprint of the powerblock or extend to a certain distance beyond the foundation footprint. In response to RAI 2.5.4-2,the applicant explained that safety-related footprints of the future Units 3 and 4 would have tworespective backfilled excavations, and those excavations would extend beyond their respectivepower block footprints. The applicant established the minimum lateral extent of each excavation

2-370
by determining the stress zone as defined by a 1:1 (horizontal-to-vertical) slope ratio, extendingfrom the bottom of the turbine, containment, and auxiliary building foundations. The approximatebottom of the foundation elevations would be 65.8 meters (216 ft) above the msl for the turbinebuilding, 54.9 meters (180 ft) above msl for the containment, and 39.6 meters (130 ft) above mslto the top of the Lisbon Formation (Blue Bluff Marl) for the auxiliary buildings. The stress zone atthe top of the Lisbon Formation would extend approximately 26.2 meters (86 ft) horizontallybeyond the footprint of the power block structures. The applicant considered that the turbinebuilding foundation governed this horizontal extension (highest foundation), therefore the 26.2-m(86-ft) extension was conservatively set for all four sides of the excavation. The applicant plannedto backfill the entire excavation, including the power block footprint, stress zone, and areasbeyond the stress zone, using compacted structural fill.
Due to the concern of a possible backfill impact on the seismic response evaluation of the site andstructures, in RAI 2.5.4-2, the staff also asked the applicant whether it would implement theseismic hazard calculations to the free-ground surface, including the Barnwell Group in the basecase site soil column, if the site excavations were not to extend significant distances to the side ofthe plant. In addition, the staff asked the applicant to explain the basis for its column analysis thatpresumed uniform fill in all horizontal directions, while the actual excavation and backfill wouldextend only to the immediate vicinity of the plant. In its response, the applicant stated that the siteexcavations would extend to significant horizontal distances from the structures. With the base ofthe excavation extending approximately 26.2 meters (86 ft) outside of the building footprint, andwith the excavation side slope ratio at 2:1(horizontal to vertical), the structural fill would extendmore than 54.9 meters (180 ft) beyond the containment and auxiliary buildings at their foundationlevel and would extend more than 76.2 meters (250 ft) beyond the edge of the turbine building atits foundation level.
Since there was no specific description regarding the backfill compaction control, in RAI 2.5.4-2,the staff also asked the applicant to explain how it would implement compaction control if thebackfill was to contain as much as 25 percent fines content. In its response, the applicant statedthat it used sand and silty sand with no more than 25 percent fines, obtained from onsite sources,as structural backfill for Units 1 and 2, and that it would use the same structural backfill criterionfor Units 3 and 4. It would implement compaction controls for placement of the backfill through anindependent soil testing firm. This testing firm would maintain an onsite soils testing laboratory tocontrol the quality of the fill material and the degree of compaction. The testing firm wouldmonitor the compaction through field density tests performed at a minimum frequency of one testper 928 square meters (10,000 square ft) per lift of placed fill. In addition, the applicant committedto develop more detailed testing compaction control criteria during the COL phase. Because thesite excavation and backfill will not be performed until the COL stage, the staff considers that thisdesign-related information is not necessary to determine whether 10 CFR Part 100 is satisfied.
After reviewing the responses from the applicant to RAI 2.5.4-2, the staff concludes that, althoughthe applicant provided more information on the extent of excavation, backfill material, and itscompaction control, the applicant needs to consider some related issues during the COL stageincluding (1) the stress zone described in the applicant’s response to RAI 2.5.4-2 was based onnormal static stress evaluations, but the applicant needs to consider both static and dynamic load-induced stresses and (2) since the applicant indicated that excavations would extend from about26.2 meters (86 ft) outside of the building footprint with 2:1 (horizontal-to-vertical) side slope ratiosand then extend away from the power block, the applicant needs to include the backfill materialplaced in and around the power block structures in the structural model when evaluating SSI, as

2-371
indicated in the currently revised Section 3.7 of NUREG-0800. The applicant commitment toprovide detailed excavation and backfill plans during the COL stage is COL Action Item 2.5-5.
Because the applicant did not describe the determination of shear wave velocity for the backfill, inRAI 2.5.4-4, the staff asked the applicant to explain how it would determine shear wave velocityvalues at depths of 15.2 meters (50 ft) and deeper for the backfill materials and whether itconsidered the effects of confinement. In its response, the applicant reiterated this statementfrom SSAR Section 2.5.2.5.1.2.1.1:
Shear-wave velocity was not measured for the compacted backfill during the ESPsubsurface investigation (APPENDIX 2.5A). Interpolated values based onmeasurements made on fill for existing Units 1 and 2 (Bechtel 1984) are usedinstead.
The applicant also clarified that the measurements made of backfill soil for existing Units 1 and 2were laboratory measurements using resonant column tests. The applicant developed shearwave velocity profiles for the backfill using equations presented in the response.
After reviewing the response to RAI 2.5.4-4, the staff finds that the applicant was attempting toapply the estimated shear wave velocity from the backfill for the existing units to the backfill for theESP site. But the equation used in the estimation dated back to the 1960s and there wassignificant variability, or uncertainty, for the parameter K2 in the equation. The calculation also didnot account for confinement effects. Since the ability to show that the backfill meets the minimumshear wave velocity requirement with minimum in situ variability is a major concern in the COLphase, and the procedures presented in the SSAR did not provide such information, additionalinformation to address the backfill shear wave velocity should be submitted in the COLapplication. This is COL Action Item 2.5-6.
In summary, based on a review of SSAR Section 2.5.4.5 and the applicant’s responses toRAI 2.5.4-2 and RAI 2.5.4-4 described above, the staff believes that the applicant did not providedetailed information on excavation and backfill plans due to the limited knowledge of the exactlocation of reactors and fill materials. Therefore, the staff cannot fully evaluate the applicant’sexcavation and backfill plans until it submits this related information. Regulatory Position C.6 ofRG 1.132 recognizes that there may be limitations on the extent of geologic mapping that may beperformed prior to a site being approved under the 10 CFR Part 52 licensing procedures. However, the need for construction mapping applies equally under the ESP procedures. Toaddress this need for construction mapping, the staff is proposing to include a permit conditionrequiring that the ESP holder or an applicant referencing the ESP perform geologic mapping offuture excavations for safety-related structures, evaluate any unforseen geologic features that areencountered, and notify the NRC no later than 30 days before any excavations for safety-relatedstructures are open for NRC’s examination and evaluation. This is Permit Condition 2.
2.5.4.3.6 Ground Water Condition
In SSAR Section 2.5.4.6, the applicant provided some basic ground water conditions based on thewater well observations and a summary of the dewatering plan implemented for VEGP Units 1and 2. The staff finds that this information is necessary to understand the ground waterconditions and potential dewatering plan at the ESP site.
2-372
In RAI 2.5.4-6, the staff asked the applicant to explain the dewatering procedures it will use for thenew units. In its response to this RAI, the applicant stated that it would implement the samedewatering program as that developed for the VEGP Units 1 and 2 but with some deviations. Itconsidered the dewatering program deployed at Units 1 and 2 to be successful, and subsurfaceconditions at the ESP site and at Units 1 and 2 are similar.
After reviewing the applicant’s response, the staff concludes that, since the applicant has notfinally determined the reactors’ location within the ESP site and does not have a site-specificdewatering program, the staff cannot evaluate the ground water conditions as they affect theloading and stability of foundation materials. The staff is also unable to assess the applicant’sdewatering plans during construction as well as ground water control throughout the life of theplant. Because the plant specific dewatering program cannot be planned until the reactor locationis decided, the staff considers that this design-related information is not necessary to determinewhether 10 CFR Part 100 is satisfied. Therefore, the need of the submission of ground watercondition evaluations and a detailed dewatering plan during the COL stage is COL Action Item2.5-7.
2.5.4.3.7 Response of Soil and Rock to Dynamic Loading
The staff reviewed SSAR Section 2.5.4.7 focusing on how the applicant developed the base shearwave velocity profile and modeled soil modulus reduction and damping with respect to cyclicshear strain. The applicant derived shear modulus for the soil strata from the relationship relatedto the unit weight and shear wave velocity, as well as the dynamic shear modulus reduction anddamping ratio curves derived from EPRI (EPRI TR-102293 1993). The applicant used theSHAKE2000 (Bechtel 2000) computer program to evaluate the site dynamic responses.
The applicant derived ESP soil shear modulus degradation and damping curves from the curves developed by EPRI (1993). In RAI 2.5.4-5, the staff asked the applicant to justify its application ofthe EPRI curves to fine-grained soils. In its response, the applicant stated that EPRI (1993)developed degradation curves for soils from gravels to high plasticity clays, and thus it wasappropriate to apply the curves to fine-grained soils. EPRI (1993) presented fine-grained soils inFigures 7.A-16 (shear modulus reduction curves) and 7.A-17 (damping ratio curves) in terms ofsoil plasticity and required the use of the PI. The applicant referred the staff to its response toRAI 2.5.4-17 for more details on how it derived the degradation curves from the EPRI (1993)curves. The applicant further indicated that it would verify the soil degradation relationships forfine-grained soil (and coarse-grained soils) used in the SSAR by laboratory testing during COLsubsurface investigation.
After reviewing the applicant’s response and its references, the staff finds that Section 7A.6 ofthe EPRI (1993) report recommends the modulus degradation and hysteretic damping strain-dependent curves for generic CEUS sites. According to the report, these curves are intendedfor gravelly sands to low plasticity silty or sandy clays and should not be applied to either verygravelly or very clayey deposits. The curves presented in the report for silts and clays of highplasticity are significantly different from those for sandy soils. In its response to RAI 2.5.4-10,however, the applicant indicated that the Blue Bluff Marl “is described as hard, slightly sandy,cemented calcareous clay, and with less than 50% fine material,” which is different from thetype of materials for which the curves are intended. Therefore, the applicant did not adequatelyexplain why it is appropriate to apply those relationships to the silts and clay soils at the ESP
2-373
site. The report further states that, while the generic curves are appropriate for preliminary sitestudies, one should use site-specific data for final evaluations. In conclusion, the staff concurswith the applicant that it needs to verify the soil modulus degradation and damping curves.However, this verification should not wait until the COL stage. Without site-specific soilmodulus degradation and damping curves, the determination of site-specific GMRS (SSE) isinadequate. To provide site-specific soil degradation and damping ratio curves for the site-specific soil amplification calculation discussed in SER Section 2.5.2 is Open Item 2.5-19.
Because the applicant stated in the SSAR that it used values of shear modulus and dampingratio provided by Silva (2006) to extend the EPRI curves beyond the 1- to 3.3 percent strainlevel, in RAI 2.5.4-13, the staff asked the applicant to justify how it extended the values beyondthe 1 percent strain level and to provide a complete description and supporting data. In itsresponse, the applicant stated that, even though it extended the EPRI curves beyond the 1percent strain level, the maximum strains calculated during the site amplification analysesremained below 1 percent. But, the applicant then stated that it would revise SSAR Sections2.5.2.5.1.5, 2.5.4.7.2.1, and 2.5.4.7.2.2, along with associated tables and figures, to show thedegradation curves only at a 1- percent or less cyclic shear strain. Due to the applicant’scommitment to revise the curves back to a 1 percent strain level without extrapolation, the staffconcludes that this RAI is not resolved until the revised SSAR sections are submitted for review. This is Open Item 2.5-20.
In RAI 2.5.4-17, the staff asked the applicant to provide a complete description, includingsample calculations, to show how it derived the shear modulus reduction and damping curvesand how it incorporated uncertainties in the site characteristics into the curves’ development. The applicant explained in its response that it used the shear wave velocity to calculate the low-strain dynamic shear modulus (Gmax) only. The EPRI (1993) curves simply showed the ratioG/Gmax versus cyclic shear strain, regardless of the initial value of Gmax. The shear modulusreduction and damping ratio curves for cohesionless materials were based on confiningpressure at depth, or simply depth, but were based on the PI for cohesive material like BlueBluff Marl. The applicant then described how it derived the shear modulus reduction anddamping ratio curves from the EPRI (1993) curves shown in SER Figures 2.5.4-5 to 2.5.4-8. The applicant described how it derived shear modulus reduction and damping curves for eachlayer included in the base shear wave velocity profile. The applicant also stated that, “shearmodulus reduction and damping curves will be obtained using undisturbed samples collectedduring the COL subsurface investigation.”
In addressing how it incorporated uncertainties, the applicant stated that it extended EPRIshear modulus reduction curves from the strain level of 1 percent to 3 percent and that itincorporated uncertainties in the site parameters during the randomization process. Figures2.5.4-5 through 2.5.4-8 show shear modulus reduction curves and damping ratio curves foreach layer in the profile. The applicant randomized the shear modulus reduction and dampingratios at one strain level using log-normal distributions with median values given by thecorresponding base-case curves and logarithmic standard deviations taken from the statisticalsummaries obtained by Costantino (1997) for natural soils. For the engineered backfill, itreduced these standard deviations by one-third to account for a more homogeneous soil mass. It used a hyperbolic parametric form to generate the shear modulus reduction and dampingratios at other strains from the randomized values obtained above. The applicant stated thatthis approach produced realistic curves with logarithmic standard deviations that approximate

2-374
the Costantino (1997) values over a wide range of strains. It assumed that the normal randomvariables associated with the log-normal shear modulus reduction and damping ratios had acorrelation coefficient of -0.75.
After reviewing the responses from the applicant, the staff reached the following conclusions:
1. Although the EPRI (1993) curves were up to the 1 percent strain level, the applicant didnot provide information on the strain levels associated with the 10-4, 10-5, and 10-6
uniform hazard response spectra (UHRS) at the bedrock in the site response analysesand did not indicate whether the laboratory data developed during the SRS testingprogram carried to those levels of strain.
2. The adequacy of the equivalent-linear approximations for site response deteriorates asstrain levels exceed about 0.5 percent effective shear strain. The applicant did notjustify the applicability of the equivalent-linear method used in the SHAKE2000 modelanalysis if the strain levels were to exceed 1 percent.
3. In its response to RAI 2.5.4-13, the applicant indicated that it would revise the3.3 percent strain level extrapolation back to 1 percent for the EPRI (1993) modulusreduction and damping curves, however, its response to this RAI indicated otherwise.
4. The applicant needs to demonstrate that it can confidently obtain undisturbed samplesfor deeper depths (e.g., in the Blue Bluff Marl and lower sands of the Congaree andLower Snapp formations) for use in site response and SSI studies.
5. The applicant also needs to test disturbed samples of the compacted fill material toestimate appropriate modulus reduction and damping properties for the SSI analysis.
6. Other RAI responses indicated that the applicant used both SRS and EPRI (1993)models in the site response analyses and weighted them equally. Considering thatsite-specific data are almost always desired over generic models, the applicant needs toevaluate the strain level difference in the surface UHRS at different exceedance levelsthat result from application of these different models and to justify if the equal-weightingapproach is appropriate.
Based on its review of SSAR Section 2.5.4.7, the related references, and the applicant’sresponses to RAIs described above, the staff concludes that the applicant did not havesufficient site-specific laboratory data to support the determination of the site response todynamic loading. Although the applicant committed to provide the site-specific modulusreduction and damping curves during the COL stage, this issue, raised with a differentperspective from the RAI 2.5.4-13 needs to be resolved in the ESP application to providesite-specific shear modulus reduction and damping curves for the site SSE determination. Therefore, as stated earlier, resolving this issue is designated as Open Item 2.5-19.

2-375
2.5.4.3.8 Liquefaction Potential
In its review of SSAR Section 2.5.4.8, the staff evaluated the applicant’s description onliquefaction potential and its plan on future liquefaction study. The staff’s review focused on theapplicant’s conclusion that liquefaction could occur only in the Upper Sand Stratum, based onthe previous investigations and excavation completed for the VEGP Units 1 and 2.
In RAI 2.5.4-14, the staff asked the applicant to justify why it did not perform liquefactionanalyses on the Blue Bluff Marl since the marl has a relatively high variable fines content(24–77 percent) and saturation level (14–67 percent) and a potentially high ground motion levelat the site. In its response, the applicant first discussed the liquefaction potential for the BlueBluff Marl (Lisbon Formation) based on its material and age and then examined the fieldstrength and shear wave velocity results to determine whether the marl could liquefy based onthese results.
The applicant stated that, although the Blue Bluff Marl frequently contained less than50 percent of fine material, it had the appearance and characteristics of a calcareous claystoneor siltstone and is a hard, slightly sandy, cemented calcareous clay. Its design undrained shearstrength was set as 478.93 kPa (10000 psf) and its preconsolidation pressure could be as highas 3831.42 kPa (80000 psf) (i.e., the marl is a highly overconsolidated material). Although itwould be below the ground water table, its compressed structure would prevent it from havingthe free water characteristic of a saturated granular material. The applicant then concluded thatthe Blue Bluff Marl is not a material with liquefaction potential, regardless of the ground motionlevel. The applicant further indicated that liquefaction resistance would increase markedly withgeologic age. Based on Youd et al. (1997, 2001), Pleistocene (1.8 mya to 10,000 year)sediments were more resistant, and pre-Pleistocene sediments were generally immune toliquefaction. The Blue Bluff Marl’s age is late middle Eocene (40 to 41 million years old), mucholder than Pleistocene.
The applicant also stated that, based on Youd et al. (2001), there are thresholds for theN-values, tip resistance, and shear wave velocity beyond which the material is considerednonliquefiable (e.g., a sand with 35 percent or more fines or a soil with a corrected N-value overabout 21 are not liquefiable). Of the 58 N-values measured in the marl for the ESPinvestigation, 5 were below 50, ranging from 27 to 46. Thus, if the marl were a potentiallyliquefiable material, a liquefaction analysis would be run for these five samples. An initialanalysis of these five samples showed factor-of-safety values in excess of the accepted1.35 value in all cases. All of the CPTs that penetrated into the marl had refusal at or near thetop of the stratum. Thus, measured tip resistance showed the material to be nonliquefiable. The typical shear wave velocities in the marl ranged from 426.72 to 807.72 m/s (1400 to 2650ft/s). When corrected for overburden, these values would range from about 301.75 to 512.06m/s (990 to 1680 ft/s). Youd et al. (2001) indicated that, for a sand with 35 percent or morefines, soils with a corrected shear wave velocity in excess of about 190.5 m/s (625 ft/s) werenonliquefiable.
The applicant stated that, based on material and age, the Blue Bluff Marl does not have thepotential to liquefy, and the CPTs, as well as shear wave velocities, consistently indicated themarl is nonliquefiable material. In addition, the applicant pointed out that over 90 percent of the

2-376
SPT N-values indicated the marl as nonliquefiable material and the remaining N-values showedsatisfactory factors of safety.
After review of the applicant’s response, however, the staff is concerned that (1) the generalobservation of liquefaction occurrence with respect to age and material type does not excludethe liquefaction potential of the Blue Bluff Marl because of the limitation of the observations,such as the possible gravel engagement during the SPT and CPT tests, and (2) limited testdata, including N-values, tip resistance, and shear wave velocity, cannot reliably exclude theliquefaction potential for the Blue Bluff Marl. The staff concludes that limited data prevented theapplicant to make a conclusion on the liquefaction potential for the Blue Bluff Marl; therefore,the applicant does not have sufficient ESP soil property data to confirm that the Blue Bluff Marlis not liquefiable. This is designated as Open Item 2.5-21.
2.5.4.3.9 Earthquake Design Basis
SSAR Sections 2.5.2.6 and 2.5.2.7 present the applicant’s derivation of the SSE, andSection 2.5.2.8 presents the OBE. Sections 2.5.2.3.6 and 2.5.2.3.8 of this SER provide thestaff’s evaluation of the applicant’s determination of the SSE and OBE. Shear wave velocityprofiles, soil modulus reduction, and damping curves described in Section 2.5.4 are criticalinputs to the site seismic response and therefore to the SSE and OBE. This issue is discussedin detail in SER Section 2.5.2.
2.5.4.3.10 Static Stability
In its review of SSAR Section 2.5.4.10, the staff focused on the applicant’s evaluation ofbearing capacity and settlement of the bearing strata at the ESP site. The applicant used thefollowing assumptions in calculating soil-bearing capacity and structure settlement —(1) placing all safety-related structures on the structural backfill above the Blue Bluff Marl afterremoval of the Upper Sand Stratum; (2) placing the base of the containment and auxiliarybuilding foundations about 12.19 meters (40 ft) below final grade, or 15.3 to 18.3 meters (50 to60 ft) above the top of the Blue Bluff Marl Stratum; and (3) placing other foundations in thepower block area at depths of about 1.2 meters (4 ft) below final grade. The applicant modeledthe containment building mat as a circle with a diameter of about 43.3 meters (142 ft) placed ata depth of 12.0 meters (39.5 ft) below finish grade in the calculations. The applicantdetermined that the allowable bearing pressure was 1470.3 kPa (30700 psf) under staticloading conditions and 2203.1 kPa (46000 psf) under dynamic loading conditions. Thesettlement under an average bearing pressure of 239.5 kPa (50000 psf) was 41 mm (1.6 in.).
In RAI 2.5.4-15, the staff asked the following of the applicant:
1. Justify the adoption of the Peck et al. (1974) settlement and differential settlementvalues as guidelines which suggest total settlement of no more than 50 mm (2 in.), anddifferential settlement of no more than 19 mm (0.75 in.). For footings that supportsmaller plant components, the total settlement should be no more than 25 mm (1 in.),and the differential settlement no more than 13 mm (.5 in,).

2-377
2. Explain the main causes for exceeding these settlement values at the foundation levelsof Units 1 and 2 and whether it would take any measures to prevent settlements anddifferential settlements for the new units.
3. Justify the use of an average bearing pressure of 239.5 kPa (50000 psf) for thesettlement analyses of compacted fills
In its response to this RAI, the applicant stated the following:
1. The geotechnical community has widely accepted and used the Peck et al. (1974) totalsettlement guidelines of 25 mm (1 in.) for column footings and 50 mm (2 in.) for mats. When limiting foundation settlements to these values, differential settlements usually arevery small. The applicant further stated that, even if these settlement values wereexceeded, it would not necessarily have adverse effects on structures, especially forlarge mat foundations which can efficiently distribute structural loads to the soil. Theapplicant used the VEGP Units 1 and 2 as an example where the measured settlementsof the containment buildings ranged from 102 to 109 mm (4 to 4.3 in.)
2. It (the applicant) will not use the settlement guidelines from Peck et al. (1974) for Units 3and 4. The approach used for Units 3 and 4 consisted of estimating settlements forpower block structures and using them as design values. The “VEGP Report onSettlement” prepared by Bechtel in 1986 provides comparisons of measured versuscalculated settlements and concludes that the measured values did not exceedcalculated or design values. The applicant would reanalyze and employ correctivemeasures in the event that monitored settlements exceed the design values. Theapplicant committed to follow the same approach for Units 3 and 4 and to revise SSARSections 2.5.4.10.2 and 2.5.4.11 accordingly in the next revision to the ESP application.
3. It (the applicant) used a bearing pressure value of 239.5 kPa (50000 psf) in foundationsettlement analysis for illustrative purposes because no design value was availableduring the ESP. The applicant will revise the calculation using design values during theCOL application.
After reviewing the responses, the staff concluded the following:
1. A primary concern of potential total and differential settlements is how these settlementscompare with what the design of the reactor takes into consideration. It is important tocompare the estimated settlements, which are appropriate for evaluation of theacceptability of the site at the ESP stage, with those incorporated into the plant designto evaluate the degree of conservatism because there will be severe impact to thesafety of the SSCs once unexpected differential settlements occur.
2. The contact pressures associated with the planned reactor model are of interest andneed to be considered at the ESP stage to estimate potential settlement. Since the datafor a given reactor facility are available, the applicant should incorporate it into the siteevaluation.
Based on the above considerations and in lieu of the fact that large settlements were observedat VEGP Units 1 and 2, the staff concludes that the applicant did not demonstrate quantitatively

2-378
whether the observed large settlement that occurred at the existing VEGP units will occur at theVEGP site and have no impact on the new units. This is COL Action Item 2.5-8.
In RAI 2.5.4-16, the staff asked the applicant to justify not analyzing the stability of all plannedsafety-related facilities in terms of bearing capacity, rebound, settlement, and differentialsettlements with the consideration of dead loads of fills and the reactor facility, as well as thelateral loadings. In its response, the applicant explained that this kind of information is notavailable at the ESP stage. Based on the applicant’s response, the staff concludes that, sincethe applicant committed to provide more details regarding the bearing capacity, the staff agreeswith the applicant that this information will not be available until the COL stage, and considersthat this design-related information is not necessary to determine whether 10 CFR Part 100 issatisfied. This issue is designated as COL Action Item 2.5-9.
In RAI 2.5.4-18, the staff asked the applicant to provide detailed information on itsdetermination of the allowable bearing capacity value. In its response, the applicant provided adetailed description of bearing capacity evaluations based on the Vesic (1975) formula. Inaddition, the applicant later clarified that the calculated value was net allowable bearingcapacity, not the gross bearing capacity; therefore, the formula used in the actual calculationwas slightly different from that presented in the reference. From its review of the applicant’sresponse, the staff considers that the Vesic (1975) formula is based on primary assumptions ofgross shear failure of soils under the foundation. Although this allowable bearing capacityformulation is applicable for general foundation analysis, it is inappropriate to use it in nuclearpower plant foundation design. The control factors of allowable contact pressure for a largeand heavy structure typically are not general shear failure but are (1) settlements; (2) allowablepressures used in design of the wall/basemat intersection; and (3) toe pressures developedduring potential overturning and sliding of the facility. Based on the above considerations, thestaff concludes that the allowable bearing capacity value provided by the applicant is notappropriate when considering the expected governing issues controlling the site evaluation. This is Open Item 2.5-22.
Based on its review of SSAR Section 2.5.4.10 and the applicant’s responses to the RAIs, asdescribed above, the staff concludes that the applicant did not provide an adequate preliminaryassessment of the static stability of the ESP site. Although the applicant committed to providemore information in the COL phase, the applicant needs to resolve all open items related tosome key issues, such as bearing capacity evaluation and settlement, at the ESP stage.
2.5.4.3.11 Design Criteria
In SSAR Section 2.5.4.11, the applicant provided geotechnical design parameters, such asacceptable factor of safety against liquefaction, allowable bearing capacities, acceptable totaland differential settlements, and acceptable factor of safety against slope stability failure. Theapplication did not provide structural design criteria, such as wall rotation, sliding, oroverturning.
In RAI 2.5.4-19(a), the staff asked the applicant to justify not providing complete designparameters or actual design methods that will be employed in the geotechnical review. In itsresponse, the applicant stated that it would provide the information as part of the COLapplication, when the complete design criteria and actual design methods become available.

2-379
In RAI 2.5.4-19(b), the staff asked the applicant to explain why it did not provide factor of safetyfor slope stability in SSAR Section 2.5.5. In its response, the applicant stated that it wouldrevise SSAR Section 2.5.5 in the next revision of the ESP application to include the factors ofsafety for slope stability. On the basis discussed above, the staff considers that this issue willnot be resolved until the revised ESP application is submitted.
Based on its review of SSAR Section 2.5.4.11 and the applicant’s response to the RAI, the staffconcludes that the applicant did not adequately present the necessary design criteria for theESP site. The need for a COL or CP applicant to describe the design criteria and designmethods, including the factor of safety for slope stability, is COL Action Item 2.5-10.
2.5.4.3.12 Techniques to Improve Subsurface Conditions
In SSAR Section 2.5.4.12, the applicant stated that it would not consider any groundimprovement techniques beyond the removal and replacement of the Upper Sand Stratum andthat it would consider additional ground improvement methods as warranted for specificlocations of the project during the COL phase. The need for the COL or CP applicant to employground improvement (such as the planned engineering backfill to bring the bearing soilelevation up to 50 ft above the lower sand stratum) after removal of Upper Sand Stratum for theESP site is COL Action Item 2.5-11.
2.5.4.4 Conclusions
Based on its review of SSAR Section 2.5.4, related references, and the applicant’s responsesto the associated RAIs described above, the staff finds the following:
1. The applicant conducted a limited site investigation to determine the engineeringproperties of subsurface soils at the ESP site. The applicant performed few field andlaboratory tests to determine static and dynamic and other engineering properties of theunderlying soils. Because of the quantity and quality of the test results, the applicant didnot have sufficient data to determine the engineering properties reliably for thesubsurface materials. Therefore, the applicant relied heavily on the previous databasedeveloped for the existing VEGP Units 1 and 2 without considering the differentregulatory environments, investigation requirements, and testing technologies as well asthe spatial variation of the soil properties between the two investigations.
2. The applicant provided a site-specific shear wave velocity profile in a situation that theshear wave velocity measured from the down-hole tests were lower than the onesobtained from the suspension P-S velocity measurements; the shear wave velocitiesfrom previous investigations associated with VEGP Units 1 and 2 were also lower. Additionally, the applicant did not perform soil dynamic testing on the samples from theESP site to provide soil modulus reduction and damping curves to feed into the siteresponse study and the site-specific shear wave velocity profile. The shear wavevelocity profile and the shear modulus reduction curves, as well as the damping curves,are critical input for the site-specific ground motion spectrum and future SSI.
3. The proposed Units 3 and 4 will be located above the similar load-bearing strata, andthe existing units already observed an unusually large settlement (both total and

2-380
differential). The applicant did not provide a detailed settlement analysis to ensure thatthe SSCs for a particular reactor model or envelope of various models (in the case thatno definitive model is selected) are safe.
4. The applicant used some general methods in its calculations and analyses withoutthoroughly examining all important factors and considering all possible scenarios. Forexample, the applicant used the Vesic (1975) formula to determine the allowablebearing capacity of the bearing stratum. Since the formulation was based on primaryassumptions of gross shear failure of soils under the foundation, it is applicable forgeneral foundation analysis, but not appropriate for use in nuclear power plantfoundation design because the typical control factors of the allowable contact pressurefor such large and heavy structures are settlements, allowable pressures that are usedin the design of the wall/basemat intersection, and toe pressures developed duringpotential overturning and sliding of the facility.
Based on the above findings, the staff concludes that, although the applicant conducted its ownESP site investigation and performed limited field and laboratory tests and associated analyses,it did not provide sufficient information to describe soil conditions underlying the ESP site, suchas the possible existence of “soft zones” in the foundation-bearing layer. The applicant also didnot demonstrate reliable engineering properties of the soils during the ESP site investigation. Instead of using its own data and referencing the previous investigation data, the applicantfrequently defined the design parameters or input to the design criteria using the data from theprevious investigation associated with VEGP Units 1 and 2 and used the ESP data as referencedata. Therefore, some key engineering parameters do not reliably characterize the soilproperties at the site and this affects the applicant’s evaluation of important analyses, such asSSE determination, SSI analyses, soil allowable bearing capacity, and foundation settlementevaluations, as well as liquefaction potential and seismic stability analyses. Therefore, theapplicant needs to resolve these issues and to characterize the site’s geotechnical propertiesreliably.
2.5.5 Stability of Slopes
SSAR Section 2.5.5 describes the applicant’s review of existing slopes at the ESP site and theapplicant’s plan for permanent cut and fill slopes during construction excavation. The applicantalso discussed its plans for future slope stability analysis to take place during the design phase. The applicant did not perform slope stability analysis for the ESP site because there is noexisting slope and the applicant cannot determine the future slope for the ESP phase.
2.5.5.1 Technical Information in the Application
The applicant stated that, since there were no existing slopes or embankments near theproposed location of VEGP Units 3 and 4, it did not perform a dynamic slope stability analysis.The applicant further stated that the site grading for construction of new units would result innonsafety-related permanent cut and fill slopes. Permanent cut slopes would have a height of15.2 meters (50 ft) or less and would be located several hundred meters away from planned orexisting safety-related structures. Permanent fill slopes would have a height of 6.1 meters (20 ft) or less and would also be several hundred meters away from planned or existingsafety-related structures. During the construction phase, the applicant will remove the soils
2-381
above the Blue Bluff Marl and replace them with compacted structural fill. The applicant statedthat the construction excavation cut slopes would be temporary (i.e., only during theconstruction period) and that they will be far away from the safety-related structures of theexisting VEGP Units 1 and 2. The applicant committed to perform nonsafety-related permanentslope stability analysis for dynamic and static conditions, as well as excavation cut slopeanalysis for static conditions during the design stage, to ensure that these slopes will not pose ahazard to the public.
2.5.5.2 Regulatory Basis
SSAR Section 2.5.5 states that the applicant did not perform a slope stability analysis for theESP site application. However, the applicant stated in SSAR Section 1.8 that it followed theguidance of NUREG-0800, Section 2.5.5, when it described the slope-related issues in SSARSection 2.5.5. In its review of SSAR Section 2.5.5, the staff considered the regulatoryrequirements in 10 CFR 100.23(c) and 10 CFR 100.23(d). According to 10 CFR 100.23(c),applicants must investigate the engineering characteristics of a site and its environs in sufficientscope and detail to permit an adequate evaluation of the proposed site. Pursuant to 10 CFR100.23(d)(4), applicants must evaluate siting factors such as natural and artificial slope stability.
2.5.5.3 Technical Evaluation
The staff focused its review of SSAR Section 2.5.5 on whether there are any existing orplanned new slopes that would adversely affect the safety-related structures of the proposednew units due to any possible loading conditions and/or natural events. After reviewing theinformation provided by the applicant, the staff concludes that, because there are no existingsignificant slopes near the proposed ESP site, a detailed slope stability analysis is notnecessary at the ESP stage. The staff considers the creation of permanent slopes duringconstruction to be a design-related issue, which must be addressed at the COL stage. Theapplicant committed to provide detailed slope stability analyses for the permanent slopes at theCOL stage. On this basis, this issue is designated as COL Action Item 2.5-12.
2.5.5.4 Conclusions Because there are no existing slopes near the ESP site, and the applicant did not know theexact location of the future reactors, the applicant did not perform any slope stability analysis. Although this information is not necessary to determine whether 10 CFR Part 100 is satisfied,excavation will create nonsafety-related permanent cut and fill slopes during the new units’construction stage, therefore, the COL applicant will address slope stability for the site at theCOL stage.
2.5.6 Embankments and Dams
SSAR Section 2.5.6 presents a general description of existing and potential new embankmentsand dams at the ESP site.
2-382
2.5.6.1 Technical Information in the Application
SSAR Section 2.5.6 indicates that there are no earth, rock or earth, and rock fill embankmentsrequired for plant flood protection or for impounding the cooling water required for the operationof the plant. The applicant indicated that there are three existing nonsafety-relatedimpoundments at the site—Mallard Pond, Debris Basin Dam 1, and Debris Basin Dam 2. TheMallard Pond is located to the north of the proposed switchyard, Debris Basin Dam 1 is locatedto the southeast of the proposed cooling towers, and Debris Basin Dam 2 is located to thesouthwest of the proposed cooling towers. The applicant stated that it would not use theimpoundments for plant flood protection or for impounding cooling water for the operation of theplant. The pool level in Mallard Pond is below the elevation of 38.1 meters (125 ft) above msl. In the event of a dam breach at Mallard Pond, the water would drain to the north and away fromthe proposed new units. The pool levels in Debris Dams 1 and 2 are also below the elevation of45.7 meters (150 ft) above msl, and, in the event of a dam breach, the water would drain to thesouth, away from the proposed new units. Therefore, the applicant concluded that there wouldbe no need for embankments or dams for flood protection or for impounding the cooling waterat the site.
2.5.6.2 Regulatory Basis
The applicant did not state which regulations SSAR Section 2.5.6 addressed; these topics arecovered in NUREG 0800, Sections 2.4.4 and 2.5.5. However, in SSAR Section 1.8, Table 1-2,the applicant stated that it used RG 1.70 for guidance on format and content. Section 2.5.6 ofRG 1.70 describes the necessary information and analysis related to the investigation,engineering design, proposed construction, and performance of all embankments used for plantflood protection or for impounding cooling water.
2.5.6.3 Technical Evaluation
In its review of SSAR Section 2.5.6, the staff evaluated the possible impact of a breach ofexisting embankments and dams on the proposed new units at the ESP site and evaluated theneed for construction of any embankments or dams for flood protection. Based on theinformation provided by the applicant, the staff notes that the proposed finished grade elevationfor the new units is approximately 67 meters (220 ft) above msl, and the existing pool levels forthe three impoundments are 38.1 meters (125 ft) above msl for Mallard Pond, and 45.7 meters(150 ft) above msl for both Debris Basin Dams 1 and 2. These elevations are all below theproposed finished grade elevation. In addition, as the applicant discussed in Sections 2.4.3 and2.4.4 of the SSAR, both probable maximum flood elevation (45.8 m (150.13 ft) msl) and thedam break level (54.3 m (178.10 ft) msl) are much lower than the proposed finished gradeelevation Therefore, the staff concurs with the applicant’s conclusion that no embankmentsand dams are required.
2.5.6.4 Conclusions
The applicant provided adequate information and analysis in SSAR Section 2.5.6, withreference to Sections 2.4.3 and 2.4.4 of the SSAR, regarding the embankments and dams atthe ESP site. The applicant demonstrated that no embankments or dams are needed for flood

2-383
protection at the ESP site under possible flood and dam breach conditions because of theproposed finished grade elevation.