Embed Size (px)
Citation preview
8/11/2019 25 - Technology and Innovation Management
http://slidepdf.com/reader/full/25-technology-and-innovation-management 1/55
TECHNOLOGY AND INNOVATION MANAGEMENT 1674
SUSTAINABLE TECHNOLOGY MANAGEMENT AND DEVELOPMENT - STATE UNIVERSITY AND
INDUSTRY PERFORMANCE MODEL 1675
Levi Jakšić Maja, Jovanović Milica, Petković Jasna
GOVERNMENT PERFORMANCE IN TECHNOLOGY AND INNOVATION MANAGEMENT – THE CASE OF
SERBIA 1684
Marinković Sanja,Rakićević Jovana, Levi Jakš ić Maja
MECHANISMS FOR STIMULATING INNOVATION CAPABILITIES IN WESTERN BALKAN COUNTRIES 1693Štrbac Dijana,Kutlača Đuro, Ţivković Lazar
POSSIBILITIES OF OPENING UP THE STAGE-GATE MODEL 1700
Stošić Biljana,Milutinović Radul
THE EVOLUTION OF MOBILE TECHNOLOGY IN RETAIL MARKETING CHANNELS IN THE REPUBLIC OF
SERBIA 1708
Končar Jelena,Vukmirović Goran, Leković Sonja
ADVANCE REAL ESTATE MANAGEMENT SYSTEM 1713
Jovanović Verka, Vukelić ĐorĎe
CLOUD COMPUTING INFRASTRUCTURE APPLICATIONS IN COMPUTER SIMULATION 1721
Marinković Mihailo, Čavoški
Sava, Marković Aleksandar
8/11/2019 25 - Technology and Innovation Management
http://slidepdf.com/reader/full/25-technology-and-innovation-management 2/55
TECHNOLOGY AND
INNOVATION MANAGEMENT
1674
8/11/2019 25 - Technology and Innovation Management
http://slidepdf.com/reader/full/25-technology-and-innovation-management 3/55
SUSTAINABLE TECHNOLOGY MANAGEMENT AND DEVELOPMENT -STATE, UNIVERSITY AND INDUSTRY PERFORMANCE MODEL
Maja Levi Jakšić1, Milica Jovanović2 Jasna Petković31University of Belgrade, Faculty of Organizational Sciences [email protected] of Belgrade, Faculty of Organizational Sciences [email protected] of Belgrade, Faculty of Organizational Sciences [email protected]
Abstract : In this paper a general model is created for measuring the performance of Technology andInnovation Management (TIM) related to the crucial dimensions/elements of the Triple Helix (TH) model.More precisely, the Triple Helix Model (high education – government - industry) is analysed in relation to itsfulfilling the three main functions of TIM: planning, organizing and control (POC). The general model – TMD-TH (Technology Management and Development – Triple Helix) represents the framework for further morespecific research into the relations of the observed dimensions. The general model is further divided intosub-models: TMD-G, TMD-U and TMD-I, where G stands for government, U stands for university and Idenotes industry. The sub-models are to be investigated in more detail and the research results will be presented in separate papers. In the general model, the performance of each TH dimension is to bemonitored by a set of indicators classified into categories according to the specific management function(POC) of TIM. The general model enables better systematisation of the indicators of TIM with linksestablished with the main roles of the actors in the TH model. When applied in concrete situations in practice, at the level of national economy, the results obtained represent a base for developing policies andstrategy that will be oriented at introducing change in the domains of highest priority in the aim of achievingmore efficient and effective results in sustainable development.
Keywords : Triple-Helix (TH) concept, Sustainability, Technology and Innovation management (TIM),General model, Performance Indicators
1. INTRODUCTION
In the dynamic global environment, with continuous and exponential technological growth and development,the relevance of the research conducted in managing technology, innovation and change is of high priority.The ultimate goal of achieving global competitiveness of firms and economies means that one of the crucialcompetitive factors today, technology and innovation, is to be managed by closely measuring, monitoring,controlling its performance. Why is managing technology so important? As stated in (White & Bruton, 2007),the necessity for technology management lies in: (a) the rapid pace of technological changes which requiremultidisciplinary approaches; (b) the rapid pace of technological development which shortened product lifecycles; (c) the need to cut time for product development and create more flexible organizations; (d) thenecessity to maximize competitiveness effectively by using new technologies; (e) the importance of changingmanagement tools caused by rapid technology changes. Technology and innovation is placed at the centreof the policies and strategy developed for firms, industries, national economies, regions, sectors, etc. In thispaper we develop the general model of sustainable technology and innovation management based on theassertion that it is the management of technology and innovation, not just the new technologies themselves,
that represents the true competitive force leading to sustainable development.
Effective TIM is dependent on the capacities to measure and monitor performance which is not an easy taskhaving in mind the interrelatedness of the activities, the time dimension and delays inherent to research anddevelopment inputs and effects, synergies, etc. Up to now, in both practice and theory, mostly usedindicators of technology and innovation management (TIM) were related to research and development (R&D)activities, intensity of technology changes and degree of implementing innovations. The overview of literaturein the field of TIM, as evidence of theoretical and empirical studies, shows that it is necessary to develop acomplete, comprehensive approach. In this paper, an original attempt is made to classify and systematizeTIM indicators according to basic management functions - planning, organizing and control (POC) linked tothe performance of Triple Helix (TH) actors. The role of TIM as key factor in accomplishing sustainabledevelopment is clearly pointed out in theory and justified in practice, as sustainable new technologies andinnovation lie at the core of economic, social and technological progress. The capacities and competenciesin managing technologies are becoming at least as important, if not, even more significant than thecapacities of the technologies, per se. TIM performance is measured and tracked by indicators at differentlevels: national economy, economy sectors, and companies. In this way, priorities are set for future actions in
1675
8/11/2019 25 - Technology and Innovation Management
http://slidepdf.com/reader/full/25-technology-and-innovation-management 4/55
order to improve management areas that are not developed enough, and to achieve the overall goals ofefficiency and effectiveness of technology management at all levels.
The perspective of sustainable development requires an overall approach, encompassing indicatorsclassified by using the Triple Helix concept (Etzkowitz & Leydesdorff, 1995). The TH comprises thehybridization of three dimensions/elements university, industry and government in order to generate newinstitutional and social formats for the production, transfer and application of knowledge (The Triple HelixConcept, 2013).
The basic hypothesis and assumptions elaborated in this paper are the following:General hypothesis:1. Technology management and entrepreneurship is as important as development of technology, per se,for sustainable development, andSpecial hypothesis and assumptions:1. TH model is a basic model for sustainability and TIM indicators are established according to the
dimensions/elements of TH,2. TIM functions, elaborated by POC, classified according to TH dimensions/elements, enable the
establishing of the comprehensive, general model,3. The general model with feedback relations is applicable for effective strategic management in the
state, university and industry domains,
4. Application of the model with systematized indicators in practice is a valuable tool for more effectivestrategic analysis, establishing policies and strategy and their implementation, with specific tasks for TH-state, university and industry related to different functions of TIM.
In this paper, the authors have created a new general cross-functional model for measuring sustainabletechnology management and development, TMD-TH, based on two concepts: (1) TH concept with threedimensions: university, industry and government; (2) management concept based on three managementfunctions – planning, organizing and control.
2. THE PRODUCTIVITY PARADOX AND THE TRIPLE HELIX CONCEPT
Building knowledge-based economy and society in the traditional sense is not sufficient enough forsubstantial economic and social progress and development. Theoretically and in practice it has beendiscovered that, despite the undoubtedly central role of investments in new knowledge in economic growth,there is still a neglected, missing link to economic growth, employment opportunities and internationalcompetitiveness. (Levi Jakšić et al., 2011a)
The productivity paradox detected in the 1950s discovered a new phenomenon: the investments in physicalcapital were increasing, but the productivity indicators decreasing (Bailey, M. N., Chakrabarti, A. K., 1988,pp.5). The fact that intangible components have been neglected showed that a new perspective andparadigm was necessary. The Japanese management approaches that emphasize the «soft» elements hadproved effective and were pouring into Europe (especially Sweden, Germany) in the 1960s and by the mid-1970s in the United States emerged the shift of focus towards intangible assets. Knowledge, creativity, ideasand knowledge based capabilities and skills were found to have been neglected whereas resulting inproductivity slowdown while the physical capital investments were still growing. This result pointed out tointangible technology components and knowledge as inevitable in economic growth models (Levi Jakšic,2011).
The scholars were quick to point to the common denominator for success: a shift away from the factor ofphysical capital towards knowledge capital, which generally consists of: science, technology, creativity,ideas. (Acs, Z.J., Audretsch, D. B., Strom, R. J, 2009., p. 7) Different forms of knowledge capital alone wereobviously not sufficient in creating competitive strength and firm growth. Technology as the integrativeconcept emerged, consisting of physical/tangible and intangible elements. This opened a new perspective inunderstanding the forces of competitiveness in the detailed analysis of the factors relevant to technologicalprogress and growth.
The productivity paradox of the sixties has evolved as the Swedish paradox in the last decades of the pastcentury – «as measured by the most common benchmarks of knowledge investments, such as R&D,university research, patents, human capital, education, creativity and culture, Sweden has rankedconsistently among world leaders. However, following more than a decade a stagnant growth and risingunemployment, concerned policymakers in Sweden started to worry about what they termed as «theSwedish paradox».( Acs, Z.J., Audretsch, D. B., Strom, R. J, 2009., p. 7) Detecting of the persistent stagnant
1676
8/11/2019 25 - Technology and Innovation Management
http://slidepdf.com/reader/full/25-technology-and-innovation-management 5/55
economic growth despite high levels of knowledge investments...for the European context, had been termedthe European Paradox. (Acs, Z.J., Audretsch, D. B., Strom, R. J, 2009., p. 7)
The new approaches show a clear turnaround focusing on soft elements not only in the form of intangibleassets but involving also management principles and practices, entrepreneurship, leadership and emergenceof technological rather than technical dimensions at the focus of competitiveness (Levi Jakšić, 2011).
Evidence from the case of Serbia clearly points to the very explicit roles of entrepreneurship that are missingin a country where resources are invested in scientific research but not effectuated in the economy andsociety. The indicators show that although intensive research in Serbia, when it comes to practical resultsand commercialization, the R&D phases of innovation lack entrepreneurship. In more detail it is shown thatthere is very low correspondence between fundamental and applied research. The links between thephases of Research, Development, Commercialization are in need of entrepreneurial cohesion. Theentrepreneurship roles are viewed as necessary links to be introduced as follows: Research-Entrepreneurship-Development-Entrepreneurship-Commercialization (Levi Jakšić, 2011).
In the document presented in 2010 by the Ministry of science and technological development of the Republicof Serbia, «Strategy of Scientific and Technological Development of the Republic of Serbia», it is cited thatone of the most serious problems of science in Serbia is the fact that a small amount of funds, from mainlyone source invested in scientific research are distributed over more than 1 000 projects that were financed
by the Ministry in 2009: 501 project of fundamental research for which 50.2% of the budget is allocated and471 technology development and 129 innovation projects for which 39.2% of the Ministry funds are invested. According to their main definition and goal, the projects of technological development as result are expectedto generate applied technological solutions, patents, pilot plants, new sort innovations, technologicaladvancements and results with direct applicability. In the past period, 2003-2007, in the technologicaldevelopment field, over 3400 technical solutions have been realized. But, in spite of the high number oftechnical solutions, the number of patent applications from research and development institutions in theperiod of 2003-2009 has been extremely low, only 54. With these results Serbia has the lowest position inEurope.
Serbia is facing the same difficulties as detected for the situation in Europe. ,,The Europe 2020 strategyclearly signalled the importance of industrial competitiveness for growth and jobs as well as for Europe’sability to address grand societal challenges in the coming years. Mastering and deploying Key Enabling
Technologies (KETs) in the European Union is central to strengthening Europe’s capacity for industrialinnovation and the development of new products and services needed to deliver smart, sustainable andinclusive European growth”(HLG on KET Final Report, 2011).
The High-level expert group (HLG) has identified the major difficulties Europe has in translating its ideas intomarketable products – in crossing the internationally recognized "valley of death". This situation, namely thegap between basic knowledge generation and the subsequent commercialization of this knowledge inmarketable products, has been commonly identified across the KETs and is known in broad terms as the"valley of death" issue. Its effects can include not only relocation of manufacturing and R&D, but also thedisruption of entire value chains with their ultimate consequences on the sustainability of various strategicsectors in Europe. The "valley of death" is due to many factors including the absence of smart regulation, theunavailability of pre-commercial R&D support, insufficient access to large scale finance, and lack of political
support and pro-active KET. To cross this valley, it recommends a strategy comprising three pillars: a pillarfocused on technological research, a product demonstration pillar focused on product development, and aproduction pillar focused on world-class, advanced manufacturing.
Crossing the “valley of death” in the key enabling technologies in Europe requires the delivery of solutions tothe three successive stages implicit in this crossing. The first stage, called “Technological research” consistsof taking best advantage of European scientific excellence in transforming the ideas arising fromfundamental research into technologies competitive at world level. The second stage, called “Productdemonstration” allows the use and exploitation of these KETs to make innovative and performing Europeanprocess and product prototypes competitive at world level. The third stage, called “Competitivemanufacturing” should allow, starting from product prototypes duly validated during the demonstration phaseto create and maintain in Europe attractive economic environments in EU regions based on strong eco-systems and globally competitive industries (HLG on KET Final Report, 2011).
Whilst European R&D is generally strong in new KET technologies, the HLG has observed that the transitionfrom ideas arising from basic research to competitive KETs production is the weakest link in European KET
1677
8/11/2019 25 - Technology and Innovation Management
http://slidepdf.com/reader/full/25-technology-and-innovation-management 6/55
enabled value chains. This is demonstrable evidence of the impact to-date of the absence of a major focuson enabling innovation in the EU and an over-emphasis on basic research both within EU research programsand in some Member States. By focusing on these key stages of the innovation chain, the HLG proposalscan trigger a virtuous cycle, from knowledge generation to market flow with feedback from the market toknowledge generation support, thereby strengthening economic development in Europe.
Innovation and opportunity at the base of entrepreneurship is viewed in the perspective of the critical role of
institutions in the promotion of innovation defined by national innovation systems, and universities that arecited as critical institutional actors in national innovation systems (Mitra, 2011). The Triple Helix concept isused as the general framework emphasizing the network of institutions in the innovation andentrepreneurship system to be viewed and taken into account in relation to the new roles and responsibilitiesuniversities take in the modern world. (Levi Jakšić et al., 2012b) The Triple Helix model does not considermanufacturing as the driving force of economic development in the post-industrial stage. It assumes that thecreation and dissemination of socially organized knowledge are playing the key role in creating competitiveadvantage of an economy. In this sense, institutions that generate knowledge increasingly play a role in thenetworks of relations among the key actors: University, Industry, and Government. In distinction to theknowledge-based system, which can be considered as an outcome of interaction among different socialcoordination mechanisms (markets, knowledge production, governance at interfaces), the Triple Helix modelgives a heuristic for studying these complex dynamics in relation to developments in the institutionalnetworks among the carriers (Leydesdorff & Meyer, 2006) and those components should generate new
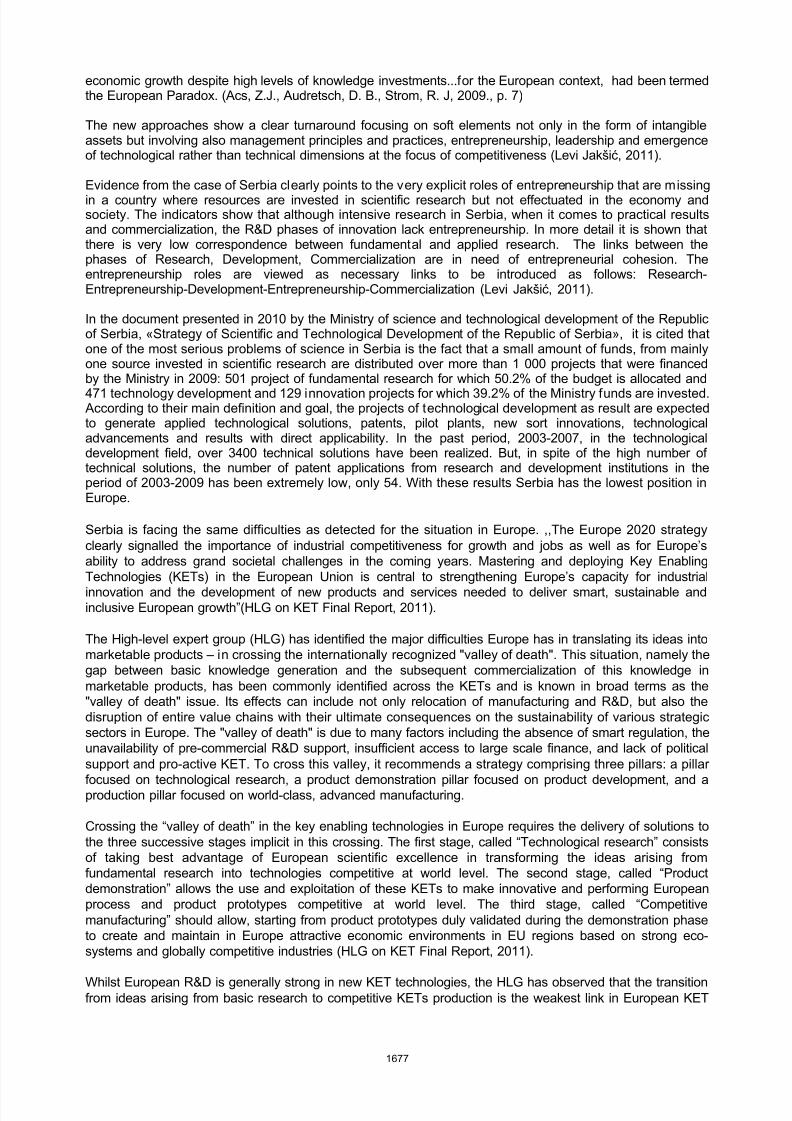
institutional and social formats for the production, transfer and application of knowledge. Also, the distinctionbetween these entities and their activities are increasingly overlapping. In areas of intersection, the actorscan partially substitute for one another (Ivanova & Leydesdorff, 2012).
Figure 1: A Triple Helix configuration with negative and positive overlap among the three subsystems(Leydesdorff, 2012b)
The relationship between TH’s elements is shown in Figure 1 as alternating between bilateral and trilateralcoordination mechanisms or-in institutional terms-spheres. The systems remain in transition because each of
the partner institutes also develops its own mission. Because of that, a trade-off can be generated betweenintegration and differentiation, and new systems in terms of possible synergies can be explored andpotentially shaped (Leydesdorff, 2012b). TH does not use only economic forces (Industry ), regulations givenby Government or research inventions performed by Universities: it can combine these categories and focuson examining the dynamics two or even all three components.
TH models can be elaborated in various directions. Networks of university-industry-government relations canbe considered as arrangements which can be made the subject of social network analysis. This model canalso be used for policy advice about network development, for example in the case of transfer of knowledgeand the incubation of new industry. The new role of universities in knowledge-based configurations is themost explored topic among the three TH components, and it can be explored in terms of different sectors,regions, countries etc. (Godin & Gingras, 2000; Shinn, 2002). In some previous research studies (Levi Jakšićet al., 2012a), the thesis was confirmed that there is a constant need to research the universities’ role insociety, especially the one in practice and compatibility of the practical knowledge with current studyprograms at different educational levels.
1678
8/11/2019 25 - Technology and Innovation Management
http://slidepdf.com/reader/full/25-technology-and-innovation-management 7/55
In the TH system, universities have the leading role and this concept assumes that the knowledgeuniversities produce is useful enough to be widely shared and applied, which should lead to nationaldevelopment. Industry operates in the Triple Helix as the place of production, government has the task tocreate contractual relations that will guarantee stable interactions and exchange, and in the end, theuniversity is the source of new knowledge and technology, the generative principle of knowledge-basedeconomies (The Triple Helix Concept - Theoretical Framework, 2011). The boundary between institutionalspheres is blurred, because universities assume entrepreneurial roles by focusing on the production of usefulknowledge and its exchange across a wider network of key players in socio-economic system. Also, industryshould not only use practical appliance of knowledge, but also producing knowledge with a purpose ofcreating a wealth. And, finally, government has the task to facilitate interactions of industry and universitiesby creating policy frameworks for successful functioning of this cooperation. In developing countries, thechallenge is to operationalise the TH system in order to provide sustainable basis for wealth creation andpoverty reduction (Saad & Zawdie, 2011). Because of that, it is necessary to have some measures andindicators which will show the performance of a country within each TH area. In this paper, we develop ageneral model that examines all three components of the TH concept, and further research focuses on eachcomponent separately.
3. CROSS-FUNCTIONAL TIM MODEL
Technology and Innovation management implies: planning, organizing, leading, directing, organizing,coordinating and controlling all technology activities (operations) with the ultimate goal of providing
continuous success (profitability, market share, environmental protection etc.). It includes all technologicalactivities, strategic ones, related to management of technology development, through management ofinnovation, technology transfer, R&D activities and operational ones including managing a specifictechnology system, processes and operations as the form of implemented technology. (Levi Jakšić et al.,2011b) TIM, as specific set of competencies in the competency based competitiveness approach, isrecognized as the critical success factor for firms, sectors, economies and regions. The integral TIM conceptis focused at managing technology as external force and internal factor of the firm meaning that both theinnovative and technological infrastructure and the technology and innovative capacities of the firm are takeninto account. Managing technological diversification is a significant dimension of the new paradigm leading tooperations competitiveness of the firm closely related to i ts innovative capabilities. (Levi Jakšić et al., 2012a)
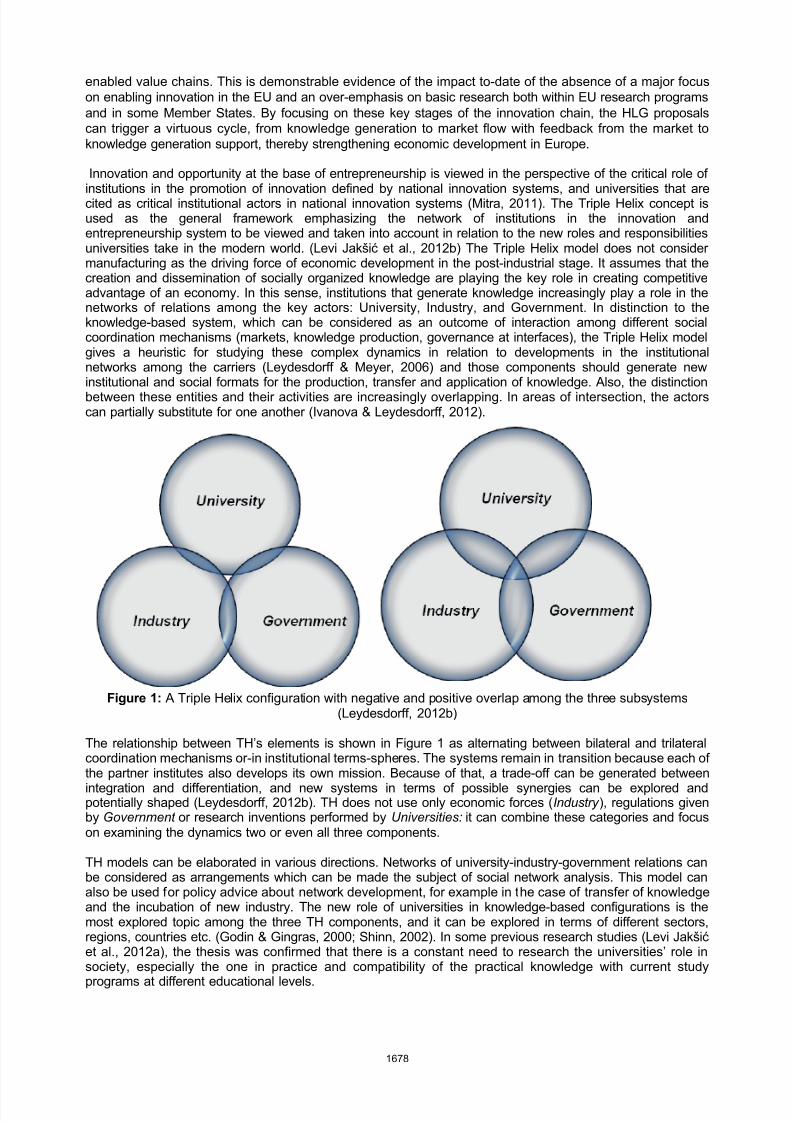
In the previous section, it was postulated that the original TH model considers three entities represented inFigure 1. However, in some previous research (Levi Jakšić et al., 2012b), the authors concluded that for therelevant analysis of universities’ impact in the economy, society and economic development it is necessaryto introduce an extended Triple Helix model with an additional, fourth component - knowledge and sciencedevelopment (Figure 2). Its necessity derives from the interrelation between the dynamic category of scienceand knowledge development results and industry/economy/society sustainable needs with the governmentspecial roles in creating policies and funding research and development as well as educational andentrepreneurial activities in the economy and society. This new component influences the development ofstudy programs which have the task to quickly respond to the latest environmental requirements byintroducing the latest scientific results and findings in the study programs. In this paper, we examinemeasuring performance of TIM indicators based on the original TH model, but further research shouldinclude the science component, as well, because of its influence and a special role it plays in each of thetraditional components of the TH model.
Figure 2: Study program development, Triple Helix and economic development. (Levi Jakšić et al., 2012)
1679
8/11/2019 25 - Technology and Innovation Management
http://slidepdf.com/reader/full/25-technology-and-innovation-management 8/55
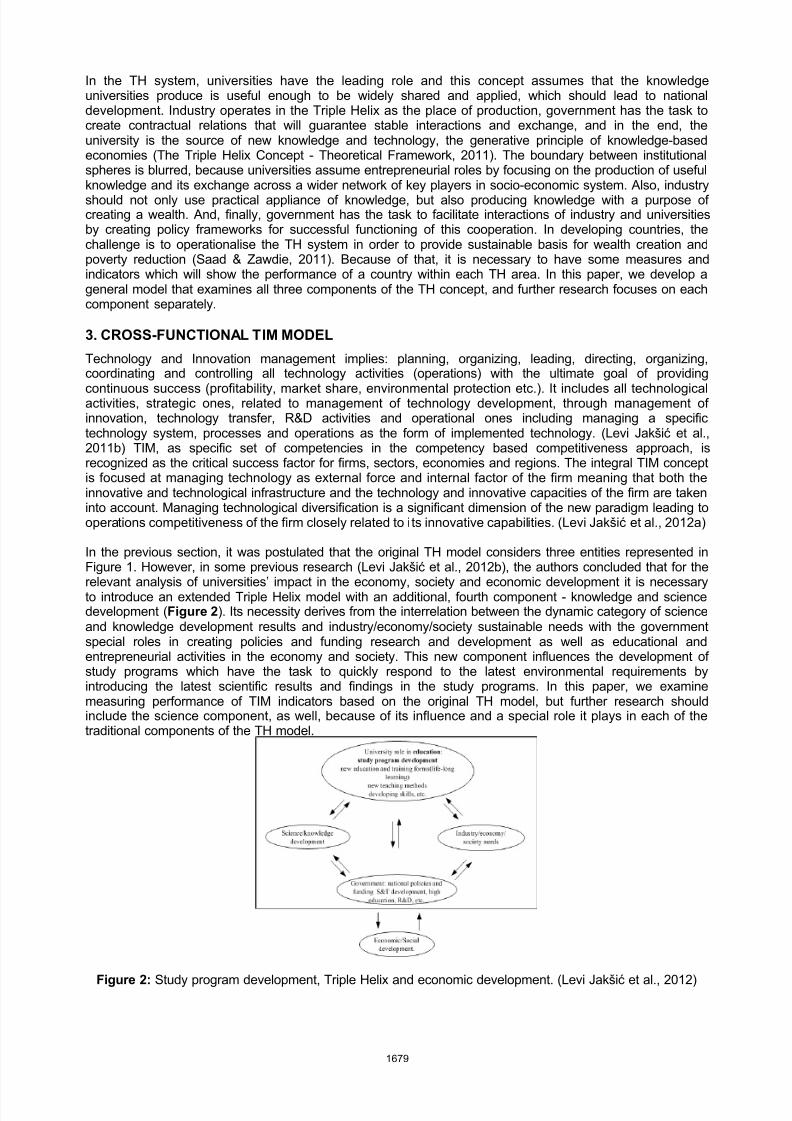
Figure 3 shows the basic cross-functional TIM model, developed from the perspective of the Triple Helix(TH) concept and basic technology management functions. Firstly we have three separate TH entities:Government, Industry and University. Within each of the dimension we measure how successful the entity isin managing technology by evaluating its performance in each management function: planning, organizingand control. In this way, it is possible to view the current state, set the priorities within each category and todetermine tasks that have to be performed in order to enhance sustainability based on prioritized actions in
certain areas. All these dimensions determine sustainable development, and by using the established modelthe relevant feedback is possible for effective decision making.
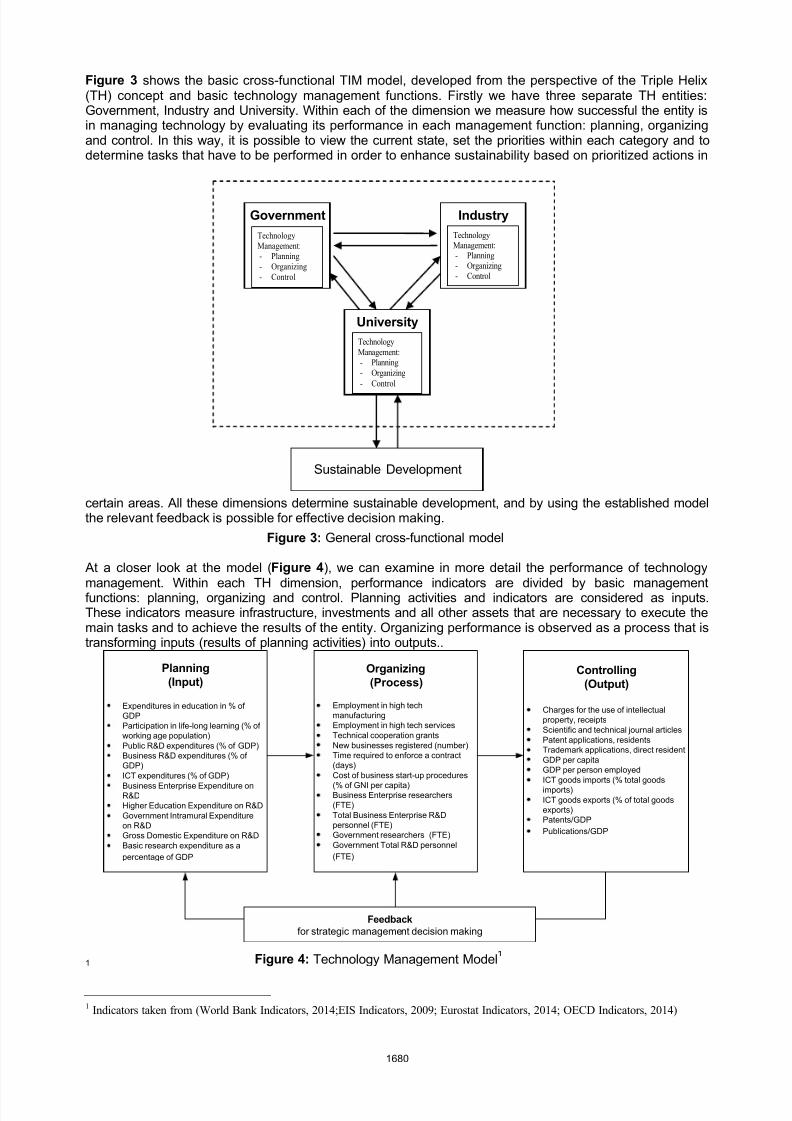
At a closer look at the model (Figure 4), we can examine in more detail the performance of technologymanagement. Within each TH dimension, performance indicators are divided by basic managementfunctions: planning, organizing and control. Planning activities and indicators are considered as inputs.These indicators measure infrastructure, investments and all other assets that are necessary to execute themain tasks and to achieve the results of the entity. Organizing performance is observed as a process that istransforming inputs (results of planning activities) into outputs..
Planning
(Input)
Expenditures in education in % of
GDP
Participation in life-long learning (% of
working age population)
Public R&D expenditures (% of GDP)
Business R&D expenditures (% of
GDP)ICT expenditures (% of GDP)
Business Enterprise Expenditure on
R&D
Higher Education Expenditure on R&D
Government Intramural Expenditure
on R&D
Gross Domestic Expenditure on R&D
Basic research expenditure as a
percentage of GDP
Organizing
(Process)
Employment in high tech
manufacturing
Employment in high tech services
Technical cooperation grants
New businesses registered (number)
Time required to enforce a contract
(days)Cost of business start-up procedures
(% of GNI per capita)
Business Enterprise researchers
(FTE)
Total Business Enterprise R&D
personnel (FTE)
Government researchers (FTE)
Government Total R&D personnel
(FTE)
Controlling
(Output)
Charges for the use of intellectual
property, receipts
Scientific and technical journal articles
Patent applications, residents
Trademark applications, direct resident
GDP per capita
GDP per person employedICT goods imports (% total goods
imports)
ICT goods exports (% of total goods
exports)
Patents/GDP
Publications/GDP
Feedback
for strategic management decision making
1
1 Indicators taken from (World Bank Indicators, 2014;EIS Indicators, 2009; Eurostat Indicators, 2014; OECD Indicators, 2014)
Figure 4: Technology Management Model
Government
Technology
Management:
- Planning
- Organizing
- Control
University
Technology
Management:
- Planning
- Organizing
-
Control
Industry
Technology
Management:- Planning
- Organizing
- Control
Sustainable Development
Figure 3: General cross-functional model
1680
8/11/2019 25 - Technology and Innovation Management
http://slidepdf.com/reader/full/25-technology-and-innovation-management 9/55
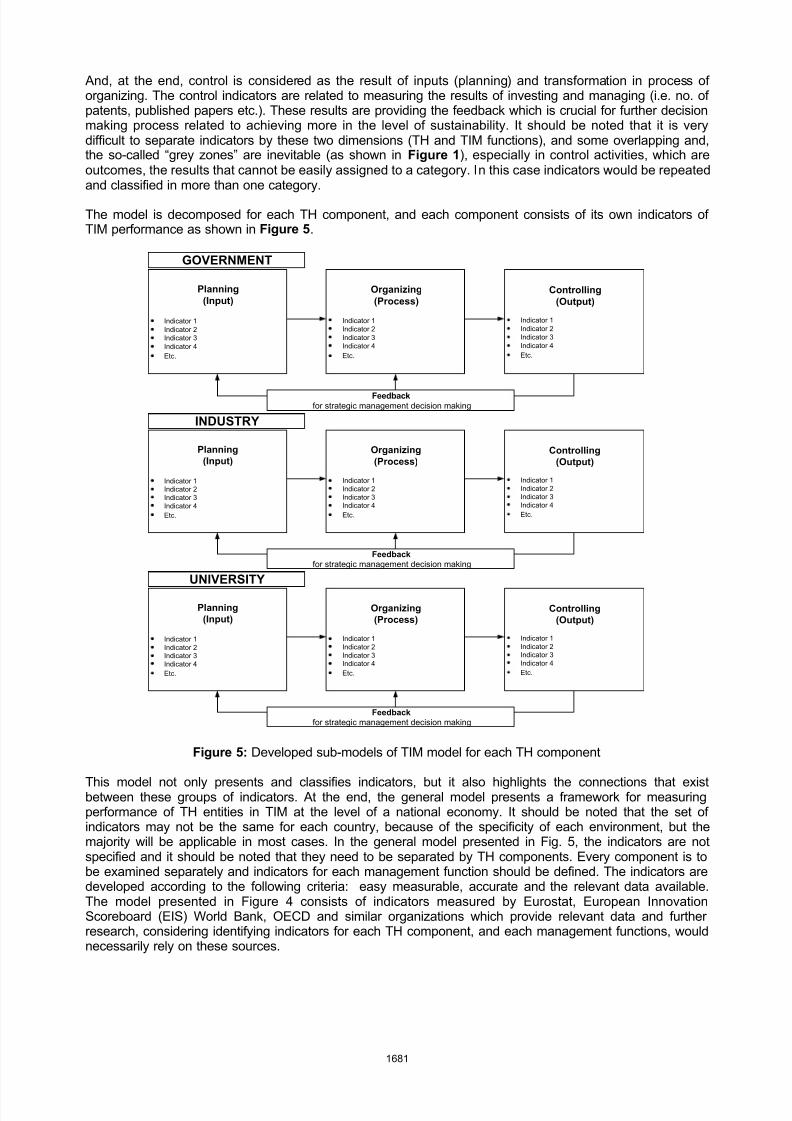
And, at the end, control is considered as the result of inputs (planning) and transformation in process oforganizing. The control indicators are related to measuring the results of investing and managing (i.e. no. ofpatents, published papers etc.). These results are providing the feedback which is crucial for further decisionmaking process related to achieving more in the level of sustainability. It should be noted that it is verydifficult to separate indicators by these two dimensions (TH and TIM functions), and some overlapping and,the so-called “grey zones” are inevitable (as shown in Figure 1), especially in control activities, which areoutcomes, the results that cannot be easily assigned to a category. In this case indicators would be repeatedand classified in more than one category.
The model is decomposed for each TH component, and each component consists of its own indicators ofTIM performance as shown in Figure 5.
Planning
(Input)
Indicator 1Indicator 2Indicator 3Indicator 4
Etc.
Organizing
(Process)
Indicator 1Indicator 2Indicator 3Indicator 4
Etc.
Controlling
(Output)
Indicator 1Indicator 2Indicator 3Indicator 4
Etc.
Feedback
for strategic management decision making
GOVERNMENT
Planning
(Input)
Indicator 1Indicator 2Indicator 3Indicator 4
Etc.
Organizing
(Process)
Indicator 1Indicator 2Indicator 3Indicator 4
Etc.
Controlling
(Output)
Indicator 1Indicator 2Indicator 3Indicator 4
Etc.
Feedback
for strategic management decision making
INDUSTRY
Planning
(Input)
Indicator 1Indicator 2Indicator 3Indicator 4
Etc.
Organizing
(Process)
Indicator 1Indicator 2Indicator 3Indicator 4
Etc.
Controlling
(Output)
Indicator 1Indicator 2Indicator 3Indicator 4
Etc.
Feedback
for strategic management decision making
UNIVERSITY
Figure 5: Developed sub-models of TIM model for each TH component
This model not only presents and classifies indicators, but it also highlights the connections that existbetween these groups of indicators. At the end, the general model presents a framework for measuringperformance of TH entities in TIM at the level of a national economy. It should be noted that the set ofindicators may not be the same for each country, because of the specificity of each environment, but themajority will be applicable in most cases. In the general model presented in Fig. 5, the indicators are notspecified and it should be noted that they need to be separated by TH components. Every component is tobe examined separately and indicators for each management function should be defined. The indicators aredeveloped according to the following criteria: easy measurable, accurate and the relevant data available.The model presented in Figure 4 consists of indicators measured by Eurostat, European InnovationScoreboard (EIS) World Bank, OECD and similar organizations which provide relevant data and furtherresearch, considering identifying indicators for each TH component, and each management functions, wouldnecessarily rely on these sources.
1681
8/11/2019 25 - Technology and Innovation Management
http://slidepdf.com/reader/full/25-technology-and-innovation-management 10/55
4. CONCLUSION
In the highly competitive global environment, with interminable and accelerating technological growth anddevelopment the necessity for technology management is not questionable (White & Bruton, 2007)Technology provides competitive advantage and is the crucial dimension in government, firm, industry,regional, and other, strategies. Levi Jakšić et al. 2011 state that, theoretically and in practice, it has beendiscovered that there is a missing component in acquiring economic growth with new employmentopportunities and technological development. The missing link is the management of innovation and
technology and technological entrepreneurship. It is crucial to enable scientific and technologicaldevelopments oriented at creating new value in the economy and society. Efforts at achieving the efficienttransition of science into new technologies and new technology into new value are the main task of effectiveTIM. In this effort, all the players within the TH model are significant as the TH notes the network of actors inthe innovation and entrepreneurship system to be viewed and taken into account. The TH conceptunderlines the role of university in new, modern, knowledge-based economy. It also inspects the relationsamong the three components of a knowledge-based economy: (1) the knowledge-producing sector(University), (2) the market (Industry), and (3) Governments (Cooke & Leydesdorff, 2006).
In this paper we develop a general cross-functional model for measuring TIM performance of a nationaleconomy, from a TH perspective, creating separate sub-models for each TH component. This general modelwith the relevant indicators represents a base for measuring and monitoring how successful a nationaleconomy is in managing technology. All the basic management functions in TIM are evaluated (POC)
enabling specific tracking of their performance coupled with the analysis of the contribution of each THdimension in the specific performance of TIM. The complete analysis performed after the model is applied inconcrete, real world situation, is the necessary tool for setting priorities and achieving better results infulfilling the relevant goals of sustainable development: economic, social, environmental. In this paper, a listof the indicators is proposed based on the material provided by the World Bank and OECD, but the list is notclosed and still needs to be extended and classified for each component of the TH model. It is planned thatthe general model as well as the sub-models be tested in a concrete situation, starting from the concreteresults for Serbia and further to compare the situation with the countries in the region, as well as with thedeveloped countries. This would enable a complete picture to be established with the cause and effectrelationships more clear and leading to more precise and targeted policies and strategy with effective andsustainable TIM achieving sustainable development.
REFERENCES
Acs, Z.J., Audretsch, D. B., Strom, R. J.(2009). Entrepreneurship, Growth, and Public Policy , CambridgeUniversity Press.
Bailey, M. N., Chakrabarti, A. K. (1988). Innovation and the Productivity Crisis, Brookings Institution,Washington
Cooke, P., & Leydesdorff, L. (2006). Regional Development in the Knowledge-Based Economy: TheConstruction of Advantage. The Journal of Technology Transfer, 31(1), 5-15.
EIS Indicators. (2009). Retrieved April 10, 2014, from European Innovation Scoreboard - EIS:http://ec.europa.eu/enterprise/policies/innovation/files/proinno/eis-2009_en.pdf
Etzkowitz, H. (2007). University-Industry-Government: The Triple Helix Model of Innovation. EOQCongresses Proceedings. 51st EOQ Congress, 22-23 May 2007. Prague.
Etzkowitz, H., & Leydesdorff, L. (1995). The Triple Helix---University-Industry-Government: A Laboratory for
Knowledge-Based Economic Development. EASST Review 14, 14-19.Eurostat Indicators. (2014). Retrieved April 10, 2014, from Eurostat:
http://epp.eurostat.ec.europa.eu/portal/page/portal/sdi/indicators/all_indicatorsGodin, B., & Gingras, Y. (2000, February). The place of universities in the system of knowledge production.
Research Policy, 29(2), 273-278.High Level Group (HLG) on Key Enabling Technologies (KET) Final Report (2011). European Commission,Ivanova, I., & Leydesdorff, L. (2012). Rotational Symmetry and the Transformation of Innovation Systems in
a Triple Helix of University-Industry-Government Relations. Technological Forecasting and SocialChange.
Levi Jakšić (2011). Sustainable Technology and Innovation management, in Y. Tsekouras, A. Damyanov, etal, ed, Recent Economic crisis and Future Development Tendencies, Rostov on Don, Russia
Levi Jakšić, M., Marinković, S., & Kojić, J. (2012a). Technology and Innovation Management in Serbia.Proceedings of the XIII International Symposium SymOrg 2012: Innovative Management and
Business Performance, (pp. 1852-1860). Zlatibor, Serbia.Levi Jakšić, M., Marinković, S., & Petković, J. (2011a). From Knowledge Based to knowledge
entrepreneurship economy and society - the Serbian paradox. Proceedings of the 30th International
1682
8/11/2019 25 - Technology and Innovation Management
http://slidepdf.com/reader/full/25-technology-and-innovation-management 11/55
Conference on Organizational Science Development, Future organization (p. 270). Portorož,Slovenia: Založba Moderna organizacija.
Levi Jakšić, M., Marinković, S., & Petković, J. (2011b). Razvoj oblasti i kurikuluma menadžmenta tehnologije.SPIN '11 VIII Skup privrednika i naučnika: Operacioni menadžment u funkciji održivog ekonomskograsta i razvoja Srbije 2011- 2020 (pp. 67-74). Beograd: Fakultet organizacionih nauka.
Levi Jakšić, M., Marinković, S., Petković, J., & Kojić, J. (2012b). Managing University Impacts on theEconomy. 31st International Conference on Organizational Science Development QUALITY.INNOVATION. FUTURE. Portorož, Slovenia.
Leydesdorff, L. (2012a). The Triple Helix, Quadruple Helix, …, and an N-Tuple of Helices: ExplanatoryModels for Analyzing the Knowledge-Based Economy? Journal of the Knowledge Economy, 3(1),25-35.
Leydesdorff, L. (2012b, February). The Triple Helix of University-Industry-Government Relations.Encyclopedia of Creativity, Innovation, and Entrepreneurship, New York .
Leydesdorff, L., & Meyer, M. (2006). Triple Helix indicators of knowledge-based innovation systems:Introduction to the special issue. Research Policy, 35 (10), 1441-1449.
Mitra, J. (2011). Entrepreneurship, Innovation and Regional Development. New York: Routledge.Mowery, D.C., Nelson, R.R., Sampat, B.N.,Ziedonis,A.A. (2004). Ivory Tower and Industrial Innovation:
University-IndustryTechnology Transfer Before and After the Bayh-Dole Act , Stanford BusinessBooks, Stanford.
OECD Indicators. (2014). Retrieved April 10, 2014, from Main Economic Indicators - complete database:
http://www.oecd-ilibrary.org/economics/data/main-economic-indicators_mei-data-enSaad, M., & Zawdie, G. (2011). Theory and Practice of the Triple Helix Model in Developing Countries:Issues and Challenges. New York: Taylor & Francis.
Shinn, T. (2002, August). The Triple Helix and New Production of Knowledge: Prepackaged Thinking onScience and Technology. Social Studies of Science, 22 (4), 599-614.
The Triple Helix Concept - Theoretical Framework . (2011). Retrieved April 15, 2014, from Triple HelixConference: www.triplehelixconference.org/th/9/the-triple-helix-concept.html
The Triple Helix Concept . (2013). Retrieved March 21, 2014, from Stanford University - Human Sciences andTechnologies Advanced Research Institute: http://hstar.stanford.edu/3helix_concept
White, M. A., & Bruton, G. D. (2007). The management of technology and innovation: a strategic approach. Mason, OH: Thomson/South-Western.
World Bank Indicators. (2014). Retrieved April 10, 2014, from World Bank:http://data.worldbank.org/indicator/
1683
8/11/2019 25 - Technology and Innovation Management
http://slidepdf.com/reader/full/25-technology-and-innovation-management 12/55
GOVERNMENT PERFORMANCE IN TECHNOLOGY AND INNOVATIONMANAGEMENT – THE CASE OF SERBIA
Sanja Marinković1, Jovana Rakićević2, Maja Levi Jakšić31University of Belgrade, Faculty of Organizational Sciences, [email protected] of Belgrade, Faculty of Organizational Sciences, [email protected]
3University of Belgrade, Faculty of Organizational Sciences, [email protected]
Abstract : This paper analyses the role of the state/government as one element of the Triple Helix model,and its role in Technology and Innovation Management (TIM). In order to observe the results of themeasures and actions taken by the government, specifically related to the management of technology andinnovation, a model was created based on selected quantitative indicators and indices. The model isdeveloped for measuring and monitoring the performance in TIM, where we: first, classified the indicatorsaccording to the three basic management functions – planning organizing and control, observed as input, process and output, respectively; and second, show the relations that exist between these three categoriesof indicators. Planning indicators are observed as the investments in technological and innovative activities;Organizing indicators include the infrastructure, public administration efficiency and cooperation support,while control indicators refer to the national economy R&D and technology transfer effects andentrepreneurship outcomes. The model is tested based on the indicators for the Republic of Serbia. It isshown that the model is applicable in real world situations as, a useful tool to: 1) analyse the dynamics andchanges that occur, 2) notice the interactions between functions of TIM, and 3) use the feedback as supportin strategic TIM decision making of a national economy.
Keywords : Triple Helix, Technology and Innovation Management, State/Government, Performance, Serbia.
1. INTRODUCTION
Contemporary management literature and practice recognize technology and innovation management (TIM)as critical success factor for firms, sectors, economies and regions. There is high evidence of steep rise in
the development of the scientific field of technology management (Cunningham, 2011) corresponding to thepractical needs of managing technology as the fundamental source of competitive advantage of firms andeconomies (Eskandari et al., 2007). Technological innovations in areas such as materials, electronics,aerospace, computers, telecommunications and biotechnology have influenced the rising dominant forces inthe world economy. Yet, there are serious concerns about “our effectiveness in generating and exploitingtechnology” (Mallick & Chaudhury, 2000). The integral technology management concept is focused onmanaging technology as external force and internal factor of the firm, meaning that both the innovative andtechnological infrastructure and the technology and innovative capacities of the firm are taken into account(Levi Jaksic et al., 2012). The main institutions and actors in technology and innovation managementprocess (at macro and micro level) can be identified as university, industry and government - the sameelements that are recognized in the Triple Helix concept.
The concept of the Triple Helix (TH) was proposed by Etzkowitz and Leydesdorff in 1990s and today it is still
developing through theoretical and empirical research. “The Triple Helix thesis is that the potential forinnovation and economic development in a Knowledge Society lies in a more prominent role for theuniversity and in the hybridization of elements from university, industry and government to generate newinstitutional and social formats for the production, transfer and application of knowledge” (Ranga & Etzkowitz,2013). University-industry-government relations develop in terms of institutional arrangements thatrecombine three functions of the socio-economic system: (1) wealth generation and retention, (2) noveltyproduction, and (3) control at the interfaces of these sub-dynamics (Leydesdorff, 2006). Overlap amonggovernments, enterprises and universities, is the core of an innovation system. Interaction among thesethree players is important determinant of knowledge production and dissemination. During this process,active interaction among these three players promotes the rising spiral of innovation (Rao et al., 2012).
In recent decades, federal, state and local governments have created a variety of mechanisms to encourageknowledge-based economic development (Etzkowitz, 2002). The structure of national R&D system can beexamined through the use of a Triple Helix framework that studies the relations among academia, business,and government (Etzkowitz, 2008). Development of a knowledge base is dependent on the condition thatknowledge production be socially organized. The interfaces between institutions and functions can be
1684
8/11/2019 25 - Technology and Innovation Management
http://slidepdf.com/reader/full/25-technology-and-innovation-management 13/55
expected to resonate into co-evolutions in some configurations more than in others (Leydesdorff, 2006). Thisconfirms the relevance of studying country specific university-industry-government configurations (see forexample Rao, 2012; Park & Leydesdorff, 2010). Also, each element of Triple Helix could be examined,putting in the context of technology and innovation management and country competitive position.
In this paper, we analyse one aspect of the Triple Helix model – the government sector, and develop a modelfor measuring and monitoring government performance in technology and innovation management (TIM).We classify TIM performance indicators (of the government sector) into three basic management functions:planning, organizing and control (POC). Since we observe these management functions as input, processand output (respectively), and present indicators for their measurement, we are able to: (1) analyse if there isa correlation between these three functions of TIM and (2) see which function is “ahead” of the others andwhich one “lags behind”, which enables us to determine the weaknesses of government sector performancein TIM. The model is tested and applied in a real world situation, with indicators taken for Serbia.
This paper is organized as follows: Section 2 explains the government role in the Triple Helix model, andobserves ways of measuring government performance; in Section 3, a model for measuring and monitoringgovernment performance in TIM is presented; in Section 4 the model is applied in the real situation ofSerbia, and Section 5 concludes the paper.
2. GOVERNMENT IN THE TRIPLE HELIX MODEL
The neo (institutional) perspective distinguishes three main configurations in the positioning of Triple Helix(TH) elements. (Ranga & Etzkowitz, 2013) In statists’ configuration, government plays the leading role,driving academia and industry, but also limiting their capacity to initiate and develop innovativetransformations. These examples could be found in Russia, China, Some Latin American and EasternEuropean countries. Laissez-faire configuration us characterized by a limited government intervention inthe economy (US, some Western Europe countries), with industry as the driving force and university withlimited role in innovation, acting mainly as a provider. Government in laissez-faire configuration is alsolimited, acting as a regulator of social and economic mechanisms. The Knowledge Society is characterizedby balanced configuration where universities and other knowledge institutions act in partnership withindustry and government and even take the lead in joint initiatives (Etzkowitz & Leydesdorff, 2000). Therehas been a shift from the model of the state encompassing industry and academia. Development strategies,whether based primarily on the industrial sector as in the US or the governmental sector as in Latin America,are being supplemented, if not replaced, by knowledge-based economic development strategies, drawingupon resources from the three spheres of Triple Helix (Etzkowitz, 2002).
2.1. Measuring government performanceBuilding knowledge based economy and society in the traditional sense and as defined by traditionalindicators is not sufficient enough for substantial economic and social progress and development.Theoretically and in practice it has been discovered that, despite the undoubtedly central role of investmentsin new knowledge in economic growth, there is still a neglected, missing link to economic growth,employment opportunities and international competitiveness (Levi Jaksic et al., 2011).
Traditional performance measurement systems have concentrated on development of indicators largelyrelating to economy (inputs) and efficiency (costs) due to the limited ability to measure effectiveness oroutcomes in government organizations (Kloot and Martin, 2000). Although government is not, neither thesupply, nor in most cases, the demand side of new knowledge and new technologies, it can promoteeffective enterprise-university interaction in order to facilitate university technology transfer by institutionalarrangements, policy making and so on (Rao et al, 2012).
According to Rao et al. (2012) there are two aspects of government R&D investments: one is governmentR&D funding which indirectly promotes university patent technology transfer activities by supporting teachingand research activities; the other is specialized government R&D programs (foundation) which directlysupport university patent technology transfer activities. Thus, based on triple helix theory, government R&Dinvestments, including government R&D funding and government R&D programs, can influence universitypatent technology transfer activities (Rao et al., 2012). It was shown (Chang-Yang, 2011) that it is difficult toevaluate the aggregate effect of public R&D support. The author found out that there are different effects ofpublic R&D support on firm R&D, depending on various firm- or industry-specific characteristics. Fourpotential channels are identified: the technological-competence-enhancing effect, the demand-creatingeffect, the R&D-cost-reducing effect and the (project) overlap (or duplication) effect.
The study (Caerteling et al. 2013) showed that government championship is an important positive factor forthe performance of technology development projects. Government championing has more impact than
1685
8/11/2019 25 - Technology and Innovation Management
http://slidepdf.com/reader/full/25-technology-and-innovation-management 14/55
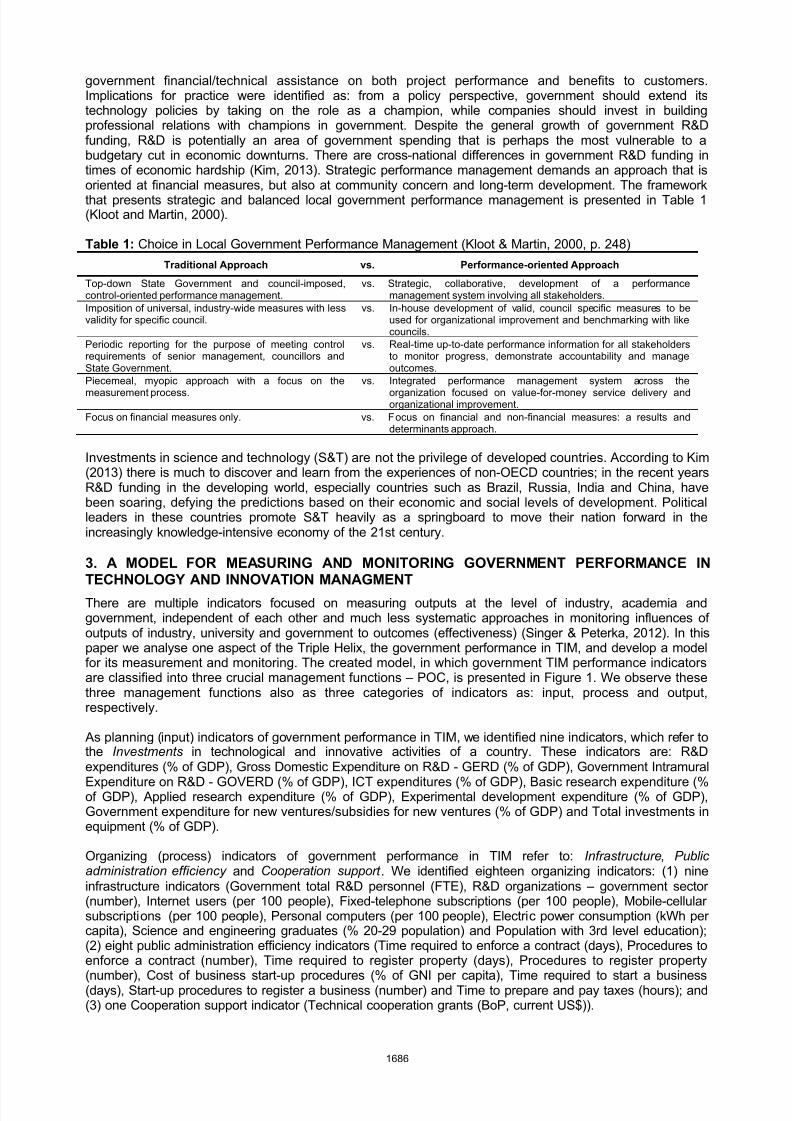
government financial/technical assistance on both project performance and benefits to customers.Implications for practice were identified as: from a policy perspective, government should extend itstechnology policies by taking on the role as a champion, while companies should invest in buildingprofessional relations with champions in government. Despite the general growth of government R&Dfunding, R&D is potentially an area of government spending that is perhaps the most vulnerable to abudgetary cut in economic downturns. There are cross-national differences in government R&D funding intimes of economic hardship (Kim, 2013). Strategic performance management demands an approach that isoriented at financial measures, but also at community concern and long-term development. The frameworkthat presents strategic and balanced local government performance management is presented in Table 1(Kloot and Martin, 2000).
Table 1: Choice in Local Government Performance Management (Kloot & Martin, 2000, p. 248)
Traditional Approach vs. Performance-oriented Approach
Top-down State Government and council-imposed,control-oriented performance management.
vs. Strategic, collaborative, development of a performancemanagement system involving all stakeholders.
Imposition of universal, industry-wide measures with lessvalidity for specific council.
vs. In-house development of valid, council specific measures to beused for organizational improvement and benchmarking with likecouncils.
Periodic reporting for the purpose of meeting controlrequirements of senior management, councillors andState Government.
vs. Real-time up-to-date performance information for all stakeholdersto monitor progress, demonstrate accountability and manageoutcomes.
Piecemeal, myopic approach with a focus on themeasurement process. vs. Integrated performance management system across theorganization focused on value-for-money service delivery andorganizational improvement.
Focus on financial measures only. vs. Focus on financial and non-financial measures: a results anddeterminants approach.
Investments in science and technology (S&T) are not the privilege of developed countries. According to Kim(2013) there is much to discover and learn from the experiences of non-OECD countries; in the recent yearsR&D funding in the developing world, especially countries such as Brazil, Russia, India and China, havebeen soaring, defying the predictions based on their economic and social levels of development. Politicalleaders in these countries promote S&T heavily as a springboard to move their nation forward in theincreasingly knowledge-intensive economy of the 21st century.
3. A MODEL FOR MEASURING AND MONITORING GOVERNMENT PERFORMANCE IN
TECHNOLOGY AND INNOVATION MANAGMENT
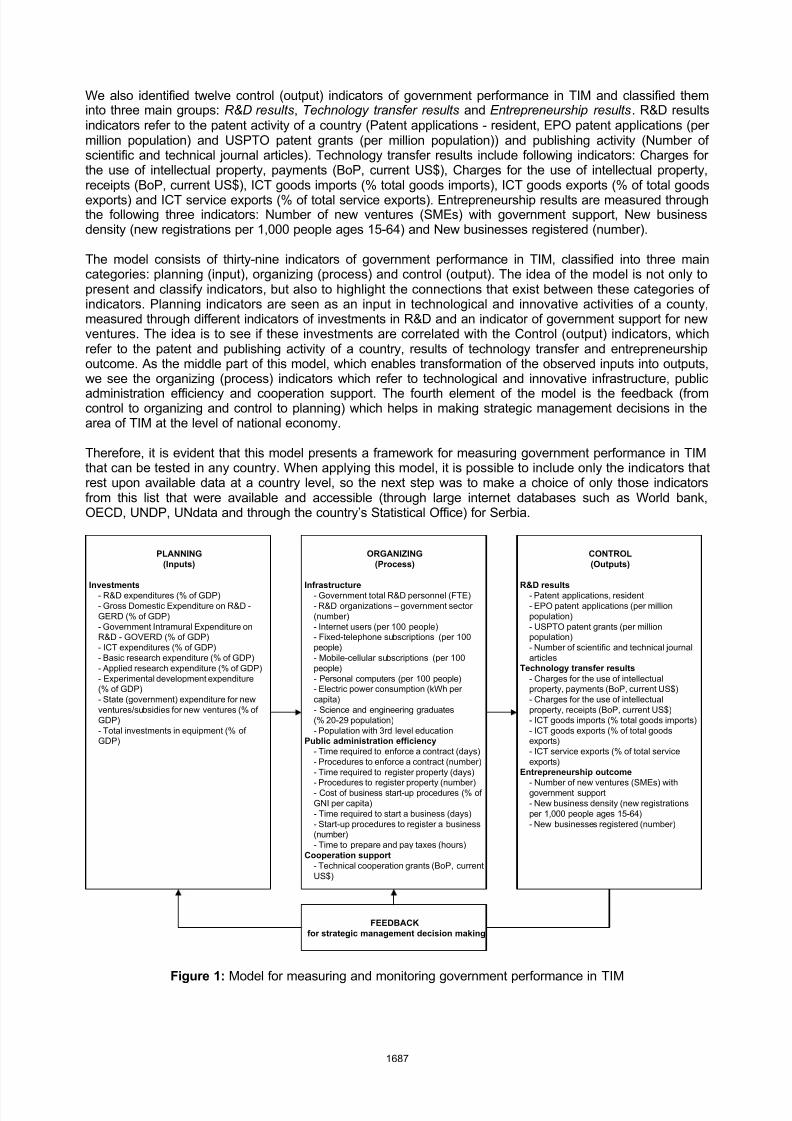
There are multiple indicators focused on measuring outputs at the level of industry, academia andgovernment, independent of each other and much less systematic approaches in monitoring influences ofoutputs of industry, university and government to outcomes (effectiveness) (Singer & Peterka, 2012). In thispaper we analyse one aspect of the Triple Helix, the government performance in TIM, and develop a modelfor its measurement and monitoring. The created model, in which government TIM performance indicatorsare classified into three crucial management functions – POC, is presented in Figure 1. We observe thesethree management functions also as three categories of indicators as: input, process and output,respectively.
As planning (input) indicators of government performance in TIM, we identified nine indicators, which refer tothe Investments in technological and innovative activities of a country. These indicators are: R&D
expenditures (% of GDP), Gross Domestic Expenditure on R&D - GERD (% of GDP), Government IntramuralExpenditure on R&D - GOVERD (% of GDP), ICT expenditures (% of GDP), Basic research expenditure (%of GDP), Applied research expenditure (% of GDP), Experimental development expenditure (% of GDP),Government expenditure for new ventures/subsidies for new ventures (% of GDP) and Total investments inequipment (% of GDP).
Organizing (process) indicators of government performance in TIM refer to: Infrastructure, Publicadministration efficiency and Cooperation support . We identified eighteen organizing indicators: (1) nineinfrastructure indicators (Government total R&D personnel (FTE), R&D organizations – government sector(number), Internet users (per 100 people), Fixed-telephone subscriptions (per 100 people), Mobile-cellularsubscriptions (per 100 people), Personal computers (per 100 people), Electric power consumption (kWh percapita), Science and engineering graduates (% 20-29 population) and Population with 3rd level education);(2) eight public administration efficiency indicators (Time required to enforce a contract (days), Procedures to
enforce a contract (number), Time required to register property (days), Procedures to register property(number), Cost of business start-up procedures (% of GNI per capita), Time required to start a business(days), Start-up procedures to register a business (number) and Time to prepare and pay taxes (hours); and(3) one Cooperation support indicator (Technical cooperation grants (BoP, current US$)).
1686
8/11/2019 25 - Technology and Innovation Management
http://slidepdf.com/reader/full/25-technology-and-innovation-management 15/55
We also identified twelve control (output) indicators of government performance in TIM and classified theminto three main groups: R&D results, Technology transfer results and Entrepreneurship results. R&D resultsindicators refer to the patent activity of a country (Patent applications - resident, EPO patent applications (permillion population) and USPTO patent grants (per million population)) and publishing activity (Number ofscientific and technical journal articles). Technology transfer results include following indicators: Charges forthe use of intellectual property, payments (BoP, current US$), Charges for the use of intellectual property,receipts (BoP, current US$), ICT goods imports (% total goods imports), ICT goods exports (% of total goodsexports) and ICT service exports (% of total service exports). Entrepreneurship results are measured throughthe following three indicators: Number of new ventures (SMEs) with government support, New businessdensity (new registrations per 1,000 people ages 15-64) and New businesses registered (number).
The model consists of thirty-nine indicators of government performance in TIM, classified into three maincategories: planning (input), organizing (process) and control (output). The idea of the model is not only topresent and classify indicators, but also to highlight the connections that exist between these categories ofindicators. Planning indicators are seen as an input in technological and innovative activities of a county,measured through different indicators of investments in R&D and an indicator of government support for newventures. The idea is to see if these investments are correlated with the Control (output) indicators, whichrefer to the patent and publishing activity of a country, results of technology transfer and entrepreneurshipoutcome. As the middle part of this model, which enables transformation of the observed inputs into outputs,
we see the organizing (process) indicators which refer to technological and innovative infrastructure, publicadministration efficiency and cooperation support. The fourth element of the model is the feedback (fromcontrol to organizing and control to planning) which helps in making strategic management decisions in thearea of TIM at the level of national economy.
Therefore, it is evident that this model presents a framework for measuring government performance in TIMthat can be tested in any country. When applying this model, it is possible to include only the indicators thatrest upon available data at a country level, so the next step was to make a choice of only those indicatorsfrom this list that were available and accessible (through large internet databases such as World bank,OECD, UNDP, UNdata and through the country’s Statistical Office) for Serbia.
PLANNING
(Inputs)
Investments
- R&D expenditures (% of GDP)- Gross Domestic Expenditure on R&D -GERD (% of GDP)- Government Intramural Expenditure onR&D - GOVERD (% of GDP)- ICT expenditures (% of GDP)- Basic research expenditure (% of GDP)- Applied research expenditure (% of GDP)- Experimental development expenditure(% of GDP)- State (government) expenditure for newventures/subsidies for new ventures (% ofGDP)- Total investments in equipment (% ofGDP)
ORGANIZING
(Process)
Infrastructure
- Government total R&D personnel (FTE)- R&D organizations – government sector(number)- Internet users (per 100 people)- Fixed-telephone subscriptions (per 100people)- Mobile-cellular subscriptions (per 100people)- Personal computers (per 100 people)- Electric power consumption (kWh percapita)- Science and engineering graduates(% 20-29 population)- Population with 3rd level education
Public administration efficiency
- Time required to enforce a contract (days)- Procedures to enforce a contract (number)
- Time required to register property (days)- Procedures to register property (number)- Cost of business start-up procedures (% ofGNI per capita)- Time required to start a business (days)- Start-up procedures to register a business(number)- Time to prepare and pay taxes (hours)
Cooperation support
- Technical cooperation grants (BoP, currentUS$)
CONTROL
(Outputs)
R&D results
- Patent applications, resident- EPO patent applications (per millionpopulation)- USPTO patent grants (per millionpopulation)- Number of scientific and technical journalarticles
Technology transfer results
- Charges for the use of intellectualproperty, payments (BoP, current US$)- Charges for the use of intellectualproperty, receipts (BoP, current US$)- ICT goods imports (% total goods imports)- ICT goods exports (% of total goodsexports)- ICT service exports (% of total serviceexports)
Entrepreneurship outcome- Number of new ventures (SMEs) withgovernment support- New business density (new registrationsper 1,000 people ages 15-64)- New businesses registered (number)
FEEDBACK
for strategic management decision making
Figure 1: Model for measuring and monitoring government performance in TIM
1687
8/11/2019 25 - Technology and Innovation Management
http://slidepdf.com/reader/full/25-technology-and-innovation-management 16/55
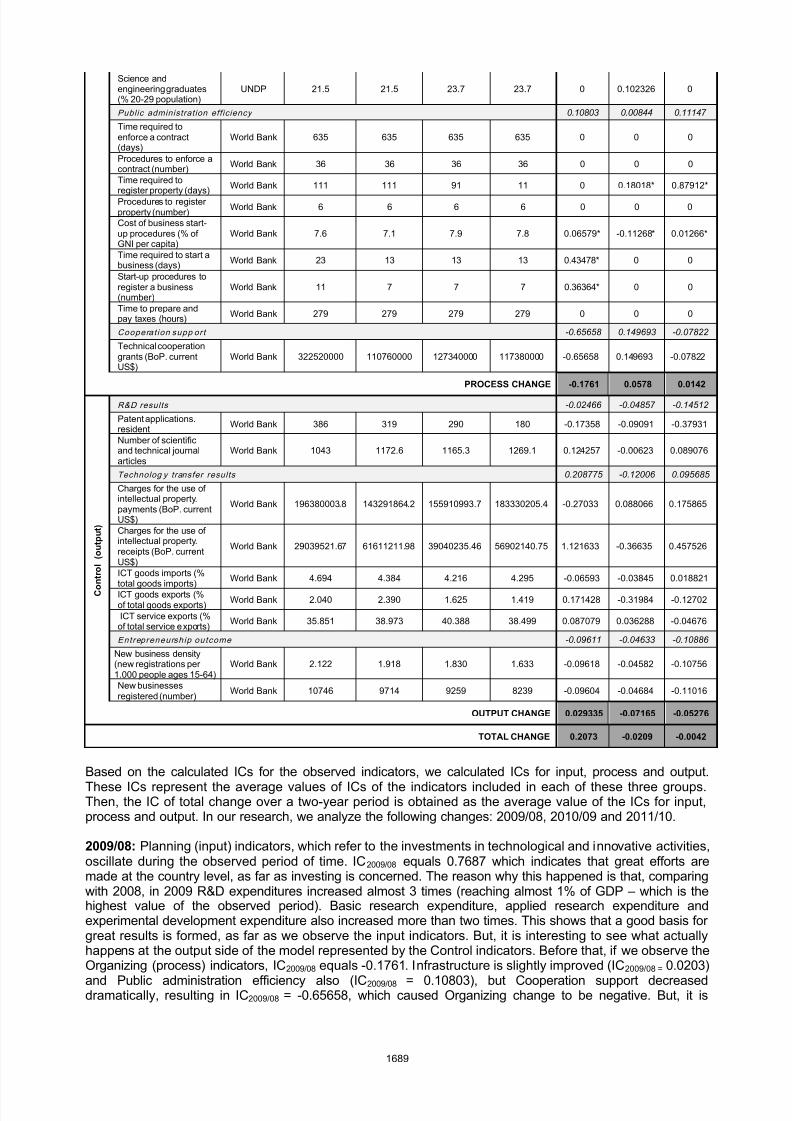
4. APPLICATION OF THE MODEL WITH INDICATORS FOR SERBIA, RESULTS ANDDISCUSSION
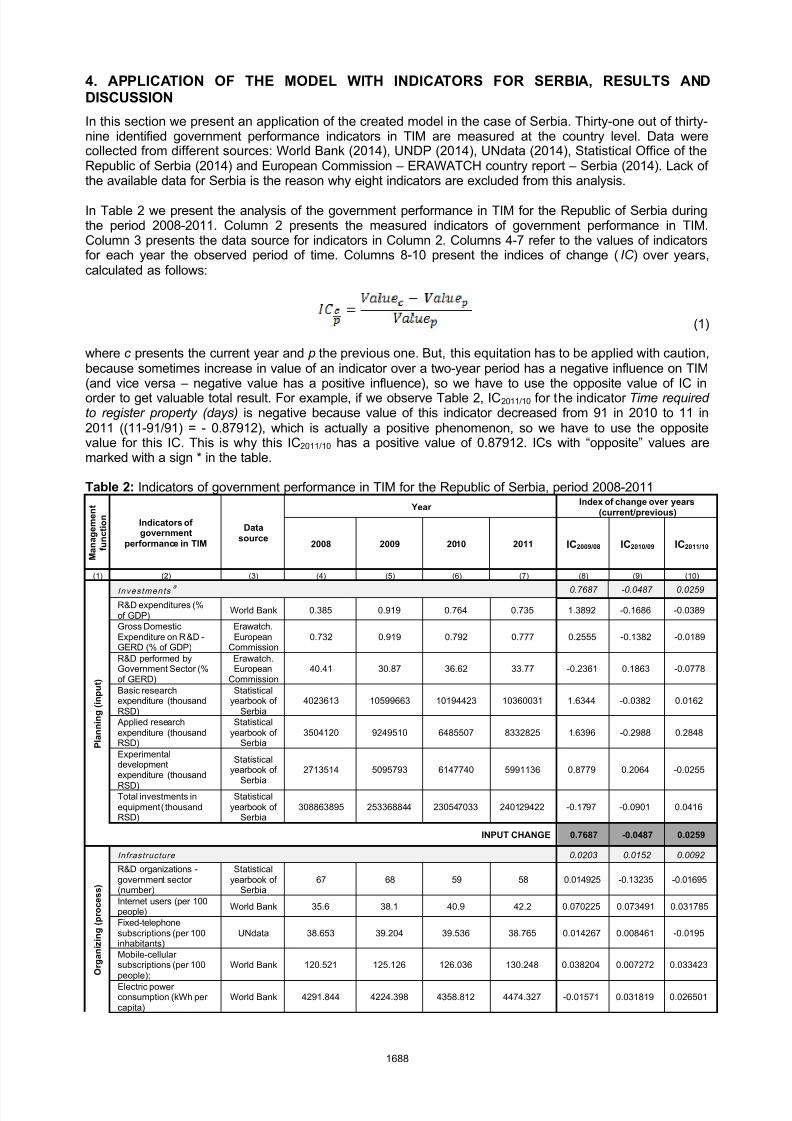
In this section we present an application of the created model in the case of Serbia. Thirty-one out of thirty-nine identified government performance indicators in TIM are measured at the country level. Data werecollected from different sources: World Bank (2014), UNDP (2014), UNdata (2014), Statistical Office of theRepublic of Serbia (2014) and European Commission – ERAWATCH country report – Serbia (2014). Lack ofthe available data for Serbia is the reason why eight indicators are excluded from this analysis.
In Table 2 we present the analysis of the government performance in TIM for the Republic of Serbia duringthe period 2008-2011. Column 2 presents the measured indicators of government performance in TIM.Column 3 presents the data source for indicators in Column 2. Columns 4-7 refer to the values of indicatorsfor each year the observed period of time. Columns 8-10 present the indices of change ( IC ) over years,calculated as follows:
(1)
where c presents the current year and p the previous one. But, this equitation has to be applied with caution,because sometimes increase in value of an indicator over a two-year period has a negative influence on TIM
(and vice versa – negative value has a positive influence), so we have to use the opposite value of IC inorder to get valuable total result. For example, if we observe Table 2, IC2011/10 for the indicator Time requiredto register property (days) is negative because value of this indicator decreased from 91 in 2010 to 11 in2011 ((11-91/91) = - 0.87912), which is actually a positive phenomenon, so we have to use the oppositevalue for this IC. This is why this IC2011/10 has a positive value of 0.87912. ICs with “opposite” values aremarked with a sign * in the table.
Table 2: Indicators of government performance in TIM for the Republic of Serbia, period 2008-2011
M a n a g e m e n t
f u n c t i o n
Indicators ofgovernment
performance in TIM
Datasource
YearIndex of change over years
(current/previous)
2008 2009 2010 2011 IC2009/08 IC2010/09 IC2011/10
(1) (2) (3) (4) (5) (6) (7) (8) (9) (10)
P l a n n i n g ( i n p u t )
Investmentsa
0.7687 -0.0487 0.0259
R&D expenditures (%of GDP)
World Bank 0.385 0.919 0.764 0.735 1.3892 -0.1686 -0.0389
Gross DomesticExpenditure on R&D -GERD (% of GDP)
Erawatch.European
Commission0.732 0.919 0.792 0.777 0.2555 -0.1382 -0.0189
R&D performed byGovernment Sector (%of GERD)
Erawatch.European
Commission40.41 30.87 36.62 33.77 -0.2361 0.1863 -0.0778
Basic researchexpenditure (thousandRSD)
Statisticalyearbook of
Serbia4023613 10599663 10194423 10360031 1.6344 -0.0382 0.0162
Applied researchexpenditure (thousandRSD)
Statisticalyearbook of
Serbia3504120 9249510 6485507 8332825 1.6396 -0.2988 0.2848
Experimentaldevelopmentexpenditure (thousandRSD)
Statistical
yearbook ofSerbia
2713514 5095793 6147740 5991136 0.8779 0.2064 -0.0255
Total investments inequipment ( thousandRSD)
Statisticalyearbook of
Serbia308863895 253368844 230547033 240129422 -0.1797 -0.0901 0.0416
INPUT CHANGE 0.7687 -0.0487 0.0259
O r g
a n i z i n g ( p r o c e s s )
Infrastructure 0.0203 0.0152 0.0092
R&D organizations -government sector(number)
Statisticalyearbook of
Serbia67 68 59 58 0.014925 -0.13235 -0.01695
Internet users (per 100people)
World Bank 35.6 38.1 40.9 42.2 0.070225 0.073491 0.031785
Fixed-telephonesubscriptions (per 100inhabitants)
UNdata 38.653 39.204 39.536 38.765 0.014267 0.008461 -0.0195
Mobile-cellular
subscriptions (per 100people);
World Bank 120.521 125.126 126.036 130.248 0.038204 0.007272 0.033423
Electric powerconsumption (kWh percapita)
World Bank 4291.844 4224.398 4358.812 4474.327 -0.01571 0.031819 0.026501
1688
8/11/2019 25 - Technology and Innovation Management
http://slidepdf.com/reader/full/25-technology-and-innovation-management 17/55
Science andengineering graduates(% 20-29 population)
UNDP 21.5 21.5 23.7 23.7 0 0.102326 0
Public administration efficiency 0.10803 0.00844 0.11147
Time required toenforce a contract(days)
World Bank 635 635 635 635 0 0 0
Procedures to enforce acontract (number) World Bank 36 36 36 36 0 0 0
Time required to
register property (days)World Bank 111 111 91 11 0 0.18018* 0.87912*
Procedures to registerproperty (number)
World Bank 6 6 6 6 0 0 0
Cost of business start-up procedures (% ofGNI per capita)
World Bank 7.6 7.1 7.9 7.8 0.06579* -0.11268* 0.01266*
Time required to start abusiness (days) World Bank 23 13 13 13 0.43478* 0 0
Start-up procedures toregister a business(number)
World Bank 11 7 7 7 0.36364* 0 0
Time to prepare andpay taxes (hours) World Bank 279 279 279 279 0 0 0
Cooperat ion supp ort -0.65658 0.149693 -0.07822
Technical cooperationgrants (BoP. currentUS$)
World Bank 322520000 110760000 127340000 117380000 -0.65658 0.149693 -0.07822
PROCESS CHANGE -0.1761 0.0578 0.0142
C o n t r o l ( o u t p u t )
R&D results -0.02466 -0.04857 -0.14512
Patent applications.resident World Bank 386 319 290 180 -0.17358 -0.09091 -0.37931
Number of scientificand technical journalarticles
World Bank 1043 1172.6 1165.3 1269.1 0.124257 -0.00623 0.089076
Technolog y transfer results 0.208775 -0.12006 0.095685
Charges for the use ofintellectual property.payments (BoP. currentUS$)
World Bank 196380003.8 143291864.2 155910993.7 183330205.4 -0.27033 0.088066 0.175865
Charges for the use ofintellectual property.receipts (BoP. currentUS$)
World Bank 29039521.67 61611211.98 39040235.46 56902140.75 1.121633 -0.36635 0.457526
ICT goods imports (%total goods imports) World Bank 4.694 4.384 4.216 4.295 -0.06593 -0.03845 0.018821ICT goods exports (%of total goods exports)
World Bank 2.040 2.390 1.625 1.419 0.171428 -0.31984 -0.12702
ICT service exports (%of total service exports)
World Bank 35.851 38.973 40.388 38.499 0.087079 0.036288 -0.04676
Entrepreneursh ip outcome -0.09611 -0.04633 -0.10886
New business density(new registrations per1.000 people ages 15-64)
World Bank 2.122 1.918 1.830 1.633 -0.09618 -0.04582 -0.10756
New businessesregistered (number)
World Bank 10746 9714 9259 8239 -0.09604 -0.04684 -0.11016
OUTPUT CHANGE 0.029335 -0.07165 -0.05276
TOTAL CHANGE 0.2073 -0.0209 -0.0042
Based on the calculated ICs for the observed indicators, we calculated ICs for input, process and output.These ICs represent the average values of ICs of the indicators included in each of these three groups.Then, the IC of total change over a two-year period is obtained as the average value of the ICs for input,process and output. In our research, we analyze the following changes: 2009/08, 2010/09 and 2011/10.
2009/08: Planning (input) indicators, which refer to the investments in technological and innovative activities,oscillate during the observed period of time. IC2009/08 equals 0.7687 which indicates that great efforts aremade at the country level, as far as investing is concerned. The reason why this happened is that, comparingwith 2008, in 2009 R&D expenditures increased almost 3 times (reaching almost 1% of GDP – which is thehighest value of the observed period). Basic research expenditure, applied research expenditure andexperimental development expenditure also increased more than two times. This shows that a good basis forgreat results is formed, as far as we observe the input indicators. But, it is interesting to see what actuallyhappens at the output side of the model represented by the Control indicators. Before that, if we observe the
Organizing (process) indicators, IC2009/08 equals -0.1761. Infrastructure is slightly improved (IC2009/08 = 0.0203)and Public administration efficiency also (IC2009/08 = 0.10803), but Cooperation support decreaseddramatically, resulting in IC2009/08 = -0.65658, which caused Organizing change to be negative. But, it is
1689
8/11/2019 25 - Technology and Innovation Management
http://slidepdf.com/reader/full/25-technology-and-innovation-management 18/55
encouraging to note that for Control (output) indicators, IC2009/08 has a positive value of 0.0293. However, thisis not a very good result if we observe the IC for the input indicators. Nevertheless, we know that, regardingtechnological and innovative activities, input cannot be immediately translated into output, so we expect thispositive change to be seen in the following years. Total IC2009/08 equals 0.2073, which is a good total resultthat indicates positive movements in government performance in TIM in Serbia.
2010/09: Input indicators’ IC2010/09 equals -0.0487 which is a bad result, compared to the previous one(IC
2009/08 = 0.7687). Investments stayed almost at the same level in 2010 as in 2009, excluding R&D
expenditures, GERD, Applied research expenditure and Total investments in equipment, which decreasedover these 2 years. Organizing (process) indicators improved - IC2010/09 = 0.0578. This is a slightimprovement that occurred because of the positive changes in all three groups that it includes (Infrastructure:IC2010/09 = 0.0152; Public administration efficiency: IC2010/09 = 0.00844; Cooperation support: IC2010/09 =0.1497). At the output side we have a worrying result: Control IC2010/09 = -0.07165. This is a result of thedecrease in all categories of output: R&D results IC2010/09 = -0.04857; Technological transfer results IC2010/09 = -0.12006; Entrepreneurship outcome IC2010/09 = -0.04633, which indicated that technological and innovativeactivities were not fertile: inputs are not being transformed into outputs at a satisfying rate. Total change, as itis expected to be, is negative: Total IC2010/09 equals -0.0209, which is much worse than the previous 2-yearperiod when total IC2009/08 was 0.2073.
2011/10: On first glance it is clear when looking at Table 2, that the results are better than in 2010/09.
Planning indicators IC2011/10 equals 0.0259. This is only a slight improvement, which has not yet reached thegreat results from 2009/08. Anyhow, a positive tendency is good to be captured. These results are aconsequence of: 1. increased investments in applied research and equipment, and 2.keeping values of allother indicators at the same level in 2011 as in 2010. Organizing indicators also improved: IC2011/10 = 0.0142(Infrastructure: IC2011/10 = 0.0092; Public administration efficiency: IC2011/10 = 0.11147; Cooperation support:IC2011/10 = -0.07822). But, on the output side, we notice the decline again – Control IC2011/10 = -0.05276. R&Dresults and Entrepreneurship outcome declined (IC2011/10 equals -0.14512 and -0.10886, respectively), whileonly Technology transfer results were better: IC2011/10 = 0.095685, mainly because the increase in Chargesfor the use of intellectual property (both payments and receipts). Total IC2011/10 = -0.0042, which indicates tothe negative trend in government performance in TIM.
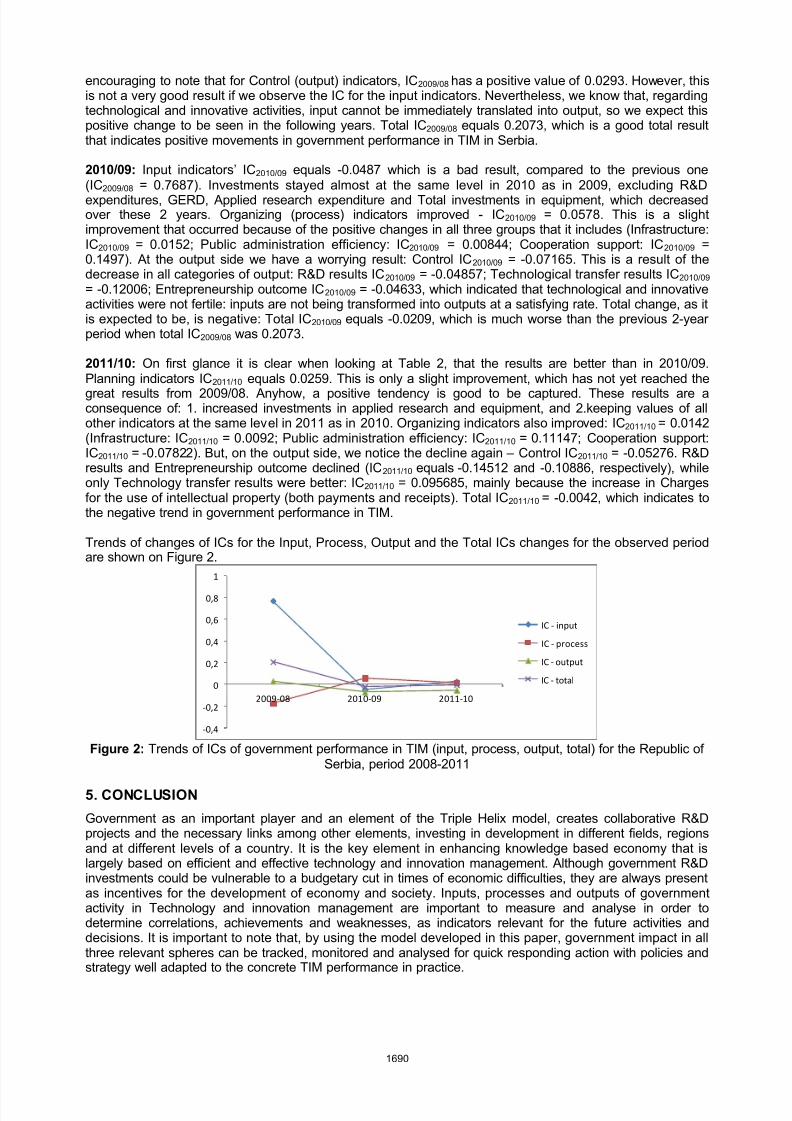
Trends of changes of ICs for the Input, Process, Output and the Total ICs changes for the observed periodare shown on Figure 2.
-0,4
-0,2
0
0,2
0,4
0,6
0,8
1
2009-08 2010-09 2011-10
IC - input
IC - process
IC - output
IC - total
Figure 2: Trends of ICs of government performance in TIM (input, process, output, total) for the Republic of
Serbia, period 2008-2011
5. CONCLUSION
Government as an important player and an element of the Triple Helix model, creates collaborative R&Dprojects and the necessary links among other elements, investing in development in different fields, regionsand at different levels of a country. It is the key element in enhancing knowledge based economy that islargely based on efficient and effective technology and innovation management. Although government R&Dinvestments could be vulnerable to a budgetary cut in times of economic difficulties, they are always presentas incentives for the development of economy and society. Inputs, processes and outputs of governmentactivity in Technology and innovation management are important to measure and analyse in order todetermine correlations, achievements and weaknesses, as indicators relevant for the future activities anddecisions. It is important to note that, by using the model developed in this paper, government impact in allthree relevant spheres can be tracked, monitored and analysed for quick responding action with policies andstrategy well adapted to the concrete TIM performance in practice.
1690
8/11/2019 25 - Technology and Innovation Management
http://slidepdf.com/reader/full/25-technology-and-innovation-management 19/55
In this paper, government performance in TIM is analysed and a model is created for its measurement andmonitoring. One of the attributes of the model is its balanced structure enabling a systematic approach to thebroad body of indicators already in use, oriented at better understanding the specific and most relevant roleof the government in creating the innovative environment for supporting the basic technology and innovationmanagement functions. In the model we classified the identified government TIM performance indicators intocategories related to the three basic management functions - POC, also observed as the input, process andoutput, respectively, and show the relations that exist between these categories of indicators. Planningindicators refer to the investments in technological and innovative activities; organizing indicators refer to thetechnological and innovative Infrastructure, public administration efficiency and cooperation support, whilecontrol indicators refer to the country’s R&D results, technology transfer results and entrepreneurshipoutcomes. Each of these categories and groups refer to the specific government TIM performance indicators,which are accessible in large internet databases such as the World Bank, OECD, UNdata, UNDP, and in theobserved country’s Statistical Office. In addition, we tested the created model in the case of the Republic ofSerbia and have shown how the collected data can be analysed in order to measure changes, notice theinteractions between the elements of the model and use the feedback as a support in making strategicmanagement decisions in the area of TIM at the country level.
Nevertheless, this is not the f inal list of government performance indicators in TIM. This is the first attempt ofthe authors to create a systematic list of these indicators, which has to be re-examined, and potentiallyspread with more government performance indicators, which will be the subject of the authors’ future
research. The authors will also conduct further research of the other two components of the Triple Helix:University and Industry. This is necessary to complete the broader picture of the contribution and results ofTriple Helix players in TIM at the national economy levels.
REFERENCES
Caerteling, J.S., Halman J.I.M., Song, M., Doree A.G. and BIj.J.D. van der (2013). How relevant isgovernment championing behavior in technology development, Journal of product innovationmanagement , 30(2): 349-363.
Chang-Yang, L. (2011). The differential effects of public RD support on firm RD: The theory and evidencefrom multi-country data, Technovation, 31 (5-6): 256-269.
Cunningham, S.W., Kwakkel, J. (2011). Innovation Forecasting: A case study of the management ofengineering and technology literature, Technological Forecasting & Social Change, 78: 346-357.
Eskandari, H., Sala-Diakanda, S., Furterer, S., et al. (2007). Enhancing the undergraduate industrialengineering curriculum, Defining desired characteristics and emerging topics, Education + Training ,49 (1): 45-55.
Etzkowitz, H, Leydesdorff L. (2000). The dynamics of innovation: from National Systems and “Mode 2” to aTriple Helix of university-industry-government relations, Research Policy , 29: 109-123.
Etzkowitz, H. (2002). The Triple Helix of University-Industry-Government: Implications for Policy andEvaluation, Working Paper 2002-11, Institutet för studier av utbildning och forskning, Stockholm.
Etzkowitz, H. (2008). The Triple Helix: University-Industry-Government Innovation in Action, Rutledge,London.
European Commission (2014). ERAWATCH, Platform on Research and Innovation policies and systems –Country report – Serbia 2011-2013. Retrieved April 1, 2014, from:http://erawatch.jrc.ec.europa.eu/erawatch/opencms/search/advance-search.html?tab=reports&country=rs#listado
Kim, S. J. (2013). Government R&D funding in economic downturns: Testing the varieties of capitalismconjecture, Science and Public Policy , July, 1-12.
Kloot, L., Martin, J. (2000). Strategic performance management: A balanced approach to performancemanagement issues in local government, Management Accounting Research, 11: 231-251.
Levi Jakšić, M., Marinković, S., Petković, J. (2011). From Knowledge Based to knowledge entrepreneurshipeconomy and society – the Serbian paradox, Proceedings of the 30th International Conference onOrganizational Science Development, Future organization, Portorož, Slovenia, Založba Modernaorganizacija, p. 720
Levi Jakšić, M., Marinković, S., Kojić, J. (2012) Technology and innovation management education in Serbia,Proceedings of the XIII International symposium SymOrg 2012 – „Innovative management andbusiness performance“, Zlatibor, 1852-1860.
Leydesdorff, L. (2006.), The Knowledge-Based Economy and the Triple Helix Model, in Wilfred Dolfsma &Luc Soete (eds.), Understanding the Dynamics of a Knowledge Economy, Edward Elgar, Cheltenham,pp. 42-76.
Mallick D.N, Chaudhury A. (2000). Technology management education in MBA programs: A comparativestudy of knowledge and skill requirements, J. Eng. Technol. Manage. 17, 153-173.
1691

8/11/2019 25 - Technology and Innovation Management
http://slidepdf.com/reader/full/25-technology-and-innovation-management 20/55
Park, H., W., Leydesdorff. Longitudinal trends in networks of university-industry-government relations inSouth Korea: The role of programmatic incentives, Research Policy, Vol. 39, No 5, June 2010, pp.640-649
Ranga, M. Etzkowitz, H. Triple Helix systems: an analytical framework for innovation policy and practice inthe Knowledge Society, Industry & Higher Education, Vol 27, No 3,August, 2013, pp 237-262.
Rao, K., Meng, X, Piccaluga A. The impact of government R&D investments on patent technology transferactivities of Chinese universities: From the perspective of triple helix theory, Journal of knowledge-based innovation in China, Vol. 4, No. 1, 2012, pp 4-17
Singer, S. and Peterka, S. O. (2012). Triple Helix Evaluation: How to test a new concept with old indicators?Ekonomski pregled , 63 (11): 608-626
Statistical Office of the Republic of Serbia (2014). Statistical Yearbooks of Serbia 2010-2013. Retrieved April5, 2014, from: http://webrzs.stat.gov.rs/WebSite/Public/PageView.aspx?pKey=452
UNdata (2014). UNdata: A world of Information – Data. Retrieved April 5, 2014, from: http://data.un.org/ UNDP (2014). Data by Country and Unit. Retrieved April 5, 2014, from: https://data.undp.org/page/projects World Bank (2014). World Bank Indicators. Retrieved April 2, 2014, from http://data.worldbank.org/indicator
1692
8/11/2019 25 - Technology and Innovation Management
http://slidepdf.com/reader/full/25-technology-and-innovation-management 21/55
MECHANISMS FOR STIMULATING INNOVATION CAPABILITIES IN WESTERN
BALKAN COUNTRIES
Dijana Štrbac1
, Đuro Kutlača2
, Lazar Živković3
1University of Belgrade, Institute Mihajlo Pupin, [email protected] of Belgrade, Institute Mihajlo Pupin, [email protected] of Belgrade, Institute Mihajlo Pupin, [email protected]
Abstract : Over the past few decades knowledge-based development and innovation are recognized as anengine of the economy development. This created revolution in R&D activities and economy. In this paperthe authors highlighted the importance of innovation for restructuring economies of Western Balkancountries. The results indicate that drivers of innovation in Western Balkan countries are generally less powerful than those in EU countries. Authors also presented policy measures that can be successfullyimplemented in order to improve communication between various stakeholders in the innovation process.
Keywords : innovation, innovation process, Western Balkan countries (WBC), mechanism for fosteringinnovation, small and medium sized enterprise (SME)
1. INTRODUCTION
The core of the continuous innovation process is the commercialization of Research and Development(R&D) results. This means transforming an invention into product or service that will be sold on the marketand provide return for the investor. Generally speaking, innovation potential of a country is determined byR&D activities, human resources engaged in them, institutions and regulations and use of information andcommunication technologies.
Innovation is important on different levels and for different reasons. On a country level, innovation is
important as an engine of economic growth. It increases human wellbeing and employment. For companies,innovation improves productivity, enables development and shareholder return.
The data presented in this paper provide evidence of existing huge differences in innovation capacity ofdeveloping and developed countries. Developing countries still lag behind developed countries when itcomes to number of researchers, R&D expenditures, number of scientific articles and patents, etc. This is thefact that restricts the scope of innovations available for commercialization.
Developing countries also have limited efficiency in the process of commercialization of R&D results. Lack ofinteraction between science and industry is major limitation of innovation process. Encouraging technologytransfer from faculties to private companies is a strategy used by many countries in order to mitigateconstraints of innovation process. Policy measures presented in this paper are being implemented with thatpurpose.
2. INNOVATION AS A KEY FACTOR OF ECONOMIC DEVELOPMENT IN MODERN SOCIETY
In the last few decades innovations have been identified as crucial driver of economic and socialdevelopment. Theory of innovation was developed by Joseph Schumpeter during the 1940s and after thatmany authors began to explore this phenomenon. Many studies have showed that innovation has main rolein acquiring comparative advantage in the individual company, as well as in the macro economy.
In a general case, “there are only two ways of increasing the output of the economy: (1) you can increase thenumber of inputs that go into the productive process, or (2) if you are clever, you can think of new ways inwhich you can get more output from the same number of inputs ” (Rosenberg, 2004). Increasing productivityof the economy is a key for raising living standard. This productivity growth can enable rising wages ofworkers and increasing national per capita income. Innovation is essential for increasing productivity. In the
long term, no economy can be competitive by just increasing inputs. The best way to raise living standard isto find new methods for combining natural, human and capital resources and increase productivity.
1693
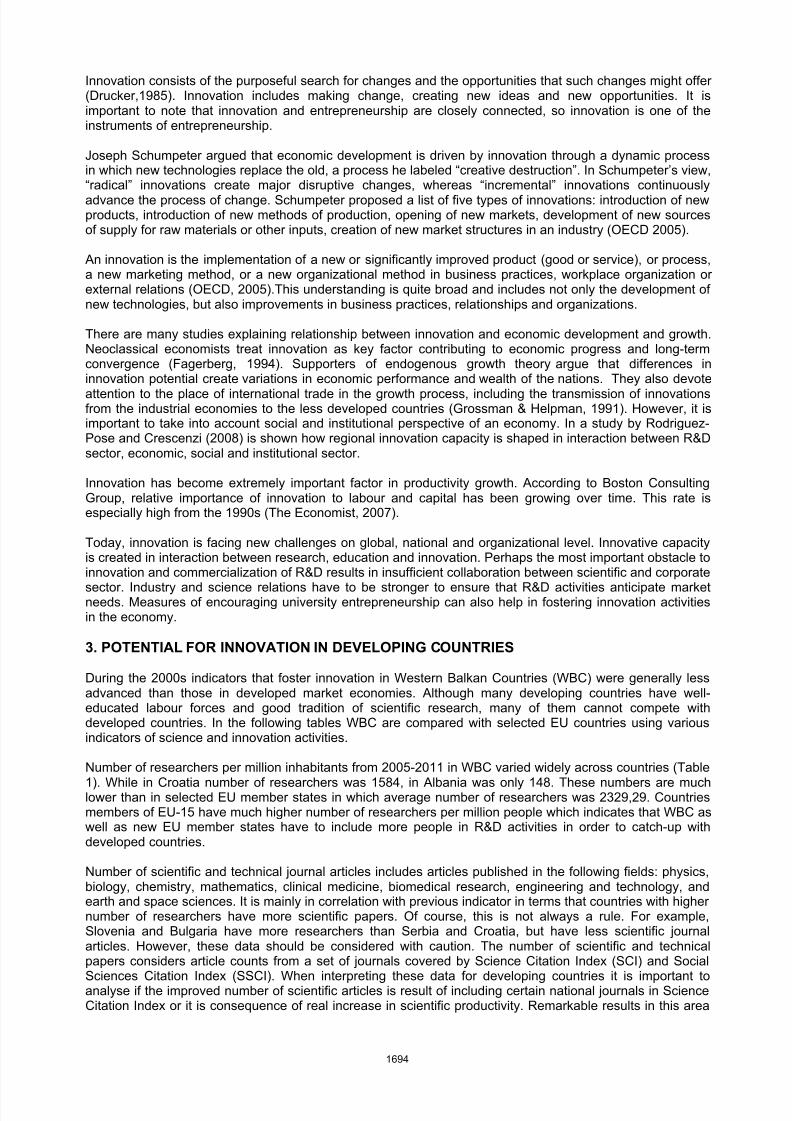
8/11/2019 25 - Technology and Innovation Management
http://slidepdf.com/reader/full/25-technology-and-innovation-management 22/55
Innovation consists of the purposeful search for changes and the opportunities that such changes might offer(Drucker,1985). Innovation includes making change, creating new ideas and new opportunities. It isimportant to note that innovation and entrepreneurship are closely connected, so innovation is one of theinstruments of entrepreneurship.
Joseph Schumpeter argued that economic development is driven by innovation through a dynamic processin which new technologies replace the old, a process he labeled “creative destruction”. In Schumpeter’s view,“radical” innovations create major disruptive changes, whereas “incremental” innovations continuouslyadvance the process of change. Schumpeter proposed a list of five types of innovations: introduction of newproducts, introduction of new methods of production, opening of new markets, development of new sourcesof supply for raw materials or other inputs, creation of new market structures in an industry (OECD 2005).
An innovation is the implementation of a new or significantly improved product (good or service), or process,a new marketing method, or a new organizational method in business practices, workplace organization orexternal relations (OECD, 2005).This understanding is quite broad and includes not only the development ofnew technologies, but also improvements in business practices, relationships and organizations.
There are many studies explaining relationship between innovation and economic development and growth.Neoclassical economists treat innovation as key factor contributing to economic progress and long-termconvergence (Fagerberg, 1994). Supporters of endogenous growth theory argue that differences in
innovation potential create variations in economic performance and wealth of the nations. They also devoteattention to the place of international trade in the growth process, including the transmission of innovationsfrom the industrial economies to the less developed countries (Grossman & Helpman, 1991). However, it isimportant to take into account social and institutional perspective of an economy. In a study by Rodriguez-Pose and Crescenzi (2008) is shown how regional innovation capacity is shaped in interaction between R&Dsector, economic, social and institutional sector.
Innovation has become extremely important factor in productivity growth. According to Boston ConsultingGroup, relative importance of innovation to labour and capital has been growing over time. This rate isespecially high from the 1990s (The Economist, 2007).
Today, innovation is facing new challenges on global, national and organizational level. Innovative capacityis created in interaction between research, education and innovation. Perhaps the most important obstacle to
innovation and commercialization of R&D results in insufficient collaboration between scientific and corporatesector. Industry and science relations have to be stronger to ensure that R&D activities anticipate marketneeds. Measures of encouraging university entrepreneurship can also help in fostering innovation activitiesin the economy.
3. POTENTIAL FOR INNOVATION IN DEVELOPING COUNTRIES
During the 2000s indicators that foster innovation in Western Balkan Countries (WBC) were generally lessadvanced than those in developed market economies. Although many developing countries have well-educated labour forces and good tradition of scientific research, many of them cannot compete withdeveloped countries. In the following tables WBC are compared with selected EU countries using variousindicators of science and innovation activities.
Number of researchers per million inhabitants from 2005-2011 in WBC varied widely across countries (Table1). While in Croatia number of researchers was 1584, in Albania was only 148. These numbers are muchlower than in selected EU member states in which average number of researchers was 2329,29. Countriesmembers of EU-15 have much higher number of researchers per million people which indicates that WBC aswell as new EU member states have to include more people in R&D activities in order to catch-up withdeveloped countries.
Number of scientific and technical journal articles includes articles published in the following fields: physics,biology, chemistry, mathematics, clinical medicine, biomedical research, engineering and technology, andearth and space sciences. It is mainly in correlation with previous indicator in terms that countries with highernumber of researchers have more scientific papers. Of course, this is not always a rule. For example,Slovenia and Bulgaria have more researchers than Serbia and Croatia, but have less scientific journalarticles. However, these data should be considered with caution. The number of scientific and technical
papers considers article counts from a set of journals covered by Science Citation Index (SCI) and SocialSciences Citation Index (SSCI). When interpreting these data for developing countries it is important toanalyse if the improved number of scientific articles is result of including certain national journals in ScienceCitation Index or it is consequence of real increase in scientific productivity. Remarkable results in this area
1694
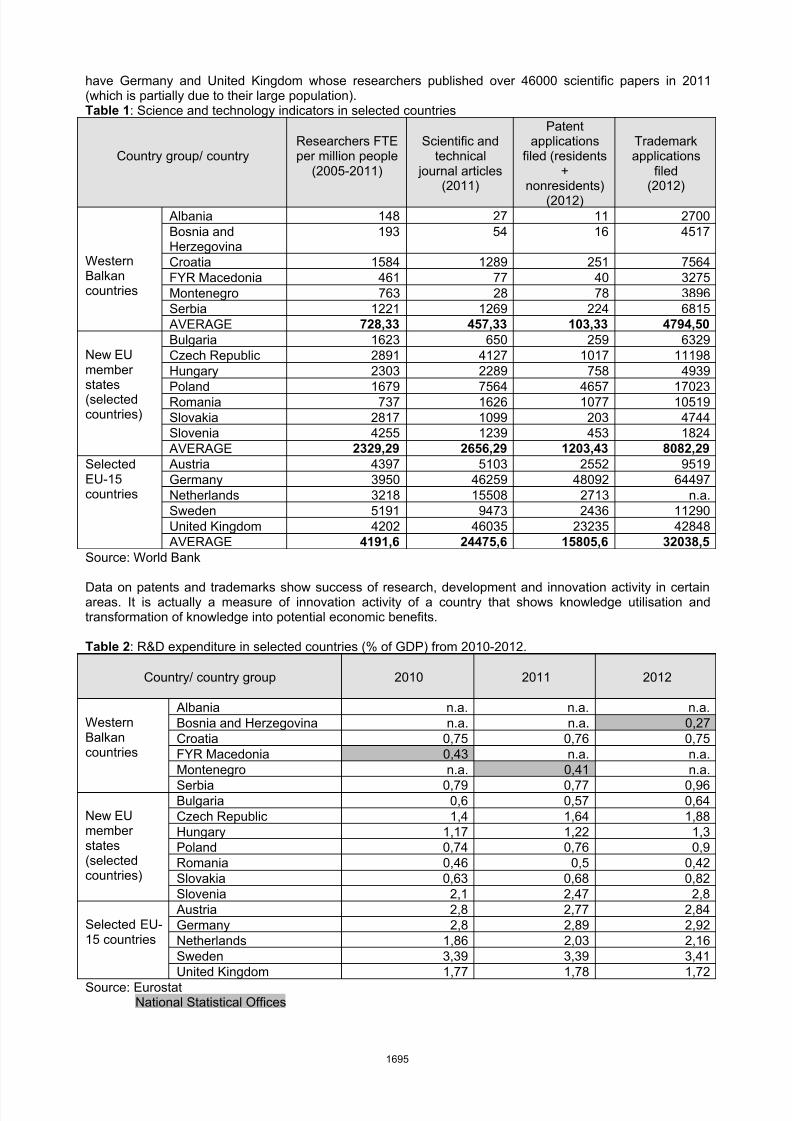
8/11/2019 25 - Technology and Innovation Management
http://slidepdf.com/reader/full/25-technology-and-innovation-management 23/55
have Germany and United Kingdom whose researchers published over 46000 scientific papers in 2011(which is partially due to their large population).Table 1: Science and technology indicators in selected countries
Country group/ countryResearchers FTEper million people
(2005-2011)
Scientific andtechnical
journal articles
(2011)
Patentapplications
filed (residents+
nonresidents)(2012)
Trademarkapplications
filed
(2012)
WesternBalkancountries
Albania 148 27 11 2700Bosnia andHerzegovina
193 54 16 4517
Croatia 1584 1289 251 7564FYR Macedonia 461 77 40 3275Montenegro 763 28 78 3896Serbia 1221 1269 224 6815 AVERAGE 728,33 457,33 103,33 4794,50
New EUmember
states(selectedcountries)
Bulgaria 1623 650 259 6329Czech Republic 2891 4127 1017 11198Hungary 2303 2289 758 4939
Poland 1679 7564 4657 17023Romania 737 1626 1077 10519Slovakia 2817 1099 203 4744Slovenia 4255 1239 453 1824 AVERAGE 2329,29 2656,29 1203,43 8082,29
SelectedEU-15countries
Austria 4397 5103 2552 9519Germany 3950 46259 48092 64497Netherlands 3218 15508 2713 n.a.Sweden 5191 9473 2436 11290United Kingdom 4202 46035 23235 42848 AVERAGE 4191,6 24475,6 15805,6 32038,5
Source: World Bank
Data on patents and trademarks show success of research, development and innovation activity in certainareas. It is actually a measure of innovation activity of a country that shows knowledge utilisation andtransformation of knowledge into potential economic benefits.
Table 2: R&D expenditure in selected countries (% of GDP) from 2010-2012.
Country/ country group 2010 2011 2012
WesternBalkancountries
Albania n.a. n.a. n.a.Bosnia and Herzegovina n.a. n.a. 0,27Croatia 0,75 0,76 0,75FYR Macedonia 0,43 n.a. n.a.
Montenegro n.a. 0,41 n.a.Serbia 0,79 0,77 0,96
New EUmemberstates(selectedcountries)
Bulgaria 0,6 0,57 0,64Czech Republic 1,4 1,64 1,88Hungary 1,17 1,22 1,3Poland 0,74 0,76 0,9Romania 0,46 0,5 0,42Slovakia 0,63 0,68 0,82Slovenia 2,1 2,47 2,8
Selected EU-15 countries
Austria 2,8 2,77 2,84Germany 2,8 2,89 2,92Netherlands 1,86 2,03 2,16
Sweden 3,39 3,39 3,41United Kingdom 1,77 1,78 1,72Source: Eurostat
National Statistical Offices
1695
8/11/2019 25 - Technology and Innovation Management
http://slidepdf.com/reader/full/25-technology-and-innovation-management 24/55
Number of patents and trademark applications filed in 2012 is also modest in WBC compared to selected EUcountries. Croatia and Serbia have highest number of patents (251 and 224), while in other countries inWestern Balkan Region this number is very low.
R&D expenditures as a percentage of GDP in the Western Balkan Region from 2010-2012 were much lowerthan in EU countries (Table 2). Certain countries even have no statistical data that would allow calculatingthis indicator. This is a serious issue because absence of statistical monitoring means the inability tocompare and improve this indicator. In 2012 in WBC higher R&D expenditure as % of GDP had Serbia (0,96)and Croatia (0,75). Most new EU member states have higher R&D expenditures, but still not as in EU-15countries. Lack of investments in R&D (especially private ones) is partly a consequence of poor businessenvironment, which reduces incentives for investing, especially when risk is high (which is characteristic ofinnovation investments).
4. DIFFERENT TYPES OF SUPPORT TO INNOVATION IN WB COUNTRIES
There are numerous examples of good practice in fostering innovation in European Union. Many of them arecollected and described under the project WBC-inco.net – Coordination of Research Policies with theWestern Balkan Countries (WBC-inco.net, 2011). In this paper will be presented policy measures that aresuitable to apply in Western Balkan Countries. They are the following: Strategic Innovation, Innovation
Officer, Innovation Voucher scheme, Soft Landing Platforms, Competition for Best Technology Innovation.
Strategic Innovation
Strategic Innovation has the aim to allow large number of small and medium-sized enterprises (SMEs) toimprove their innovation capacities. Increasing number of innovative firms is crucial for developing countrieswhich can be achieved by coaching and stimulating existing firms to develop strategic approach toinnovation.
This methodology was developed by UNU-MERIT (The United Nations University – Maastricht Economicand Social Research Institute on Innovation and Technology) in the Netherlands while participating in an EUfunded program (EdiSon) in which pilots had been performed in 15 Dutch SMEs. Because of the success in
the 15 SMEs on the one hand and the policy choices that had been made in the Euregion Meuse Rhine onthe other, UNU-MERIT developed a project proposal together with 3 other project partners in Flanders,Wallonia and Germany (WBC-inco.net, 2011).
The initiative enables management teams to re-develop their business strategy by putting priorities, makingchoices and implementing them. In that way, many SMEs are facilitated at micro level. It is conducted as 4step intervention and final implementing phase in companies. These steps of intervention include interviewswith top management, innovation scan and two strategic sessions with management team in a group.Implementing phase in companies facilitate trained consultants.
Strategic innovation implies that if one region wants to make improvements in innovation area, it isnecessary to include large number of firms that will make changes on micro level. Crucial factor of successof this program is selection and training of consultants and interest of companies for the program. This
approach is very effective and it usually gets high scores in the satisfaction surveys.
Innovation Officer
Innovation Officer is the approach that stimulates innovation in SMEs by enabling qualified staff. Innovationofficers enhance innovation results and help in overcoming bottlenecks in SMEs operating. Philosophy of thisscheme is that entrepreneurs should use knowledge to innovate, so they need new employee – innovationofficer that will act as driver of innovation. This officer should detect opportunities for innovation and findways for their effective implementation. To do this, he needs to have adequate knowledge about innovationprocesses and development. All plans he proposes should be reviewed by independent commission.
This method for enhancing innovation was developed in the Netherlands. It was part of larger programme –“Innovatie Zuid” which was financed by EU, the Dutch government and private businesses. The overall
program was managed by Brabant Development Agency (BOM) and the implementer of this measure wasSyntens, not-for-profit innovation intermediary.
1696
8/11/2019 25 - Technology and Innovation Management
http://slidepdf.com/reader/full/25-technology-and-innovation-management 25/55
Applying this method requires having good implementing agency. This agency should be independent,capable of problem definition and act as an intermediary between the entrepreneur and the innovationofficer. First step of this approach is the initial conversation with SME and defining problem/opportunity. Afterthat, intermediary agency writes innovation project and look for innovation officer. Innovation problem andinnovation officer are being presented to independent committee which makes decision about the request.Innovation officer starts working, submits reports and gets salary from the SME. SME gets money back fromthe intermediary agency based on the innovation officer’s report.
Innovation Officer Scheme is important because it can be applied in broad base of SMEs and not only inhighly innovative ones. It stimulates creating innovative culture by enabling SMEs high-educated youngprofessional.
Innovation Voucher Scheme
SMEs have generally very limited human and capital resources which do not allow them to develop their ownknow-how. This creates serious delays and missing important market opportunities. On the other hand, thereis lot of available, already developed expertise in academic institutions and large companies that can beoffered to SMEs. Since SMEs are not well informed about these external sources, they do not know enoughto use this opportunity. Reducing this gap between knowledge institutions and SMEs is main goal ofinnovative vouchers.
Innovation vouchers are usually defined as small lines of credit provided by governments to small andmedium-sized enterprises to purchase services from public knowledge providers with a view to introducinginnovations (new products, processes or services) in their business operations (OECD, 2010). Suchapproach directly stimulates knowledge transfer, but also creates long-term relationships between industryand research institutions.
Research vouchers pilot project was developed in province Limburg in the Netherlands in 1996. It wasimplemented in cooperation with multinational company DSM dealing with chemicals and advancedmaterials. The goal was to allow SMEs to make use of knowledge accumulated in DSM’s research sector. Atfirst, there was limited number of vouchers given to companies for three days advice from DSM Research. After that, certain companies got vouchers to make use of DSM Research’s expertise in certain areas. Afterthis pilot many more voucher schemes were developed both in the Netherlands and the rest of the world.
The European Commission rewarded innovation vouchers as one of the best schemes for fosteringinnovation in Europe. This measure is widely applied because it is really flexible in terms that each region/country can decide what type of knowledge will be offered under the voucher regime. This enablesadaptation of the method to specific situation in certain region.
Soft Landing Platforms
Globalization and using new technologies have created new form of competition for countries andenterprises. In modern economy companies have to face with international competition and get into newmarkets. International operating increases growth, creates comparative advantages and long termsustainability. When changing business environment, companies are coping with various problems,especially when it comes to legal and tax systems, finding employees and clients, etc.
Conquering global markets will be more successful if companies have external support. Moreover, if thatsupport comes from technology transfer intermediaries, there will be synergetic effect. Such services thathelp innovation led business to enter on foreign markets are often referred as Soft landing. Support servicesthat Soft landing agencies offer should be flexible and focused on specific company’s needs. Skills andcontacts this agency has will enable companies faster and easier managing in foreign country. There arevarious types of services that soft landing offers: business planning, market analysis, finding partners,experts and personnel, access to funding, logistic, etc.
Soft Landing Platforms are created with primary goal to offer professional consulting services to companiesstarting operating on international level. However, this has proved to be a mechanism for improvinginnovative results of the company. The created collaborations with partners from different regions andcountries contribute not only to the extension of their own networks, but also support the provision of
conditions for international collaboration for economic growth. For businesses to innovate in this way, thishas proven to be an effective mechanism for improving the innovative application of research results and forbusiness development support to start-ups and existing SMEs (Kniejski, 2013).
1697
8/11/2019 25 - Technology and Innovation Management
http://slidepdf.com/reader/full/25-technology-and-innovation-management 26/55
Competition for Best Technology Innovation
Competition for Best Technology Innovation promotes entrepreneurial spirit in the domain of high-tech andgives support to people willing to commercialize their ideas and innovations. The competition is based onthe philosophy that interaction of innovation and entrepreneurship are crucial for competitiveness of
companies, universities and the economy as a whole. It mobilizes researchers, students, companies andinnovative individuals to present results of their work.
Competition for Best Technology Innovation is successfully implementing in Serbia. It was initiated in 2005by the Ministry of Science and Environmental Protection. The idea came from the Faculty of TechnicalSciences in Novi Sad because they organized similar competition for their students in 2003. In 2007 thiscompetition began to organize in the Republic Srpska, as a result of cooperation between Ministry of Scienceand Technological Development of Serbia and the Ministry of Science and Technology of Republic Srpska.
The competition has several phases. First, competitors have to register via internet and if they passevaluation they get professional training on how to create innovative strategy for their product/service.Second phase includes creating business and marketing plan. Participants that show greatest potential andprogress present their ideas publicly – at an exhibition, semi-finals and finals. Main criteria for choosing
winner are: economic impact, novelty, growth potential and social impact. This competition has facilitatedcreation of more than 80 enterprises in Serbia and Bosnia and Herzegovina. It also helped in connecting andpresenting to each other research and business sector.
5. CONCLUSION
Commercialization of R&D results and their conversion in profitable goods and services is importantdeterminant of economic development and country competitiveness. Besides other factors, the scope ofR&D activities depends on the number of researchers and academic institutions, level of investments in thissector, government policy measures, etc.
In a modern interconnected world, innovations are becoming international, so openness to foreigntechnologies and cross-border cooperation plays important role in fostering innovation. Innovation processincludes various stakeholders and their relationships shape the effectiveness of the process. In order toensure these linkages, there should exist organisations that support entrepreneurs in introducing products,finding financial resources and establishing new spin-offs.
Available data show that drivers of innovation in Western Balkan countries were generally less advancedthan those in new EU members and developed EU economies. WBC still lag behind these countries in termsof number of researchers and scientific papers, number of patent and trademark applications, expendituresfor R&D, etc. As a consequence, innovation process in WBC is facing with significant challenges.
In order to increase the effectiveness of converting R&D investments in commercial products, there aremany policy mechanisms that can be implemented in WBC. Most of them are oriented on enhancing
innovative culture and creating stronger links between research and business sector. Strategic innovation,Innovation Officer and Innovation Vouchers enable individual firms to re-develop their business strategy andorient towards innovation. On the other hand, Soft landing Platforms offer help in getting into new markets,but still the support is given by technology transfer intermediaries. Competition for Best TechnologyInnovation educates professional and general public about the importance of entrepreneurship and R&D.
Acknowledgment
Research presented in this paper was supported by the Ministry of Education, Science and Technological
Development of the Republic of Serbia, under the project: "Research and Development of the Platform forScience Based Management of the Scientific and Technological Development of the Republic of Serbia",2011-2014, reg. no. III 47005
1698
8/11/2019 25 - Technology and Innovation Management
http://slidepdf.com/reader/full/25-technology-and-innovation-management 27/55
REFERENCES
Drucker, P. (1985). Innovation and Entrepreneurship, New York: Harper & Row.Eurostat Statistic Database. Retrieved from
http://epp.eurostat.ec.europa.eu/portal/page/portal/statistics/search_databaseFagerberg, J. (1994). Technology and International Differences in Growth Rates, Journal of Economic
Literature 32, 1147 –75.
Grossman, G. & Helpman, E. (1991). Innovation and Growth in the Global Economy , Cambridge: MIT Press.Kniejski, W. (2013). Supporting Internationalisation of SMEs through “Soft-Landing Platform Services” -
Good Practices and Experiences, Incubator Magazine III. National Statistical Offices of Bosnia and Herzegovina, FYR Macedonia and Montenegro.OECD (2012). Innovation Vouchers. Retrieved from
http://www.oecd.org/innovation/policyplatform/48135973.pdfOECD (2005). Oslo Manual - Guidelines for Collecting and Interpreting Innovation Data.Rodriguez-Pose, A. & Crescenzi, R. (2008). Research and Development, Spillovers, Innovation Systems,
and the Genesis of Regional Growth in Europe, Regional Studies 42(1), 51 –67 .Rosenberg, N. (2004). Innovation and economic growth, OECD.The Economist (2007). Something new under the sun. Retrieved from
http://www.economist.com/node/9928154WBC-inco.net (2011). Good practice examples of innovation policy approaches and instruments in the EU
Member States and the Western Balkans.World Bank Data. Retrieved from http://data.worldbank.org/
1699
8/11/2019 25 - Technology and Innovation Management
http://slidepdf.com/reader/full/25-technology-and-innovation-management 28/55
POSSIBILITIES OF OPENING UP THE STAGE-GATE MODEL
Biljana Stošić1, Radul Milutinović2
1
Faculty of Organizational Sciences, [email protected] of Organizational Sciences, [email protected]
Abstract : The paper presents basic elements of the Stage-Gate and Open innovation models, and possibleconnection of these two, resulting in what is frequently called an “ Open Stage-Gate” model. This connectionis based on opening up the new product development process and integration of the open innovation principles with the Stage-Gate concept, facilitating the import and export of information and technologies.Having in mind that the Stage Gate has originally been classified as the third generation model of innovation,the paper is dealing with the capabilities for applying the sixth generation Open innovation principles intoday’s improved and much more flexible phases and gates of the Stage Gate. Lots of innovative companiesare actually using both models in their NPD practice, looking for the most appropriate means of opening upthe well-known closed innovation, especially in the domain of ideation through co-creation.
1. INTRODUCTION
The need for lean, rapid and profitable new product/service development has never been more evident. Intoday‟s business world, product life cycle is getting shorter, the competition is getting tougher, users arebecoming more demanding, and therefore companies that do not innovate are losing pace with competitionand slowly deteriorate.
A growing number of authors and leaders from different branches identified innovation as a key driver forachieving long-term success and profitability (http://www.prod-dev.com/stage-gate.php). Most of today'scompanies with great concern talk about improvement of their innovation performance in order to deliversustainable growth and significant competitive differentiation (http://www.sopheon.com/industry-innovation/).However, it must be kept in mind that gaining competitive advantage by offering new product/service is noteasy - in fact, it is estimated that about 46% of the funds, which company invests in the development and
launch of new products/services is related to unsuccessful projects (http://www.prod-dev.com/stage-gate.php).
Having this in mind, the world's leading companies have revised their processes of product/serviceinnovation, including critical success factors discovered through research of best practice, throughintroduction of the Stage-Gate new product/service development process. Based on various independentstudies, which were conducted by leading consulting companies in the field of innovation management, itwas concluded that 70-85% of the leading companies in the U.S. use model Stage-Gate for managing theentire process from idea generation to launching of new product/service to market (http://www.prod-dev.com/stage-gate.php).
Starting from this point, the paper is organized in tree main sections, first related to linear models of newproduct/service development, describing the development of innovation models through generations and the
Stage-Gate model as a main representative of the third one; second related to open innovation model, itsfeatures and advantages; and third related to possible connection of previously mentioned models,discussing the ways of embedding the main principles of open innovation in the Stage-Gate model.
2. LINEAR MODELS AND STAGE-GATE
Innovation is identified as a key driver for strengthening of competitiveness, so that fostering innovation hasbecome one of the key priorities in every company that strives to be the leader in the field. Globally,innovation appears to be the central element of today'sknowledge-driven economy, with domination ofinformation-communactions technologies - ICT, as a key strategic dimension bringing completely new waysof communication and business. Even though the importance of innovation is recognized by most companiesand they spend a lot of money on innovation, many of these initiatives do not generate reasonable profit or
competitive advantage. Plenty of research in this topic reveals that the main problem does not lie in theinvention part or the generation of innovative ideas, but more in the successful management of theinnovation process from an idea to a successful product in the market (du Preez, Louw, 2008).Having that inmind, successful innovation demands a rigorous process for managing innovation, including a disciplined,
1700
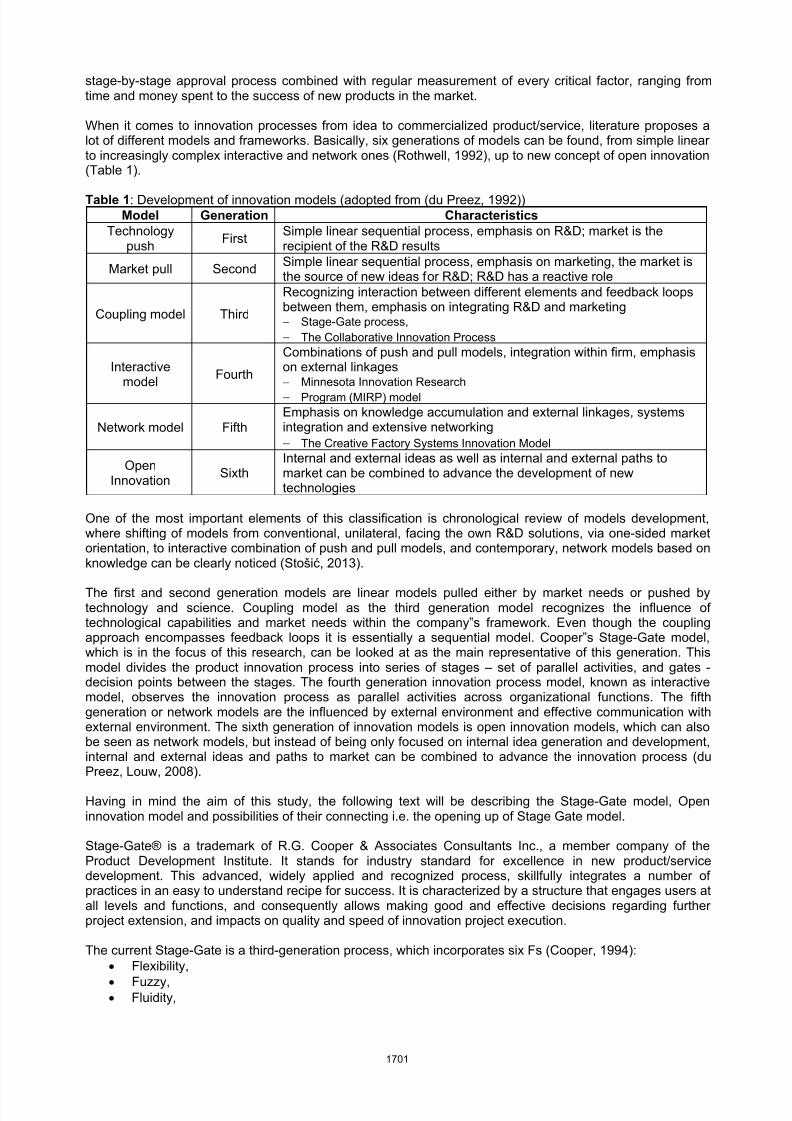
8/11/2019 25 - Technology and Innovation Management
http://slidepdf.com/reader/full/25-technology-and-innovation-management 29/55
stage-by-stage approval process combined with regular measurement of every critical factor, ranging fromtime and money spent to the success of new products in the market.
When it comes to innovation processes from idea to commercialized product/service, literature proposes alot of different models and frameworks. Basically, six generations of models can be found, from simple linearto increasingly complex interactive and network ones (Rothwell, 1992), up to new concept of open innovation(Table 1).
Table 1: Development of innovation models (adopted from (du Preez, 1992))Model Generation Characteristics
Technologypush
FirstSimple linear sequential process, emphasis on R&D; market is therecipient of the R&D results
Market pull SecondSimple linear sequential process, emphasis on marketing, the market isthe source of new ideas for R&D; R&D has a reactive role
Coupling model Third
Recognizing interaction between different elements and feedback loopsbetween them, emphasis on integrating R&D and marketing Stage-Gate process, The Collaborative Innovation Process
Interactive
modelFourth
Combinations of push and pull models, integration within firm, emphasison external linkages
Minnesota Innovation Research Program (MIRP) model
Network model FifthEmphasis on knowledge accumulation and external linkages, systemsintegration and extensive networking The Creative Factory Systems Innovation Model
OpenInnovation
SixthInternal and external ideas as well as internal and external paths tomarket can be combined to advance the development of newtechnologies
One of the most important elements of this classification is chronological review of models development,where shifting of models from conventional, unilateral, facing the own R&D solutions, via one-sided marketorientation, to interactive combination of push and pull models, and contemporary, network models based onknowledge can be clearly noticed (Stošić, 2013).
The first and second generation models are linear models pulled either by market needs or pushed bytechnology and science. Coupling model as the third generation model recognizes the influence oftechnological capabilities and market needs within the company‟s framework. Even though the couplingapproach encompasses feedback loops it is essentially a sequential model. Cooper‟s Stage-Gate model,which is in the focus of this research, can be looked at as the main representative of this generation. Thismodel divides the product innovation process into series of stages – set of parallel activities, and gates -decision points between the stages. The fourth generation innovation process model, known as interactivemodel, observes the innovation process as parallel activities across organizational functions. The fifthgeneration or network models are the influenced by external environment and effective communication withexternal environment. The sixth generation of innovation models is open innovation models, which can alsobe seen as network models, but instead of being only focused on internal idea generation and development,internal and external ideas and paths to market can be combined to advance the innovation process (du
Preez, Louw, 2008).
Having in mind the aim of this study, the following text will be describing the Stage-Gate model, Openinnovation model and possibilities of their connecting i.e. the opening up of Stage Gate model.
Stage-Gate® is a trademark of R.G. Cooper & Associates Consultants Inc., a member company of theProduct Development Institute. It stands for industry standard for excellence in new product/servicedevelopment. This advanced, widely applied and recognized process, skillfully integrates a number ofpractices in an easy to understand recipe for success. It is characterized by a structure that engages users atall levels and functions, and consequently allows making good and effective decisions regarding furtherproject extension, and impacts on quality and speed of innovation project execution.
The current Stage-Gate is a third-generation process, which incorporates six Fs (Cooper, 1994): Flexibility, Fuzzy, Fluidity,
1701
8/11/2019 25 - Technology and Innovation Management
http://slidepdf.com/reader/full/25-technology-and-innovation-management 30/55
Focus, Facilitation, Forever green.
The first three Fs makes the process less rigid, enabling it to be scaled to various size projects and enablingstages to be overlapped and approved conditionally. “Focus” means that the process is connected to astrategy. “Facilitation” refers to specific role gate keeper, who ensures that the process is properly guided. As
a final point, “forever green” suggests the continuous improvement of the process. Generally, these six Fsenables a more sophisticated process, but they also encourage more abuse of the process (Cooper, 1994).Using the Stage-Gate model improves efficiency and reduces the risk of failure, regardless whether it islaunching of new product or technology that could change the competitive image in the market, orintroduction of new products that could generate additional income for the company, or defense ofcompany‟s market share by introduction of significantly improved product (http://www.stage-gate.com/resources_stage-gate_full.php).
Stage-Gate model is a business process for value creation that is designed for quick and profitabletransformation of company‟s best ideas into new products/services. Model as such generates anorganizational culture that includes existence of the new product development process leader, strategicresponsibilities definition, high-performance teams, focus on customers and markets, excellent solutions,compliance, discipline, speed and quality.
It follows that the Stage-Gate model provides a conceptual and operational roadmap for driving new productdevelopment, from idea to launch, i.e., blueprint for managing the process of product/service innovation,aimed at increasing efficiency and effectiveness. Stage-Gate approach decomposes innovation process in aset of phases that comprise a set of planned, multi-functional and parallel activities. At the entrance to eachstage is a gate, which role is quality control and decision-making Go/Kill/Hold/Recycle to the process(Cooper, 2011).
Phases are activities undertaken by members of the team owning to gathering the information they need forproject progress toward the gate. The phases are cross-functional and activities are undertaken in parallel tospeed up the time to market. In order to provide risk management, parallel activities within a particular phasemust be designed in a way to gather important information - technical, market, financial, operational (Stošić,2013).
The model is structured in that way that in front of each stage is a gate, or decision point. The decision aboutwhether an innovation project is going to pass certain gates perform, combined, both internal managers andexternal experts, so-called gatekeepers. Gates have a dual role. First, to check whether the project met allthe criteria identified in previous gate and second, to check whether the project meets the criteria for thecurrent phase.
Every gate includes following (Stošić, 2013): Elements that represents deliverables – results of actions from the previous phase; Criteria on which the decision on project are made; Outputs, representing the results of the decision (Go/Kill/Hold/Recycle).
There are many different predefined qualitative and quantitative criteria based on which the assessment of
innovation project is made in every gate. Such criteria have to give answer on the following questions: Are the milestones connected to technology met? Does the project perform in accordance with time and budget? Could innovation concept reach potential benefits for end-users? Does the innovation concept coincide with pre-set goals and strategy?
Specific criteria are different from gate to gate and become more rigorous as the project approaches thedevelopment stage.
One of the innovation project characteristics is high risk level which to a large extent affects the innovationprocess stability and depends on the process stage. Consequently, it is useful to execute risk identification ina more precise and efficient way in order to respond in the right time and manner. This is the reason why it is
important to choose the right gatekeepers and criteria within the gates to implement the project in line withplanned. Different findings on SG benefits and weaknesses are summarized in Table 2.
Table 2: Advantages and disadvantages of Stage-Gate model
1702
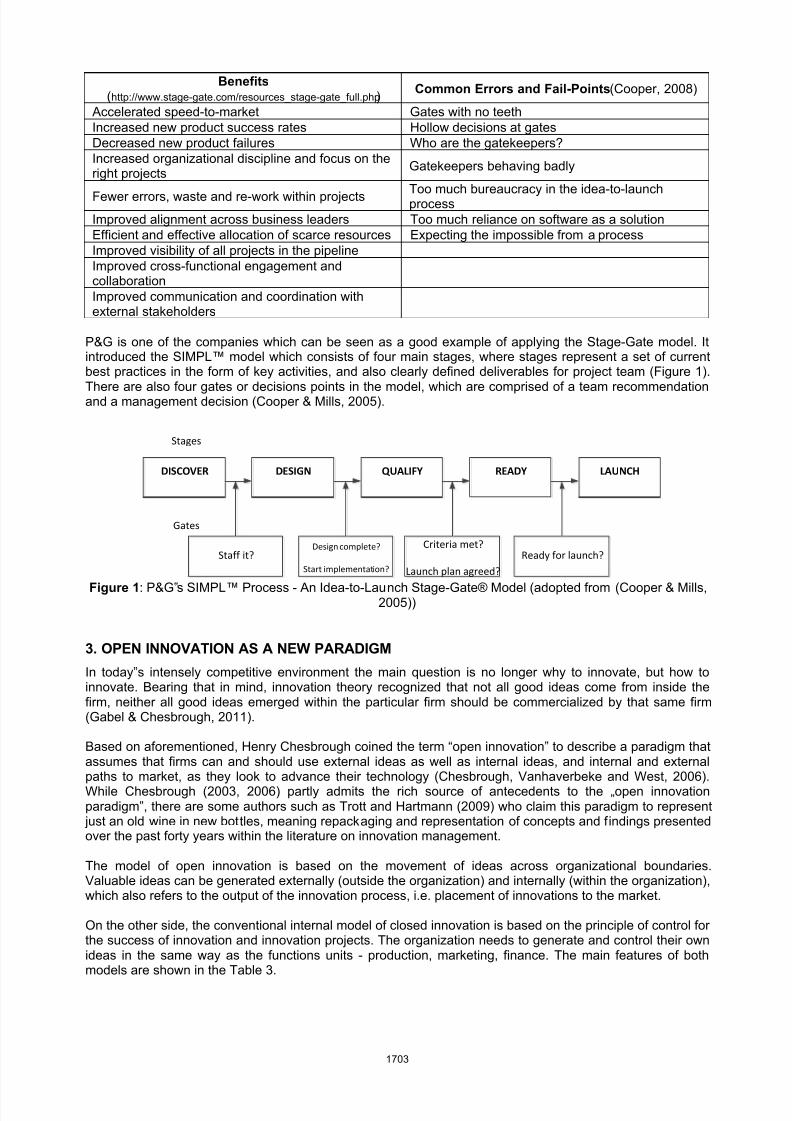
8/11/2019 25 - Technology and Innovation Management
http://slidepdf.com/reader/full/25-technology-and-innovation-management 31/55
Benefits(http://www.stage-gate.com/resources_stage-gate_full.php)
Common Errors and Fail-Points(Cooper, 2008)
Accelerated speed-to-market Gates with no teethIncreased new product success rates Hollow decisions at gatesDecreased new product failures Who are the gatekeepers?Increased organizational discipline and focus on theright projects
Gatekeepers behaving badly
Fewer errors, waste and re-work within projects Too much bureaucracy in the idea-to-launchprocessImproved alignment across business leaders Too much reliance on software as a solutionEfficient and effective allocation of scarce resources Expecting the impossible from a processImproved visibility of all projects in the pipelineImproved cross-functional engagement andcollaborationImproved communication and coordination withexternal stakeholders
P&G is one of the companies which can be seen as a good example of applying the Stage-Gate model. Itintroduced the SIMPL™ model which consists of four main stages, where stages represent a set of currentbest practices in the form of key activities, and also clearly defined deliverables for project team (Figure 1).
There are also four gates or decisions points in the model, which are comprised of a team recommendationand a management decision (Cooper & Mills, 2005).
DISCOVER DESIGN QUALIFY READY LAUNCH
Staff it?Design complete?
Start implementation?
Criteria met?
Launch plan agreed?
Ready for launch?
Stages
Gates
Figure 1: P&G‟s SIMPL™ Process - An Idea-to-Launch Stage-Gate® Model (adopted from (Cooper & Mills,2005))
3. OPEN INNOVATION AS A NEW PARADIGM
In today‟s intensely competitive environment the main question is no longer why to innovate, but how toinnovate. Bearing that in mind, innovation theory recognized that not all good ideas come from inside thefirm, neither all good ideas emerged within the particular firm should be commercialized by that same firm(Gabel & Chesbrough, 2011).
Based on aforementioned, Henry Chesbrough coined the term “open innovation” to describe a paradigm thatassumes that firms can and should use external ideas as well as internal ideas, and internal and externalpaths to market, as they look to advance their technology (Chesbrough, Vanhaverbeke and West, 2006).While Chesbrough (2003, 2006) partly admits the rich source of antecedents to the „open innovationparadigm‟, there are some authors such as Trott and Hartmann (2009) who claim this paradigm to represent just an old wine in new bottles, meaning repackaging and representation of concepts and findings presentedover the past forty years within the literature on innovation management.
The model of open innovation is based on the movement of ideas across organizational boundaries.Valuable ideas can be generated externally (outside the organization) and internally (within the organization),which also refers to the output of the innovation process, i.e. placement of innovations to the market.
On the other side, the conventional internal model of closed innovation is based on the principle of control forthe success of innovation and innovation projects. The organization needs to generate and control their own
ideas in the same way as the functions units - production, marketing, finance. The main features of bothmodels are shown in the Table 3.
1703
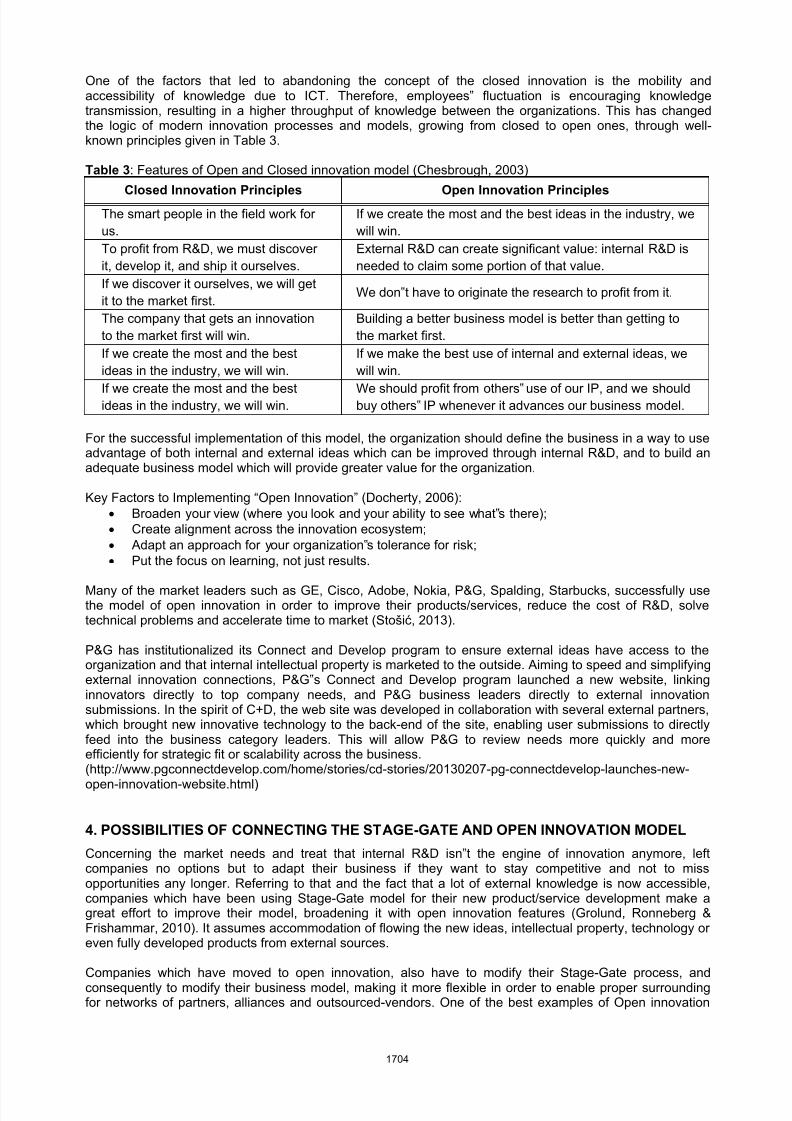
8/11/2019 25 - Technology and Innovation Management
http://slidepdf.com/reader/full/25-technology-and-innovation-management 32/55
One of the factors that led to abandoning the concept of the closed innovation is the mobility andaccessibility of knowledge due to ICT. Therefore, employees‟ fluctuation is encouraging knowledgetransmission, resulting in a higher throughput of knowledge between the organizations. This has changedthe logic of modern innovation processes and models, growing from closed to open ones, through well-known principles given in Table 3.
Table 3: Features of Open and Closed innovation model (Chesbrough, 2003)
Closed Innovation Principles Open Innovation Principles The smart people in the field work forus.
If we create the most and the best ideas in the industry, wewill win.
To profit from R&D, we must discoverit, develop it, and ship it ourselves.
External R&D can create significant value: internal R&D isneeded to claim some portion of that value.
If we discover it ourselves, we will getit to the market first.
We don‟t have to originate the research to profit from it.
The company that gets an innovationto the market first will win.
Building a better business model is better than getting tothe market first.
If we create the most and the bestideas in the industry, we will win.
If we make the best use of internal and external ideas, wewill win.
If we create the most and the bestideas in the industry, we will win.
We should profit from others‟ use of our IP, and we shouldbuy others‟ IP whenever it advances our business model.
For the successful implementation of this model, the organization should define the business in a way to useadvantage of both internal and external ideas which can be improved through internal R&D, and to build anadequate business model which will provide greater value for the organization.
Key Factors to Implementing “Open Innovation” (Docherty, 2006): Broaden your view (where you look and your ability to see what‟s there); Create alignment across the innovation ecosystem; Adapt an approach for your organization‟s tolerance for risk; Put the focus on learning, not just results.
Many of the market leaders such as GE, Cisco, Adobe, Nokia, P&G, Spalding, Starbucks, successfully usethe model of open innovation in order to improve their products/services, reduce the cost of R&D, solvetechnical problems and accelerate time to market (Stošić, 2013).
P&G has institutionalized its Connect and Develop program to ensure external ideas have access to theorganization and that internal intellectual property is marketed to the outside. Aiming to speed and simplifyingexternal innovation connections, P&G‟s Connect and Develop program launched a new website, linkinginnovators directly to top company needs, and P&G business leaders directly to external innovationsubmissions. In the spirit of C+D, the web site was developed in collaboration with several external partners,which brought new innovative technology to the back-end of the site, enabling user submissions to directlyfeed into the business category leaders. This will allow P&G to review needs more quickly and moreefficiently for strategic fit or scalability across the business.
(http://www.pgconnectdevelop.com/home/stories/cd-stories/20130207-pg-connectdevelop-launches-new-open-innovation-website.html)
4. POSSIBILITIES OF CONNECTING THE STAGE-GATE AND OPEN INNOVATION MODEL
Concerning the market needs and treat that internal R&D isn‟t the engine of innovation anymore, leftcompanies no options but to adapt their business if they want to stay competitive and not to missopportunities any longer. Referring to that and the fact that a lot of external knowledge is now accessible,companies which have been using Stage-Gate model for their new product/service development make agreat effort to improve their model, broadening it with open innovation features (Grolund, Ronneberg &Frishammar, 2010). It assumes accommodation of flowing the new ideas, intellectual property, technology oreven fully developed products from external sources.
Companies which have moved to open innovation, also have to modify their Stage-Gate process, andconsequently to modify their business model, making it more flexible in order to enable proper surroundingfor networks of partners, alliances and outsourced-vendors. One of the best examples of Open innovation
1704
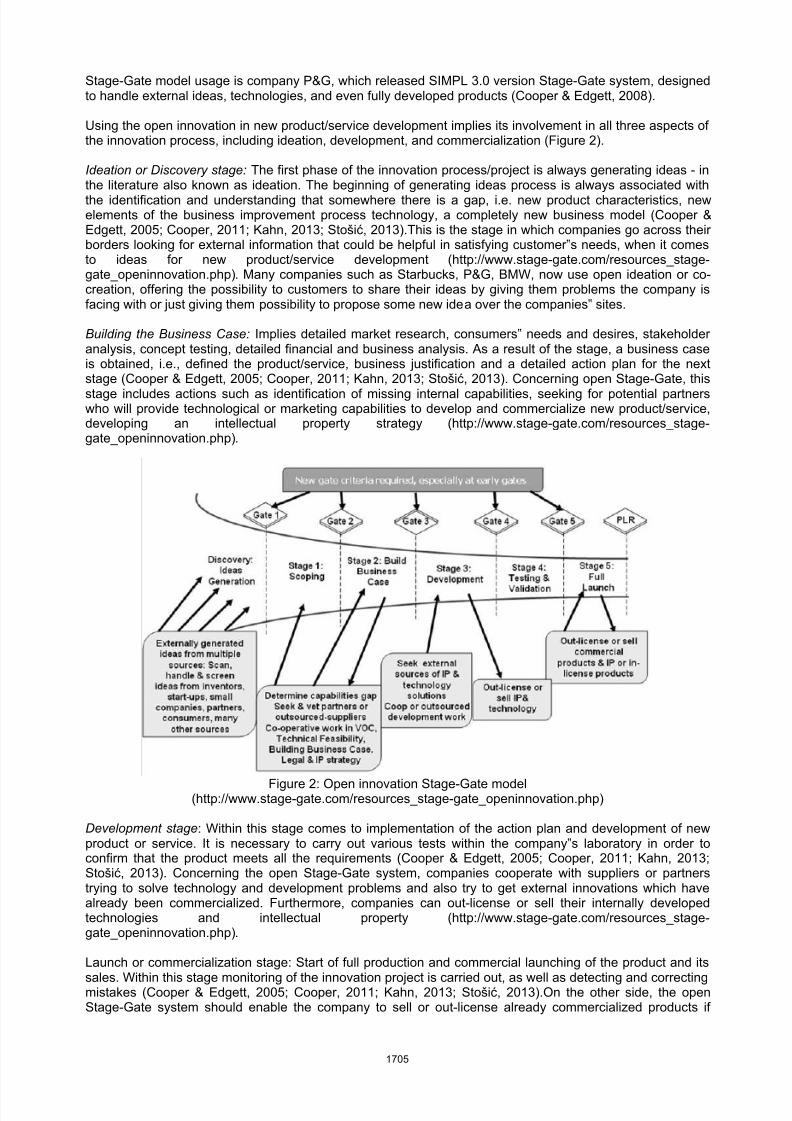
8/11/2019 25 - Technology and Innovation Management
http://slidepdf.com/reader/full/25-technology-and-innovation-management 33/55
Stage-Gate model usage is company P&G, which released SIMPL 3.0 version Stage-Gate system, designedto handle external ideas, technologies, and even fully developed products (Cooper & Edgett, 2008).
Using the open innovation in new product/service development implies its involvement in all three aspects ofthe innovation process, including ideation, development, and commercialization (Figure 2).
Ideation or Discovery stage: The first phase of the innovation process/project is always generating ideas - inthe literature also known as ideation. The beginning of generating ideas process is always associated withthe identification and understanding that somewhere there is a gap, i.e. new product characteristics, newelements of the business improvement process technology, a completely new business model (Cooper &Edgett, 2005; Cooper, 2011; Kahn, 2013; Stošić, 2013).This is the stage in which companies go across theirborders looking for external information that could be helpful in satisfying customer‟s needs, when it comesto ideas for new product/service development (http://www.stage-gate.com/resources_stage-gate_openinnovation.php). Many companies such as Starbucks, P&G, BMW, now use open ideation or co-creation, offering the possibility to customers to share their ideas by giving them problems the company isfacing with or just giving them possibility to propose some new idea over the companies‟ sites.
Building the Business Case: Implies detailed market research, consumers‟ needs and desires, stakeholderanalysis, concept testing, detailed financial and business analysis. As a result of the stage, a business caseis obtained, i.e., defined the product/service, business justification and a detailed action plan for the next
stage (Cooper & Edgett, 2005; Cooper, 2011; Kahn, 2013; Stošić, 2013). Concerning open Stage-Gate, thisstage includes actions such as identification of missing internal capabilities, seeking for potential partnerswho will provide technological or marketing capabilities to develop and commercialize new product/service,developing an intellectual property strategy (http://www.stage-gate.com/resources_stage-gate_openinnovation.php).
Figure 2: Open innovation Stage-Gate model(http://www.stage-gate.com/resources_stage-gate_openinnovation.php)
Development stage: Within this stage comes to implementation of the action plan and development of newproduct or service. It is necessary to carry out various tests within the company‟s laboratory in order toconfirm that the product meets all the requirements (Cooper & Edgett, 2005; Cooper, 2011; Kahn, 2013;Stošić, 2013). Concerning the open Stage-Gate system, companies cooperate with suppliers or partnerstrying to solve technology and development problems and also try to get external innovations which havealready been commercialized. Furthermore, companies can out-license or sell their internally developedtechnologies and intellectual property (http://www.stage-gate.com/resources_stage-gate_openinnovation.php).
Launch or commercialization stage: Start of full production and commercial launching of the product and itssales. Within this stage monitoring of the innovation project is carried out, as well as detecting and correctingmistakes (Cooper & Edgett, 2005; Cooper, 2011; Kahn, 2013; Stošić, 2013).On the other side, the openStage-Gate system should enable the company to sell or out-license already commercialized products if
1705
8/11/2019 25 - Technology and Innovation Management
http://slidepdf.com/reader/full/25-technology-and-innovation-management 34/55
there is a possibility to gain more value elsewhere; or to in-license – purchase an already commercializedproducts for achieving new growth for the company (http://www.stage-gate.com/resources_stage-gate_openinnovation.php).
Speaking about gates and criteria they include, they must also be modified in the open Stage-Gate system.In this case, not having all the capabilities to develop or execute a project doesn‟t lead to a “Kill”, but leads toseeking a partner to handle the missing elements. These modified criteria must be introduced, dealing withpartner or supplier selection and their capabilities (http://www.stage-gate.com/resources_stage-gate_openinnovation.php).
Having been a leader in Open innovation model employment, P&G also made an effort to develop andintroduce the open Stage-Gate model, frequently cited as SIMPL 3.0. This is the version of a Stage-Gatemodel and is a method used to drive products from idea to launch stages with clear go/kill criteria and timingrequirements (Panduwawala, Venkatesh, Parraguez & Zhang, 2009). In addition, one of the examples thatshould be useful to mention is General Electric‟s open Stage-Gate named “Toll-Gate” (Stage-Gate system)for handling an open innovation, both out-bound and in-bound (http://www.stage-gate.com/resources_stage-gate_openinnovation.php).
5. CONCLUSION
In this paper we discussed the opportunities to make connection between the Stage-Gate and Openinnovation model, to integrate the open innovation principles into a closed new product/service developmentmodel. As it is previously stated, open innovation principles infiltrate almost every stage of the Stage-Gateprocess, while recently the most popular engagement of open innovation is in the ideation phase. Thecompanies through co-creation or crowdsourcing try to solve current problems or even try to somehowattract end users to propose their ideas through online or offline games or over the companies‟ sites.
Various papers confirm that opening up the new product development process, in this case Stage-Gate process cangenerate significant value. On the other side, its implementation can be very challenging. We presented both Stage-Gate
and Open innovation model and emphasized the possible points of their association. When it comes to this connection,
it should be pointed out that not only changes in the Stage-Gate process has to be made but also company’s current
business model and capabilities have to be put under examination. For this model, very important is dynamic view,
where companies should continuously revaluate their business models and be aware of own capabilities in order to
successfully leverage problems when engaging in external collaborations (Chesbrough & Schwartz, 2007).
The “Open Stage-Gate” model has many benefits, starting from the fact that this model systematically integratesthe principles of open innovation with existing Stage-Gate processes; it increase companies‟ proficiency inoutbound open innovation activities (selling intellectual property - licensing); it provides systematicapplication of open innovation principles; it helps managers to continuously evaluate and adjust companies‟capabilities and business model, i.e. business model innovation; it allows systematic review and assessmentof importing intellectual property from outside the boundaries. Involvement of external know-how andtechnology can contribute the company in many ways, such as to complete a product, add value to theproduct offering, speed up the innovation process and reduce development costs (Gabel & Chesbrough,2011).
REFERENCES
Chesbrough, H. (2003). Open Innovation: The New Imperative for Creating and Profiting from Technology.Harvard Business School Press.
Chesbrough, H., & Schwartz, K. (2007).Innovating Business Models with Co-Development Partnerships.Research Technology Management, 50(1).pp 55-59
Chesbrough, H., Vanhaverbeke, W. and West, J. (2006). Open Innovation: Researching a New Paradigm.UK: Oxford University Press.
Cooper, R. G. (1994). Perspective third-generation new product processes. Journal of Product InnovationManagement, 11(1), 3-14.
Cooper, R.G. (2008). The Stage-Gate Idea-to-Launch Process–Update, What‟s New and NexGen Systems.Journal of Product Innovation Management, Volume 25, Number 3, pp 213-232
Cooper, R.G. (2011). Winning at New Products: Accelerating the Process from Idea to Launch. Third Edition.Cambridge.
1706
8/11/2019 25 - Technology and Innovation Management
http://slidepdf.com/reader/full/25-technology-and-innovation-management 35/55
Cooper, R. G. & Edgett, S. J. (2008).Maximizing productivity in product innovation. Research TechnologyManagement, 51(2).
Cooper, R. G., & Edgett, S. J. (2005). Lean, rapid, and profitable new product development. Productdevelopment institute.
Cooper, R. G. &Mills, M. S. (2005).Succeeding at New Product Development the P&G way: A key element isusing the “Innovation Diamond”. Product Development Institute Inc.
Docherty, M. (2006). Primer on „open innovation‟: Principles and practice. Visions, XXX, 2.Drucker, P (1985). Innovation and Entrepreneurship: practice and principles. London: Heinemann.Du Preez, N. D. & Louw, L. (2008).A framework for managing the innovation process. Management of
Engineering &Technology.PICMET 2008. Portland International Conference on (pp. 546-558). IEEE.Gabel, D. and Chesbrough, H. (2011).A Guide to Developing a Portfolio of Ideas and Experiments. Filene
Research Institute.Grolund, J., Ronneberg, D. and Frishammar, J. (2010). Open Innovation and the Stage-Gate Process: A
Revised Model for New Product Development. California Management Review 5, 3: 106-131.Kahn K. (2013). The PDMA Handbook of New Product Development.3rd Edition. John Wiley & Sons. New
Jersey.Panduwawala, L., Venkatesh, S., Parraguez, P. & Zhang, X. (2009). Connect and Develop - P&G's big stake
in open innovation. University of Bath.Rothwell, R. (1992). Successful industrial innovation: critical factors for the 1990s. R&D Management.Vol
22:3. pp. 221 – 239.
Stošić, B. (2013). Innovation Management – Innovation projects, models and Methods, Faculty ofOrganizational Sciences, Belgrade.Trott, P. (2005). Innovation Management and New Product Development. 3rd edition. Harlow, England:
Pearson Education Limited.Trott, P. & Hartmann, D. (2009). Why'open innovation' is old wine in new bottles. International Journal of
Innovation Management, 13(04), 715-736.http://www.prod-dev.com/stage-gate.php http://www.sopheon.com/industry-innovation/ http://www.stage-gate.com/resources_stage-gate_full.phphttp://www.stage-gate.com/resources_stage-gate_openinnovation.php
1707
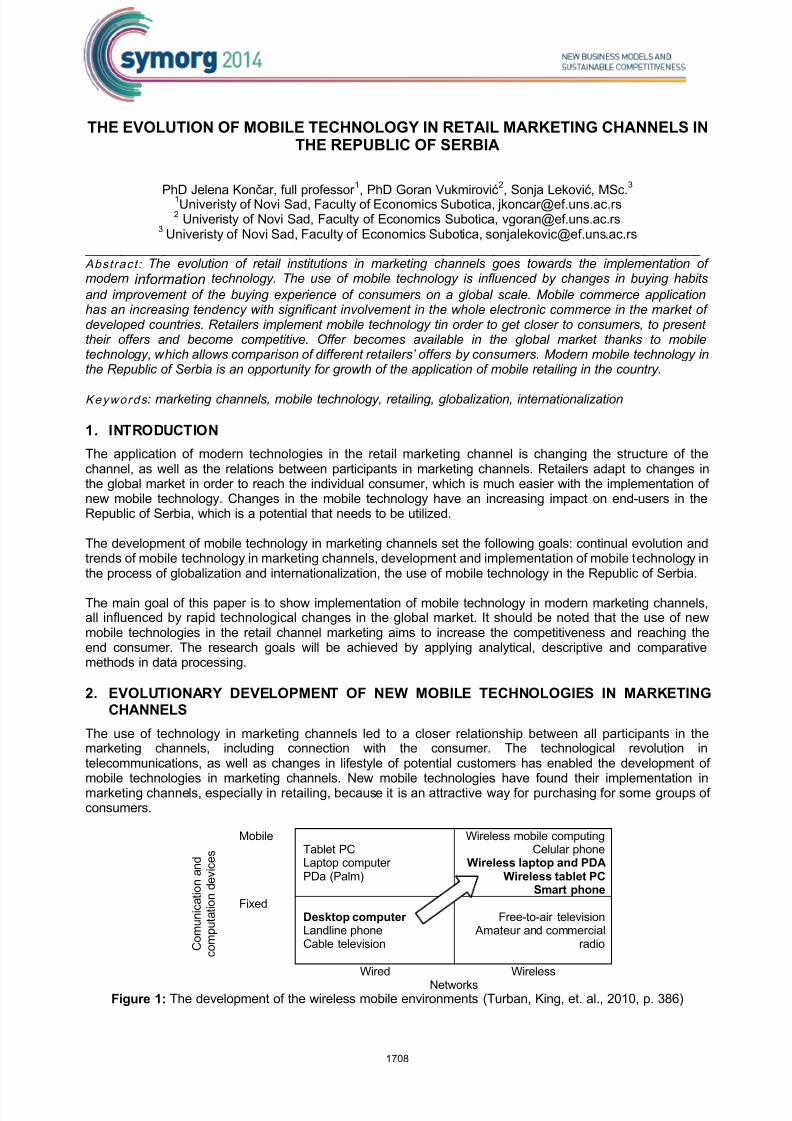
8/11/2019 25 - Technology and Innovation Management
http://slidepdf.com/reader/full/25-technology-and-innovation-management 36/55
THE EVOLUTION OF MOBILE TECHNOLOGY IN RETAIL MARKETING CHANNELS INTHE REPUBLIC OF SERBIA
PhD Jelena Končar, full professor 1
, PhD Goran Vukmirović2
, Sonja Leković, MSc.3
1Univeristy of Novi Sad, Faculty of Economics Subotica, [email protected] Univeristy of Novi Sad, Faculty of Economics Subotica, [email protected]
3 Univeristy of Novi Sad, Faculty of Economics Subotica, [email protected] ______________________________________________________________________________________Abstract : The evolution of retail institutions in marketing channels goes towards the implementation ofmodern information technology. The use of mobile technology is influenced by changes in buying habits
and improvement of the buying experience of consumers on a global scale. Mobile commerce applicationhas an increasing tendency with significant involvement in the whole electronic commerce in the market ofdeveloped countries. Retailers implement mobile technology tin order to get closer to consumers, to presenttheir offers and become competitive. Offer becomes available in the global market thanks to mobiletechnology, which allows comparison of different retailers’ offers by consumers. Modern mobile technology inthe Republic of Serbia is an opportunity for growth of the application of mobile retailing in the country.
Keywords : marketing channels, mobile technology, retailing, globalization, internationalization
1. INTRODUCTION
The application of modern technologies in the retail marketing channel is changing the structure of thechannel, as well as the relations between participants in marketing channels. Retailers adapt to changes inthe global market in order to reach the individual consumer, which is much easier with the implementation ofnew mobile technology. Changes in the mobile technology have an increasing impact on end-users in theRepublic of Serbia, which is a potential that needs to be utilized.
The development of mobile technology in marketing channels set the following goals: continual evolution andtrends of mobile technology in marketing channels, development and implementation of mobile technology in
the process of globalization and internationalization, the use of mobile technology in the Republic of Serbia.
The main goal of this paper is to show implementation of mobile technology in modern marketing channels,all influenced by rapid technological changes in the global market. It should be noted that the use of newmobile technologies in the retail channel marketing aims to increase the competitiveness and reaching theend consumer. The research goals will be achieved by applying analytical, descriptive and comparativemethods in data processing.
2. EVOLUTIONARY DEVELOPMENT OF NEW MOBILE TECHNOLOGIES IN MARKETINGCHANNELS
The use of technology in marketing channels led to a closer relationship between all participants in themarketing channels, including connection with the consumer. The technological revolution in
telecommunications, as well as changes in lifestyle of potential customers has enabled the development ofmobile technologies in marketing channels. New mobile technologies have found their implementation inmarketing channels, especially in retailing, because it is an attractive way for purchasing for some groups ofconsumers.
C o m u n i c a t i o n a n d
c o m p u t a t i o n d e v i c e s
MobileTablet PCLaptop computerPDa (Palm)
Wireless mobile computingCelular phone
Wireless laptop and PDAWireless tablet PC
Smart phone
FixedDesktop computerLandline phoneCable television
Free-to-air television Amateur and commercial
radio
Wired WirelessNetworks
Figure 1: The development of the wireless mobile environments (Turban, King, et. al., 2010, p. 386)
1708
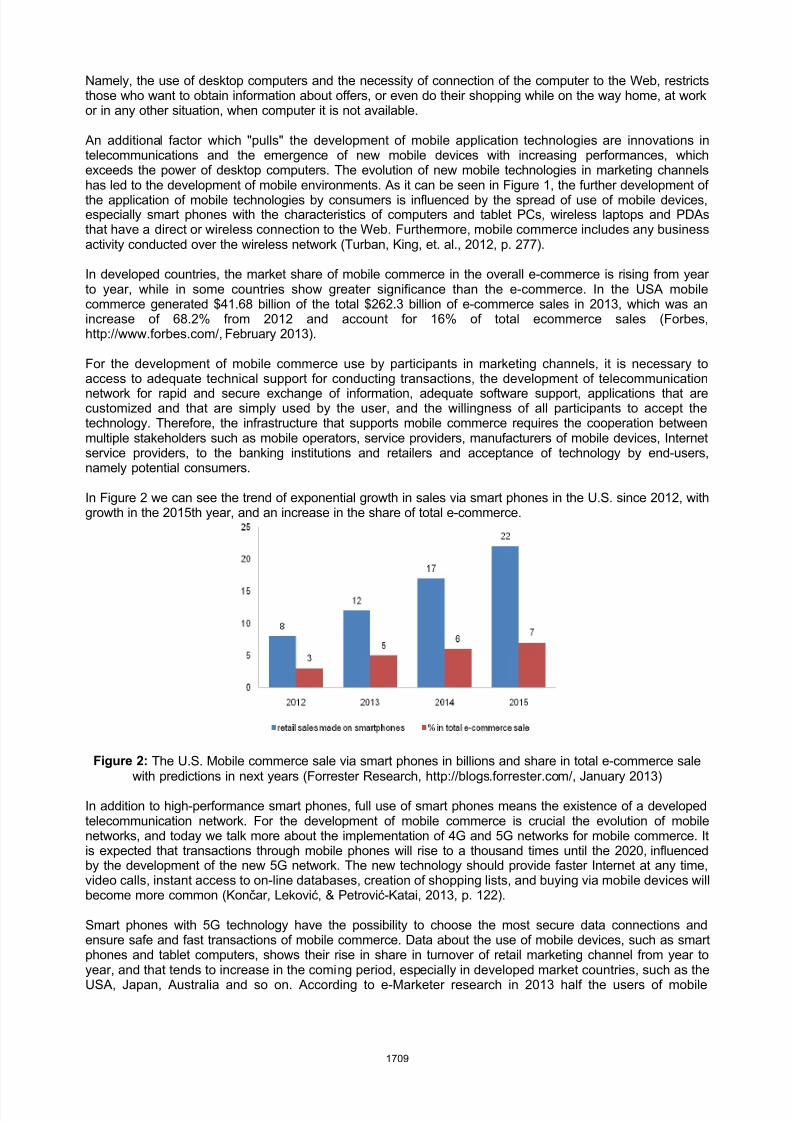
8/11/2019 25 - Technology and Innovation Management
http://slidepdf.com/reader/full/25-technology-and-innovation-management 37/55
Namely, the use of desktop computers and the necessity of connection of the computer to the Web, restrictsthose who want to obtain information about offers, or even do their shopping while on the way home, at workor in any other situation, when computer it is not available.
An additional factor which "pulls" the development of mobile application technologies are innovations intelecommunications and the emergence of new mobile devices with increasing performances, whichexceeds the power of desktop computers. The evolution of new mobile technologies in marketing channelshas led to the development of mobile environments. As it can be seen in Figure 1, the further development ofthe application of mobile technologies by consumers is influenced by the spread of use of mobile devices,especially smart phones with the characteristics of computers and tablet PCs, wireless laptops and PDAsthat have a direct or wireless connection to the Web. Furthermore, mobile commerce includes any businessactivity conducted over the wireless network (Turban, King, et. al., 2012, p. 277).
In developed countries, the market share of mobile commerce in the overall e-commerce is rising from yearto year, while in some countries show greater significance than the e-commerce. In the USA mobilecommerce generated $41.68 billion of the total $262.3 billion of e-commerce sales in 2013, which was anincrease of 68.2% from 2012 and account for 16% of total ecommerce sales (Forbes,http://www.forbes.com/, February 2013).
For the development of mobile commerce use by participants in marketing channels, it is necessary to
access to adequate technical support for conducting transactions, the development of telecommunicationnetwork for rapid and secure exchange of information, adequate software support, applications that arecustomized and that are simply used by the user, and the willingness of all participants to accept thetechnology. Therefore, the infrastructure that supports mobile commerce requires the cooperation betweenmultiple stakeholders such as mobile operators, service providers, manufacturers of mobile devices, Internetservice providers, to the banking institutions and retailers and acceptance of technology by end-users,namely potential consumers.
In Figure 2 we can see the trend of exponential growth in sales via smart phones in the U.S. since 2012, withgrowth in the 2015th year, and an increase in the share of total e-commerce.
Figure 2: The U.S. Mobile commerce sale via smart phones in billions and share in total e-commerce salewith predictions in next years (Forrester Research, http://blogs.forrester.com/, January 2013)
In addition to high-performance smart phones, full use of smart phones means the existence of a developedtelecommunication network. For the development of mobile commerce is crucial the evolution of mobilenetworks, and today we talk more about the implementation of 4G and 5G networks for mobile commerce. Itis expected that transactions through mobile phones will rise to a thousand times until the 2020, influencedby the development of the new 5G network. The new technology should provide faster Internet at any time,video calls, instant access to on-line databases, creation of shopping lists, and buying via mobile devices willbecome more common (Končar, Leković, & Petrović-Katai, 2013, p. 122).
Smart phones with 5G technology have the possibility to choose the most secure data connections andensure safe and fast transactions of mobile commerce. Data about the use of mobile devices, such as smartphones and tablet computers, shows their rise in share in turnover of retail marketing channel from year toyear, and that tends to increase in the coming period, especially in developed market countries, such as theUSA, Japan, Australia and so on. According to e-Marketer research in 2013 half the users of mobile
1709
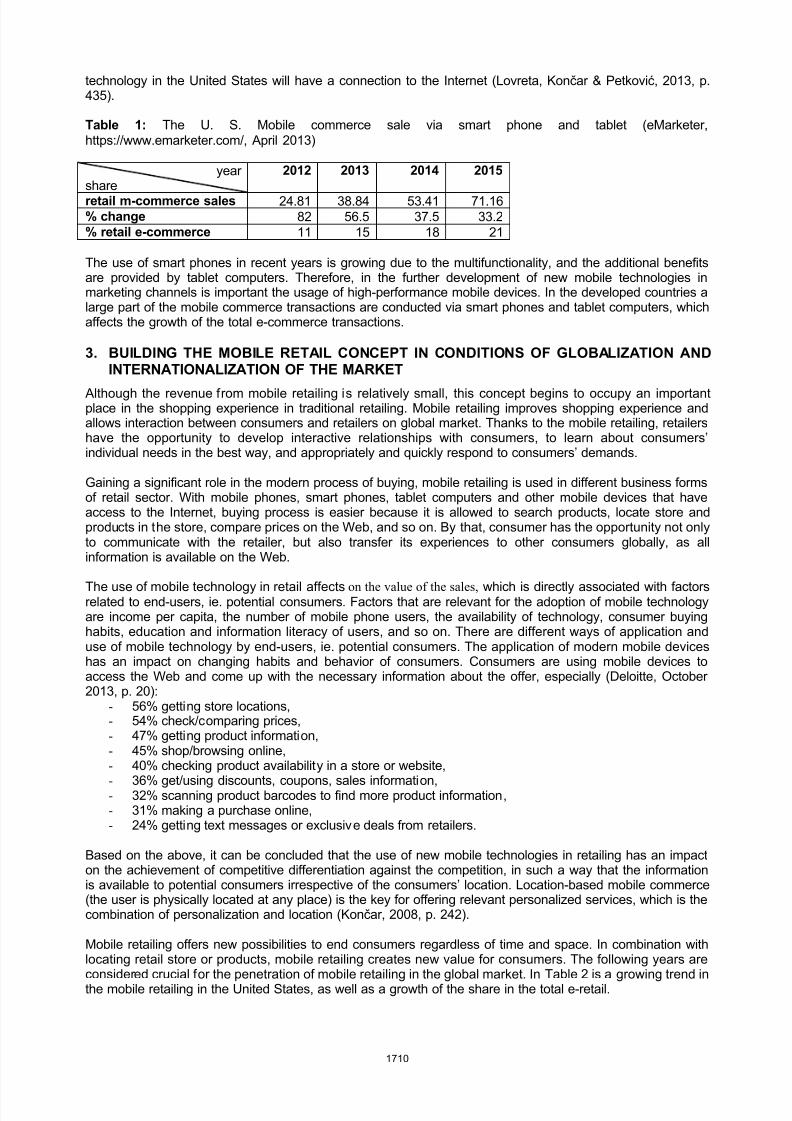
8/11/2019 25 - Technology and Innovation Management
http://slidepdf.com/reader/full/25-technology-and-innovation-management 38/55
technology in the United States will have a connection to the Internet (Lovreta, Končar & Petković, 2013, p.435).
Table 1: The U. S. Mobile commerce sale via smart phone and tablet (eMarketer,https://www.emarketer.com/, April 2013)
year
share
2012 2013 2014 2015
retail m-commerce sales 24.81 38.84 53.41 71.16% change 82 56.5 37.5 33.2% retail e-commerce 11 15 18 21
The use of smart phones in recent years is growing due to the multifunctionality, and the additional benefitsare provided by tablet computers. Therefore, in the further development of new mobile technologies inmarketing channels is important the usage of high-performance mobile devices. In the developed countries alarge part of the mobile commerce transactions are conducted via smart phones and tablet computers, whichaffects the growth of the total e-commerce transactions.
3. BUILDING THE MOBILE RETAIL CONCEPT IN CONDITIONS OF GLOBALIZATION ANDINTERNATIONALIZATION OF THE MARKET
Although the revenue from mobile retailing is relatively small, this concept begins to occupy an importantplace in the shopping experience in traditional retailing. Mobile retailing improves shopping experience andallows interaction between consumers and retailers on global market. Thanks to the mobile retailing, retailershave the opportunity to develop interactive relationships with consumers, to learn about consumers’individual needs in the best way, and appropriately and quickly respond to consumers’ demands.
Gaining a significant role in the modern process of buying, mobile retailing is used in different business formsof retail sector. With mobile phones, smart phones, tablet computers and other mobile devices that haveaccess to the Internet, buying process is easier because it is allowed to search products, locate store andproducts in the store, compare prices on the Web, and so on. By that, consumer has the opportunity not onlyto communicate with the retailer, but also transfer its experiences to other consumers globally, as allinformation is available on the Web.
The use of mobile technology in retail affects on the value of the sales, which is directly associated with factorsrelated to end-users, ie. potential consumers. Factors that are relevant for the adoption of mobile technologyare income per capita, the number of mobile phone users, the availability of technology, consumer buyinghabits, education and information literacy of users, and so on. There are different ways of application anduse of mobile technology by end-users, ie. potential consumers. The application of modern mobile deviceshas an impact on changing habits and behavior of consumers. Consumers are using mobile devices toaccess the Web and come up with the necessary information about the offer, especially (Deloitte, October2013, p. 20):
- 56% getting store locations,- 54% check/comparing prices,- 47% getting product information,- 45% shop/browsing online,
- 40% checking product availability in a store or website,- 36% get/using discounts, coupons, sales information,- 32% scanning product barcodes to find more product information,- 31% making a purchase online,- 24% getting text messages or exclusive deals from retailers.
Based on the above, it can be concluded that the use of new mobile technologies in retailing has an impacton the achievement of competitive differentiation against the competition, in such a way that the informationis available to potential consumers irrespective of the consumers’ location. Location-based mobile commerce(the user is physically located at any place) is the key for offering relevant personalized services, which is thecombination of personalization and location (Končar, 2008, p. 242).
Mobile retailing offers new possibilities to end consumers regardless of time and space. In combination with
locating retail store or products, mobile retailing creates new value for consumers. The following years areconsidered crucial for the penetration of mobile retailing in the global market. In Table 2 is a growing trend inthe mobile retailing in the United States, as well as a growth of the share in the total e-retail.
1710
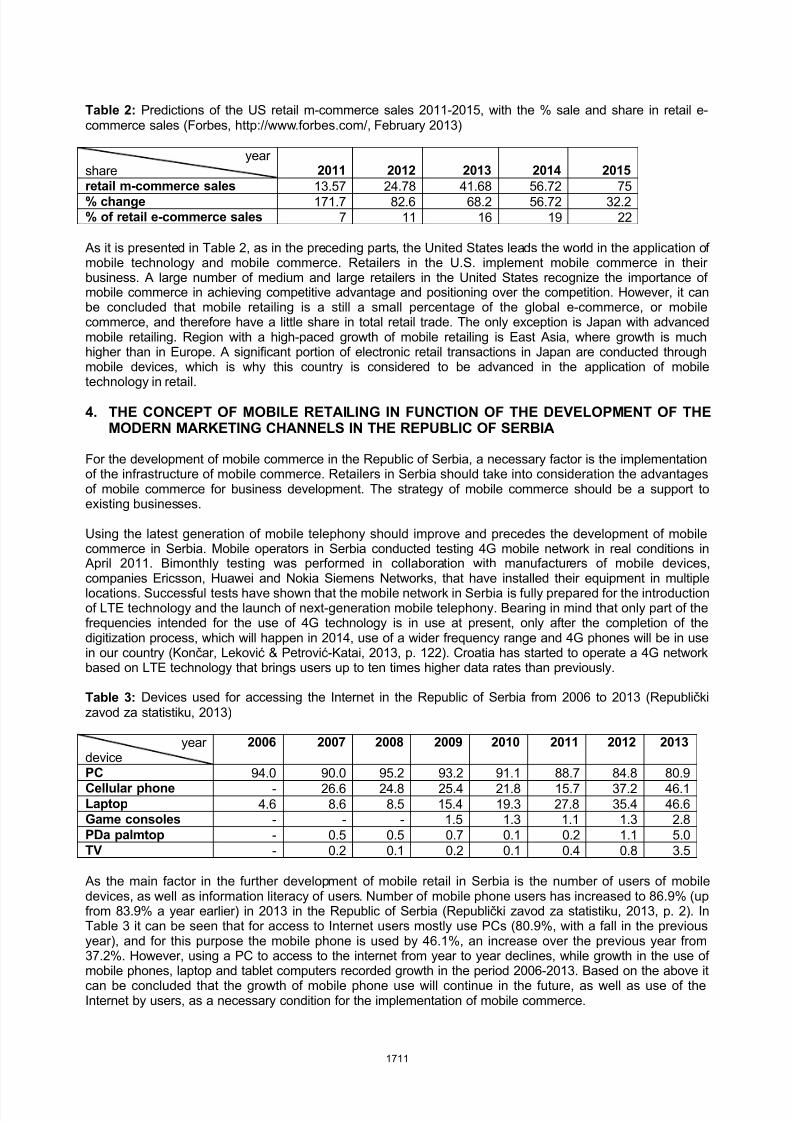
8/11/2019 25 - Technology and Innovation Management
http://slidepdf.com/reader/full/25-technology-and-innovation-management 39/55
Table 2: Predictions of the US retail m-commerce sales 2011-2015, with the % sale and share in retail e-commerce sales (Forbes, http://www.forbes.com/, February 2013)
yearshare 2011 2012 2013 2014 2015
retail m-commerce sales 13.57 24.78 41.68 56.72 75% change 171.7 82.6 68.2 56.72 32.2% of retail e-commerce sales 7 11 16 19 22
As it is presented in Table 2, as in the preceding parts, the United States leads the world in the application ofmobile technology and mobile commerce. Retailers in the U.S. implement mobile commerce in theirbusiness. A large number of medium and large retailers in the United States recognize the importance ofmobile commerce in achieving competitive advantage and positioning over the competition. However, it canbe concluded that mobile retailing is a still a small percentage of the global e-commerce, or mobilecommerce, and therefore have a little share in total retail trade. The only exception is Japan with advancedmobile retailing. Region with a high-paced growth of mobile retailing is East Asia, where growth is muchhigher than in Europe. A significant portion of electronic retail transactions in Japan are conducted throughmobile devices, which is why this country is considered to be advanced in the application of mobile
technology in retail.
4. THE CONCEPT OF MOBILE RETAILING IN FUNCTION OF THE DEVELOPMENT OF THEMODERN MARKETING CHANNELS IN THE REPUBLIC OF SERBIA
For the development of mobile commerce in the Republic of Serbia, a necessary factor is the implementationof the infrastructure of mobile commerce. Retailers in Serbia should take into consideration the advantagesof mobile commerce for business development. The strategy of mobile commerce should be a support toexisting businesses.
Using the latest generation of mobile telephony should improve and precedes the development of mobilecommerce in Serbia. Mobile operators in Serbia conducted testing 4G mobile network in real conditions in April 2011. Bimonthly testing was performed in collaboration with manufacturers of mobile devices,
companies Ericsson, Huawei and Nokia Siemens Networks, that have installed their equipment in multiplelocations. Successful tests have shown that the mobile network in Serbia is fully prepared for the introductionof LTE technology and the launch of next-generation mobile telephony. Bearing in mind that only part of thefrequencies intended for the use of 4G technology is in use at present, only after the completion of thedigitization process, which will happen in 2014, use of a wider frequency range and 4G phones will be in usein our country (Končar, Leković & Petrović-Katai, 2013, p. 122). Croatia has started to operate a 4G networkbased on LTE technology that brings users up to ten times higher data rates than previously.
Table 3: Devices used for accessing the Internet in the Republic of Serbia from 2006 to 2013 (Republičkizavod za statistiku, 2013)
yeardevice
2006 2007 2008 2009 2010 2011 2012 2013
PC 94.0 90.0 95.2 93.2 91.1 88.7 84.8 80.9Cellular phone - 26.6 24.8 25.4 21.8 15.7 37.2 46.1Laptop 4.6 8.6 8.5 15.4 19.3 27.8 35.4 46.6Game consoles - - - 1.5 1.3 1.1 1.3 2.8PDa palmtop - 0.5 0.5 0.7 0.1 0.2 1.1 5.0TV - 0.2 0.1 0.2 0.1 0.4 0.8 3.5
As the main factor in the further development of mobile retail in Serbia is the number of users of mobiledevices, as well as information literacy of users. Number of mobile phone users has increased to 86.9% (upfrom 83.9% a year earlier) in 2013 in the Republic of Serbia (Republički zavod za statistiku, 2013, p. 2). InTable 3 it can be seen that for access to Internet users mostly use PCs (80.9%, with a fall in the previousyear), and for this purpose the mobile phone is used by 46.1%, an increase over the previous year from
37.2%. However, using a PC to access to the internet from year to year declines, while growth in the use ofmobile phones, laptop and tablet computers recorded growth in the period 2006-2013. Based on the above itcan be concluded that the growth of mobile phone use will continue in the future, as well as use of theInternet by users, as a necessary condition for the implementation of mobile commerce.
1711
8/11/2019 25 - Technology and Innovation Management
http://slidepdf.com/reader/full/25-technology-and-innovation-management 40/55
Additional prerequisite for the implementation of mobile retailing is the development of mobile paymentsystems. What is recognized is that mobile payment systems are developing in recent years in Serbia. Thus,in cooperation with mobile operators and banks is developed a system for mobile payments “PlatiMo”,through mobile phones. Also, very popular in the Republic of Serbia is voucher system “Qvoucher”, whichacts as an electronic "supplement" for payment goods and services on the Internet. After only two yearssince the introduction of this system it has over 20,000 users and over 25,000 transactions per month.
Revenue from mobile retailing in Serbia is relatively small, but its aspect begins to occupy an important placein the shopping experience. Mobile retail is yet to show its full potential in generating growth across all retailchannels, along with improving the buying experience by allowing greater interaction between consumersand retailers. Exploitation of mobile technologies will enable retailers to be oriented towards the user,potential customers, develop closer relationships and increasingly meet the needs of individual consumers.
5. CONCLUSION
Continual evolution of new technologies and trends in marketing channels, under the influence of globalenvironmental factors, leading to innovation and the emergence of new mobile devices with increasingperformance. Thanks to the mobile retailing, retailers have the opportunity to develop interactive
relationships with consumers in the global market. The implementation of new mobile technologies inretailing has an impact on the achievement of competitive differentiation against competitors in marketingchannels. The implementation of new mobile technology needs to improve and develop mobile commerce inSerbia. As the main factor for this development of mobile retailing in Serbia is a growing use of the Internetby consumers.
REFERENCES
Deloitte, (2013, October). “Deloitte’s 2013 Annual Holiday Survey Naughty or nice? How will retail sales farethis holiday season?” . Deloitte Development LLC
Končar, J., (2008). Elektronska trgovina. Subotica: Ekonomski fakultet SuboticaKončar, J., Leković, S., Petrović-Katai, Z. (2013, February). “Primena koncepta mobilne trgovine u Republici
Srbiji” , Paper presented at XVII Naučno-stručni skup “IT13 - sadašnjost i budućnost”, R. Crna Gora,
Žabljak, 25.02.-01.03.2013., Univerzitet Crne GoreLovreta, S., Končar, J., Petković, G. (2013). Kanali marketinga, trgovina i ostali kanali, Beograd: CID,
Ekonoski fakultet Univerziteta u Beogradu, Subotica: Ekonomski fakultet, Univerzitet u Novom SaduRepublički zavod za statistiku, (2013, 23rd September). Upotreba informaciono-komunikacionih tehnologija u
Republici Srbiji, Beograd: Republički zavod za statistikuTurban, E., King, D., Lee, J., Liang, T.-P., Turban, D. (2010). Electronic Commerce 2008. A Managerial
Perspective. New Jersey: Prentice Hall, PearsonTurban, E., King, D., Lee, J., Liang, T.-P., Turban, D. (2012). Electronic Commerce 2012. A Managerial and
Social Network Perspective. New Jersey: Prentice Hall, PearsonForrester Research, (2013, January). “ US Mobile Retail Forecast, 2012 To 2017 ” . Retrieved from
http://blogs.forrester.com/sucharita_mulpuru/13_01_2013_us_mobile_retail_sales_to_top_12_billion _in_2013
eMarketer, (2013, April). Retrieved from https://www.emarketer.com/go/coverage/mobileMarketing.aspx
Forbes, (2013, 10th February). “Ecommerce Is Growing Nicely While M -commerce Is On A Tear” . Retrievedfrom http://www.forbes.com/sites/chuckjones/2013/10/02/ecommerce-is-growing-nicely-while-mcommerce-is-on-a-tear/
1712
8/11/2019 25 - Technology and Innovation Management
http://slidepdf.com/reader/full/25-technology-and-innovation-management 41/55
ADVANCED REAL ESTATE MANAGEMENT SYSTEM
Verka Jovanovic1, Djordje Vukelic 2 1
Faculty of Informatics and Computing, Singidunum University, Belgrade2 iPro Solutions Ltd, Valletta Waterfront, Vault 14, FRN 1914, Malta
Abstract : GIS and Internet services are one of the leading trends in the new developments of theinformation technology. Their impact could be seen in the different sectors of business and management.Very closely connected to the new paradigm of mobility, detecting the space/location is becoming one of themost important point for the different industries. Contrary to isolated use of technologies, Advance RealEstate Management System presents integration of GIS and Internet as one of new models in businessmanagement.
Keywords : GIS, Internet, Management, Real Estate, Model, Software
1. INTRODUCTION
Information technology has shifted the paradigm of the global economy. In a macroeconomic sense,information technology affects the patterns of production, investment and employment. In a microeconomicsense, information technology changes business activities (Eui-hwan, 1999). The world is changing from theindustrial age to the information age. The rise of information technology marks a more complex relationsbetween space and time. The accent must be on the approach to treat the space and time as the key,integrated entities in the "new mobility".
Where people live? What they do? Where, when and how they go? And where, when, and how they spendtheir money are now key factors in the business success. From product development to distribution,marketing and sales, GIS technologies help companies identify, understand and serve their markets far moreeffectively than ever before (Winslow, 2002).
Space, place, location plays a key role in determining the type and nature of human activity. Thespace/location determinant is correlated with consumers’ information needs, and product or service choices.Many previous papers from various fields have discussed the usage of space information in day-to-daybusiness applications (Goodell & Syverson, 2007), (King, 2009), (Svantesson, 2007), (Briney, 2013).
However, as GIS technologies progress and spread across the globe, the more questions are arising. Whatcan businesses do to stay ahead of the changes? Which technologies are the most efficient and flexible fordifferent business models? What this type of the information could tell us about business processes and howdo we use those insights to manage the same processes?
It is important to note, space/location as furthered by this renewed Internet industry has seemingly extendedthe influence of the ‘social’ as a driver of contemporary Internet innovations (Sap executive insight paper,2011). Internet and surrounding communication technologies are becoming the key drivers in the innovations
and new business models.
2. INTEGRATING GIS AND INTERNET TECHNOLOGIES FOR NEW BUSINESS MODELS
GIS’s development has been more evolutionary, than revolutionary. It responds to contemporary needs asmuch as it responds to technical breakthroughs. Planning and management have always requiredinformation as the cornerstone. Early information systems relied on physical storage of data and manualprocessing. With the advent of the computer, most of these data and procedures have been automated. As aresult, the focus of GIS has expanded from descriptive inventories to entirely new applications involvingprescriptive analysis.
In the past, analytical models have focused on management options that are technically optimal. Yet in
reality, there is another set of perspectives that must be considered, the business solution. It is this finalsieve of management alternatives that most often confounds geographic-based decisions. These are not theusual quantitative measures amenable to computer algorithms and traditional decision-making models(Berry, 2000).
1713
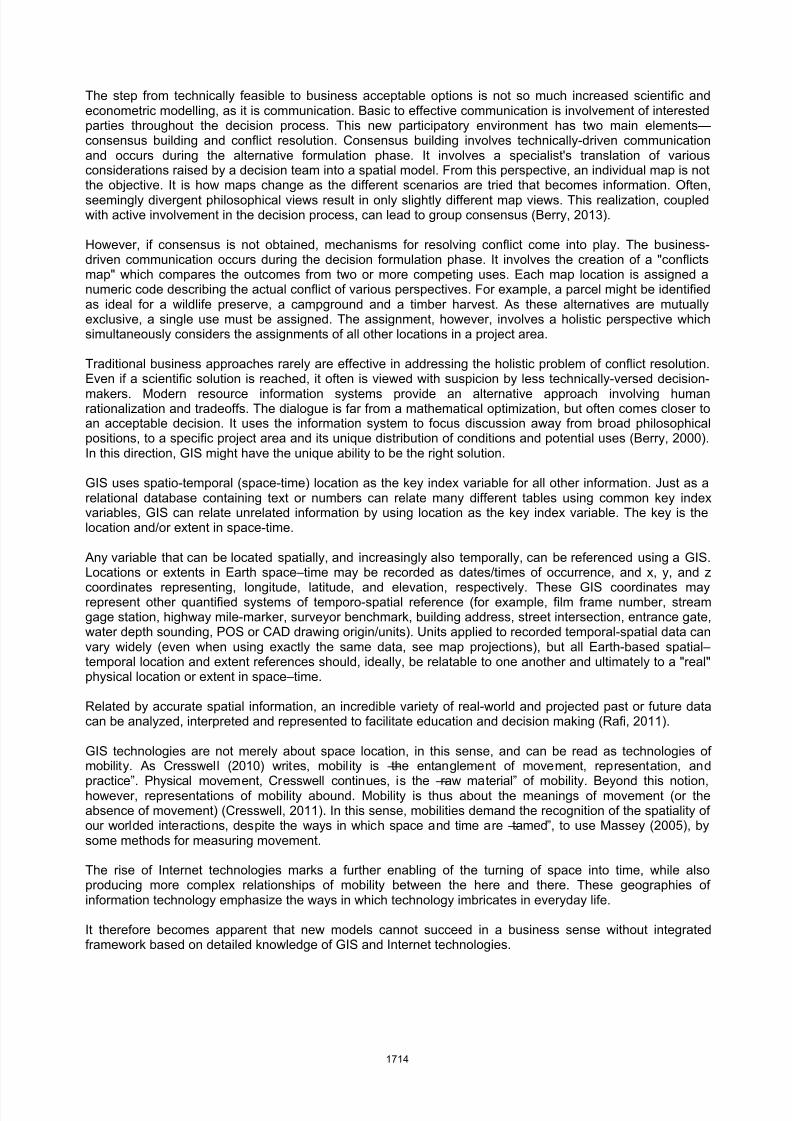
8/11/2019 25 - Technology and Innovation Management
http://slidepdf.com/reader/full/25-technology-and-innovation-management 42/55
The step from technically feasible to business acceptable options is not so much increased scientific andeconometric modelling, as it is communication. Basic to effective communication is involvement of interestedparties throughout the decision process. This new participatory environment has two main elements—consensus building and conflict resolution. Consensus building involves technically-driven communicationand occurs during the alternative formulation phase. It involves a specialist's translation of variousconsiderations raised by a decision team into a spatial model. From this perspective, an individual map is notthe objective. It is how maps change as the different scenarios are tried that becomes information. Often,seemingly divergent philosophical views result in only slightly different map views. This realization, coupledwith active involvement in the decision process, can lead to group consensus (Berry, 2013).
However, if consensus is not obtained, mechanisms for resolving conflict come into play. The business-driven communication occurs during the decision formulation phase. It involves the creation of a "conflictsmap" which compares the outcomes from two or more competing uses. Each map location is assigned anumeric code describing the actual conflict of various perspectives. For example, a parcel might be identifiedas ideal for a wildlife preserve, a campground and a timber harvest. As these alternatives are mutuallyexclusive, a single use must be assigned. The assignment, however, involves a holistic perspective whichsimultaneously considers the assignments of all other locations in a project area.
Traditional business approaches rarely are effective in addressing the holistic problem of conflict resolution.
Even if a scientific solution is reached, it often is viewed with suspicion by less technically-versed decision-makers. Modern resource information systems provide an alternative approach involving humanrationalization and tradeoffs. The dialogue is far from a mathematical optimization, but often comes closer toan acceptable decision. It uses the information system to focus discussion away from broad philosophicalpositions, to a specific project area and its unique distribution of conditions and potential uses (Berry, 2000).In this direction, GIS might have the unique ability to be the right solution.
GIS uses spatio-temporal (space-time) location as the key index variable for all other information. Just as arelational database containing text or numbers can relate many different tables using common key indexvariables, GIS can relate unrelated information by using location as the key index variable. The key is thelocation and/or extent in space-time.
Any variable that can be located spatially, and increasingly also temporally, can be referenced using a GIS.
Locations or extents in Earth space–time may be recorded as dates/times of occurrence, and x, y, and zcoordinates representing, longitude, latitude, and elevation, respectively. These GIS coordinates mayrepresent other quantified systems of temporo-spatial reference (for example, film frame number, streamgage station, highway mile-marker, surveyor benchmark, building address, street intersection, entrance gate,water depth sounding, POS or CAD drawing origin/units). Units applied to recorded temporal-spatial data canvary widely (even when using exactly the same data, see map projections), but all Earth-based spatial–temporal location and extent references should, ideally, be relatable to one another and ultimately to a "real"physical location or extent in space–time.
Related by accurate spatial information, an incredible variety of real-world and projected past or future datacan be analyzed, interpreted and represented to facilitate education and decision making (Rafi, 2011).
GIS technologies are not merely about space location, in this sense, and can be read as technologies of
mobility. As Cresswell (2010) writes, mobility is ―the entanglement of movement, representation, andpractice‖. Physical movement, Cresswell continues, is the ―raw material‖ of mobility. Beyond this notion,however, representations of mobility abound. Mobility is thus about the meanings of movement (or theabsence of movement) (Cresswell, 2011). In this sense, mobilities demand the recognition of the spatiality ofour worlded interactions, despite the ways in which space and time are ―tamed‖, to use Massey (2005), bysome methods for measuring movement.
The rise of Internet technologies marks a further enabling of the turning of space into time, while alsoproducing more complex relationships of mobility between the here and there. These geographies ofinformation technology emphasize the ways in which technology imbricates in everyday life.
It therefore becomes apparent that new models cannot succeed in a business sense without integratedframework based on detailed knowledge of GIS and Internet technologies.
1714
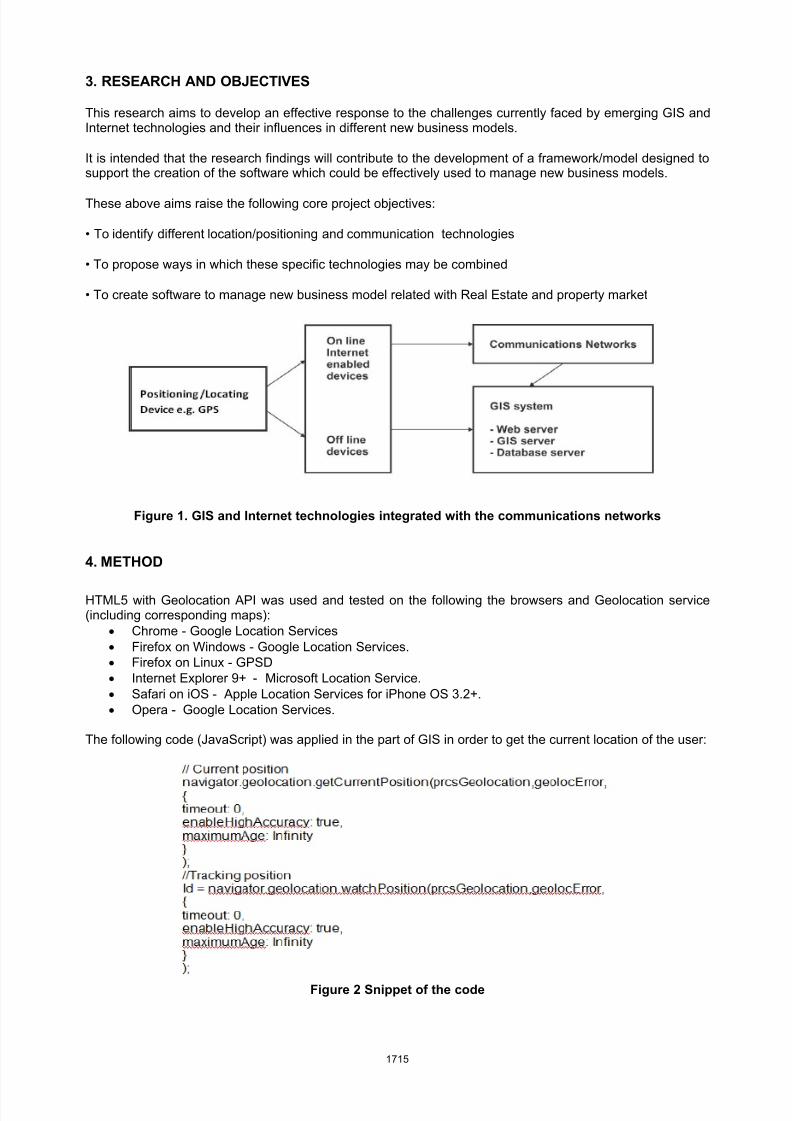
8/11/2019 25 - Technology and Innovation Management
http://slidepdf.com/reader/full/25-technology-and-innovation-management 43/55
3. RESEARCH AND OBJECTIVES
This research aims to develop an effective response to the challenges currently faced by emerging GIS andInternet technologies and their influences in different new business models.
It is intended that the research findings will contribute to the development of a framework/model designed tosupport the creation of the software which could be effectively used to manage new business models.
These above aims raise the following core project objectives:
• To identify different location/positioning and communication technologies
• To propose ways in which these specific technologies may be combined
• To create software to manage new business model related with Real Estate and property market
Figure 1. GIS and Internet technologies integrated with the communications networks
4. METHOD
HTML5 with Geolocation API was used and tested on the following the browsers and Geolocation service(including corresponding maps):
Chrome - Google Location Services Firefox on Windows - Google Location Services. Firefox on Linux - GPSD Internet Explorer 9+ - Microsoft Location Service. Safari on iOS - Apple Location Services for iPhone OS 3.2+. Opera - Google Location Services.
The following code (JavaScript) was applied in the part of GIS in order to get the current location of the user:
Figure 2 Snippet of the code
1715
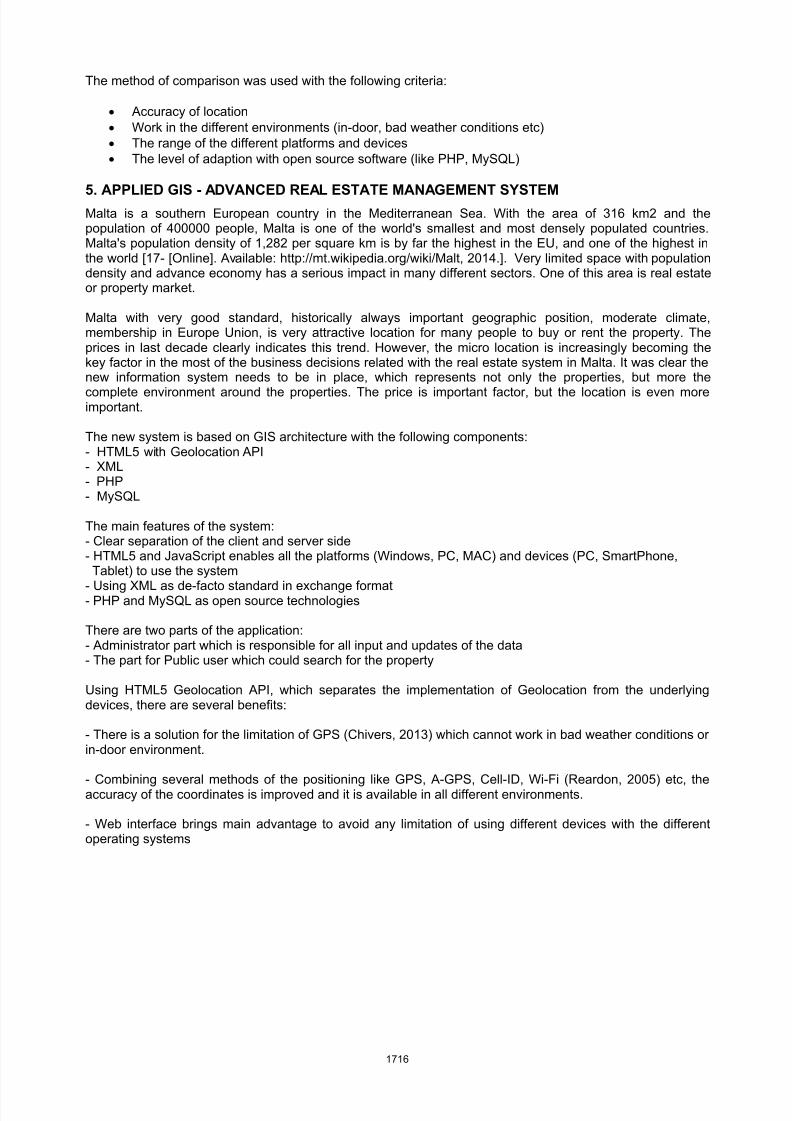
8/11/2019 25 - Technology and Innovation Management
http://slidepdf.com/reader/full/25-technology-and-innovation-management 44/55
The method of comparison was used with the following criteria:
Accuracy of location Work in the different environments (in-door, bad weather conditions etc) The range of the different platforms and devices The level of adaption with open source software (like PHP, MySQL)
5. APPLIED GIS - ADVANCED REAL ESTATE MANAGEMENT SYSTEMMalta is a southern European country in the Mediterranean Sea. With the area of 316 km2 and thepopulation of 400000 people, Malta is one of the world's smallest and most densely populated countries.Malta's population density of 1,282 per square km is by far the highest in the EU, and one of the highest inthe world [17- [Online]. Available: http://mt.wikipedia.org/wiki/Malt, 2014.]. Very limited space with populationdensity and advance economy has a serious impact in many different sectors. One of this area is real estateor property market.
Malta with very good standard, historically always important geographic position, moderate climate,membership in Europe Union, is very attractive location for many people to buy or rent the property. Theprices in last decade clearly indicates this trend. However, the micro location is increasingly becoming thekey factor in the most of the business decisions related with the real estate system in Malta. It was clear thenew information system needs to be in place, which represents not only the properties, but more thecomplete environment around the properties. The price is important factor, but the location is even moreimportant.
The new system is based on GIS architecture with the following components:- HTML5 with Geolocation API- XML- PHP- MySQL
The main features of the system:- Clear separation of the client and server side- HTML5 and JavaScript enables all the platforms (Windows, PC, MAC) and devices (PC, SmartPhone,
Tablet) to use the system- Using XML as de-facto standard in exchange format- PHP and MySQL as open source technologies
There are two parts of the application:- Administrator part which is responsible for all input and updates of the data- The part for Public user which could search for the property
Using HTML5 Geolocation API, which separates the implementation of Geolocation from the underlyingdevices, there are several benefits:
- There is a solution for the limitation of GPS (Chivers, 2013) which cannot work in bad weather conditions orin-door environment.
- Combining several methods of the positioning like GPS, A-GPS, Cell-ID, Wi-Fi (Reardon, 2005) etc, theaccuracy of the coordinates is improved and it is available in all different environments.
- Web interface brings main advantage to avoid any limitation of using different devices with the differentoperating systems
1716

8/11/2019 25 - Technology and Innovation Management
http://slidepdf.com/reader/full/25-technology-and-innovation-management 45/55
Figure 3. Add Property
Very important feature of the new system is the ability to add the objects which are located near the property. As it was mentioned, micro-location is becoming very important factor in any business decisions related withproperty.
How far is the post office? How far is the bank? But even more important the information about some small
objects which usually is not available, like small supermarkets, green grocery shops, pharmacy etc.
Similar to the previous screen, adding the object located near the property is very simple process, getting thecoordinates of the object, inputting the details of the object and send data to server.
1717
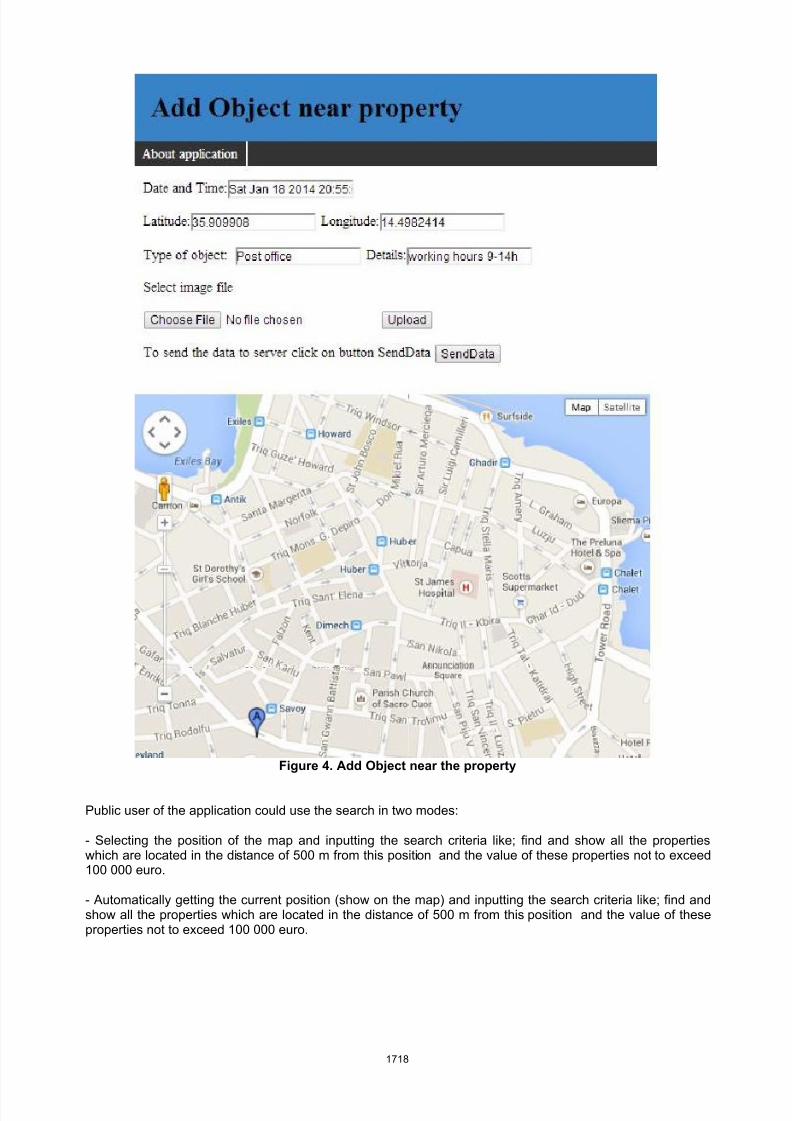
8/11/2019 25 - Technology and Innovation Management
http://slidepdf.com/reader/full/25-technology-and-innovation-management 46/55
Figure 4. Add Object near the property
Public user of the application could use the search in two modes:
- Selecting the position of the map and inputting the search criteria like; find and show all the propertieswhich are located in the distance of 500 m from this position and the value of these properties not to exceed100 000 euro.
- Automatically getting the current position (show on the map) and inputting the search criteria like; find andshow all the properties which are located in the distance of 500 m from this position and the value of theseproperties not to exceed 100 000 euro.
1718
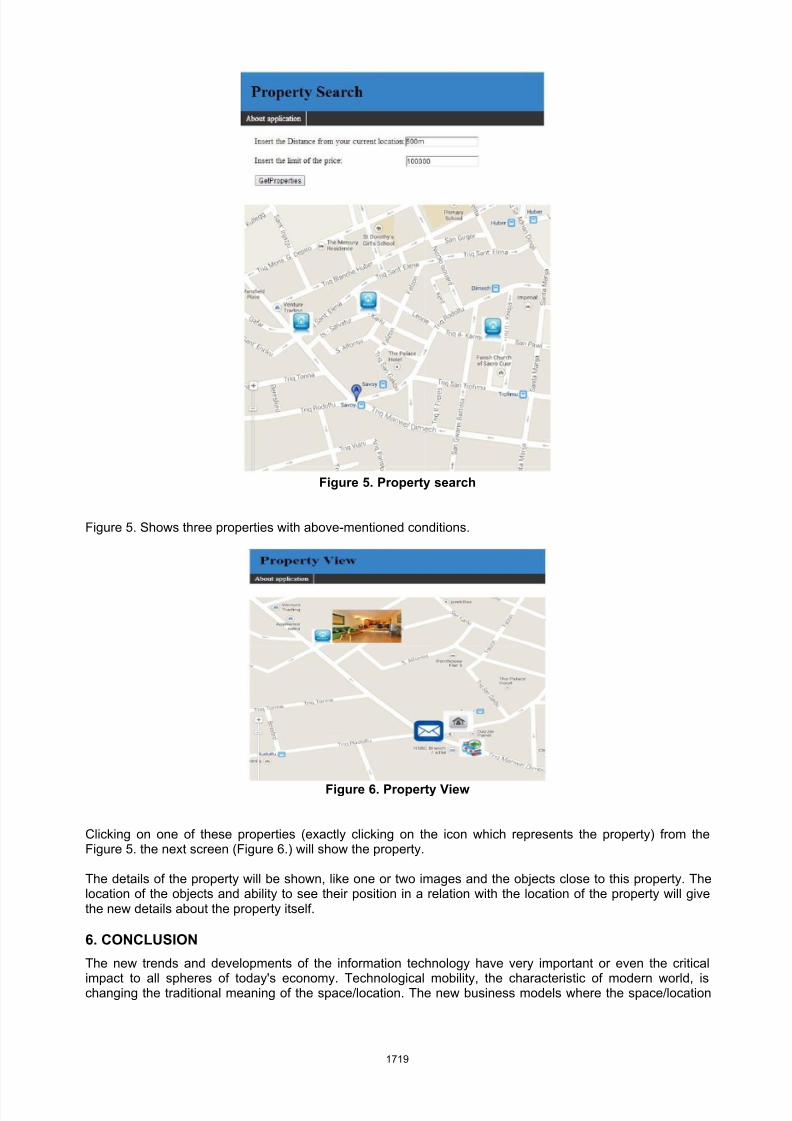
8/11/2019 25 - Technology and Innovation Management
http://slidepdf.com/reader/full/25-technology-and-innovation-management 47/55
Figure 5. Property search
Figure 5. Shows three properties with above-mentioned conditions.
Figure 6. Property View
Clicking on one of these properties (exactly clicking on the icon which represents the property) from theFigure 5. the next screen (Figure 6.) will show the property.
The details of the property will be shown, like one or two images and the objects close to this property. Thelocation of the objects and ability to see their position in a relation with the location of the property will givethe new details about the property itself.
6. CONCLUSION
The new trends and developments of the information technology have very important or even the criticalimpact to all spheres of today's economy. Technological mobility, the characteristic of modern world, ischanging the traditional meaning of the space/location. The new business models where the space/location
1719
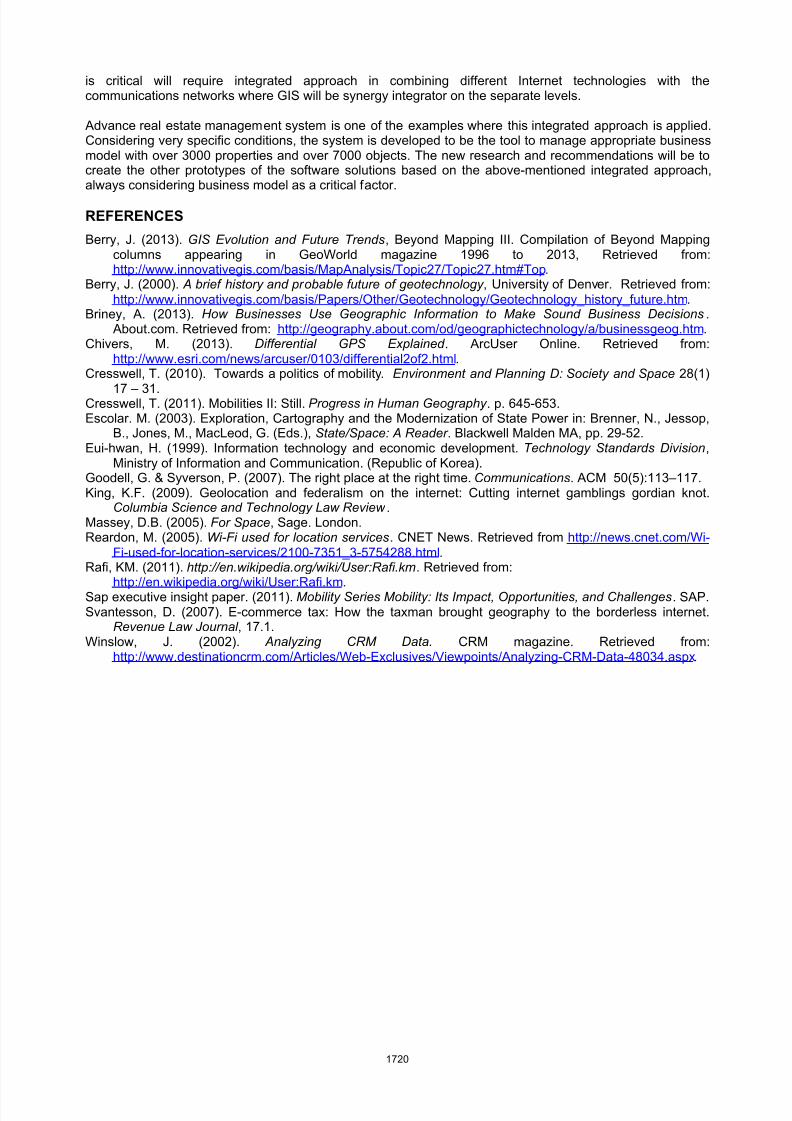
8/11/2019 25 - Technology and Innovation Management
http://slidepdf.com/reader/full/25-technology-and-innovation-management 48/55
is critical will require integrated approach in combining different Internet technologies with thecommunications networks where GIS will be synergy integrator on the separate levels.
Advance real estate management system is one of the examples where this integrated approach is applied.Considering very specific conditions, the system is developed to be the tool to manage appropriate businessmodel with over 3000 properties and over 7000 objects. The new research and recommendations will be tocreate the other prototypes of the software solutions based on the above-mentioned integrated approach,always considering business model as a critical factor.
REFERENCES
Berry, J. (2013). GIS Evolution and Future Trends, Beyond Mapping III. Compilation of Beyond Mappingcolumns appearing in GeoWorld magazine 1996 to 2013, Retrieved from:http://www.innovativegis.com/basis/MapAnalysis/Topic27/Topic27.htm#Top.
Berry, J. (2000). A brief history and probable future of geotechnology , University of Denver. Retrieved from:http://www.innovativegis.com/basis/Papers/Other/Geotechnology/Geotechnology_history_future.htm.
Briney, A. (2013). How Businesses Use Geographic Information to Make Sound Business Decisions . About.com. Retrieved from: http://geography.about.com/od/geographictechnology/a/businessgeog.htm.
Chivers, M. (2013). Differential GPS Explained . ArcUser Online. Retrieved from:http://www.esri.com/news/arcuser/0103/differential2of2.html.
Cresswell, T. (2010). Towards a politics of mobility. Environment and Planning D: Society and Space 28(1)
17 – 31.Cresswell, T. (2011). Mobilities II: Still. Progress in Human Geography . p. 645-653.Escolar. M. (2003). Exploration, Cartography and the Modernization of State Power in: Brenner, N., Jessop,
B., Jones, M., MacLeod, G. (Eds.), State/Space: A Reader . Blackwell Malden MA, pp. 29-52.Eui-hwan, H. (1999). Information technology and economic development. Technology Standards Division,
Ministry of Information and Communication. (Republic of Korea).Goodell, G. & Syverson, P. (2007). The right place at the right time. Communications. ACM 50(5):113–117.King, K.F. (2009). Geolocation and federalism on the internet: Cutting internet gamblings gordian knot.
Columbia Science and Technology Law Review .Massey, D.B. (2005). For Space, Sage. London.Reardon, M. (2005). Wi-Fi used for location services. CNET News. Retrieved from http://news.cnet.com/Wi-
Fi-used-for-location-services/2100-7351_3-5754288.html. Rafi, KM. (2011). http://en.wikipedia.org/wiki/User:Rafi.km. Retrieved from:
http://en.wikipedia.org/wiki/User:Rafi.km. Sap executive insight paper. (2011). Mobility Series Mobility: Its Impact, Opportunities, and Challenges. SAP.Svantesson, D. (2007). E-commerce tax: How the taxman brought geography to the borderless internet.
Revenue Law Journal , 17.1.Winslow, J. (2002). Analyzing CRM Data. CRM magazine. Retrieved from:
http://www.destinationcrm.com/Articles/Web-Exclusives/Viewpoints/Analyzing-CRM-Data-48034.aspx.
1720
8/11/2019 25 - Technology and Innovation Management
http://slidepdf.com/reader/full/25-technology-and-innovation-management 49/55
CLOUD COMPUTING INFRASTRUCTURE APPLICATIONS IN COMPUTERSIMULATION
Mihailo Marinković1, Sava Čavoški2, Aleksandar Marković3
1
Telenor Serbia, [email protected] Information Engineering, [email protected]
3University of Belgrade, Faculty of Organizational Sciences, [email protected]
Abstract : This paper presents possibilities for improving computer simulations using cloud computinginfrastructure. Authors examine the types and good examples of cloud-based computer simulations, offeringsuggestions for the architecture, frameworks and runtime infrastructures which support running simulationsin cloud environment. There are cases when Monte Carlo simulation can have more accurate outputs thananalytical methods. In order to reach such accuracy and results precision, Monte Carlo simulation sometimesrequires orders of magnitude more computing time. Such computationally intensive scientific problems canbe solved by using the possibilities offered by cloud computing platforms as cloud computing has becomethe standard for providing hardware and software infrastructure. Authors present results of solution that uses
public cloud infrastructure for executing simulation experiments and increased efficiency of simulationexecution more than 300 times and still keeping costs at acceptable level.
Keywords : cloud computing, infrastructure, computer simulation, Monte Carlo simulation
1. INTRODUCTION
In last couple of years, Cloud Computing has become a standard for delivering hardware and softwareinfrastructure. It is based on a pay-per-use business model where resources are acquired only when reallyneeded and customer pays only for resources actually used. Cloud computing represents the mechanism fordealing with the use of external services as part of the computational foundation (Tor-Morten, 2012). Itprovides scalable, distributed computer services as needed. The aim of cloud computing is to present aservice layer for its users where all detailed logic is made transparent and drawn upon as needed. Ingeneral, cloud computing is recognized as an infrastructure where all underlying resources (storage, RAM,processors, load balancers etc.) are completely abstracted from the end user. This leads to the cloudprovider/vendor to be in charge of performance, reliability and scalability. Gartner (2013) defines cloudcomputing as a style of computing in which scalable and elastic IT-enabled capabilities are delivered as aservice using Internet technologies. The National Institute of Standards and Technology (NIST) defines cloudcomputing as “a model for enabling ubiquitous, convenient, on-demand network access to a shared pool ofconfigurable computing resources (e.g., networks, servers, storage, applications, and services) that can berapidly provisioned and released with minimal management effort or service provider interaction” (Peter, M.,& Grance, T, 2011). The same authors list three service models: Infrastructure as a Service (IaaS), Platformas a Service (PaaS) and Software as a Service (SaaS). Some authors extend this list with additional servicemodels: Communication as a Service (CaaS), Database as a Service (DBaaS), Security as a service(SECaaS), Identity Management as a Service (IMaaS), Desktop as a Service (DaaS) (Schaffer, 2009) andCarroll et al. (2011) extend it further with: Monitoring as a Service (MaaS), Storage as a Service (STaaS),Compute Capacity as a Service (CCaaS), Hardware as a Service (HaaS), IT as a Service (ITaaS), BusinessProcess as a Service (BPaaS).
Infrastructure as a Service (IaaS) service model brings possibility for outsourcing common elements ofinfrastructure like virtualization, storage, networking, load balancers etc. to a vendor of choice. TheIaaS provider bills for the infrastructure services usage as per its service level agreement (SLA). One of thebiggest benefits of IaaS is that it provides granular control, in which you can choose the core components foryour infrastructure.
The starting hypothesis of this paper is that by using cloud computing technologies, researchers canincrease efficiency of simulation experiment execution, decrease costs and improve computer simulationprocess in general. As in traditional computing environment, it is possible to execute all kinds of simulationexperiments using cloud computing environment. This approach can make models accessible to a widerrange of researchers, and data analysis of simulation experiments outputs can be performed in moreimproved ways.
1721
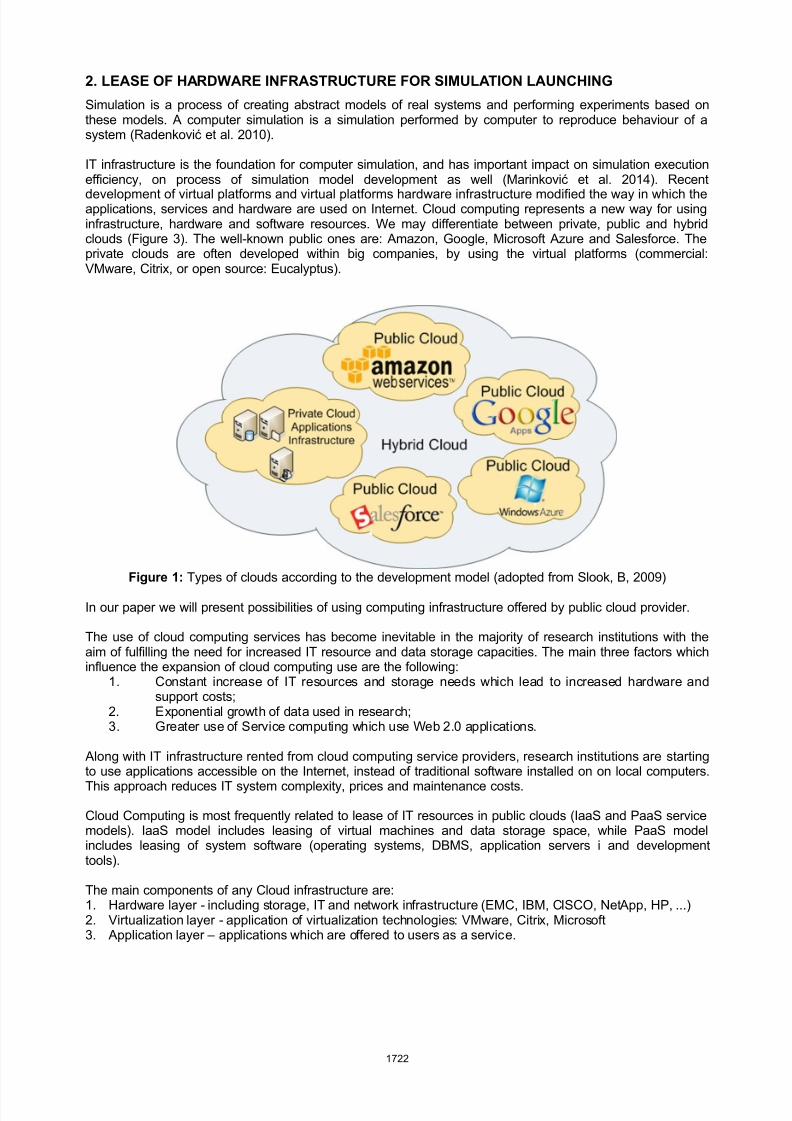
8/11/2019 25 - Technology and Innovation Management
http://slidepdf.com/reader/full/25-technology-and-innovation-management 50/55
2. LEASE OF HARDWARE INFRASTRUCTURE FOR SIMULATION LAUNCHING
Simulation is a process of creating abstract models of real systems and performing experiments based onthese models. A computer simulation is a simulation performed by computer to reproduce behaviour of asystem (Radenković et al. 2010).
IT infrastructure is the foundation for computer simulation, and has important impact on simulation executionefficiency, on process of simulation model development as well (Marinković et al. 2014). Recent
development of virtual platforms and virtual platforms hardware infrastructure modified the way in which theapplications, services and hardware are used on Internet. Cloud computing represents a new way for usinginfrastructure, hardware and software resources. We may differentiate between private, public and hybridclouds (Figure 3). The well-known public ones are: Amazon, Google, Microsoft Azure and Salesforce. Theprivate clouds are often developed within big companies, by using the virtual platforms (commercial:VMware, Citrix, or open source: Eucalyptus).
Figure 1: Types of clouds according to the development model (adopted from Slook, B, 2009)
In our paper we will present possibilities of using computing infrastructure offered by public cloud provider.
The use of cloud computing services has become inevitable in the majority of research institutions with theaim of fulfilling the need for increased IT resource and data storage capacities. The main three factors whichinfluence the expansion of cloud computing use are the following:
1. Constant increase of IT resources and storage needs which lead to increased hardware andsupport costs;
2. Exponential growth of data used in research;3. Greater use of Service computing which use Web 2.0 applications.
Along with IT infrastructure rented from cloud computing service providers, research institutions are starting
to use applications accessible on the Internet, instead of traditional software installed on on local computers.This approach reduces IT system complexity, prices and maintenance costs.
Cloud Computing is most frequently related to lease of IT resources in public clouds (IaaS and PaaS servicemodels). IaaS model includes leasing of virtual machines and data storage space, while PaaS modelincludes leasing of system software (operating systems, DBMS, application servers i and developmenttools).
The main components of any Cloud infrastructure are:1. Hardware layer - including storage, IT and network infrastructure (EMC, IBM, CISCO, NetApp, HP, ...)2. Virtualization layer - application of virtualization technologies: VMware, Citrix, Microsoft3. Application layer – applications which are offered to users as a service.
1722
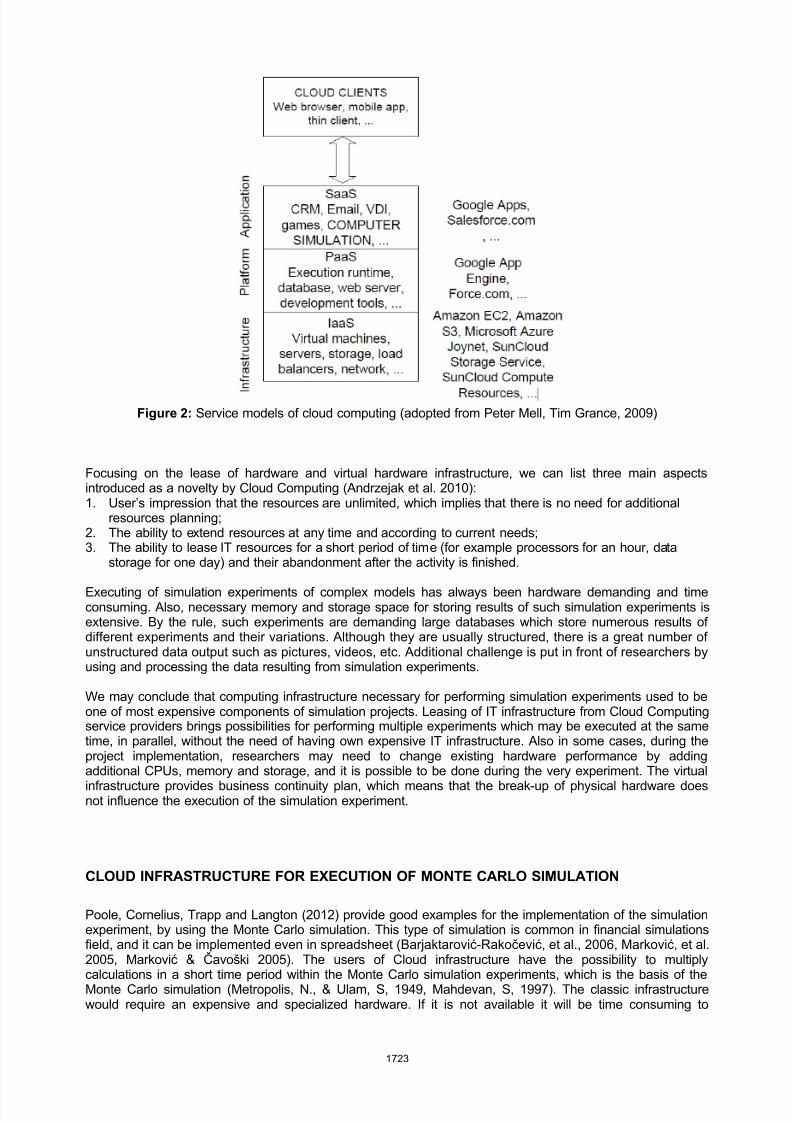
8/11/2019 25 - Technology and Innovation Management
http://slidepdf.com/reader/full/25-technology-and-innovation-management 51/55
Figure 2: Service models of cloud computing (adopted from Peter Mell, Tim Grance, 2009)
Focusing on the lease of hardware and virtual hardware infrastructure, we can list three main aspectsintroduced as a novelty by Cloud Computing (Andrzejak et al. 2010):1. User’s impression that the resources are unlimited, which implies that there is no need for additional
resources planning;2. The ability to extend resources at any time and according to current needs;3. The ability to lease IT resources for a short period of time (for example processors for an hour, data
storage for one day) and their abandonment after the activity is finished.
Executing of simulation experiments of complex models has always been hardware demanding and timeconsuming. Also, necessary memory and storage space for storing results of such simulation experiments isextensive. By the rule, such experiments are demanding large databases which store numerous results ofdifferent experiments and their variations. Although they are usually structured, there is a great number ofunstructured data output such as pictures, videos, etc. Additional challenge is put in front of researchers byusing and processing the data resulting from simulation experiments.
We may conclude that computing infrastructure necessary for performing simulation experiments used to beone of most expensive components of simulation projects. Leasing of IT infrastructure from Cloud Computingservice providers brings possibilities for performing multiple experiments which may be executed at the sametime, in parallel, without the need of having own expensive IT infrastructure. Also in some cases, during theproject implementation, researchers may need to change existing hardware performance by adding
additional CPUs, memory and storage, and it is possible to be done during the very experiment. The virtualinfrastructure provides business continuity plan, which means that the break-up of physical hardware doesnot influence the execution of the simulation experiment.
CLOUD INFRASTRUCTURE FOR EXECUTION OF MONTE CARLO SIMULATION
Poole, Cornelius, Trapp and Langton (2012) provide good examples for the implementation of the simulationexperiment, by using the Monte Carlo simulation. This type of simulation is common in financial simulationsfield, and it can be implemented even in spreadsheet (Barjaktarović-Rakočević, et al., 2006, Marković, et al.
2005, Marković & Čavoški 2005). The users of Cloud infrastructure have the possibility to multiplycalculations in a short time period within the Monte Carlo simulation experiments, which is the basis of theMonte Carlo simulation (Metropolis, N., & Ulam, S, 1949, Mahdevan, S, 1997). The classic infrastructurewould require an expensive and specialized hardware. If it is not available it will be time consuming to
1723
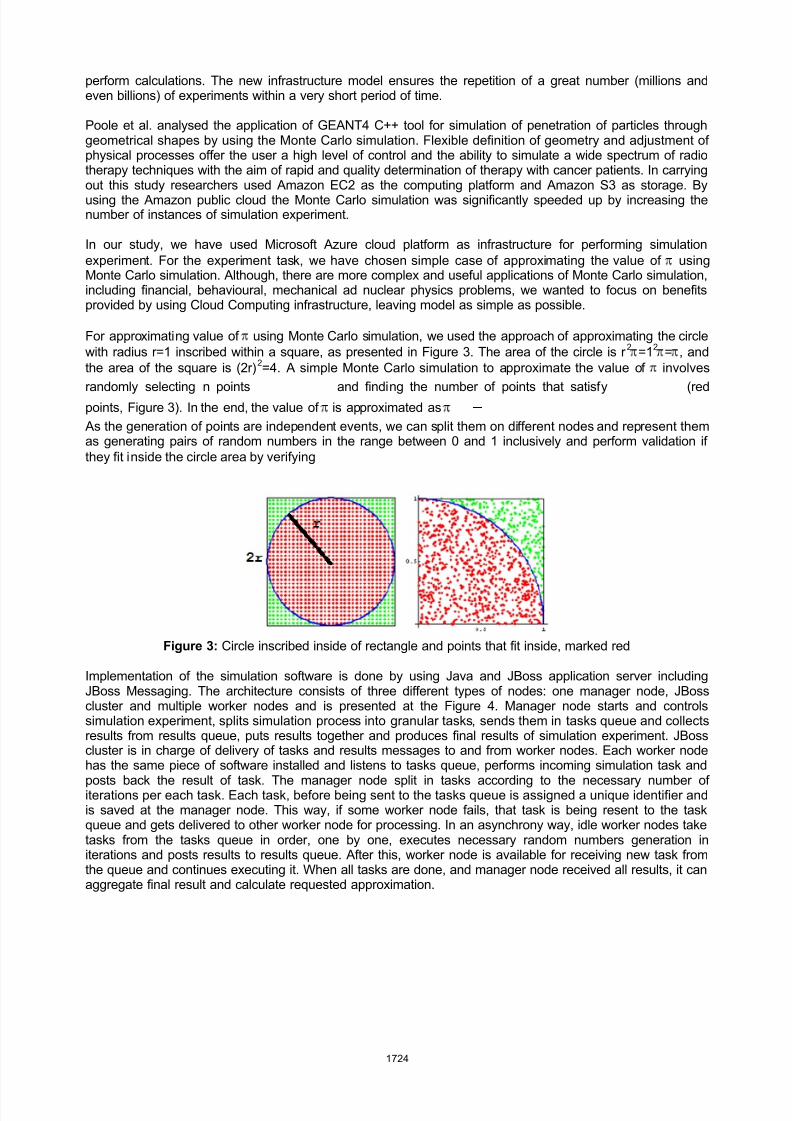
8/11/2019 25 - Technology and Innovation Management
http://slidepdf.com/reader/full/25-technology-and-innovation-management 52/55
perform calculations. The new infrastructure model ensures the repetition of a great number (millions andeven billions) of experiments within a very short period of time.
Poole et al. analysed the application of GEANT4 C++ tool for simulation of penetration of particles throughgeometrical shapes by using the Monte Carlo simulation. Flexible definition of geometry and adjustment ofphysical processes offer the user a high level of control and the ability to simulate a wide spectrum of radiotherapy techniques with the aim of rapid and quality determination of therapy with cancer patients. In carryingout this study researchers used Amazon EC2 as the computing platform and Amazon S3 as storage. Byusing the Amazon public cloud the Monte Carlo simulation was significantly speeded up by increasing thenumber of instances of simulation experiment.
In our study, we have used Microsoft Azure cloud platform as infrastructure for performing simulationexperiment. For the experiment task, we have chosen simple case of approximating the value of usingMonte Carlo simulation. Although, there are more complex and useful applications of Monte Carlo simulation,including financial, behavioural, mechanical ad nuclear physics problems, we wanted to focus on benefitsprovided by using Cloud Computing infrastructure, leaving model as simple as possible.
For approximating value of using Monte Carlo simulation, we used the approach of approximating the circlewith radius r=1 inscribed within a square, as presented in Figure 3. The area of the circle is r 2 =12 = , andthe area of the square is (2r)2=4. A simple Monte Carlo simulation to approximate the value of involves
randomly selecting n points and finding the number of points that satisfy (redpoints, Figure 3). In the end, the value of is approximated as
As the generation of points are independent events, we can split them on different nodes and represent themas generating pairs of random numbers in the range between 0 and 1 inclusively and perform validation ifthey fit inside the circle area by verifying
Figure 3: Circle inscribed inside of rectangle and points that fit inside, marked red
Implementation of the simulation software is done by using Java and JBoss application server includingJBoss Messaging. The architecture consists of three different types of nodes: one manager node, JBosscluster and multiple worker nodes and is presented at the Figure 4. Manager node starts and controlssimulation experiment, splits simulation process into granular tasks, sends them in tasks queue and collectsresults from results queue, puts results together and produces final results of simulation experiment. JBosscluster is in charge of delivery of tasks and results messages to and from worker nodes. Each worker node
has the same piece of software installed and listens to tasks queue, performs incoming simulation task andposts back the result of task. The manager node split in tasks according to the necessary number ofiterations per each task. Each task, before being sent to the tasks queue is assigned a unique identifier andis saved at the manager node. This way, if some worker node fails, that task is being resent to the taskqueue and gets delivered to other worker node for processing. In an asynchrony way, idle worker nodes taketasks from the tasks queue in order, one by one, executes necessary random numbers generation initerations and posts results to results queue. After this, worker node is available for receiving new task fromthe queue and continues executing it. When all tasks are done, and manager node received all results, it canaggregate final result and calculate requested approximation.
1724
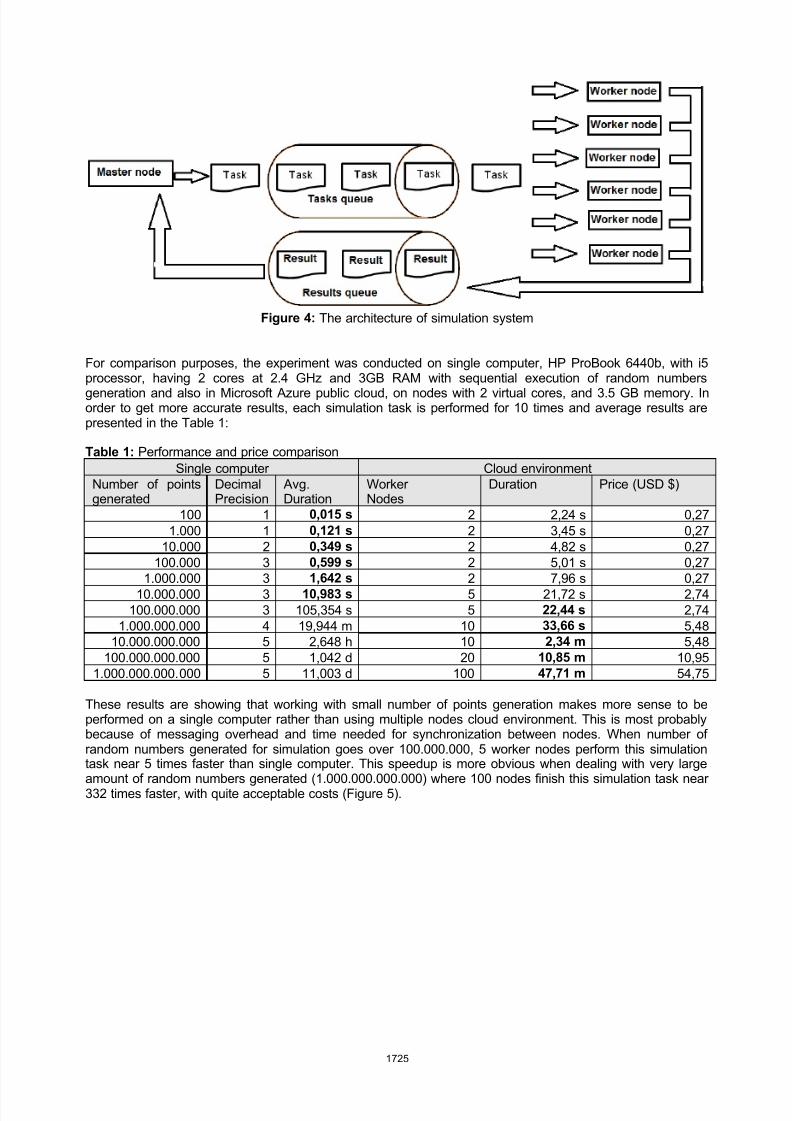
8/11/2019 25 - Technology and Innovation Management
http://slidepdf.com/reader/full/25-technology-and-innovation-management 53/55
Figure 4: The architecture of simulation system
For comparison purposes, the experiment was conducted on single computer, HP ProBook 6440b, with i5
processor, having 2 cores at 2.4 GHz and 3GB RAM with sequential execution of random numbersgeneration and also in Microsoft Azure public cloud, on nodes with 2 virtual cores, and 3.5 GB memory. Inorder to get more accurate results, each simulation task is performed for 10 times and average results arepresented in the Table 1:
Table 1: Performance and price comparisonSingle computer Cloud environment
Number of pointsgenerated
DecimalPrecision
Avg.Duration
WorkerNodes
Duration Price (USD $)
100 1 0,015 s 2 2,24 s 0,271.000 1 0,121 s 2 3,45 s 0,27
10.000 2 0,349 s 2 4,82 s 0,27100.000 3 0,599 s 2 5,01 s 0,27
1.000.000 3 1,642 s 2 7,96 s 0,2710.000.000 3 10,983 s 5 21,72 s 2,74
100.000.000 3 105,354 s 5 22,44 s 2,741.000.000.000 4 19,944 m 10 33,66 s 5,48
10.000.000.000 5 2,648 h 10 2,34 m 5,48100.000.000.000 5 1,042 d 20 10,85 m 10,95
1.000.000.000.000 5 11,003 d 100 47,71 m 54,75
These results are showing that working with small number of points generation makes more sense to beperformed on a single computer rather than using multiple nodes cloud environment. This is most probablybecause of messaging overhead and time needed for synchronization between nodes. When number ofrandom numbers generated for simulation goes over 100.000.000, 5 worker nodes perform this simulation
task near 5 times faster than single computer. This speedup is more obvious when dealing with very largeamount of random numbers generated (1.000.000.000.000) where 100 nodes finish this simulation task near332 times faster, with quite acceptable costs (Figure 5).
1725
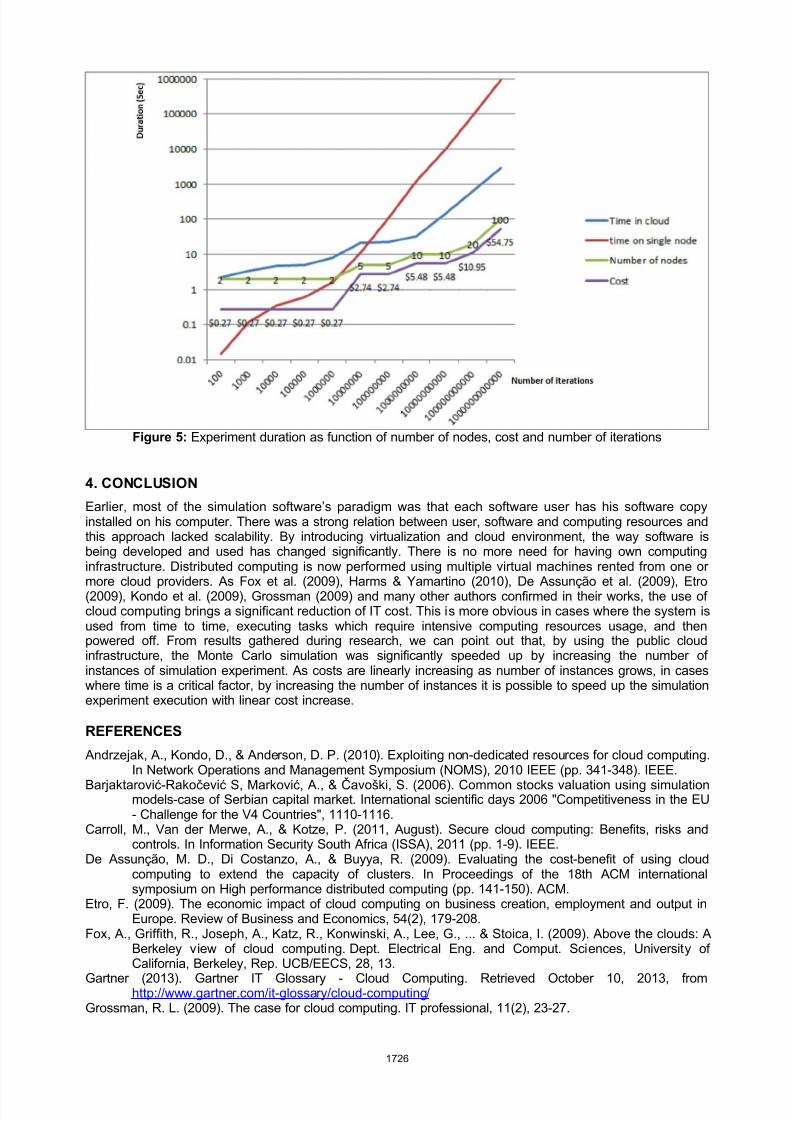
8/11/2019 25 - Technology and Innovation Management
http://slidepdf.com/reader/full/25-technology-and-innovation-management 54/55
Figure 5: Experiment duration as function of number of nodes, cost and number of iterations
4. CONCLUSION
Earlier, most of the simulation software’s paradigm was that each software user has his software copyinstalled on his computer. There was a strong relation between user, software and computing resources andthis approach lacked scalability. By introducing virtualization and cloud environment, the way software isbeing developed and used has changed significantly. There is no more need for having own computinginfrastructure. Distributed computing is now performed using multiple virtual machines rented from one ormore cloud providers. As Fox et al. (2009), Harms & Yamartino (2010), De Assunção et al. (2009), Etro(2009), Kondo et al. (2009), Grossman (2009) and many other authors confirmed in their works, the use ofcloud computing brings a significant reduction of IT cost. This is more obvious in cases where the system isused from time to time, executing tasks which require intensive computing resources usage, and thenpowered off. From results gathered during research, we can point out that, by using the public cloudinfrastructure, the Monte Carlo simulation was significantly speeded up by increasing the number ofinstances of simulation experiment. As costs are linearly increasing as number of instances grows, in caseswhere time is a critical factor, by increasing the number of instances it is possible to speed up the simulationexperiment execution with linear cost increase.
REFERENCES
Andrzejak, A., Kondo, D., & Anderson, D. P. (2010). Exploiting non-dedicated resources for cloud computing.
In Network Operations and Management Symposium (NOMS), 2010 IEEE (pp. 341-348). IEEE.Barjaktarović-Rakočević S, Marković, A., & Čavoški, S. (2006). Common stocks valuation using simulation
models-case of Serbian capital market. International scientific days 2006 "Competitiveness in the EU- Challenge for the V4 Countries", 1110-1116.
Carroll, M., Van der Merwe, A., & Kotze, P. (2011, August). Secure cloud computing: Benefits, risks andcontrols. In Information Security South Africa (ISSA), 2011 (pp. 1-9). IEEE.
De Assunção, M. D., Di Costanzo, A., & Buyya, R. (2009). Evaluating the cost-benefit of using cloudcomputing to extend the capacity of clusters. In Proceedings of the 18th ACM internationalsymposium on High performance distributed computing (pp. 141-150). ACM.
Etro, F. (2009). The economic impact of cloud computing on business creation, employment and output inEurope. Review of Business and Economics, 54(2), 179-208.
Fox, A., Griffith, R., Joseph, A., Katz, R., Konwinski, A., Lee, G., ... & Stoica, I. (2009). Above the clouds: ABerkeley view of cloud computing. Dept. Electrical Eng. and Comput. Sciences, University of
California, Berkeley, Rep. UCB/EECS, 28, 13.Gartner (2013). Gartner IT Glossary - Cloud Computing. Retrieved October 10, 2013, from
http://www.gartner.com/it-glossary/cloud-computing/ Grossman, R. L. (2009). The case for cloud computing. IT professional, 11(2), 23-27.
1726
8/11/2019 25 - Technology and Innovation Management
http://slidepdf.com/reader/full/25-technology-and-innovation-management 55/55
Harms, R., & Yamartino, M. (2010). The economics of the cloud. Microsoft whitepaper, MicrosoftCorporation.
Kondo, D., Javadi, B., Malecot, P., Cappello, F., & Anderson, D. P. (2009, May). Cost-benefit analysis ofcloud computing versus desktop grids. In Parallel & Distributed Processing, 2009. IPDPS 2009.IEEE International Symposium on (pp. 1-12). IEEE.
Mahdevan, S. (1997). Monte Carlo Simulation. Reliability-Based Mechanical Design (pp. 123-146). NewYork: Marcel Dekker, inc.
Marinković, M., Čavoški, S., & Marković, A. (2014). Application of Cloud-Based Simulation in ScientificResearch. Handbook of Research on High Performance and Cloud Computing in ScientificResearch and Education, 281.
Marković A, Barjaktarović-Rakočević, S. & Čavoški, S (2005). Spreadsheet models in stock valuation.Management – časopis za teoriju i praksu menadžmenta. 10(38), 26-33.
Marković, A., & Čavoški, S. (2005). Primena ADD-in programa u finansijskoj spreadsheet simulaciji. Info M,4(13), 32-37.
Metropolis, N., & Ulam, S. (1949). The Monte Carlo method. Journal of the American statistical association,44(247), 335-341.
Radenković, B., Stanojević, M., & Marković, A. (Eds.). (2010). Računarska simulacija. Faculty ofOrganizational Sciences and Faculty of Transport and Traffic Engineering.
Mell, P., & Grance, T. (2009). Effectively and securely using the cloud computing paradigm. NIST,Information Technology Lab. Retrieved from http://gat1.isoc.org.il/conf2010/handouts/
Yesha_Sivan.pdf Poole, C. M., Cornelius, I., Trapp, J. V., & Langton, C. M. (2012). Radiotherapy Monte Carlo simulation usingcloud computing technology. Australasian Physical & Engineering Sciences in Medicine, 35(4), 497-502.
Schaffer, H. E. (2009). X as a service, cloud computing, and the need for good judgment. IT professional,11(5), 4-5.
Slook, B. (2009). Cloud Architecture and the Need for an Architectural Perspective Bobs Technology Briefs.Retrieved October 10, 2013, from http://bslook.wordpress.com/2009/04/27/cloud-architecture-and-the-need-for-an-architecture-perspective/
Tor-Morten, G. (2012). Cloud computing and context-awareness: A study of the adapted user experience.Lecture Notes in Computer Science, 6762, 427-435.