Embed Size (px)
Citation preview
Thoresen Thai Agencies Plc.1Q FY 2011 Analyst Presentationy25 February 2011
AgendaAge a
I 1Q FY 2011 Financial HighlightsI. 1Q FY 2011 Financial Highlights
II. Transport Group• Key Drivers• Key Drivers
• Business Outlook & Strategies
III. Energy Group• Key Drivers
• Business Outlook & Strategies
IV Infrastructure GroupIV. Infrastructure Group• Key Drivers
• Business Outlook & Strategies
V. Capital Structure & Investments
VI. Q & A
2 ‐ TTA 1Q FY2011 Earnings Results
1Q FY 2011 Financial HighlightsQ Y 0 i a cia ig ig ts
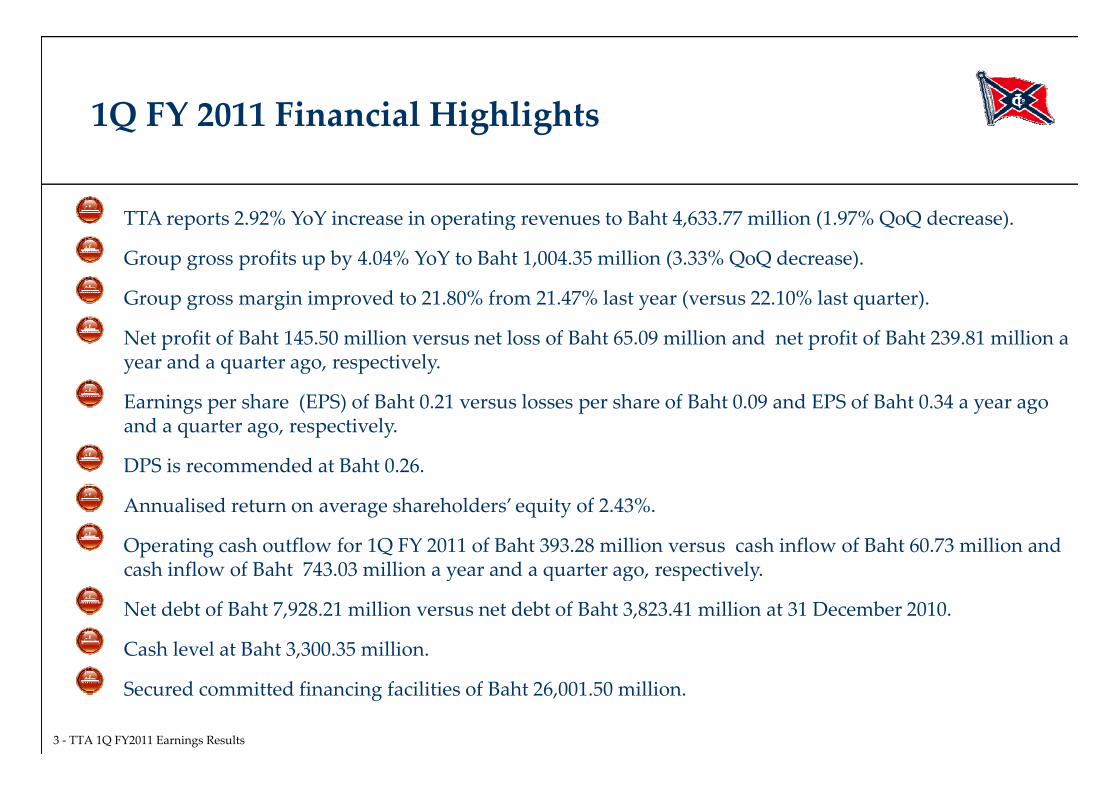
TTA reports 2 92% YoY increase in operating revenues to Baht 4 633 77 million (1 97% QoQ decrease)TTA reports 2.92% YoY increase in operating revenues to Baht 4,633.77 million (1.97% QoQ decrease).
Group gross profits up by 4.04% YoY to Baht 1,004.35 million (3.33% QoQ decrease).
Group gross margin improved to 21.80% from 21.47% last year (versus 22.10% last quarter).p g g p y ( q )
Net profit of Baht 145.50 million versus net loss of Baht 65.09 million and net profit of Baht 239.81 million a year and a quarter ago, respectively.
E i h (EPS) f B h 0 21 l h f B h 0 09 d EPS f B h 0 34Earnings per share (EPS) of Baht 0.21 versus losses per share of Baht 0.09 and EPS of Baht 0.34 a year ago and a quarter ago, respectively.
DPS is recommended at Baht 0.26.
Annualised return on average shareholders’ equity of 2.43%.
Operating cash outflow for 1Q FY 2011 of Baht 393.28 million versus cash inflow of Baht 60.73 million and cash inflow of Baht 743.03 million a year and a quarter ago, respectively.cash inflow of Baht 743.03 million a year and a quarter ago, respectively.
Net debt of Baht 7,928.21 million versus net debt of Baht 3,823.41 million at 31 December 2010.
Cash level at Baht 3,300.35 million.
3 ‐ TTA 1Q FY2011 Earnings Results
Secured committed financing facilities of Baht 26,001.50 million.
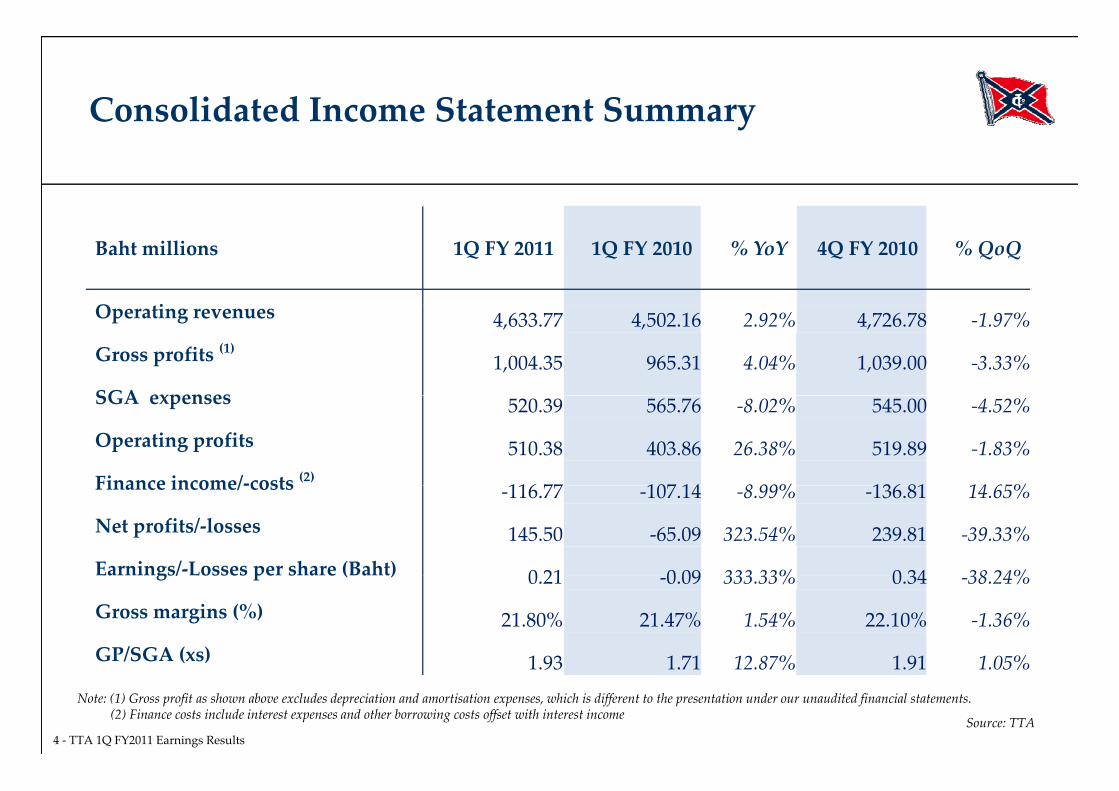
Consolidated Income Statement Summaryy
Baht millions 1Q FY 2011 1Q FY 2010 % YoY 4Q FY 2010 % QoQ
O tiOperating revenues 4,633.77 4,502.16 2.92% 4,726.78 ‐1.97%
Gross profits (1) 1,004.35 965.31 4.04% 1,039.00 ‐3.33%
SGA expensesSGA expenses 520.39 565.76 ‐8.02% 545.00 ‐4.52%
Operating profits 510.38 403.86 26.38% 519.89 ‐1.83%
Finance income/‐costs (2) 116 77 107 14 8 99% 136 81 14 65%Finance income/‐costs ‐116.77 ‐107.14 ‐8.99% ‐136.81 14.65%
Net profits/‐losses 145.50 ‐65.09 323.54% 239.81 ‐39.33%
Earnings/‐Losses per share (Baht) 0 21 0 09 333 33% 0 34 38 24%Earnings/ Losses per share (Baht) 0.21 ‐0.09 333.33% 0.34 ‐38.24%
Gross margins (%) 21.80% 21.47% 1.54% 22.10% ‐1.36%
GP/SGA (xs) 1 93 1 71 12 87% 1 91 1 05%
4 ‐ TTA 1Q FY2011 Earnings Results
Note: (1) Gross profit as shown above excludes depreciation and amortisation expenses, which is different to the presentation under our unaudited financial statements. (2) Finance costs include interest expenses and other borrowing costs offset with interest income Source: TTA
1.93 1.71 12.87% 1.91 1.05%
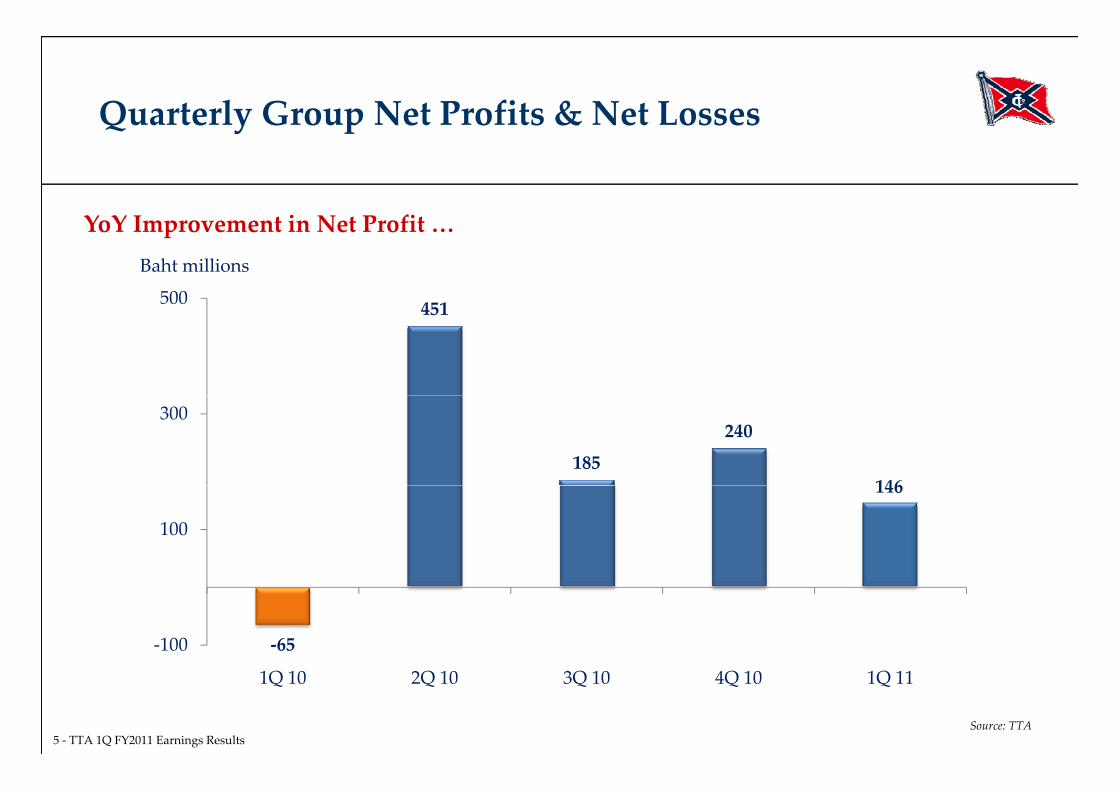
Quarterly Group Net Profits & Net Losses Q y p
Y Y I i N P fi
451500
Baht millions
YoY Improvement in Net Profit …
451
185
240
146
300
146
100
‐65‐100
5 ‐ TTA 1Q FY2011 Earnings Results
1Q 10 2Q 10 3Q 10 4Q 10 1Q 11
Source: TTA
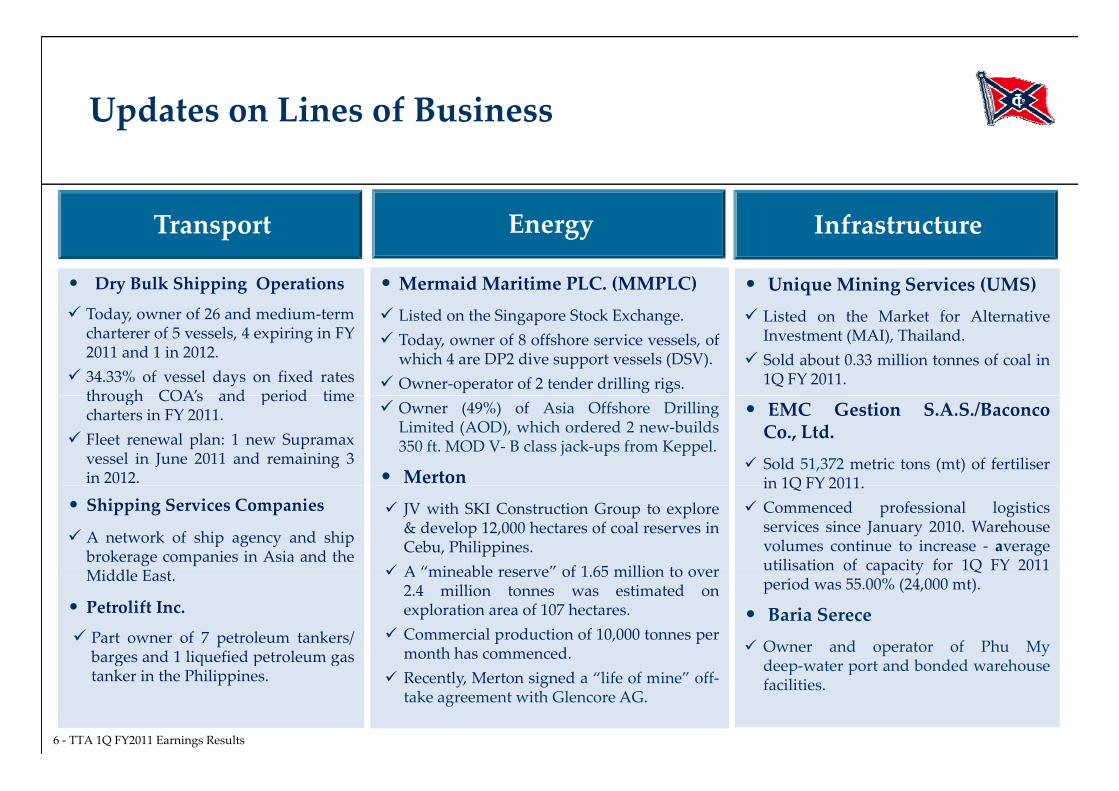
Updates on Lines of Business
T E I f
p
Transport Energy Infrastructure
• Dry Bulk Shipping Operations
• Mermaid Maritime PLC. (MMPLC) • Unique Mining Services (UMS) Today, owner of 26 and medium‐term
charterer of 5 vessels, 4 expiring in FY2011 and 1 in 2012.
34.33% of vessel days on fixed ratesthrough COA’s and period time
Listed on the Singapore Stock Exchange. Today, owner of 8 offshore service vessels, of
which 4 are DP2 dive support vessels (DSV). Owner‐operator of 2 tender drilling rigs.
Listed on the Market for AlternativeInvestment (MAI), Thailand.
Sold about 0.33 million tonnes of coal in1Q FY 2011.
through COAs and period timecharters in FY 2011.
Fleet renewal plan: 1 new Supramaxvessel in June 2011 and remaining 3in 2012.
Owner (49%) of Asia Offshore DrillingLimited (AOD), which ordered 2 new‐builds350 ft. MOD V‐ B class jack‐ups from Keppel.
• Merton
• EMC Gestion S.A.S./BaconcoCo., Ltd.
Sold 51,372 metric tons (mt) of fertiliserin 1Q FY 2011
• Shipping Services Companies A network of ship agency and ship
brokerage companies in Asia and theMiddle East
JV with SKI Construction Group to explore& develop 12,000 hectares of coal reserves inCebu, Philippines.
A “mineable reserve” of 1.65 million to over
in 1Q FY 2011. Commenced professional logistics
services since January 2010. Warehousevolumes continue to increase ‐ averageutilisation of capacity for 1Q FY 2011Middle East.
• Petrolift Inc. Part owner of 7 petroleum tankers/
barges and 1 liquefied petroleum gas
A mineable reserve of 1.65 million to over2.4 million tonnes was estimated onexploration area of 107 hectares.
Commercial production of 10,000 tonnes permonth has commenced.
period was 55.00% (24,000 mt).
• Baria Serece Owner and operator of Phu My
deep water port and bonded warehouse
6 ‐ TTA 1Q FY2011 Earnings Results
g q p gtanker in the Philippines. Recently, Merton signed a “life of mine” off‐
take agreement with Glencore AG.
deep‐water port and bonded warehousefacilities.
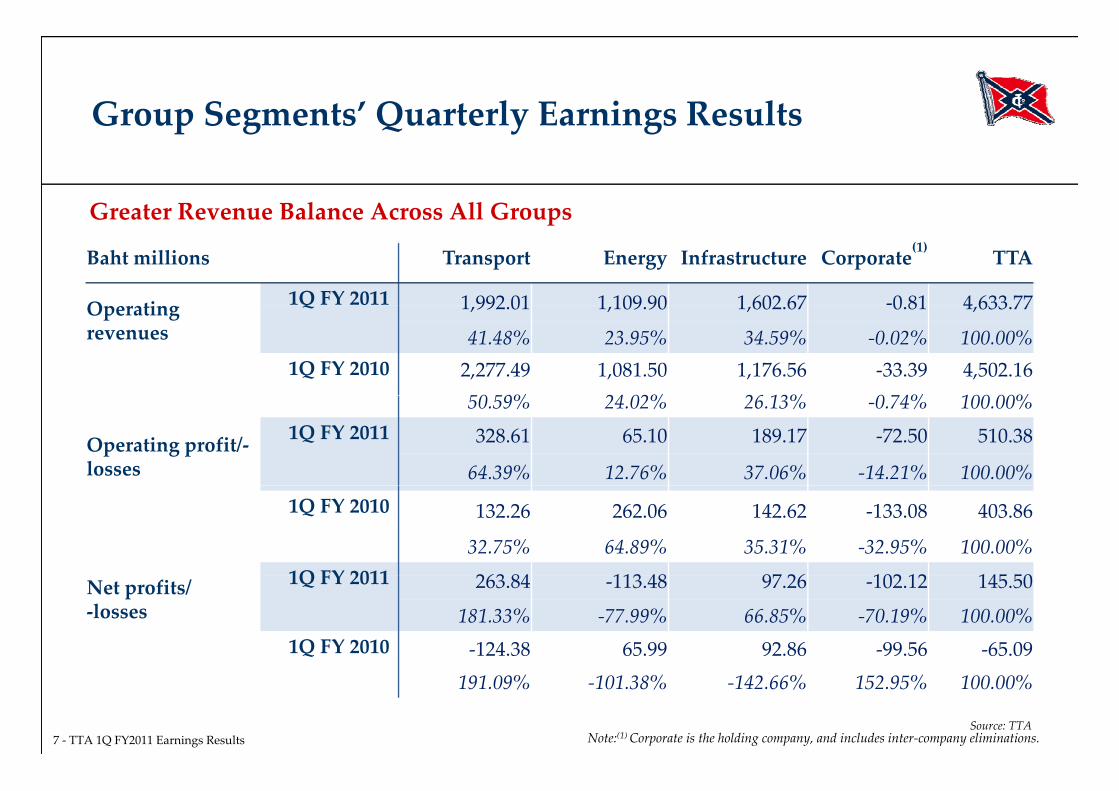
Group Segments’ Quarterly Earnings Resultsoup eg e Qua e y Ea i g e u
Greater Revenue Balance Across All GroupsGreater Revenue Balance Across All Groups
Baht millions Transport Energy Infrastructure Corporate(1) TTA
Operating 1Q FY 2011 1 992 01 1 109 90 1 602 67 ‐0 81 4 633 77Operating revenues
Q 1,992.01 1,109.90 1,602.67 0.81 4,633.77
41.48% 23.95% 34.59% ‐0.02% 100.00%1Q FY 2010 2,277.49 1,081.50 1,176.56 ‐33.39 4,502.16
50 59% 24 02% 26 13% 0 74% 100 00%50.59% 24.02% 26.13% ‐0.74% 100.00%
Operating profit/‐losses
1Q FY 2011 328.61 65.10 189.17 ‐72.50 510.38
64.39% 12.76% 37.06% ‐14.21% 100.00%
1Q FY 2010 132.26 262.06 142.62 ‐133.08 403.86
32.75% 64.89% 35.31% ‐32.95% 100.00%1Q FY 2011 263 84 113 48 97 26 102 12 145 50Net profits/
‐losses
1Q FY 2011 263.84 ‐113.48 97.26 ‐102.12 145.50
181.33% ‐77.99% 66.85% ‐70.19% 100.00%1Q FY 2010 ‐124.38 65.99 92.86 ‐99.56 ‐65.09
7 ‐ TTA 1Q FY2011 Earnings Results Note:(1) Corporate is the holding company, and includes inter‐company eliminations.Source: TTA
191.09% ‐101.38% ‐142.66% 152.95% 100.00%
AgendaAge a
I 1Q FY 2011 Financial HighlightsI. 1Q FY 2011 Financial Highlights
II. Transport Group• Key Drivers• Key Drivers
• Business Outlook & Strategies
III. Energy Group• Key Drivers
• Business Outlook & Strategies
IV Infrastructure GroupIV. Infrastructure Group• Key Drivers
• Business Outlook & Strategies
V. Capital Structure & Investments
VI. Q & A
8 ‐ TTA 1Q FY2011 Earnings Results
Transport Group : Key Driversa po oup ey i e
Dry Bulk Shipping Generated Baht 240 39 million to TTA’s 1Q FY 2011 Bottom Line
Dry bulk shipping’s net profit improved YoY but fell QoQ:
Average TCE rate of USD 12,674 was better than last year, as we expanded our fleet service
Dry Bulk Shipping Generated Baht 240.39 million to TTAs 1Q FY 2011 Bottom Line …
Average TCE rate of USD 12,674 was better than last year, as we expanded our fleet serviceglobally, but dry bulk shipping market conditions began to weaken in November and continuedto do so through January 2011;
Lower depreciation expenses of Baht 232.13 million, ‐12.56% YoY and ‐5.14% QoQ;p p
Profit was supported by gains of Baht 161.90 million after taxes from the sales of 2 vesselsthis quarter – net of tax gains on vessel sales for 1Q FY 10 (3 vessels) and 4Q FY 10 (2vessels) were Baht 94.25 million and Baht 86.78 million, respectively.
Petrolift Contributed Baht 19.33 million to TTA’s 1Q FY 2011 Bottom Line …
In January 2011, we raised our stake in Petrolift to 40%.
Petrolift’s financial performance was down from last quarter due to year end accruals for crewperformance and benefits and for supplies of spare‐parts during this quarter. Otherwise, Petrolift’soperation remains on plan.
9 ‐ TTA 1Q FY2011 Earnings Results
Almost all Petrolift’s fleet capacity is under term contracts ranging from 3 to 12 years with the threemajor oil and gas companies in the Philippines.
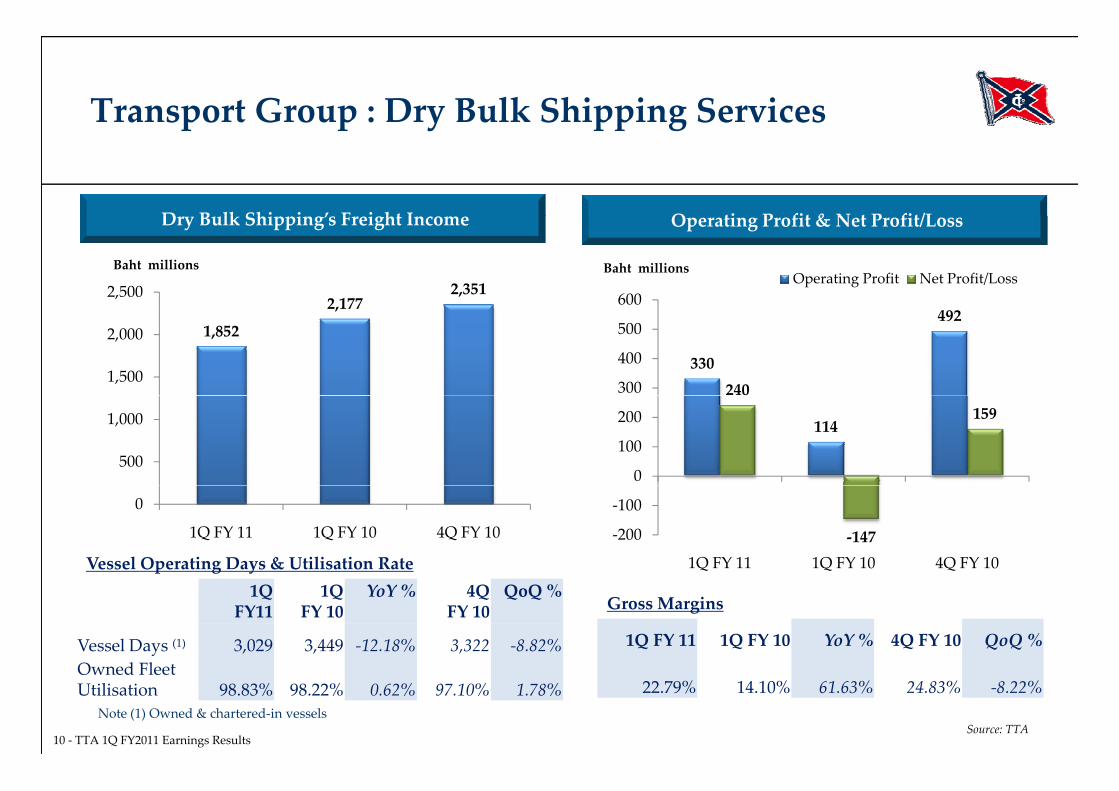
Transport Group : Dry Bulk Shipping Servicesp p y pp g
O ti P fit & N t P fit/LD y Bulk Shi i ’ F ei ht I o e Operating Profit & Net Profit/LossDry Bulk Shipping’s Freight Income
2 1772,3512,500
Baht millions
600Operating Profit Net Profit/Loss
Baht millions
1,852
2,177
1,500
2,000
330
492
240300
400
500
500
1,000 114159
0
100
200
Vessel Operating Days & Utilisation Rate
0
1Q FY 11 1Q FY 10 4Q FY 10 ‐147‐200
‐100
1Q FY 11 1Q FY 10 4Q FY 10
Gross Margins
1Q FY 11 1Q FY 10 YoY % 4Q FY 10 QoQ %
1QFY11
1Q FY 10
YoY % 4Q FY 10
QoQ %
Vessel Days (1) 3,029 3,449 ‐12.18% 3,322 ‐8.82%O d Fl t
10 ‐ TTA 1Q FY2011 Earnings Results
22.79% 14.10% 61.63% 24.83% ‐8.22%
Source: TTA
Owned FleetUtilisation 98.83% 98.22% 0.62% 97.10% 1.78%
Note (1) Owned & chartered‐in vessels
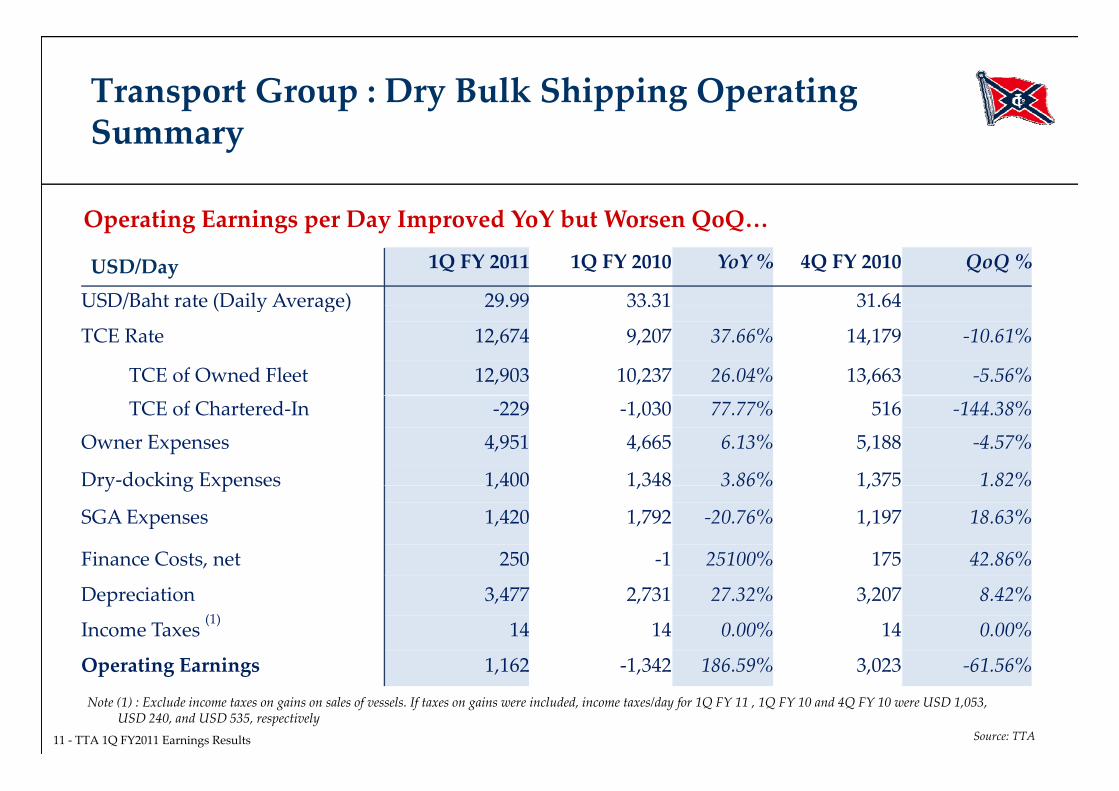
Transport Group : Dry Bulk Shipping Operating SSummary
Operating Earnings per Day Improved YoY but Worsen QoQOperating Earnings per Day Improved YoY but Worsen QoQ…
USD/Day 1Q FY 2011 1Q FY 2010 YoY % 4Q FY 2010 QoQ %
USD/Baht rate (Daily Average) 29.99 33.31 31.64USD/Baht rate (Daily Average) 29.99 33.31 31.64
TCE Rate 12,674 9,207 37.66% 14,179 ‐10.61%
TCE of Owned Fleet 12,903 10,237 26.04% 13,663 ‐5.56%
TCE of Chartered‐In ‐229 ‐1,030 77.77% 516 ‐144.38%Owner Expenses 4,951 4,665 6.13% 5,188 ‐4.57%
Dry‐docking Expenses 1,400 1,348 3.86% 1,375 1.82%Dry docking Expenses 1,400 1,348 3.86% 1,375 1.82%
SGA Expenses 1,420 1,792 ‐20.76% 1,197 18.63%
Finance Costs, net 250 ‐1 25100% 175 42.86%
Depreciation 3,477 2,731 27.32% 3,207 8.42%
Income Taxes (1) 14 14 0.00% 14 0.00%
Operating Earnings 1 162 1 342 186 59% 3 023 61 56%
11 ‐ TTA 1Q FY2011 Earnings Results Source: TTA
Operating Earnings 1,162 ‐1,342 186.59% 3,023 ‐61.56%
Note (1) : Exclude income taxes on gains on sales of vessels. If taxes on gains were included, income taxes/day for 1Q FY 11 , 1Q FY 10 and 4Q FY 10 were USD 1,053, USD 240, and USD 535, respectively
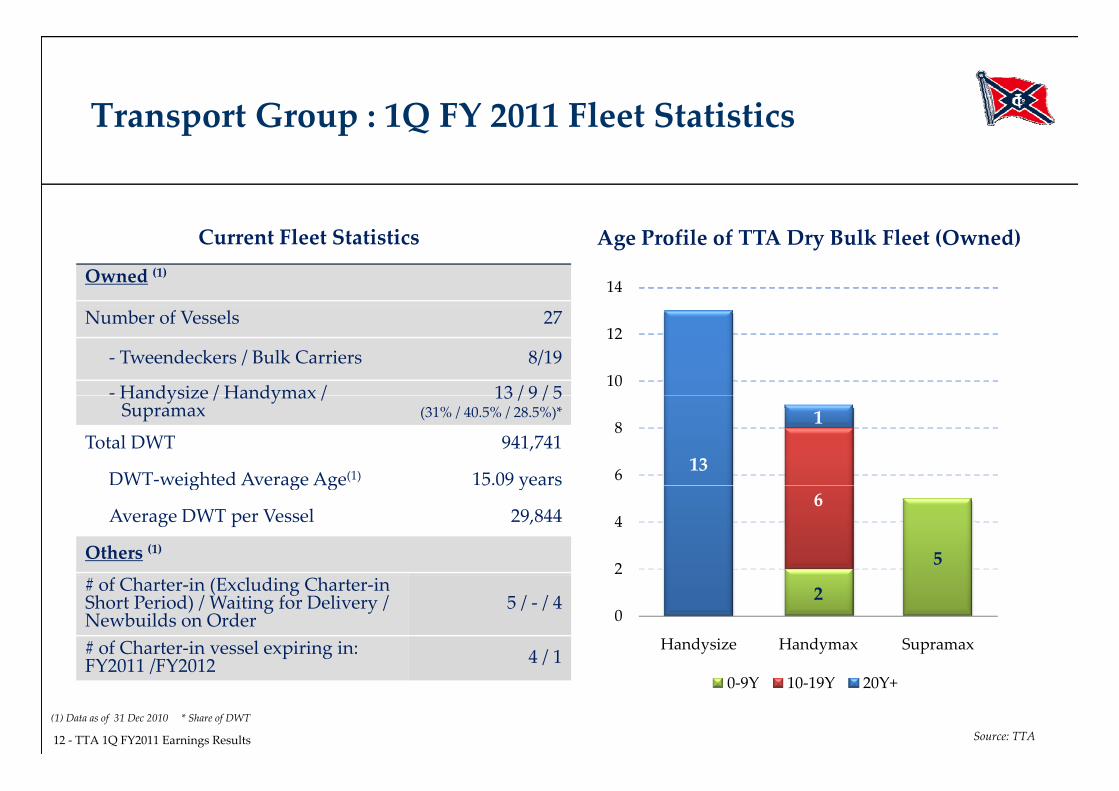
Transport Group : 1Q FY 2011 Fleet StatisticsTransport Group : 1Q FY 2011 Fleet Statistics
Current Fleet Statistics Age Profile of TTA Dry Bulk Fleet (Owned)
Owned (1)14
Number of Vessels 27
‐ Tweendeckers / Bulk Carriers 8/19
‐Handysize / Handymax / 13 / 9 / 510
12
Handysize / Handymax / Supramax
13 / 9 / 5(31% / 40.5% / 28.5%)*
Total DWT 941,741
DWT‐weighted Average Age(1) 15.09 years13
1
6
8
eig e A e age Age 5 09 yea s
Average DWT per Vessel 29,844
Others (1) 5
6
2
4
# of Charter‐in (Excluding Charter‐in Short Period) / Waiting for Delivery / Newbuilds on Order
5 / ‐ / 4
# of Charter‐in vessel expiring in: FY2011 /FY2012 4 / 1
20
Handysize Handymax Supramax
12 ‐ TTA 1Q FY2011 Earnings Results Source: TTA
FY2011 /FY2012 /0‐9Y 10‐19Y 20Y+
(1) Data as of 31 Dec 2010 * Share of DWT
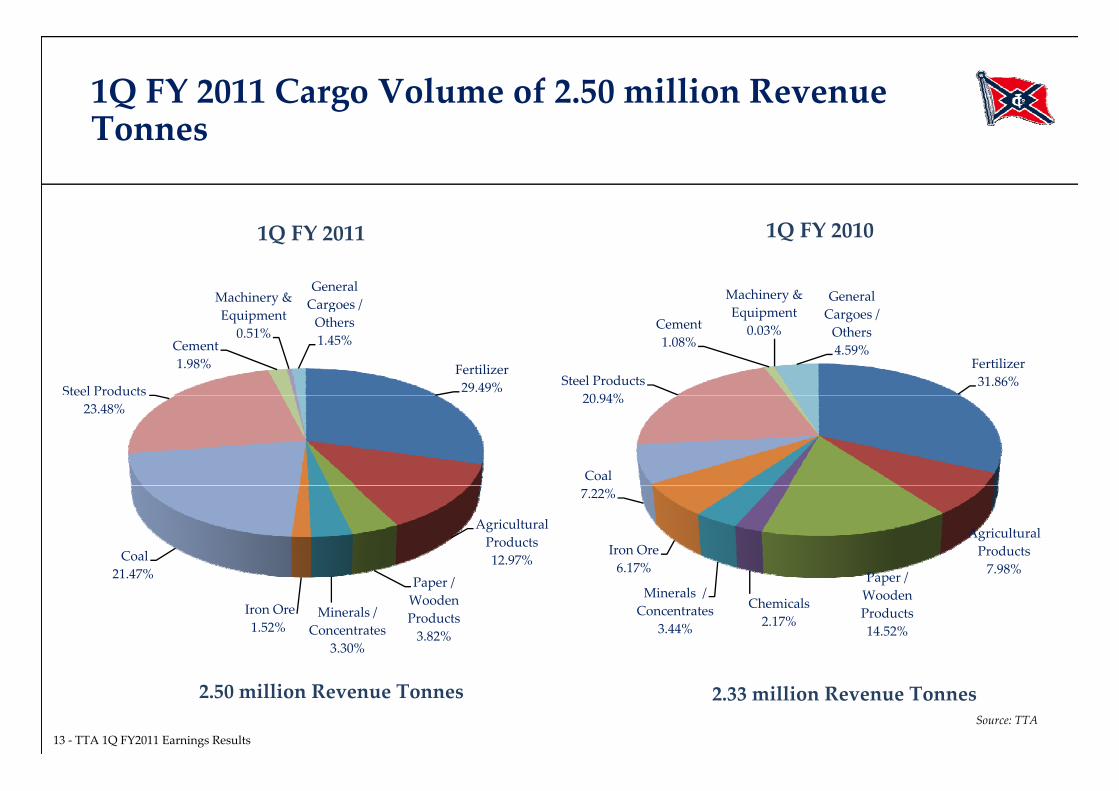
1Q FY 2011 Cargo Volume of 2.50 million Revenue TonnesTonnes
1Q FY 2011 1Q FY 2010
Machinery & General Cargoes /
Machinery & General
Fertilizer29.49%Steel Products
Cement1.98%
Equipment0.51%
Cargoes / Others1.45%
Fertilizer31.86%Steel Products
20 94%
Cement1.08%
Equipment0.03%
Cargoes / Others4.59%
ee o u23.48%
Coal
20.94%
Agricultural Products12.97%Coal
21 47%
Agricultural Products7.98%Pa e /
Iron Ore6.17%
7.22%
Paper / Wooden Products3.82%
Minerals / Concentrates
3.30%
Iron Ore1.52%
21.47% Paper / Wooden Products14.52%
Chemicals 2.17%
Minerals / Concentrates
3.44%
13 ‐ TTA 1Q FY2011 Earnings ResultsSource: TTA
2.50 million Revenue Tonnes 2.33 million Revenue Tonnes
Transport Group : Business Outlookp p
Demand …China’s seaborne trade demand remains uncertain: Higher domestic production for iron ore in China instead of import s as prices increase; Although China remains as a net coal importer, the imports are expected to rise just 9% this year,Although China remains as a net coal importer, the imports are expected to rise just 9% this year,
much lower than the 31% rise in shipments last year; After robust December 2010 imports, iron ore and coal inventory levels at Chinese ports are high.
With rising prices of these commodities, traders and buyers are discouraged from buying whilemillers are expected to draw down their stocks;
Chinese steel output is unlikely to grow strongly in 2011 as the industry remains concerned aboutmargins, with profits hit by surging raw materials prices and an inability to pass on costs in full;
S k l f l d Ch l l d 1 4 ll % h k Stockpiles of steel products in China currently totaled at 15.4 million tons, 5% more than a week ago.Stockpiles continued to increase for 9 consecutive weeks, this could be a sign that Chinese steel outputis poised to decline .
Th t f t f d dThe support factors for demand: Australian coal exports are slowly rebounding, improving Pacific voyages; A seasonal strength in the dry bulk market should prevail, especially as South American grains season
i ea
14 ‐ TTA 1Q FY2011 Earnings Results
is near; A rebound in overall activity may lead to higher port congestion, which should take up dry bulk
capacity.
Transport Group : Business Outlook (cont’d)p p
Supply …The underlying threat of excess new‐builds still exists for the next few years.
918 vessels and 77.58 million DWT were delivered during 2010;
Supply …
The world fleet grew by 18.28% YoY in terms of DWT, and after taken demolitions into account,the net growth was higher 18.60% YoY;
Order books for 2011 and 2012 equal to 1,613 vessels at 137.08 million DWT and 1,033 vessels atq92.15 million DWT, respectively.
As of December 2010, the world fleet stood at 8,262 vessels and 547.02 million DWT, the highest inhistory.
Scrapping for 2010 was only 96 vessels at 4.50 million DWT, which is almost negligible.
In summary, we expect the dry bulk shipping business to remain under pressure, and any upturn willnot occur before net fleet growth is reduced considerablynot occur before net fleet growth is reduced considerably.
15 ‐ TTA 1Q FY2011 Earnings Results
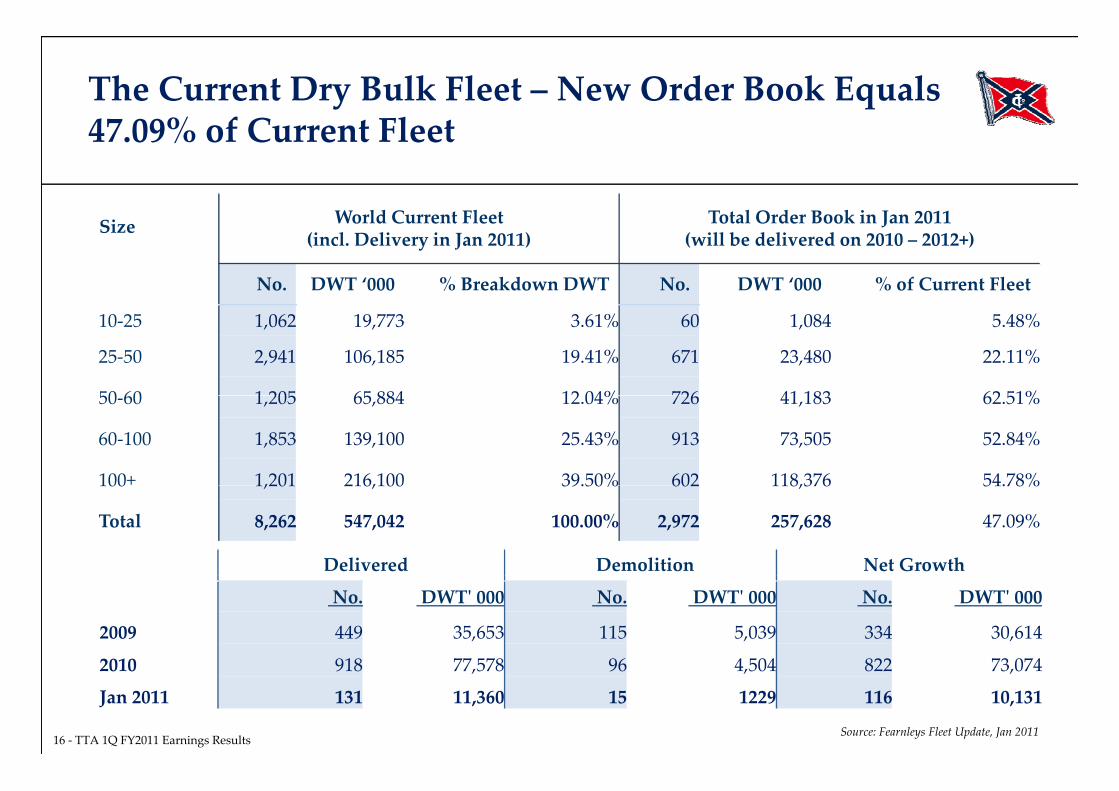
The Current Dry Bulk Fleet – New Order Book Equals 47 09% of Current Fleet47.09% of Current Fleet
World Current Fleet Total Order Book in Jan 2011Size World Current Fleet (incl. Delivery in Jan 2011)
Total Order Book in Jan 2011(will be delivered on 2010 – 2012+)
No. DWT ‘000 % Breakdown DWT No. DWT ‘000 % of Current Fleet
10‐25 1,062 19,773 3.61% 60 1,084 5.48%
25‐50 2,941 106,185 19.41% 671 23,480 22.11%
50 60 1 205 65 884 12 04% 726 41 183 62 51%50‐60 1,205 65,884 12.04% 726 41,183 62.51%
60‐100 1,853 139,100 25.43% 913 73,505 52.84%
100+ 1,201 216,100 39.50% 602 118,376 54.78%100 1,201 216,100 39.50% 602 118,376 54.78%
Total 8,262 547,042 100.00% 2,972 257,628 47.09%
Delivered Demolition Net Growth
No. DWTʹ 000 No. DWTʹ 000 No. DWTʹ 000
2009 449 35,653 115 5,039 334 30,614
2010 918 77 578 96 4 504 822 73 074
16 ‐ TTA 1Q FY2011 Earnings ResultsSource: Fearnleys Fleet Update, Jan 2011
2010 918 77,578 96 4,504 822 73,074
Jan 2011 131 11,360 15 1229 116 10,131
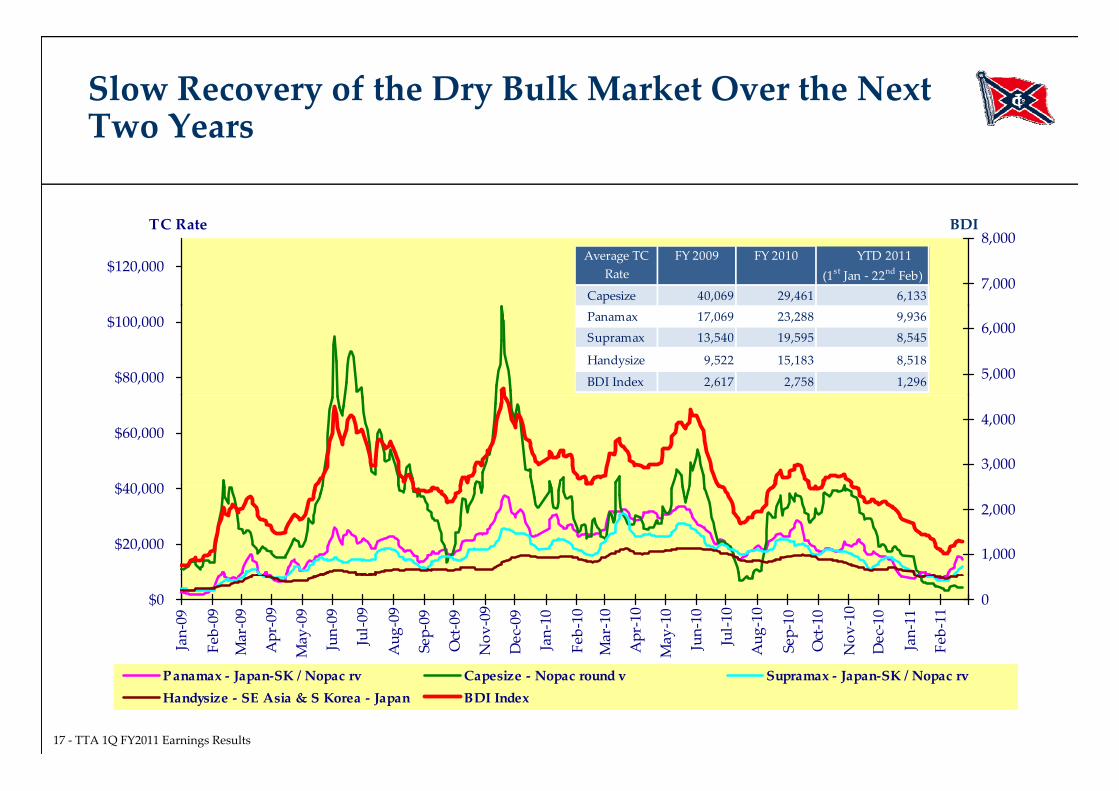
Slow Recovery of the Dry Bulk Market Over the Next Two YearsTwo Years
$120,000
TC Rate
7,000
8,000BDI
Average TC Rate
FY 2009 FY 2010 YTD 2011 (1st Jan ‐ 22nd Feb)
Capesize 40,069 29,461 6,133
$80,000
$100,000
5,000
6,000Panamax 17,069 23,288 9,936Supramax 13,540 19,595 8,545
Handysize 9,522 15,183 8,518
BDI Index 2,617 2,758 1,296
$40 000
$60,000
3,000
4,000
$20,000
$40,000
1,000
2,000
$0
Jan‐09
Feb‐09
Mar‐09
Apr‐09
May‐09
Jun‐09
Jul‐0
9
Aug‐09
Sep‐09
Oct‐09
Nov‐09
Dec‐09
Jan‐10
Feb‐10
Mar‐10
Apr‐10
May‐10
Jun‐10
Jul‐1
0
Aug‐10
Sep‐10
Oct‐10
Nov‐10
Dec‐10
Jan‐11
Feb‐11
0
17 ‐ TTA 1Q FY2011 Earnings Results
Panamax ‐ Japan‐SK / Nopac rv Capesize ‐ Nopac round v Supramax ‐ Japan‐SK / Nopac rvHandysize ‐ SE Asia & S Korea ‐ Japan BDI Index
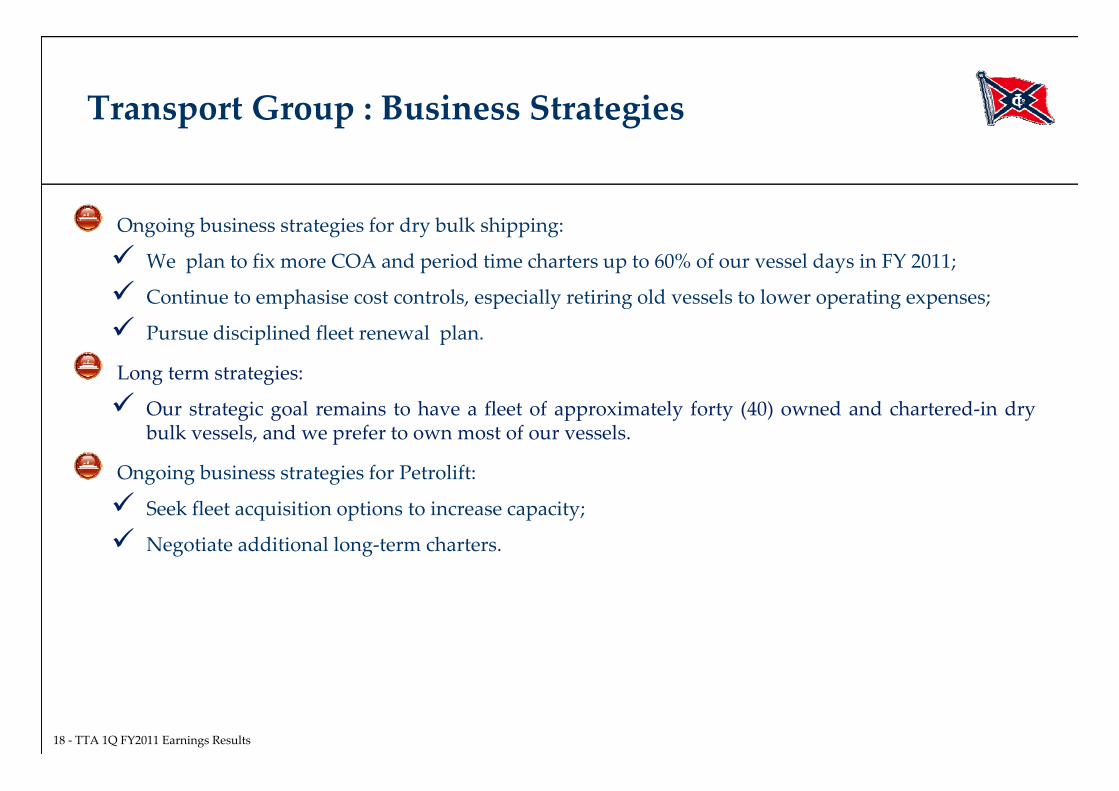
Transport Group : Business Strategiesp p g
Ongoing business strategies for dry bulk shipping:
We plan to fix more COA and period time charters up to 60% of our vessel days in FY 2011;
Continue to emphasise cost controls, especially retiring old vessels to lower operating expenses;p , p y g p g p ;
Pursue disciplined fleet renewal plan.
Long term strategies:
Our strategic goal remains to have a fleet of approximately forty (40) owned and chartered‐in drybulk vessels, and we prefer to own most of our vessels.
Ongoing business strategies for Petrolift:
Seek fleet acquisition options to increase capacity;
Negotiate additional long‐term charters.
18 ‐ TTA 1Q FY2011 Earnings Results
AgendaAge a
I. 1Q FY 2011 Financial HighlightsI. 1Q FY 2011 Financial Highlights
II. Transport Group• Key Drivers• Key Drivers
• Business Outlook & Strategies
III. Energy Group• Key Drivers
• Business Outlook & Strategies
IV Infrastructure GroupIV. Infrastructure Group• Key Drivers
• Business Outlook & Strategies
V. Capital Structure & Investments
VI. Q & A
19 ‐ TTA 1Q FY2011 Earnings Results
Energy Group : Key Drivers
Weak Offshore Service Market: 1Q FY 2011 Net Losses of Baht 107.71 million to TTA
gy p y
Weak Offshore Service Market: 1Q FY 2011 Net Losses of Baht 107.71 million to TTA
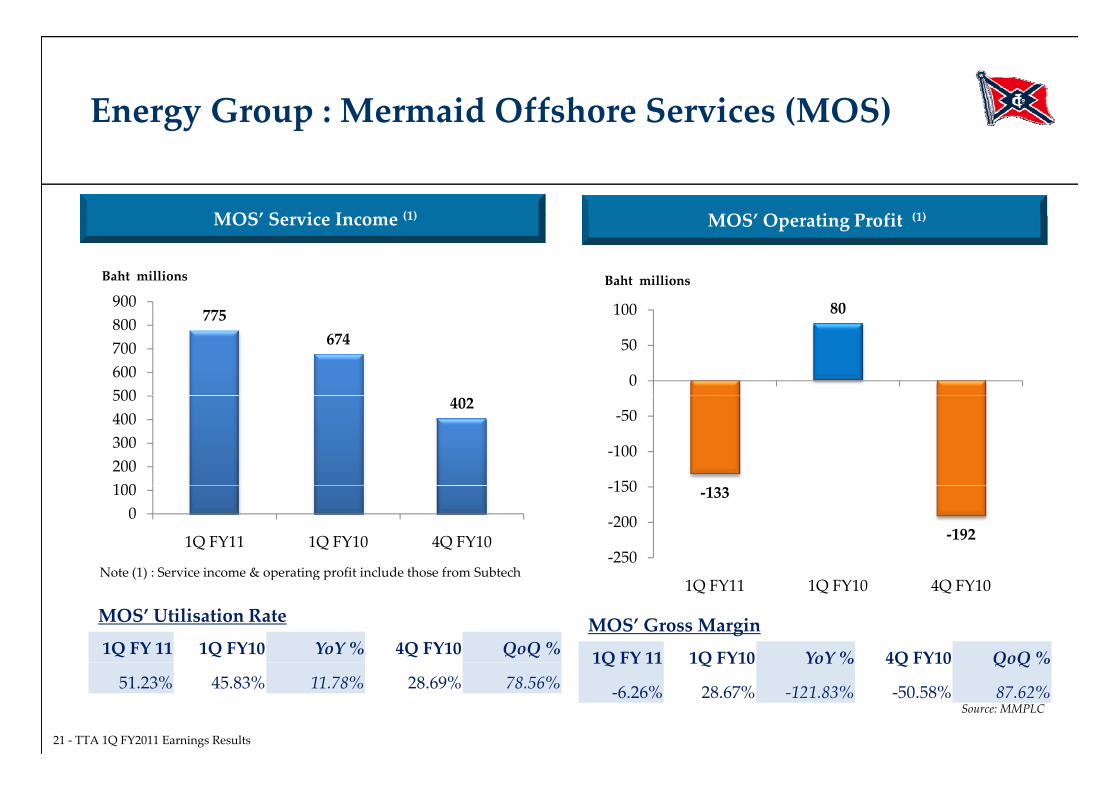
Mermaid Offshore Services Ltd. (MOS)’s operating losses of Baht 188.51 million:
Average vessel utilisation rate of 51.23% (last year 45.83% and last quarter 28.69%);
Average day rates rose by 7.66% YoY and 105.91% QoQ to USD 37,026, as higher specificationvessels can achieve higher day rates;
But overall utilisation of the four high specification vessels was below plan, as a reflection ofg p p ,reduced demand for subsea services globally. While these vessels were idle for periods oftime, fixed costs, including wages for the minimum crews on board and depreciation, werestill being incurred;
Total additional depreciation expenses for MOS this quarter were Baht 99.21 million, ofwhich more than 95% was related to these four subsea vessels.
This quarter, Seascape and Subtech combined contributed Baht 164.17 million and Baht 59.13 millionq pof service income and gross profits, respectively, compared to Baht 127.24 million of service incomeand Baht 76.37 million of gross profit same period last year.
20 ‐ TTA 1Q FY2011 Earnings Results
Energy Group : Mermaid Offshore Services (MOS)gy p
MOS’ O ti P fit (1)MOS’ Se i e I o e (1) MOS’ Operating Profit (1)MOS’ Service Income (1)
900Baht millions
80100
Baht millions
775674
500600700800900 80
0
50
100
402
100200300400500
150
‐100
‐50
Note (1) : Service income & operating profit include those from Subtech
0100
1Q FY11 1Q FY10 4Q FY10
‐133
‐192‐250
‐200
‐150
MOS’ Utilisation Rate
1Q FY 11 1Q FY10 YoY % 4Q FY10 QoQ %
Note (1) : Service income & operating profit include those from Subtech 1Q FY11 1Q FY10 4Q FY10
MOS’ Gross Margin
1Q FY 11 1Q FY10 YoY % 4Q FY10 QoQ %
21 ‐ TTA 1Q FY2011 Earnings Results
Source: MMPLC
51.23% 45.83% 11.78% 28.69% 78.56%Q Q Q Q Q
‐6.26% 28.67% ‐121.83% ‐50.58% 87.62%
Energy Group : Business Outlook & Strategiesgy p g
Subsea Market Remains Challenging …
Increasing subsea vessel availability is expected to cap day rate increases.
However, as oil prices stabilise and the global economic recovery grows, it is expected that demandill i k h h i h di l
g g
will pick‐up though in the medium to long term.
MOS’ ongoing business strategies:
Increase business on the back of our strong reputation and presence in SE Asia and throughI c ease busi ess o t e back o ou st o g eputatio a d p ese ce i SE Asia a d t ougSubtech and the new Saudi Arabian JV in the Middle East;
Increase our business development capability and optimise our pricing strategy to drive uputilization.
MOS’ long term strategies:
Build capability and systems to support expansion of the business into new markets on the backof our new vessels;of our new vessels;
Increase revenues and margins by continuing to build added value services in such areas asengineering, project management, and construction.
22 ‐ TTA 1Q FY2011 Earnings Results
Energy Group : Key Drivers
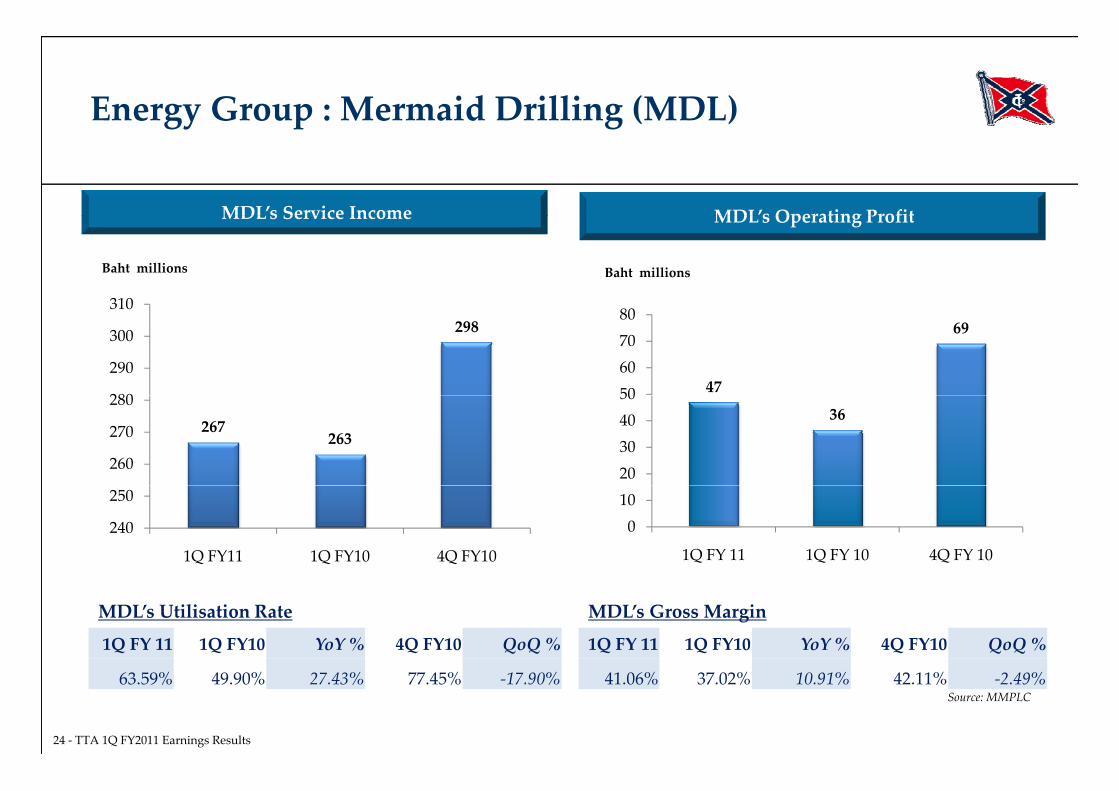
Drilling: 1Q FY 2011 Net Profit of Baht 16.38 million to TTA
gy p y
Drilling: 1Q FY 2011 Net Profit of Baht 16.38 million to TTA
Mermaid Drilling Ltd. (MDL)’s operating profit of Baht 46.78 million:
Utilisation rate at 63.59% – MTR‐2: 49.70% and MTR‐1: 13.89%;;
MTR‐2 continues to operate for Chevron Indonesia, contract expiring in 2Q FY 2011;
MTR‐1 ceased working as an accommodation barge for CUDD and has been demobilised fromthe Middle East back to SE Asiathe Middle East back to SE Asia.
Asia Offshore Drilling Limited (“AOD”) signed contracts with Singapore Keppel FELS Limited(“Keppel”) to build two (2) KFELS B Class jack‐up rigs worth USD 360 million – scheduled deliveriesare in 2012 and 2013, respectively.are in 2012 and 2013, respectively.
Options to build another two similar jack‐up rigs at Keppel are given as part of the contract . Ifexercised, the total contract value will be above USD 720 million;
The private placement of equity for AOD was successfully completed during this quarter with The private placement of equity for AOD was successfully completed during this quarter withUSD 100 million raised. MMPLC subscribed for USD 49 million, equivalent to a 49% ownershipin AOD. The gross proceeds will be used to finance: (i) the initial contract payments on the twonew‐build jack‐up rigs from Keppel; (ii) project management; and (iii) working capital andll l d d
23 ‐ TTA 1Q FY2011 Earnings Results
selling, general, and administrative expenses.
Energy Group : Mermaid Drilling (MDL) gy p g
MDL’s Operating ProfitMDL’s Service Income MDLs Operating ProfitMDLs Service Income
310
Baht millions Baht millions
298
280
290
300
310
47
69
50607080
267263
260
270
28036
20304050
240
250
1Q FY11 1Q FY10 4Q FY10
010
1Q FY 11 1Q FY 10 4Q FY 10
MDL’s Utilisation Rate
1Q FY 11 1Q FY10 YoY % 4Q FY10 QoQ %
MDL’s Gross Margin
1Q FY 11 1Q FY10 YoY % 4Q FY10 QoQ %
24 ‐ TTA 1Q FY2011 Earnings Results
Source: MMPLC63.59% 49.90% 27.43% 77.45% ‐17.90% 41.06% 37.02% 10.91% 42.11% ‐2.49%
Energy Group : Business Outlook & StrategiesE e gy G oup usi ess Ou oo & S a egies
Drilling Focus is to Realize Value and Long Term Growth from New Assets
A large number of short term contracts have been awarded to new rigs, thus supporting highutilisation rates – especially the smaller independent oil companies, with the easing of the creditmarkets have been resuming their E&P activities
Drilling Focus is to Realize Value and Long Term Growth from New Assets…
markets, have been resuming their E&P activities.
As oil prices continue to stabilise and the global economic recovery continues, additionalrequirements for drilling assets especially new and sophisticated ones will be in strong demand.
Both day rates and utilisation have stabilised and are expected to be on an uptrend moving forward.
MDL’s ongoing business strategies:
We remain in active discussions with Chevron on a contract extension for MTR 2; We remain in active discussions with Chevron on a contract extension for MTR‐2;
Market the new jack‐up rigs for AOD;
Build capability to manage construction and ultimately operation of new jack‐up rigs for AOD.
MDL’s long term strategies:
Transition all staff and systems into AOD, to build a globally competitive drilling business basedupon a modern fleet of rigs.
25 ‐ TTA 1Q FY2011 Earnings Results
upon a modern fleet of rigs.
Energy Group : Key Driver, Business Outlook & StrategiesStrategies
Merton Reported a Net Loss of Baht 5 91 million in 1 Q FY 2011
Given that TTA owns 21.18% of Merton, TTA equity accounted Baht 1.25 million of net loss fromMerton during 1Q FY 2011.
Merton Reported a Net Loss of Baht 5.91 million in 1 Q FY 2011 …
Merton’s joint venture, SKI Energy Resources Inc. (“SERI”), produced its first coal in May last year. Itsigned a “life of mine” off‐take agreement with Glencore AG and shipped its first 8,000 tonnes of coalin December 2010.
Given that SERI is still at its development stage, we expect Merton to reinvest its earnings foradditional mine site as well as new coal projects/concessions in the Philippines.
Mine site 1 will be expanded and should add another 1 million tonnes of reserves.p
With good visibility on production and the off‐take agreement in place, we expect Merton tocontribute to TTA’s earnings starting from this and should increase rapidly over the next few years.
26 ‐ TTA 1Q FY2011 Earnings Results
AgendaAge a
I. 1Q FY 2011 Financial HighlightsI. 1Q FY 2011 Financial Highlights
II. Transport Group• Key Drivers• Key Drivers
• Business Outlook & Strategies
III. Energy Group• Key Drivers
• Business Outlook & Strategies
IV Infrastructure GroupIV. Infrastructure Group• Key Drivers
• Business Outlook & Strategies
V. Capital Structure & Investments
VI. Q & A
27 ‐ TTA 1Q FY2011 Earnings Results
Infrastructure Group : Key Drivers & Business OutlookI as uc u e G oup ey i e s & usi ess Ou oo
UMS Contributed Baht 38 63 million to TTA’s 1Q FY 2011 Net ProfitUMS Contributed Baht 38.63 million to TTAs 1Q FY 2011 Net Profit …
UMS’ improved earnings were due to:
Coal sales improved 23.63% YoY. However, sales declined QoQ by 15.72% due to lower salesvolumes to large‐sized clients, which have variable demand for coal throughout the year.
Gross margins for coal sales improved to 23.68% due to higher selling prices that wereimplemented since third quarter last year and lower sales of lower margin 0‐5 mm coals.
UMS: Improving Sales Volumes but Lower Margin …International coal prices have shown a strong upward trend since 4Q FY 2010. UMS is expected to setp g p Q pprices in conjunction with domestic price trends, which are affected by ongoing competition andvarying domestic coal supplies.
Domestic cement production is expected to improve this year; we expect these plants will purchasep p p y p p pmore coal. However, cement companies are seeking lower prices for longer term and higher volumepurchase contracts.
Given the contract commitments in hand, UMS expects to raise its 0‐5 mm coal sales for the remainder
28 ‐ TTA 1Q FY2011 Earnings Results
of FY 2011. As a result, we expect UMS’ overall gross margin as a percentage of revenues to be lowerthan that in 1Q FY 2011.
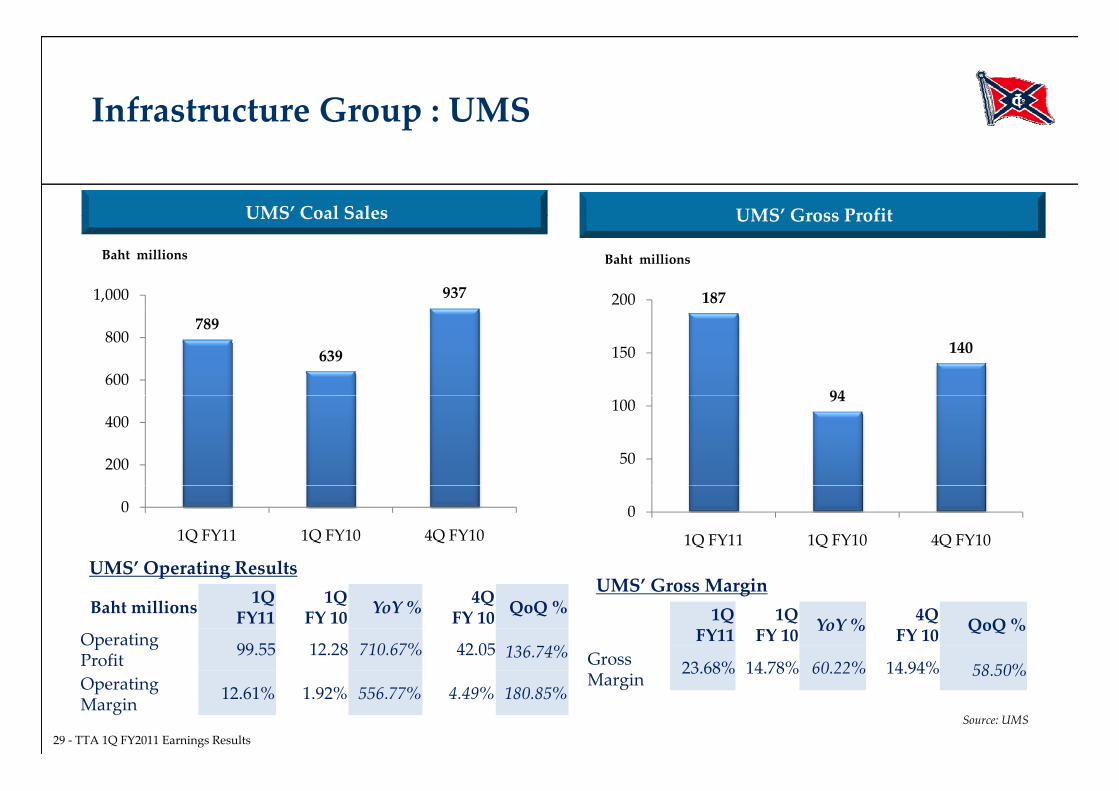
Infrastructure Group : UMSp
UMS’ Gross ProfitUMS’ Coal Sales UMS Gross ProfitUMS Coal Sales
9371,000
Baht millions
187200
Baht millions
789
639600
800
94
140150
200
40094
50
100
0
1Q FY11 1Q FY10 4Q FY100
1Q FY11 1Q FY10 4Q FY10
UMS’ Operating Resultsp g
Baht millions 1QFY11
1Q FY 10 YoY % 4Q
FY 10 QoQ %
Operating Profit 99.55 12.28 710.67% 42.05 136.74%
UMS’ Gross Margin1Q
FY11 1Q
FY 10 YoY % 4Q FY 10 QoQ %
Gross 23 68% 14 78% 60 22% 14 94% 58 50%
29 ‐ TTA 1Q FY2011 Earnings Results
Source: UMS
ProfitOperating Margin 12.61% 1.92% 556.77% 4.49% 180.85%
oMargin
23.68% 14.78% 60.22% 14.94% 58.50%
Infrastructure Group : Business Strategiesp g
UMS B l S l V l ith R bl M i d Fi S i f C l
UMS’ ongoing business strategies:
Increase marketing and pricing efforts to secure market leader position;
UMS Balances Sales Volumes with Reasonable Margins and Firm Sourcing of Coals …
Increase marketing and pricing efforts to secure market leader position;
Continue to fine‐tuning the total quality management of the granular project to enhance value to 0‐5mm size coal.
UMS’ long term strategies:
UMS ensures firm supplies of coals by establishing a local office in Indonesia and entering into moreterm contracts with suppliers;
UMS plans to expand client base by innovating new ideas as well as penetrating newmarkets, including a number of projects to foster conversions of non‐coal fired boilers into coal‐firedboilers, and to sell different qualities of coal.
30 ‐ TTA 1Q FY2011 Earnings Results
Infrastructure Group : Key Drivers & Business Strategies
Baconco Contributed Earnings of Baht 55 04 million to TTA’s 1Q FY 2011 Net Profit
Strategies
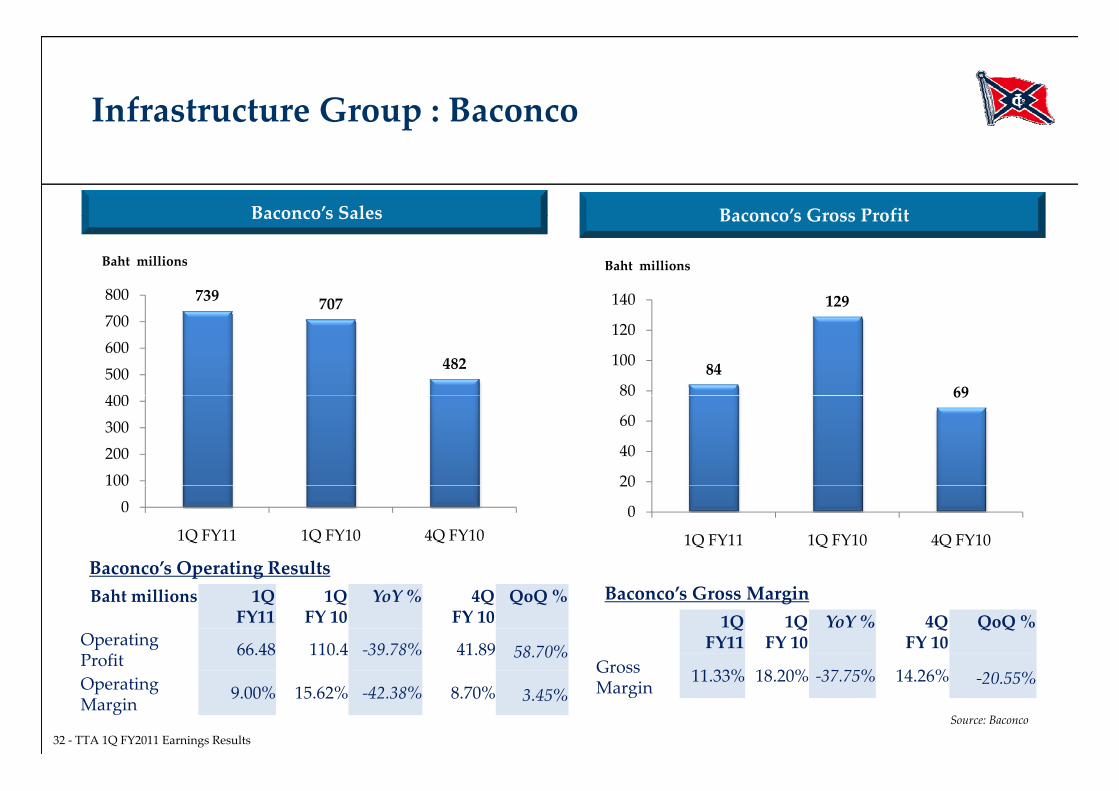
Baconco Contributed Earnings of Baht 55.04 million to TTAs 1Q FY 2011 Net Profit…
Baconco sold 51,372 metric tonnes (mt) of fertilisers in 1Q FY2011. Sales improved as September to December every year is one of the main seasons for fertiliser
consumptions; But gross margin was under pressure this quarter due to rising raw material prices in both
international and domestic markets, which resulted in higher cost of sales.
For 1Q FY 2011, Baconco booked a total of 24,000 mt (55% average of total intended warehousingcapacity) of warehousing services, and the profit contribution was Baht 0.24 million.
Baconco’s ongoing business strategies:Baconco s ongoing business strategies: Concentrate on “quality” specialty products which are of higher margins and not limited to fertilisers; Maintain high quality warehouse services to demand higher prices.
Baconco’s long term strategies: Baconco is currently transforming to be a “total package” solution provider under Baconco’s new
brand – Baconco Crop Care which includes fertilisers, pesticides/herbicides, and seeds;
31 ‐ TTA 1Q FY2011 Earnings Results
Actively engaging in increased logistics services for existing warehouse and to acquire or lease moreland/ space to better capture the inbound and outbound cargo flows in the Phu My area.
Infrastructure Group : Baconcop
Baconco’s Gross ProfitBaconco’s Sales Baconco s Gross ProfitBaconco s Sales
739 707800
Baht millions
129140
Baht millions
707
482
400500600700
84
129
6980
100
120
100200300400 69
20
40
60
80
0100
1Q FY11 1Q FY10 4Q FY100
20
1Q FY11 1Q FY10 4Q FY10
Baconco’s Operating Resultsp gBaht millions 1Q
FY11 1Q
FY 10YoY % 4Q
FY 10QoQ %
Operating Profit 66.48 110.4 ‐39.78% 41.89 58.70%
Baconco’s Gross Margin1Q
FY11 1Q
FY 10YoY % 4Q
FY 10QoQ %
Gross
32 ‐ TTA 1Q FY2011 Earnings Results
Source: Baconco
ProfitOperating Margin
9.00% 15.62% ‐42.38% 8.70% 3.45%Gross Margin
11.33% 18.20% ‐37.75% 14.26% ‐20.55%
Infrastructure Group : Key Drivers, Business Outlook & Strategies
Baria Reported a Net Profit of Baht 14 72 million in 1Q FY 2011
Strategies
Baria Reported a Net Profit of Baht 14.72 million in 1Q FY 2011 …
TTA equity accounted Baht 0.18 million of net profit from Baria during 1Q FY 2011 (for about onemonth duration during this quarter) for the first time as we acquired a 20% stake in this port businessin Vietnam in November 2010in Vietnam in November 2010.
In 2010, Baria achieved almost 5.20 million tonnes of cargo throughput, which is 51.60% higher thanthat in 2009.
In January 2011 only, the cargo volume was almost 300,000 mt, representing a 24% YoY growth.
Historically, high season occurs from March to October, so some seasonality in results will occur.
We e e t o iti e y e ie a o t Ba ia Ba o o a d ou 50% o ed Tho e e (I do hi a) S AWe expect positive synergies amongst Baria, Baconco and our 50% owned Thoresen (Indochina) S.A..As Baconco increases its warehousing services, Baria’s port cargo volumes can be expanded further.While Thoresen (Indochina)’s logistic capacity and shipping agency services will also be benefited.
33 ‐ TTA 1Q FY2011 Earnings Results
AgendaAge a
I. 1Q FY 2011 Financial HighlightsI. 1Q FY 2011 Financial Highlights
II. Transport Group• Key Drivers• Key Drivers
• Business Outlook & Strategies
III. Energy Group• Key Drivers
• Business Outlook & Strategies
IV Infrastructure GroupIV. Infrastructure Group• Key Drivers
• Business Outlook & Strategies
V. Capital Structure & Investments
VI. Q & A
34 ‐ TTA 1Q FY2011 Earnings Results
Capital Structureapi a u u e
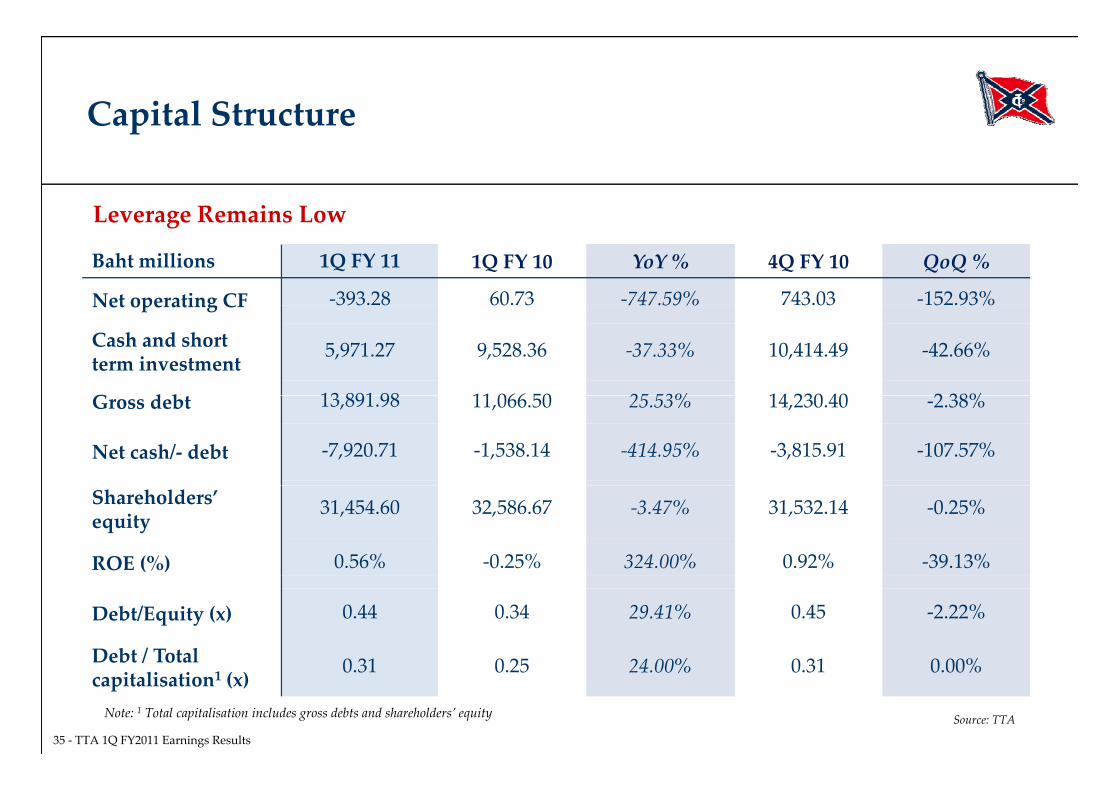
Leverage Remains Low
Baht millions 1Q FY 11 1Q FY 10 YoY % 4Q FY 10 QoQ %
Net operating CF ‐393.28 60.73 ‐747.59% 743.03 ‐152.93%
Leverage Remains Low
Net operating CF
Cash and short term investment
5,971.27 9,528.36 ‐37.33% 10,414.49 ‐42.66%
G d b 13 891 98 11 066 50 25 53% 14 230 40 2 38%Gross debt 13,891.98 11,066.50 25.53% 14,230.40 ‐2.38%
Net cash/‐ debt ‐7,920.71 ‐1,538.14 ‐414.95% ‐3,815.91 ‐107.57%
Shareholders’ equity
31,454.60 32,586.67 ‐3.47% 31,532.14 ‐0.25%
ROE (%) 0.56% ‐0.25% 324.00% 0.92% ‐39.13%
Debt/Equity (x) 0.44 0.34 29.41% 0.45 ‐2.22%
Debt / Total 0 31 0 25 24 00% 0 31 0 00%
35 ‐ TTA 1Q FY2011 Earnings Results
capitalisation1 (x)0.31 0.25 24.00% 0.31 0.00%
Note: 1 Total capitalisation includes gross debts and shareholders’ equity Source: TTA
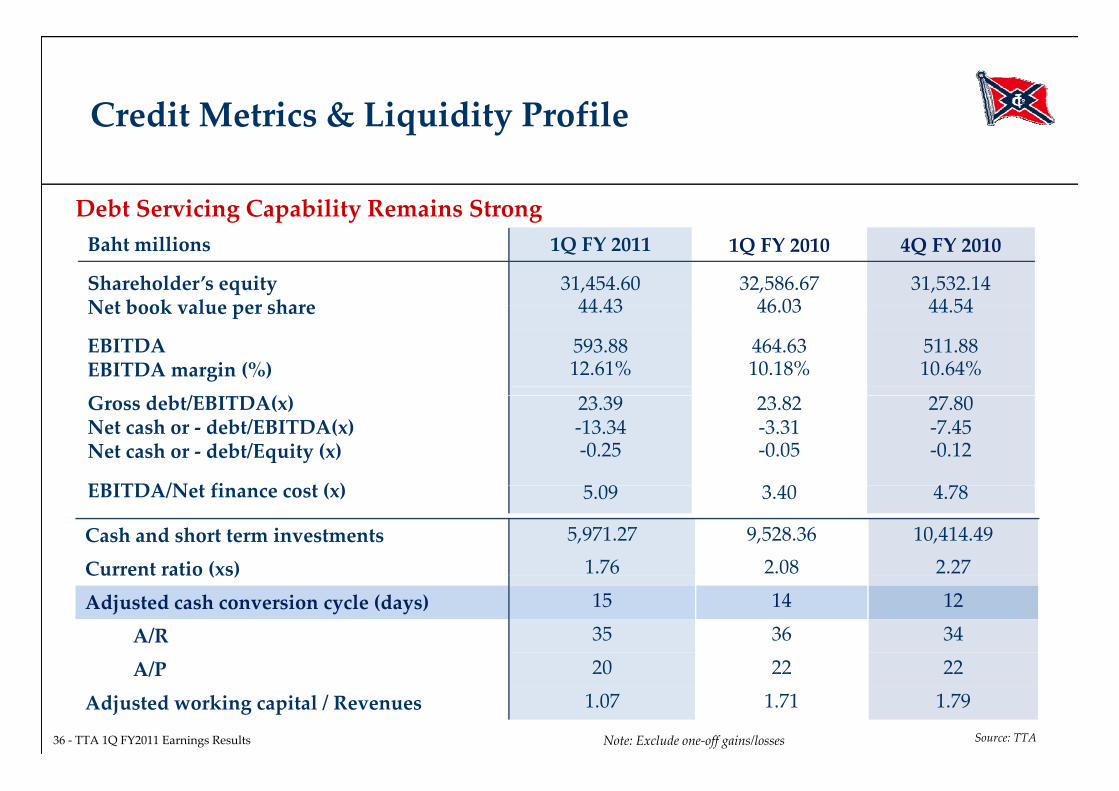
Credit Metrics & Liquidity ProfileCredit Metrics & Liquidity Profile
Debt Servicing Capability Remains StrongBaht millions 1Q FY 2011 1Q FY 2010 4Q FY 2010
Shareholder’s equityNet book value per share
31,454.6044 43
32,586.6746 03
31,532.1444 54
Debt Servicing Capability Remains Strong
Net book value per share 44.43 46.03 44.54
EBITDAEBITDA margin (%)
593.8812.61%
464.6310.18%
511.8810.64%
d b /E I A( )Gross debt/EBITDA(x)Net cash or ‐ debt/EBITDA(x)Net cash or ‐ debt/Equity (x)
23.39‐13.34‐0.25
23.82‐3.31‐0.05
27.80‐7.45‐0.12
EBITDA/N t fi t ( ) 5 09 3 40 4 78EBITDA/Net finance cost (x) 5.09 3.40 4.78
Cash and short term investments 5,971.27 9,528.36 10,414.49
Current ratio (xs) 1.76 2.08 2.27Current ratio (xs)Adjusted cash conversion cycle (days) 15 14 12
A/R 35 36 34
A/P 20 22 22
36 ‐ TTA 1Q FY2011 Earnings Results Note: Exclude one‐off gains/losses Source: TTA
A/P 20 22 22
Adjusted working capital / Revenues 1.07 1.71 1.79
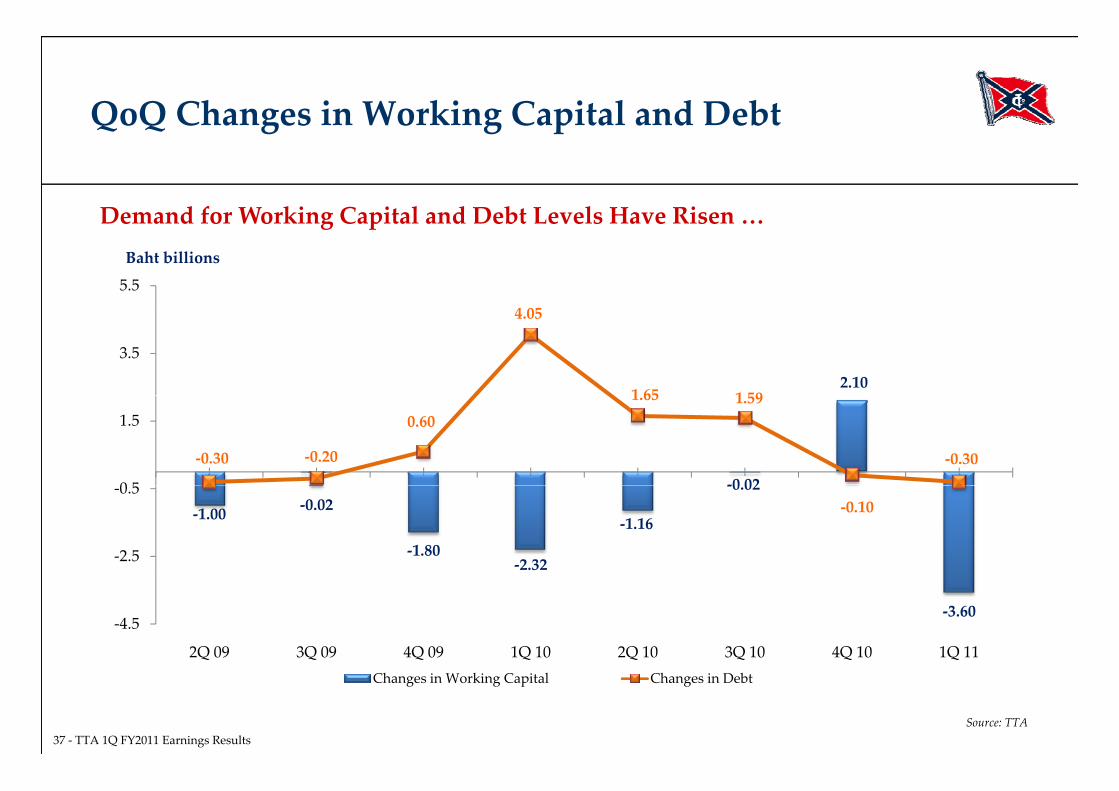
QoQ Changes in Working Capital and DebtQoQ a ge i o i g api a a e
Demand for Working Capital and Debt Levels Have Risen
5.5
Baht billions
Demand for Working Capital and Debt Levels Have Risen …
2.10
4.05
1 65 1 59
3.5
‐0 02‐0.30 ‐0.20
0.601.65 1.59
‐0.30
0 5
1.5
‐1.00 ‐0.02
‐1.80‐2.32
‐1.16
‐0.02‐0.10
‐2.5
‐0.5
‐3.60‐4.5
2Q 09 3Q 09 4Q 09 1Q 10 2Q 10 3Q 10 4Q 10 1Q 11
37 ‐ TTA 1Q FY2011 Earnings Results
Changes in Working Capital Changes in Debt
Source: TTA
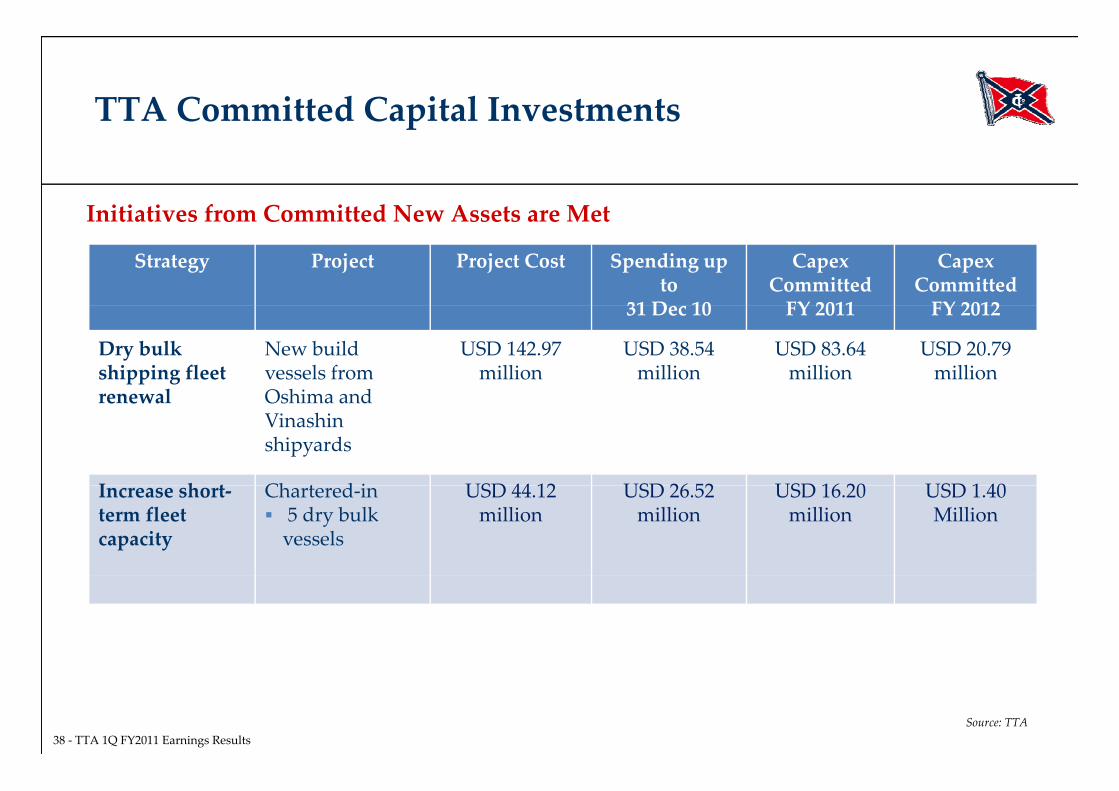
TTA Committed Capital Investmentsp
Initiatives from Committed New Assets are Met
Strategy Project Project Cost Spending up to
31 Dec 10
Capex Committed FY 2011
Capex Committed FY 2012
Initiatives from Committed New Assets are Met
31 Dec 10 FY 2011 FY 2012
Dry bulk shipping fleet renewal
New build vessels from Oshima and
USD 142.97 million
USD 38.54 million
USD 83.64million
USD 20.79 million
renewal Oshima and Vinashin shipyards
I h t Ch t d i USD 44 12 USD 26 52 USD 16 20 USD 1 40Increase short‐term fleet capacity
Chartered‐in 5 dry bulk vessels
USD 44.12million
USD 26.52 million
USD 16.20million
USD 1.40Million
38 ‐ TTA 1Q FY2011 Earnings ResultsSource: TTA
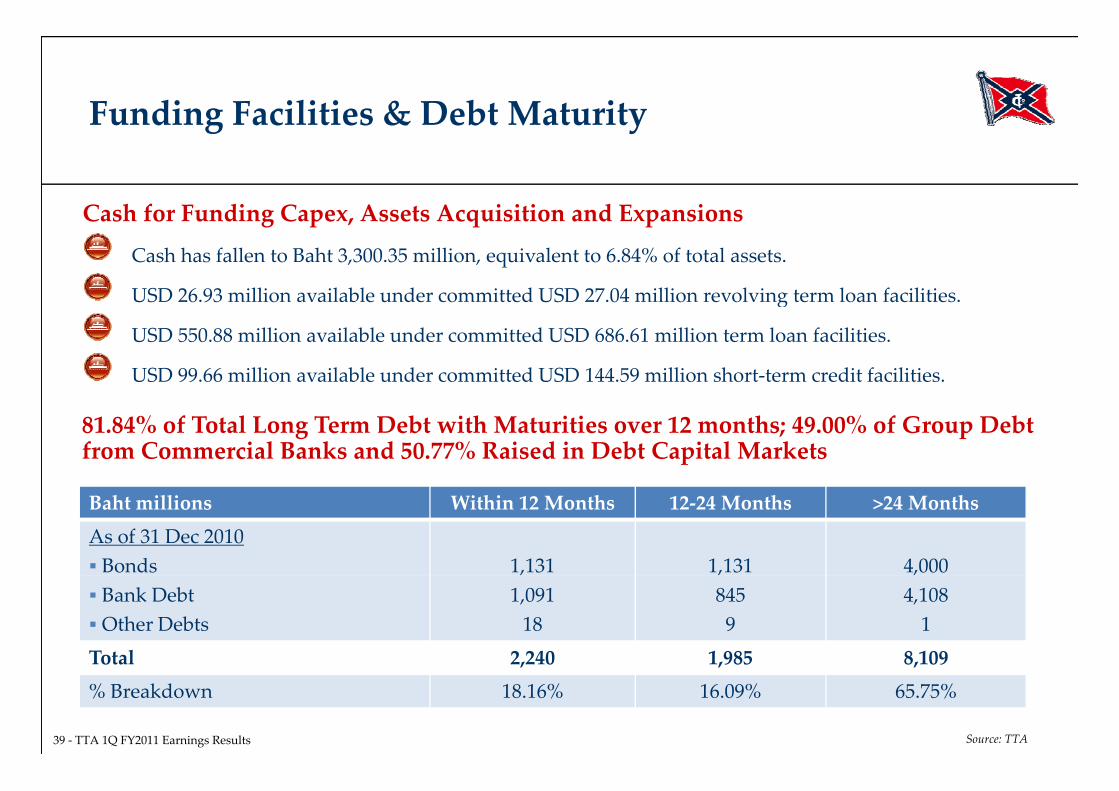
Funding Facilities & Debt Maturityg y
Cash for Funding Capex Assets Acquisition and Expansions
Cash has fallen to Baht 3,300.35 million, equivalent to 6.84% of total assets.
USD 26.93 million available under committed USD 27.04 million revolving term loan facilities.
Cash for Funding Capex, Assets Acquisition and Expansions
g
USD 550.88 million available under committed USD 686.61 million term loan facilities.
USD 99.66 million available under committed USD 144.59 million short‐term credit facilities.
81.84% of Total Long Term Debt with Maturities over 12 months; 49.00% of Group Debt from Commercial Banks and 50.77% Raised in Debt Capital Markets
Baht millions Within 12 Months 12‐24 Months >24 MonthsAs of 31 Dec 2010 Bonds 1,131 1,131 4,000 Bank Debt Other Debts
,1,09118
,8459
,4,1081
Total 2,240 1,985 8,109
39 ‐ TTA 1Q FY2011 Earnings Results
o a , , ,% Breakdown 18.16% 16.09% 65.75%
Source: TTA
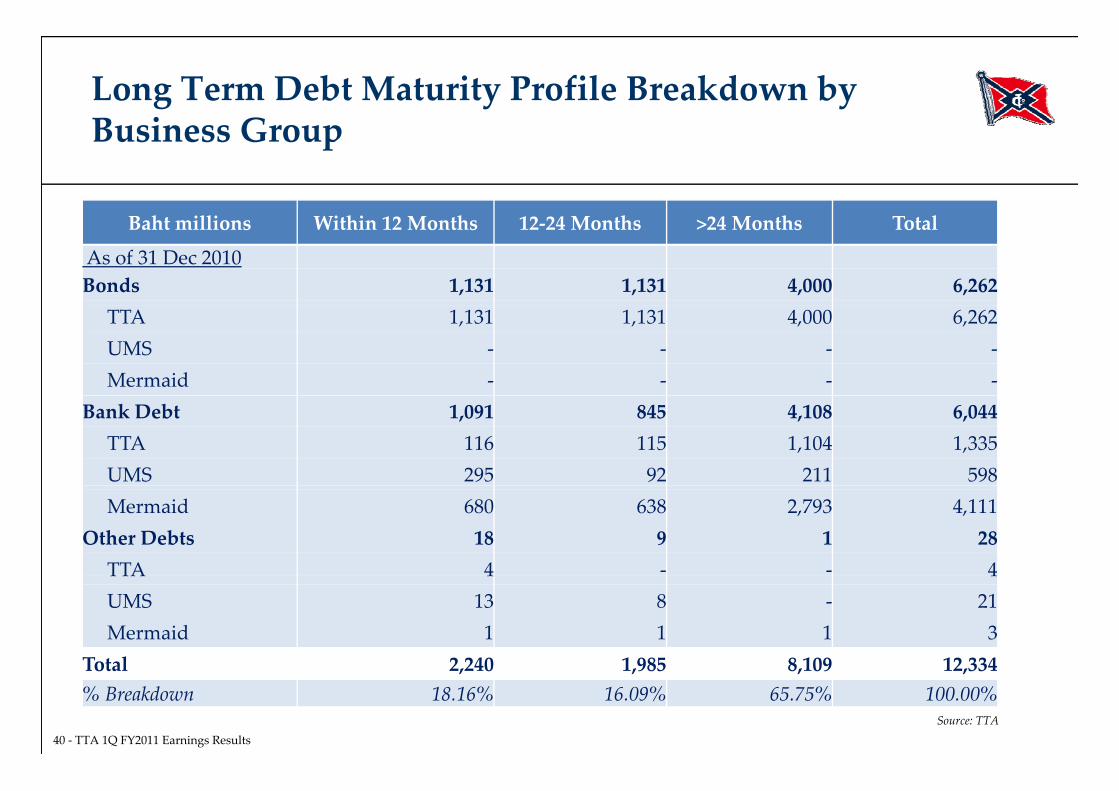
Long Term Debt Maturity Profile Breakdown by Business GroupBusiness Group
B h illi Wi hi M h M h M h T lBaht millions Within 12 Months 12‐24 Months >24 Months Total
As of 31 Dec 2010 Bonds 1,131 1,131 4,000 6,262
TTA 1,131 1,131 4,000 6,262 UMS ‐ ‐ ‐ ‐Mermaid ‐ ‐ ‐ ‐
Bank Debt 1,091 845 4,108 6,044 TTA 116 115 1,104 1,335UMS 295 92 211 598Mermaid 680 638 2,793 4,111
Other Debts 18 9 1 28TTA 4 ‐ ‐ 4TTA 4 4UMS 13 8 ‐ 21Mermaid 1 1 1 3
Total 2 240 1 985 8 109 12 334
40 ‐ TTA 1Q FY2011 Earnings Results
Total 2,240 1,985 8,109 12,334% Breakdown 18.16% 16.09% 65.75% 100.00%
Source: TTA
AgendaAge a
I. 1Q FY 2011 Financial HighlightsI. 1Q FY 2011 Financial Highlights
II. Transport Group• Key Drivers• Key Drivers
• Business Outlook & Strategies
III. Energy Group• Key Drivers
• Business Outlook & Strategies
IV Infrastructure GroupIV. Infrastructure Group• Key Drivers
• Business Outlook & Strategies
V. Capital Structure & Investments
VI. Q & A
41 ‐ TTA 1Q FY2011 Earnings Results