Embed Size (px)
Citation preview

PRELIMINARY – SUBJECT TO CHANGEPRELIMINARY ADMINISTRATIVE DRAFT DECEMBER 2013 25-1 NORTH-OF-THE-DELTA OFFSTREAM STORAGE PROJECT EIR/EISWBG020812033556SAC/433094/ (25-GHG_CC_PRELIM_ADMIN_DRAFT_DEC2013.DOCX)
25. Climate Change and Greenhouse Gas Emissions
25.1 Introduction
This chapter includes (1) an environmental setting/affected environment for greenhouse gases and climate
change, (2) a GHG impact analysis of the potential environmental effects of GHGs emitted by
construction, operation, and maintenance of the proposed Project, and (3) a climate change sensitivity
analysis of the projected changes in future climate and its expected effects on the proposed Project, as
well as the environmental effects on climate from the proposed Project.
The GHG impact analysis and climate change sensitivity analysis presented in this chapter provide
two related analyses of the proposed Project. The greenhouse gas emissions portion of this chapter is
presented first, and focuses on the effect of the proposed Project’s alternatives on climate change,
including an evaluation of greenhouse gases produced as a result of implementation of the proposed
Project alternatives. The impact analysis provides the analysis required by CEQA (CEQA Guidelines
§15064.4) to determine whether the proposed Project would have an adverse impact on the environment
by emitting GHGs that could contribute to further global climate change.
The regulatory setting for GHG emissions and climate change is discussed briefly in this chapter, and is
presented in greater detail in Chapter 4 Environmental Compliance and Permit Summary.
The existing and potential changes in water operations, power generation, and pumping in the Extended
and Secondary study areas as a result of construction, operation, and maintenance of the proposed Project
were evaluated, and the associated changes in GHG emissions were estimated. GHG emissions are not
directly linked to specific impacts at geographic locations; instead, emissions from individual sources
around the globe, including those potential sources of emissions described as part of the proposed Project,
result in contributions to global GHG concentrations in the atmosphere, which may result in impacts that
manifest themselves at global, regional, and local scales. As a result, this chapter is not separated into
analyses of the Extended, Secondary, and Primary study areas. Instead, GHG emissions were analyzed for
the proposed Project in terms of short-term construction emissions and long-term operational and
maintenance emissions. GHG emissions from implementation of the proposed Project were analyzed as a
cumulative environmental impact; therefore, GHG emissions from the proposed Project have been placed
in the context of the statewide, national, and global GHG emissions and global atmospheric
concentrations of GHGs.
GHG emissions from the proposed Project are not tied directly to potential impacts of climate change.
Instead, GHG emissions from the proposed Project and potential impacts of climate change on the
proposed Project are handled separately.
The climate change sensitivity analysis provides an analysis of how projected future climate change could
impact the performance and environmental impacts of the proposed Project with a focus on water
resources and related systems. The climate change sensitivity analysis provides a discussion of the
potential effects of climate change on the proposed Project alternatives, including the No Project/No
Action Alternative and Alternatives A, B, and C.
25.2 Background
Climate is the average of conditions (based on averages of 20 to 30 years) of temperature, seasonality,
precipitation, humidity, and types and frequency of extreme events, such as tornadoes or heat waves. For
This document is not released as a draft EIR pursuant to CEQA Guidelines § 15087. As such, DWR is not soliciting and will not respond to commentssubmitted on this document, although any comments received will be retained and may be considered during preparation of a future draft EIR.
Chapter 25: Climate Change and Greenhouse Gas Emissions
PRELIMINARY – SUBJECT TO CHANGENORTH-OF-THE-DELTA OFFSTREAM STORAGE PROJECT EIR/EIS 25-2 PRELIMINARY ADMINISTRATIVE DRAFT DECEMBER 2013
WBG020812033556SAC/433094/ (25-GHG_CC_PRELIM_ADMIN_DRAFT_DEC2013.DOCX)
example, the climate of California’s Central Valley is a Mediterranean climate, which is hot and dry
during the summer and cool and damp in winter, with the majority of precipitation falling as rain in the
winter months and tornadoes rarely occurring. Climate is unique to a particular location and changes on
timescales of decades to centuries or millennia.
Climate change is a term used to describe large-scale shifts in existing (i.e., historically observed) patterns
in Earth’s climate system. Although the climate can and has changed in the past in response to natural
drivers, recent climate change has been unequivocally linked to increasing concentrations of greenhouse
gases (GHGs) in Earth’s lower atmosphere and the rapid timescale on which these gases have
accumulated (IPCC, 2007a). The major causes of this rapid loading of GHGs into the atmosphere include
the burning of fossil fuels since the industrial revolution, agricultural practices, increases in livestock
grazing, and deforestation.
The phenomenon known as the greenhouse effect keeps the atmosphere near the Earth’s surface warm
enough for the successful habitation of humans and other life forms. GHGs present in the Earth’s lower
atmosphere play a critical role in maintaining the Earth’s temperature; GHGs trap some of the long-wave
infrared radiation emitted from the Earth’s surface that would otherwise escape to space (Figure 25-1).
The Kyoto Protocol, which was adopted in December 1997, addresses the following six GHGs: carbon
dioxide (CO2), methane (CH4), nitrous oxide (N2O), perfluorinated carbons (PFCs), sulfur hexafluoride
(SF6), and hydrofluorocarbons (HFCs). CEQA Guidelines §15364.5 also identifies these six gases as
GHGs.
Higher concentrations of heat-trapping GHGs in the atmosphere result in increasing global surface
temperatures, a phenomenon commonly referred to as global warming. Higher global surface
temperatures, in turn, result in changes to Earth’s climate system, including, but not limited to: the jet
stream; El Niño; the Indian monsoon; ocean temperature and acidity; the extent of alpine glaciers, sea ice
and polar ice sheets; the extent of deserts; atmospheric water content; and the extent and health of boreal
and tropical forests (IPCC, 2007a, 2007b).
The Intergovernmental Panel on Climate Change (IPCC) has been established by the World
Meteorological Organization and United Nations Environment Programme to assess scientific, technical,
and socioeconomic information relevant to the understanding of climate change, its potential impacts, and
options for adaptation and mitigation. The IPCC is an organization of more than 800 scientists from
around the world. It regularly publishes summary documents that analyze and consolidate all recent peer-
reviewed scientific literature, providing a consensus of the state of the science. Thus, IPCC is viewed by
governments, policymakers, and scientists as the leading international body on the science of climate
change, and its summaries are considered to be the best available science. IPCC documents address
change at the global and super-regional scales. Both IPCC studies and California-specific studies
(e.g., California Air Resources Board [ARB], California Energy Commission [CEC], DWR, California
Natural Resources Agency [CNRA], and U.S. Bureau of Reclamation [Reclamation]) that are based on
IPCC data are referenced throughout this chapter.
The IPCC estimates that the average global temperature rise between the years 2000 and 2100 could
range from 1.1°C, with no increase in GHG emissions above year 2000 levels, to 6.4°C, with substantial
increase in GHG emissions (IPCC, 2007a). Large increases in global temperatures could have substantial
adverse effects on the natural and human environments on the planet and in California.
This document is not released as a draft EIR pursuant to CEQA Guidelines § 15087. As such, DWR is not soliciting and will not respond to commentssubmitted on this document, although any comments received will be retained and may be considered during preparation of a future draft EIR.

Chapter 25: Climate Change and Greenhouse Gas Emissions
PRELIMINARY – SUBJECT TO CHANGEPRELIMINARY ADMINISTRATIVE DRAFT DECEMBER 2013 25-3 NORTH-OF-THE-DELTA OFFSTREAM STORAGE PROJECT EIR/EISWBG020812033556SAC/433094/ (25-GHG_CC_PRELIM_ADMIN_DRAFT_DEC2013.DOCX)
25.3 Regulatory Setting
GHGs are evaluated and regulated at the federal, State, and local levels. In addition, climate change
vulnerability assessment and adaptation and resiliency planning are encouraged (although not regulated or
required) at the federal, State, and local levels. Provided below is a list of the applicable climate change
and GHG laws, policies, guidance, and plans. These are discussed in detail in Chapter 4 Environmental
Compliance and Permit Summary of this DEIR/EIS.
25.3.1 Federal Plans, Policies, and Regulations
Draft National Environmental Policy Act Guidance on Consideration of the Effects of Climate
Change and Greenhouse Gas Emissions (February 2010)
Greenhouse Gas Reporting (Rule, January 2010)
Endangerment and Cause or Contribute Findings for Greenhouse Gases Under Section 202(a) of the
Clean Air Act (January 2010)
25.3.2 State Plans, Policies, and Regulations
California Environmental Quality Act Guidelines Senate Bill 97 (2007) Governor’s Office of Planning and Research Technical Advisory on CEQA and Climate Change (2008) Executive Order S-3-05 (2005) California Renewables Portfolio Standard Program Assembly Bill 32 (California Global Warming Solutions Act of 2006) Senate Bill 1368 Executive Order S-01-07 (2007) Executive Order S-13-08 (2008) Senate Bill 1771 Climate Change Scoping Plan (2008) California Climate Change Adaptation Strategy (2009) California Cap and Trade Program Climate Action Plan Phase 1: Greenhouse Gas Emissions Reduction Plan
California Air Pollution Control Officers Association Guidance Documents on Addressing GHGs
under CEQA (2008) and Quantifying GHG Mitigation Measures (2010)
25.3.3 Regional and Local Plans, Policies, and Regulations
Regional and Local Air District Programs
County General Plans
All of the above laws, policies, guidance, and plans show California’s commitment to reducing GHG
emissions and climate change planning and will have important influences on current and future
development patterns, behavior, and investments. With respect to the regulation of GHG emissions,
California law is already more stringent than federal law, therefore, California entities that meet State
level requirements will also comply with federal regulations at this time. California’s key GHG
regulation, AB 32, and the regulations and GHG emissions reduction programs that are in place to
achieve the goals of AB 32, provide the regulatory framework under which all current and future projects
will proceed and the GHG emissions restrictions with which projects will have to comply.
This document is not released as a draft EIR pursuant to CEQA Guidelines § 15087. As such, DWR is not soliciting and will not respond to commentssubmitted on this document, although any comments received will be retained and may be considered during preparation of a future draft EIR.

Chapter 25: Climate Change and Greenhouse Gas Emissions
PRELIMINARY – SUBJECT TO CHANGENORTH-OF-THE-DELTA OFFSTREAM STORAGE PROJECT EIR/EIS 25-4 PRELIMINARY ADMINISTRATIVE DRAFT DECEMBER 2013
WBG020812033556SAC/433094/ (25-GHG_CC_PRELIM_ADMIN_DRAFT_DEC2013.DOCX)
25.4 Greenhouse Gas Emissions
25.4.1 Environmental Setting/Affected Environment
25.4.1.1 Global GHG Emissions
Global GHG emissions due to human activities have increased since pre-industrial times, with an increase
of 70 percent occurring between 1970 and 2004. Carbon dioxide (CO2) is the most important
anthropogenic GHG. Its annual emissions grew by approximately 80 percent between 1970 and 2004. An
estimated 49 billion metric tons of CO2 equivalent (CO2e) per year were emitted by global anthropogenic
sources in 2004 (IPCC, 2007a).
Global atmospheric concentrations of CO2, CH4, and N2O have increased markedly as a result of human
activities since 1750, and now far exceed pre-industrial values determined from ice cores spanning many
thousands of years. Atmospheric concentrations of CO2 (379 parts per million) and CH4 (1,774 parts per
billion) in 2005 exceed by far the natural range over the last 650,000 years. Global increases in CO2
concentrations are due primarily to fossil fuel use, with land use change providing another significant, but
smaller, contribution (IPCC, 2007a).
25.4.1.2 Principal GHG Emissions that Would be Generated by the Proposed Project
The primary GHGs that would be generated by the proposed Project are CO2, CH4, N2O, and SF6. Each of
these gases is discussed below. Note that PFCs and HFCs are not discussed because these gases are
primarily generated by industrial processes, which are not anticipated as part of the proposed Project.
To simplify reporting and analysis, methods have been set forth to describe emissions of GHGs in terms
of a single gas. The most commonly accepted method to compare GHG emissions is the global warming
potential (GWP) methodology defined in the IPCC reference documents (IPCC, 1996, 2001). The IPCC
defines the GWP of various GHG emissions on a normalized scale that recasts all GHG emissions in
terms of CO2e, which compares the gas in question to that of the same mass of CO2 (CO2 has a global
warming potential of one by definition).
Table 25-1 lists the global warming potential of CO2, CH4, N2O, and SF6; their lifetimes; and abundances
in the atmosphere in parts per trillion.
Table 25-1Lifetimes and Global Warming Potential of Several Greenhouse Gases
Greenhouse GasGlobal Warming Potential
(100 Years)Lifetime(Years)
1998 Atmospheric Abundance(ppt)*
Carbon dioxide (CO2) 1 50 to 200 365,000,000
Methane (CH4) 21 9 to 15 1,745
Nitrous oxide (N2O) 310 120 314
Sulfur hexafluoride (SF6) 23,900 5.6 3,200
*ppt = parts per trillion; 1 ppt is a mixing ratio unit indicating the concentration of a pollutant in ppt by volume.
Source: IPCC, 1996, 2001.
Carbon Dioxide
CO2 is the most important anthropogenic GHG and accounts for more than 75 percent of all
GHG emissions caused by humans. Its atmospheric lifetime of 50 to 200 years ensures that atmospheric
concentrations of CO2 will remain elevated for decades even after mitigation efforts to reduce
This document is not released as a draft EIR pursuant to CEQA Guidelines § 15087. As such, DWR is not soliciting and will not respond to commentssubmitted on this document, although any comments received will be retained and may be considered during preparation of a future draft EIR.

Chapter 25: Climate Change and Greenhouse Gas Emissions
PRELIMINARY – SUBJECT TO CHANGEPRELIMINARY ADMINISTRATIVE DRAFT DECEMBER 2013 25-5 NORTH-OF-THE-DELTA OFFSTREAM STORAGE PROJECT EIR/EISWBG020812033556SAC/433094/ (25-GHG_CC_PRELIM_ADMIN_DRAFT_DEC2013.DOCX)
GHG concentrations are promulgated (IPCC, 2007a). The primary sources of anthropogenic CO2 in the
atmosphere include the burning of fossil fuels (including motor vehicles), gas flaring, cement production,
and land use changes (including deforestation).
Methane
CH4, the main component of natural gas, is the second most abundant GHG and has a GWP of
21 (IPCC, 1996). Sources of anthropogenic emissions of CH4 include growing rice, raising cattle, combusting
natural gas, landfill off-gassing, and mining coal (NOAA, 2005). Atmospheric CH4 has increased from a pre-
industrial concentration of 715 parts per billion to 1,774 parts per billion in 2005 (IPCC, 2007b).
Nitrous Oxide
N2O is a powerful GHG, with a GWP of 310 (IPCC, 1996). Anthropogenic sources of N2O include agricultural
processes (e.g., fertilizer application), nylon production, fuel-fired power plants, nitric acid production, and
vehicle emissions. N2O also is used in rocket engines, race cars, and as an aerosol spray propellant. In the
United States, more than 70 percent of N2O emissions are related to agricultural soil management practices,
particularly fertilizer application. N2O concentrations in the atmosphere have increased 18 percent from pre-
industrial levels of 270 parts per billion to 319 parts per billion in 2005 (IPCC, 2007b).
Sulfur Hexafluoride
SF6, a human-made chemical, is used as an electrical insulating fluid for power distribution equipment, in
the magnesium industry, in semiconductor manufacturing, and also as a tracer chemical for the study of
oceanic and atmospheric processes (USEPA, 2013). In 2005, atmospheric concentrations of SF6 were
5.6 parts per billion and steadily increasing in the atmosphere. SF6 is the most powerful of all GHGs listed
in IPCC studies, with a GWP of 23,900 (IPCC, 1996).
25.4.1.3 GHG Emissions Inventories
A GHG inventory is a quantification of all GHG emissions and sinks within a selected physical and/or
economic boundary. GHG inventories can be performed on a large scale (i.e., for global and national
entities) or on a small scale (i.e., for a particular building or person). Although many processes are
difficult to evaluate, several agencies have developed tools to quantify emissions from certain sources.
Table 25-2 outlines the most recent global, national, and Statewide GHG inventories to provide context of
the magnitude of potential proposed Project-related emissions.
Table 25-2Global, National, and Statewide Annual GHG Emissions Inventories
Emissions InventoryCO2e
(Metric Tons)
2004 IPCC Global GHG Emissions Inventory 49,000,000,000
2011 USEPA National GHG Emissions Inventory 5,797,300,000
2011 ARB State GHG Emissions Inventory 448,110,000
Notes:
ARB = California Air Resources BoardCO2e = carbon dioxide equivalentGHG = greenhouse gasIPCC = Intergovernmental Panel on Climate ChangeUSEPA = U.S. Environmental Protection Agency
Source: IPCC, 2007a; USEPA, 2013; ARB, 2013.
This document is not released as a draft EIR pursuant to CEQA Guidelines § 15087. As such, DWR is not soliciting and will not respond to commentssubmitted on this document, although any comments received will be retained and may be considered during preparation of a future draft EIR.

Chapter 25: Climate Change and Greenhouse Gas Emissions
PRELIMINARY – SUBJECT TO CHANGENORTH-OF-THE-DELTA OFFSTREAM STORAGE PROJECT EIR/EIS 25-6 PRELIMINARY ADMINISTRATIVE DRAFT DECEMBER 2013
WBG020812033556SAC/433094/ (25-GHG_CC_PRELIM_ADMIN_DRAFT_DEC2013.DOCX)
25.4.2 Environmental Impacts/Environmental Consequences
25.4.2.1 Proposed Project Greenhouse Gas Emissions Analysis
Evaluation Criteria and Thresholds of Significance
Significance criteria represent the environmental thresholds that were used to identify whether an impact
would be significant. CEQA Guidelines §15064.4 indicates:
(a) The determination of the significance of greenhouse gas emissions calls for a careful judgment by theLead Agency consistent with the provisions in §15064. A Lead Agency should make a good faitheffort, based to the extent possible on scientific and factual data, to describe, calculate, or estimate theamount of greenhouse gas emissions resulting from a project. A Lead Agency shall have discretion todetermine, in the context of a particular project, whether to:
(1) Use a model or methodology to quantify greenhouse gas emissions resulting from a project,and which model or methodology to use. The Lead Agency has discretion to select the modelor methodology it considers most appropriate provided it supports its decision with substantialevidence. The Lead Agency should explain the limitations of the particular model ormethodology selected for use; and/or
(2) Rely on a qualitative analysis or performance-based standards.
(b) A Lead Agency should consider the following factors, among others, when assessing the significanceof impacts from greenhouse gas emissions on the environment:
(1) The extent to which the project may increase or reduce greenhouse gas emissions as comparedto the existing environmental setting.
(2) Whether the project emissions exceed a threshold of significance that the Lead Agencydetermines applies to the project.
(3) The extent to which the project complies with regulations or requirements adopted toimplement a statewide, regional, or local plan for the reduction or mitigation of greenhousegas emissions. Such requirements must be adopted by the relevant public agency through apublic review process and must reduce or mitigate the project’s incremental contribution ofgreenhouse gas emissions. If there is substantial evidence that the possible effects of aparticular project are still cumulatively considerable notwithstanding compliance with theadopted regulations or requirements, an EIR must be prepared for the project.
For the purposes of this analysis, an alternative would result in a significant impact if it would result in
the following:
Generation of Cumulative GHG Emissions
Neither the CEQA nor NEPA Lead Agencies have established quantitative significance thresholds for GHG
emissions; instead the proposed Project is evaluated on a case-by-case basis using up-to-date calculation and
analysis methods. By enacting the Global Warming Solutions Act of 2006 (AB 32), the State Legislature has
established statewide GHG emissions reduction targets. Further, the Legislature has determined that GHG
emissions, as they relate to global climate change, are a source of adverse environmental impacts in California
and should be addressed pursuant to CEQA. AB 32 did not amend CEQA, although the legislation identifies
the myriad environmental problems in California caused by global warming (Health and Safety Code, Section
38501(a)). SB 97, in contrast, added explicit requirements that CEQA analysis address the impacts of GHG
emissions (PRC Sections 21083.05 and 21097).
This document is not released as a draft EIR pursuant to CEQA Guidelines § 15087. As such, DWR is not soliciting and will not respond to commentssubmitted on this document, although any comments received will be retained and may be considered during preparation of a future draft EIR.

Chapter 25: Climate Change and Greenhouse Gas Emissions
PRELIMINARY – SUBJECT TO CHANGEPRELIMINARY ADMINISTRATIVE DRAFT DECEMBER 2013 25-7 NORTH-OF-THE-DELTA OFFSTREAM STORAGE PROJECT EIR/EISWBG020812033556SAC/433094/ (25-GHG_CC_PRELIM_ADMIN_DRAFT_DEC2013.DOCX)
With respect to significance thresholds established for GHG emissions, no State or federal agency with
jurisdiction over the NEPA or CEQA Lead Agencies has established a significance threshold that would
apply to the proposed Project. Many regional air pollution control districts have established GHG
emissions significance thresholds for CEQA purposes. However, these thresholds apply to only stationary
sources, such as power plants or factories or to residential or commercial developments. Because the
proposed Project is neither a stationary source, nor a residential or commercial development, these
thresholds of significance would not apply.
Scientific studies (as best represented by the IPCC’s periodic reports) demonstrate that climate change is
already occurring due to past GHG emissions. Evidence suggests that global emissions must be reduced
below current levels to avoid the most severe climate change impacts. Given the seriousness of climate
change and the regional significance of the proposed Project, the proposed Project Lead Agencies have
determined that, for the purposes of the proposed Project, any substantial increase in GHG emissions
above net zero (0) would result in a significant impact. A net zero threshold represents the most
conservative assessment of emissions. Proposed Project Lead Agencies have selected a net zero threshold
to be cautious and to avoid under-representing potential impacts.
In accordance with scientific consensus regarding the cumulative nature of GHGs, the analysis provides a
cumulative evaluation of GHG emissions. Unlike traditional cumulative impact assessments, this analysis
is still project-specific in that it evaluates only direct emissions generated by the proposed Project.
Because of the global nature of GHG emissions and impacts that result from those emissions, proposed
Project emissions are placed into the context of current global atmospheric GHG concentrations and
projections of future concentrations. The analysis does not specifically analyze emissions from past,
present, and reasonably foreseeable projects in the Primary, Secondary, and Extended study areas.
Impact Assessment Assumptions and Methodology
Assumptions
The following assumptions were made regarding Project-related construction, operation, and maintenance
impacts from greenhouse gas emissions:
Direct Project-related construction, operation, and maintenance activities would occur in the Primary
Study Area.
Direct Project-related operational effects would occur in the Secondary Study Area.
The only direct Project-related construction activity that would occur in the Secondary Study Area is
the installation of an additional pump into an existing bay at the Red Bluff Pumping Plant.
The only direct Project-related maintenance activity that would occur in the Secondary Study Area is
the sediment removal and disposal at the two intake locations (i.e., Glenn-Colusa Irrigation District
[GCID] Canal Intake and Red Bluff Pumping Plant).
No direct Project-related construction or maintenance activities would occur in the Extended Study
Area.
Direct Project-related operational effects that would occur in the Extended Study Area are related to
San Luis Reservoir operation; increased reliability of water supply to agricultural, municipal, and
industrial water users; and the provision of an alternate Level 4 wildlife refuge water supply. Indirect
effects to the operation of certain facilities that are located in the Extended Study Area, and indirect
This document is not released as a draft EIR pursuant to CEQA Guidelines § 15087. As such, DWR is not soliciting and will not respond to commentssubmitted on this document, although any comments received will be retained and may be considered during preparation of a future draft EIR.

Chapter 25: Climate Change and Greenhouse Gas Emissions
PRELIMINARY – SUBJECT TO CHANGENORTH-OF-THE-DELTA OFFSTREAM STORAGE PROJECT EIR/EIS 25-8 PRELIMINARY ADMINISTRATIVE DRAFT DECEMBER 2013
WBG020812033556SAC/433094/ (25-GHG_CC_PRELIM_ADMIN_DRAFT_DEC2013.DOCX)
effects to the consequent water deliveries made by those facilities, would occur as a result of
implementing the alternatives.
No additional channel stabilization, grade control measures, or dredging in the Sacramento River at or
upstream of the proposed Delevan Pipeline Intake/Discharge facilities would be required.
Construction activities are anticipated to occur between the hours of 6:00 a.m. and 7:00 p.m. Monday
through Friday. Nighttime and weekend construction are not planned, but may occur on an as-needed
basis.
Methodology
The proposed Project was evaluated to determine how construction and operations of proposed Project
facilities would generate GHG emissions. GHG emissions associated with the proposed Project could
contribute to the cumulatively considerable impact of global climate change by adding GHGs to the
atmosphere. The discussion below reviews potential generation of GHG emissions for each of the
proposed Project’s action alternatives. For the purpose of this analysis, only changes in GHG emissions
caused by construction and operation of the proposed Project are discussed. The GHG emissions
estimated for the proposed Project’s Alternatives A, B, and C were compared to Existing Conditions (for
CEQA) and to future conditions associated with the No Project/No Action Alternative (for NEPA).
Construction-related GHG emissions would result primarily from fuel combustion in construction
equipment, trucks, and worker vehicles. To support calculations of GHG emissions, lists of the types and
numbers of construction equipment and number of days required for construction of each proposed
Project facility were developed by Project engineers, and assumptions were developed about hours of
operation for each type of equipment (Barnes pers. comm., 2011).
Equipment-specific hours of use were multiplied by equipment-specific CO2 emission factors to calculate
total equipment emissions for construction of each proposed Project facility. Total CO2 emissions for each
proposed Project facility were estimated by summing the results of the equipment emissions.
For construction, emissions of other GHGs, such as CH4 and N2O, were not estimated, due to the lack of
equipment-specific emission factors for GHGs other than CO2. Emissions of CH4 and N2O from fuel
combustion would be much lower than emissions of CO2, contributing in the range of two to four percent
of total CO2 emissions. Therefore, it was assumed that CH4 and N2O emissions would not substantially
contribute to the construction-related GHG emissions.
To estimate GHG emissions from maintenance activities, proposed Project facilities were grouped to
reflect activities, personnel, and equipment that might be shared to optimize efficiency. Emissions were
estimated for maintenance of the following proposed Project facilities:
Pumping Plants, Intake and Outlet Facilities, Pumping/Generating Plants Reservoirs, Recreation Facilities, Dams, Roads, and Bridges Electrical Switchyards and Transmission Lines
Tunnels, Pipelines, and Canals
DWR has developed estimates of the numbers and types of equipment, vehicles, and personnel needed for
maintenance of the facilities (DWR, 2011). Equipment and personnel requirements for maintenance of
facilities were assumed to be the same for proposed Project’s Alternatives A, B, and C. Maintenance
activities include both routine activities and major inspections. Routine activities would occur on a daily
basis throughout the year, whereas major inspections would occur annually. Exhaust emissions from
This document is not released as a draft EIR pursuant to CEQA Guidelines § 15087. As such, DWR is not soliciting and will not respond to commentssubmitted on this document, although any comments received will be retained and may be considered during preparation of a future draft EIR.

Chapter 25: Climate Change and Greenhouse Gas Emissions
PRELIMINARY – SUBJECT TO CHANGEPRELIMINARY ADMINISTRATIVE DRAFT DECEMBER 2013 25-9 NORTH-OF-THE-DELTA OFFSTREAM STORAGE PROJECT EIR/EISWBG020812033556SAC/433094/ (25-GHG_CC_PRELIM_ADMIN_DRAFT_DEC2013.DOCX)
equipment and vehicles were calculated using the EMFAC2011 (ARB, 2011) and CalEEMod (CAPCOA,
2013) models, respectively.
Estimating emissions from operation of the alternatives is complex and involves assumptions about the
amount and timing of pumping and generating activities, the fuel source used to power pumping
operations (fossil sources or renewable sources), and changes in the operation of existing State Water
Project (SWP) and Central Valley Project (CVP) facilities as operations of the alternatives are integrated
into the existing water delivery system and the California electrical distribution and balancing system. As
discussed in Chapter 31 Power Production and Energy and summarized below, the proposed Project’s
action alternatives would consume energy during the pumping phase of operations, would generate
electricity during the release phase of operations, and would be able to provide resource shifting and
renewable integration services during pumpback operations. In addition, the seasonal operations of the
proposed Project’s action alternatives would make them highly conducive to operations during the
pumping and generating phases that would likely result in reductions in GHG emissions.
Emissions from operation of the proposed Project’s action alternatives were estimated by post processing
the CALSIM II modeling runs used to analyze the impacts of the proposed Project’s action alternatives
throughout this document. CALSIM II provides estimates of the amount of water that would be pumped
and released at each of the facilities during each month of the year for various water year types and
hydrologic conditions. The pumping and releasing of water can be converted to electricity use and
electricity generation by applying assumptions about efficiency of each pumping or generating plant.
Chapter 31 Power Production and Energy describes assumptions of the proposed Project’s power and
energy operations, including pumpback operations and renewable integration services.
Operation of Proposed Project Alternatives
Although each of the proposed Project alternatives has different features and would operate slightly
differently, all alternatives share some commonalities among their operations that are important for
analysis of GHG emissions.
As discussed in greater detail in Chapter 31 Power Production and Energy, during winter and spring, the
proposed Project alternatives would typically function in the pumping phase when excess water flows
down the Sacramento River. This is the time of year when hydroelectric generation and wind generation
increase and demand for electricity decreases, thus much of the increased electricity load required to
pump water out of the Sacramento River and into the reservoirs could be served by renewable electricity
sources. Further, the largest electricity load from the proposed Project alternatives comes from lifting
water from the proposed Holthouse Reservoir to the proposed Sites Reservoir. The proposed Holthouse
Reservoir has been sized to accommodate a large amount of storage (up to six days of fill operations)
allowing pumping operations to move water from the proposed Holthouse Reservoir to the proposed Sites
Reservoir to occur at night or during other non-peak electricity demand periods or when renewable power
is available.
During the summer and fall, the proposed Project alternatives would typically function in the generating
phase, as water is released from the reservoirs to meet water supply and water quality objectives. This is
the time of year that electricity demand increases to satisfy summer cooling requirements. The release of
water from the proposed Sites Reservoir to the proposed Holthouse Reservoir could be timed to meet
peak daytime demand for electricity, thereby displacing the need to operate high emissions power plants.
This document is not released as a draft EIR pursuant to CEQA Guidelines § 15087. As such, DWR is not soliciting and will not respond to commentssubmitted on this document, although any comments received will be retained and may be considered during preparation of a future draft EIR.
Chapter 25: Climate Change and Greenhouse Gas Emissions
PRELIMINARY – SUBJECT TO CHANGENORTH-OF-THE-DELTA OFFSTREAM STORAGE PROJECT EIR/EIS 25-10 PRELIMINARY ADMINISTRATIVE DRAFT DECEMBER 2013
WBG020812033556SAC/433094/ (25-GHG_CC_PRELIM_ADMIN_DRAFT_DEC2013.DOCX)
During times of the year when the proposed Project is not functioning in the pumping or generating
phase, it could be operated to perform daily pumpback operations. Daily pumpback operations would
allow the proposed Project to use power from various high efficiency sources, including renewables, to
pump water from the proposed Holthouse Reservoir to the proposed Sites Reservoir typically during the
nights and other low demand periods. Then, during higher demand periods, the water could be released
back from the proposed Sites Reservoir to the proposed Holthouse Reservoir to generate electricity.
Although this operation would actually consume more electricity than is generated, the net result would
typically be reduced GHG emissions because electricity used to pump the water would be very low or
zero GHG emissions sources, such as ultra efficient baseload gas fired power plants, nuclear, or
renewable, and the generated electricity would displace the least efficient peaking power plants that emit
higher levels of GHGs.
In addition to operation of the proposed Project’s action alternatives’ facilities, the implementation of any
of the action alternatives would also result in changes to operations of existing CVP and SWP facilities
including:
Shasta Lake San Luis Reservoir Folsom Lake Trinity Lake Lake Oroville Banks Pumping Plant
Jones Pumping Plant
Changes to operations of these facilities as a result of proposed Project operations are described in
Chapter 6 Surface Water Resources.
Pumping at Banks and Jones pumping plants would likely increase because of increased water supply
reliability created by the proposed Project’s alternatives. Thus, additional electricity would be needed to
operate the facilities to accommodate integration of the proposed Project facilities and operations.
The combined results of all changes in operation of SWP and CVP facilities are described below for each
of the proposed Project’s action alternatives.
Appendix 24A provides detailed equipment and emissions tables, emissions factors, and GHG emission
calculations for proposed Project construction, operations, and maintenance activities for each of the
proposed Project’s action alternatives.
GHG Emissions Reduction Project Commitments
Consistent with the requirements of the DWR Greenhouse Gas Emissions Reduction Plan (GGERP)
(DWR, 2012a), all construction activities undertaken for the proposed Project would implement DWR’s
Construction Best Management Practices (BMPs). DWR’s Construction BMPs are included in
Appendix 25A.
In addition, as described in Chapter 3 Description of the Proposed Project/Proposed Action and
Alternatives, the proposed Project would: (1) obtain at least 20 percent of the power used for pumping
water from the Sacramento River and the proposed Holthouse Reservoir into the proposed Sites Reservoir
from wind and/or solar energy, and (2) use at least 20 percent of the proposed Project’s generated power
This document is not released as a draft EIR pursuant to CEQA Guidelines § 15087. As such, DWR is not soliciting and will not respond to commentssubmitted on this document, although any comments received will be retained and may be considered during preparation of a future draft EIR.
Chapter 25: Climate Change and Greenhouse Gas Emissions
PRELIMINARY – SUBJECT TO CHANGEPRELIMINARY ADMINISTRATIVE DRAFT DECEMBER 2013 25-11 NORTH-OF-THE-DELTA OFFSTREAM STORAGE PROJECT EIR/EISWBG020812033556SAC/433094/ (25-GHG_CC_PRELIM_ADMIN_DRAFT_DEC2013.DOCX)
and/or served pump load to provide integration services needed to firm up highly variable wind and/or
solar generation.
Topics Eliminated from Further Analytical Consideration
No Project facilities or topics that are included in the significance criteria listed above were eliminated
from further consideration in this chapter.
Impacts Associated with the No Project/No Action Alternative
Impact GHG-1: Generation of Cumulative GHG Emissions
The No Project/No Action Alternative includes implementation of projects and programs being
constructed, or those that have gained approval, as of June 2009. The impacts of these projects have
already been evaluated on a project-by-project basis, pursuant to CEQA and/or NEPA, and if these
analyses were completed in the past three years, their potential for GHG emissions impacts has been
addressed in those environmental documents.
Population growth is expected to occur in California throughout the period of Project analysis
(i.e., 100 years), and is included in the assumptions for the No Project/No Action Alternative. A larger
population could be expected to cause increases in GHG emissions from human activities. It is also
expected that improved emissions controls and lower-emitting technologies would be developed in the
future to reduce these emissions, consistent with State goals.
If the No Project/No Action Alternative is implemented, no proposed Project-related facilities would be
constructed or operated. Therefore, this alternative would have no direct Project-related construction- or
operations-related GHG emissions, when compared to Existing Conditions. In addition, no operations and
maintenance of proposed Project-related facilities would occur if the No Project/No Action Alternative is
implemented, other than the ongoing systemwide generation and use of electricity by the CVP and SWP
facilities. Therefore, there would not be a substantial adverse effect from GHG emissions, when
compared to Existing Conditions.
Impacts Associated with Alternative A
Impact GHG-1: Generation of Cumulative GHG Emissions
Construction, Operation, and Maintenance of the Proposed Project
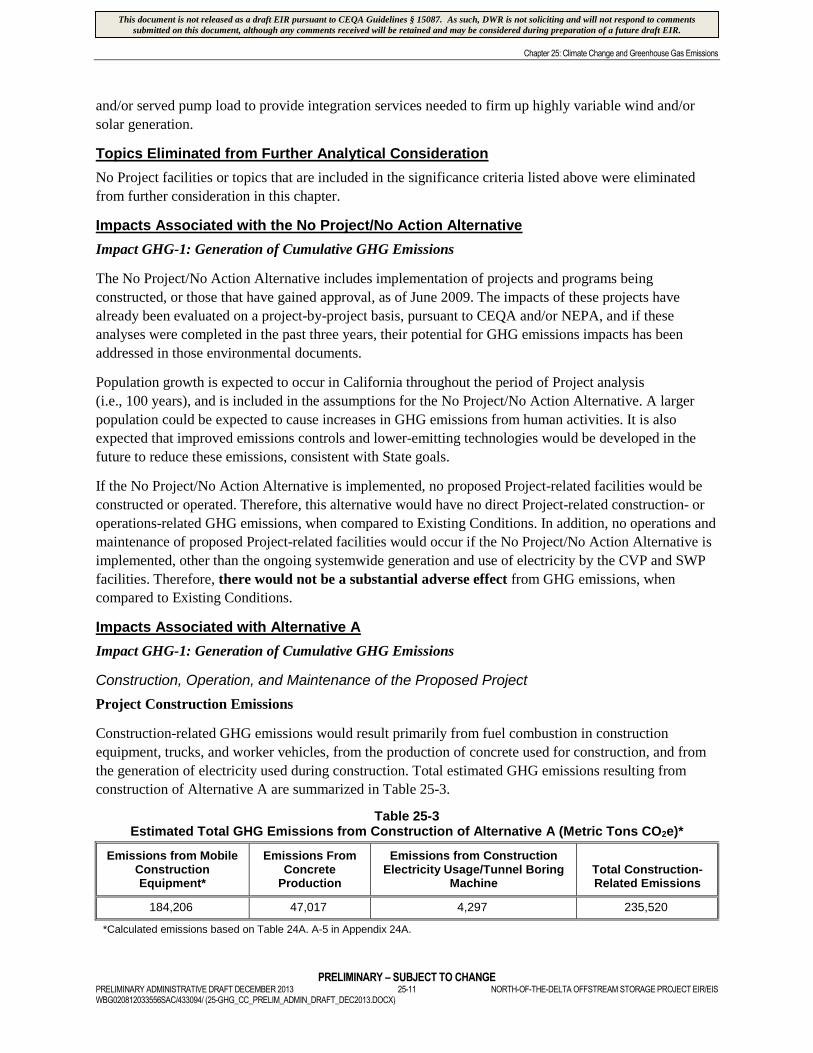
Project Construction Emissions
Construction-related GHG emissions would result primarily from fuel combustion in construction
equipment, trucks, and worker vehicles, from the production of concrete used for construction, and from
the generation of electricity used during construction. Total estimated GHG emissions resulting from
construction of Alternative A are summarized in Table 25-3.
Table 25-3Estimated Total GHG Emissions from Construction of Alternative A (Metric Tons CO2e)*
Emissions from MobileConstructionEquipment*
Emissions FromConcrete
Production
Emissions from ConstructionElectricity Usage/Tunnel Boring
MachineTotal Construction-Related Emissions
184,206 47,017 4,297 235,520
*Calculated emissions based on Table 24A. A-5 in Appendix 24A.
This document is not released as a draft EIR pursuant to CEQA Guidelines § 15087. As such, DWR is not soliciting and will not respond to commentssubmitted on this document, although any comments received will be retained and may be considered during preparation of a future draft EIR.

Chapter 25: Climate Change and Greenhouse Gas Emissions
PRELIMINARY – SUBJECT TO CHANGENORTH-OF-THE-DELTA OFFSTREAM STORAGE PROJECT EIR/EIS 25-12 PRELIMINARY ADMINISTRATIVE DRAFT DECEMBER 2013
WBG020812033556SAC/433094/ (25-GHG_CC_PRELIM_ADMIN_DRAFT_DEC2013.DOCX)
The GHG emissions shown in Table 25-3 are the estimated total cumulative CO2e emissions that would
occur over the nine-year construction period of Alternative A. Within the nine-year construction period,
annual GHG emissions would fluctuate. Because GHG emissions are well dispersed in the atmosphere
and persist for long periods of time (hundreds or thousands of years), estimates of emissions on a yearly
basis are less meaningful than the total amount of emissions released during the discrete construction
period. After construction is complete, emissions from these sources would cease.
Project Operation and Maintenance Emissions
Once construction is complete, the proposed Alternative A facilities would begin to operate. Unlike
construction emissions, operations emissions would occur over a long period of time, i.e., the useful life
of the proposed Project. Operation of the proposed Alternative A facilities would involve both the use and
generation of electricity, as described in Chapter 31 Power Production and Energy. The amount of GHG
emissions from operation of Alternative A would depend on the specific sources of energy used for
pumping water into the proposed reservoirs and other operational parameters. Further, electricity needed
to pump water into the reservoirs and electricity generated by releasing water from the reservoirs would
vary annually and seasonally, depending on hydrologic conditions.
As shown in Table 25-4, operation of the proposed Alternative A facilities (without consideration of
pumpback operations) would result in an estimated long-term average net generation of -90 GWh/year
(i.e., to operate the Alternative A facilities, all of the energy generated at the facilities would be needed
and an additional 90 GWh of energy would be needed from other sources).
Table 25-4Estimated Electricity Generation and Use from Operation of Alternative A Facilities without
Consideration of Pumpback Operations (GWh/Year)a
ExistingConditions
NoProject/No
ActionAlternative
AlternativeA
AlternativeA MinusExisting
Conditions
AlternativeA Minus NoProject/No
ActionAlternative
Project Facilitiesb
EnergyGeneration
Long-Termc 0 0 126 126 126
Dry and Criticald 0 0 129 129 129
Pumping EnergyUse
Long-Term 13 13 229 217 216
Dry and Critical 11 12 184 172 172
Net Generation Long-Term -13 -13 -103 -90 -90
Dry and Critical -11 -12 -54 -43 -43
aResults are estimated using the NODOS Power model using data from the CALSIM II model.bOther related Tehama-Colusa Canal and Glenn-Colusa Irrigation District Canal pumping facilities are included; this results innon-zero values for Existing Conditions and the No Project/No Action Alternative.cLong-Term is the average quantity for the calendar years 1922 to 2002.dDry and Critical is the average quantity for Dry and Critical years according to the Sacramento River 40-30-30 index.
Note:
GWH/year = gigawatt hours per year
Although operation of the proposed Alternative A facilities would result in a long-term average net use of
electricity, the way the facilities would be operated and integrated into the California electricity market
would actually result in annual reductions in GHG emissions. As discussed in Chapter 31 Power
This document is not released as a draft EIR pursuant to CEQA Guidelines § 15087. As such, DWR is not soliciting and will not respond to commentssubmitted on this document, although any comments received will be retained and may be considered during preparation of a future draft EIR.

Chapter 25: Climate Change and Greenhouse Gas Emissions
PRELIMINARY – SUBJECT TO CHANGEPRELIMINARY ADMINISTRATIVE DRAFT DECEMBER 2013 25-13 NORTH-OF-THE-DELTA OFFSTREAM STORAGE PROJECT EIR/EISWBG020812033556SAC/433094/ (25-GHG_CC_PRELIM_ADMIN_DRAFT_DEC2013.DOCX)
Production and Energy, water pumping would occur to the extent possible during times when renewable
(zero emissions) electricity is available, and releases of water, which generate electricity, would be done
to the extent possible when electricity is in high demand. Therefore, electricity generated at the proposed
Alternative A facilities – with no emission of GHGs – would offset some of the most inefficient and
highest emitting generating resources in the electricity market.
In addition to the analysis provided above, the proposed Alternative A facilities would be configured to
allow substantial pumpback operations; i.e., pumping water from the proposed Holthouse Reservoir into
the proposed Sites Reservoir during nighttime hours (when excess clean/cheap electricity is available) and
then releasing the water back from the proposed Sites Reservoir to the proposed Holthouse during peak
demand hours during the day (when the electricity generated can displace high emitting/high cost
sources).
Alternative A would also be able to provide critical renewable integration services to the California grid
that would facilitate additional renewable energy generation and further reduce GHG emissions. Solar and
wind power are intermittent electricity sources; the electricity generated at a solar or wind power station
fluctuates unpredictably as clouds obscure the sun or wind speeds decrease. To effectively integrate solar
and wind power into an electricity grid, there must be appropriate backup power supplies to ensure that
fluctuations in solar or wind generation are smoothed out so that sufficient supply exists in the grid to
meet demand. Alternative A could provide this renewable integration service. Both in the pumping and
generating phase, Alternative A would have the flexibility to modify its operations to balance generation
from intermittent renewable electricity supplies. In the pumping phase, Alternative A would have ample
storage at the proposed Holthouse Reservoir and variable speed pumps at the proposed Sites Pumping
Plant that could quickly ramp up or down so that pumping from the proposed Holthouse Reservoir to the
proposed Sites Reservoir could be slowed or delayed for up to several days to coincide with available
renewable electricity. In the generation phase, the proposed Sites Pumping Plant’s variable speed turbines
could quickly ramp up or ramp down to provide additional generation when renewable electricity
decreases or additional pumping load when renewable generation increases.
Chapter 3 Description of the Proposed Project/Proposed Action and Alternatives describes the
commitment of the proposed Project to obtain at least 20 percent of the power used for pumping water
from the Sacramento River and the proposed Holthouse Reservoir into the proposed Sites Reservoir from
wind and/or solar energy, and to use at least 20 percent of the proposed Project’s generated power and/or
served pump load to provide integration services needed to firm up highly variable wind and/or solar
generation. At this level of renewables use and renewable integration service, operational analyses
indicate that implementation of Alternative A would result in GHG emissions reductions of
approximately 22,200 metric tons of CO2e per year (Appendix 25A). This represents a very conservative
estimate of the level of renewables that would be used to operate Alternative A and the level of renewable
integration service that Alternative A could provide. If Alternative A were operated with 80 percent
renewable power for pumping and provided 20 percent of pumping load for integration services, and
100 percent of generated electricity was used for integration services, operational analyses indicate that
Alternative A would result in GHG emissions reductions of more than 138,000 metric tons of CO2e per
year. Although operations would vary each year, all of these features would contribute to reducing overall
GHG emissions from Alternative A and from the larger California electrical power grid. These two data
points represent the likely potential range of GHG emissions reductions that would result from operation
of Alternative A.
This document is not released as a draft EIR pursuant to CEQA Guidelines § 15087. As such, DWR is not soliciting and will not respond to commentssubmitted on this document, although any comments received will be retained and may be considered during preparation of a future draft EIR.

Chapter 25: Climate Change and Greenhouse Gas Emissions
PRELIMINARY – SUBJECT TO CHANGENORTH-OF-THE-DELTA OFFSTREAM STORAGE PROJECT EIR/EIS 25-14 PRELIMINARY ADMINISTRATIVE DRAFT DECEMBER 2013
WBG020812033556SAC/433094/ (25-GHG_CC_PRELIM_ADMIN_DRAFT_DEC2013.DOCX)
Maintenance of Alternative A facilities would include regular inspections, land management activities,
sediment removal from forebays, and servicing of pumping plants. Estimated emissions from
maintenance activities are detailed in Appendix 24A and would total approximately 1,500 metric tons of
CO2e per year.
As discussed in Section 25.4.1, any increase in emissions above net zero associated with Alternative A
would be adverse. Construction of Alternative A would generate approximately 236,000 metric tons of
CO2e emissions over the nine-year construction period. Once operations begin, maintenance activities
would increase GHG emissions by 1,500 metric tons of CO2e; however, operations of Alternative A
would be expected to reduce annual GHG emissions by between 22,000 and 138,000 metric tons of CO2e
per year (Appendix 25A). Thus, it would take between two and 14 years of operation to completely offset
the GHG emissions released during construction. After that time period, operation of Alternative A would
contribute to lowering California’s GHG emissions and would help California achieve its AB 32 GHG
emissions reduction goals.
Because increases in GHG emissions associated with construction of Alternative A would be more than
offset by reductions in GHG emissions from operation, there would be no long-term increase over the net-
zero threshold. Over the life of the proposed Project, Alternative A would be likely to substantially reduce
GHG emissions. Therefore, implementation of Alternative A would result in a less-than-significant
impact, when compared to Existing Conditions and the No Project/No Action Alternative.
Existing State Water Project Facilities Operational Emissions
Operation of Alternative A would result in modifications to the operations of existing SWP facilities,
including Lake Oroville and the Thermalito Complex, and pumping and generating facilities along the
California Aqueduct.
Table 25-5 shows that net generation (the amount of energy generated at hydroelectric generating
facilities minus the amount of energy used at pumping facilities) would be negative, i.e., Alternative A
operation would result in a net increase in the amount of energy needed annually to operate the SWP.
Alternative A operation would add approximately 429 GWh of additional net electricity demand over
Existing Conditions on a long-term annual basis and 249 GWh of additional net electricity demand over
the No Project/No Action Alternative on a long-term annual basis.
Additional energy needed to operate existing SWP facilities would be purchased by DWR as part of its
ongoing energy purchasing and scheduling responsibilities for the SWP. Thus, analysis of the GHG impact
of this additional electricity will be analyzed pursuant to the DWR GGERP framework (DWR, 2012a).
Operation of Alternative A would result in additional SWP energy demands in excess of 15 GWh/year;
therefore, the GGERP procedure has been followed for projects that would increase SWP energy demand
by 15 GWh/year or more.
In the GGERP, DWR developed estimates of historical, current, and future GHG emissions. Figure 25-2
shows those emissions as they were projected in the GGERP and how those emissions projections would
change with the additional electricity demands needed to operate the SWP with the addition of
Alternative A. As shown in Figure 25-2, in 2022 (the year that Alternative A is projected to go online),
DWR total emissions would increase from approximately 977,000 metric tons of CO2e to nearly
1.16 million metric tons of CO2e. This elevated level would be approximately 150,000 metric tons of
This document is not released as a draft EIR pursuant to CEQA Guidelines § 15087. As such, DWR is not soliciting and will not respond to commentssubmitted on this document, although any comments received will be retained and may be considered during preparation of a future draft EIR.

Chapter 25: Climate Change and Greenhouse Gas Emissions
PRELIMINARY – SUBJECT TO CHANGEPRELIMINARY ADMINISTRATIVE DRAFT DECEMBER 2013 25-15 NORTH-OF-THE-DELTA OFFSTREAM STORAGE PROJECT EIR/EISWBG020812033556SAC/433094/ (25-GHG_CC_PRELIM_ADMIN_DRAFT_DEC2013.DOCX)
Table 25-5Electricity Generation and Use from Expected Changes in Operation at Existing State Water
Project Facilities as a Result of Implementation of Alternative A (GWh/Year)a
ExistingConditions
NoProject/No
ActionAlternative
AlternativeA
AlternativeA MinusExisting
Conditions
AlternativeA Minus NoProject/No
ActionAlternative
SWP Facilities
Energy Generation Long-Termb 4,326 4,386 4,491 165 105
Dry and Criticalc 3,033 2,909 3,143 110 234
Pumping Energy Use Long-Term 7,848 8,088 8,442 594 354
Dry and Critical 6,354 6,013 6,768 414 755
Net Generation Long-Term -3,522 -3,702 -3,951 -429 -249
Dry and Critical -3,321 -3,104 -3,625 -304 -521
aResults are estimated using the SWP Power model using data from the CALSIM II model.bLong-Term is the average quantity for the calendar years 1922 to 2002.cDry and Critical is the average quantity for Dry and Critical years according to the Sacramento River 40-30-30 index.
Notes:
GWh/year = gigawatt hours per yearSWP = State Water Project
CO2e below DWR’s designated GHG emissions reduction trajectory red line, which is the linear
interpolation between DWR’s 2020 GHG emissions goal and DWR’s 2050 GHG emissions goal. The
projection indicates DWR has already included sufficient excess GHG emissions reductions into its future
activities, so that with the addition of 429 GWh of demand associated with Alternative A implementation,
DWR would remain below its emissions reduction trajectory and would maintain its downward trajectory
toward achieving its GHG emissions reduction goals. The calculations associated with projected
emissions are included in Appendix 25A.
Given the scale of additional emissions that Alternative A would add to DWR’s total GHG emissions,
DWR finds that no additional actions or commitments would be required to implement Alternative A.
As shown in the analysis above and consistent with the analysis contained in the GGERP and associated
Initial Study and Negative Declaration for the GGERP, Alternative A would not adversely affect DWR’s
ability to achieve the GHG emissions reduction goals set forth in the GGERP and would not conflict with
any of the specific action GHG emissions reduction measures set forth in the GGERP. Consistent with the
programmatic analysis framework set up in the GGERP, Alternative A would result in a less-than-
significant impact, when compared to Existing Conditions and the No Project/No Action Alternative.
Existing Central Valley Project Facilities Operational Emissions
DWR’s GGERP cannot be used to evaluate environmental impacts associated with increased CVP
pumping because emissions associated with CVP are not under DWR’s control and are not included in
the GGERP. Accordingly, GHG emissions resulting from increased CVP energy use are evaluated
separately from GHG emissions generated as a result of SWP energy use.
Table 25-6 shows that under Existing Conditions and No Project/No Action Alternative, the CVP would
generate approximately 3,590 GWh of excess hydroelectric power. This electricity would be sold into the
California electricity market or directly to CVP power users.
This document is not released as a draft EIR pursuant to CEQA Guidelines § 15087. As such, DWR is not soliciting and will not respond to commentssubmitted on this document, although any comments received will be retained and may be considered during preparation of a future draft EIR.
Chapter 25: Climate Change and Greenhouse Gas Emissions
PRELIMINARY – SUBJECT TO CHANGENORTH-OF-THE-DELTA OFFSTREAM STORAGE PROJECT EIR/EIS 25-16 PRELIMINARY ADMINISTRATIVE DRAFT DECEMBER 2013
WBG020812033556SAC/433094/ (25-GHG_CC_PRELIM_ADMIN_DRAFT_DEC2013.DOCX)
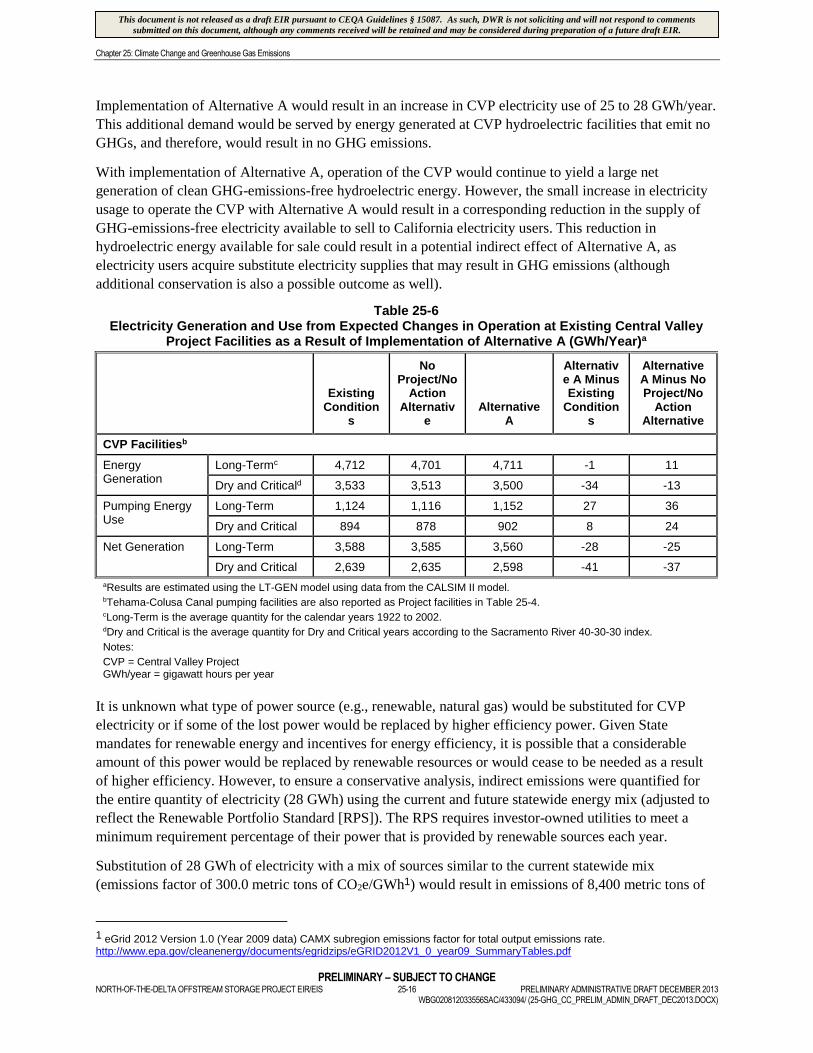
Implementation of Alternative A would result in an increase in CVP electricity use of 25 to 28 GWh/year.
This additional demand would be served by energy generated at CVP hydroelectric facilities that emit no
GHGs, and therefore, would result in no GHG emissions.
With implementation of Alternative A, operation of the CVP would continue to yield a large net
generation of clean GHG-emissions-free hydroelectric energy. However, the small increase in electricity
usage to operate the CVP with Alternative A would result in a corresponding reduction in the supply of
GHG-emissions-free electricity available to sell to California electricity users. This reduction in
hydroelectric energy available for sale could result in a potential indirect effect of Alternative A, as
electricity users acquire substitute electricity supplies that may result in GHG emissions (although
additional conservation is also a possible outcome as well).
Table 25-6Electricity Generation and Use from Expected Changes in Operation at Existing Central Valley
Project Facilities as a Result of Implementation of Alternative A (GWh/Year)a
ExistingCondition
s
NoProject/No
ActionAlternativ
eAlternative
A
Alternative A MinusExisting
Conditions
AlternativeA Minus NoProject/No
ActionAlternative
CVP Facilitiesb
EnergyGeneration
Long-Termc 4,712 4,701 4,711 -1 11
Dry and Criticald 3,533 3,513 3,500 -34 -13
Pumping EnergyUse
Long-Term 1,124 1,116 1,152 27 36
Dry and Critical 894 878 902 8 24
Net Generation Long-Term 3,588 3,585 3,560 -28 -25
Dry and Critical 2,639 2,635 2,598 -41 -37
aResults are estimated using the LT-GEN model using data from the CALSIM II model.bTehama-Colusa Canal pumping facilities are also reported as Project facilities in Table 25-4.cLong-Term is the average quantity for the calendar years 1922 to 2002.dDry and Critical is the average quantity for Dry and Critical years according to the Sacramento River 40-30-30 index.
Notes:
CVP = Central Valley ProjectGWh/year = gigawatt hours per year
It is unknown what type of power source (e.g., renewable, natural gas) would be substituted for CVP
electricity or if some of the lost power would be replaced by higher efficiency power. Given State
mandates for renewable energy and incentives for energy efficiency, it is possible that a considerable
amount of this power would be replaced by renewable resources or would cease to be needed as a result
of higher efficiency. However, to ensure a conservative analysis, indirect emissions were quantified for
the entire quantity of electricity (28 GWh) using the current and future statewide energy mix (adjusted to
reflect the Renewable Portfolio Standard [RPS]). The RPS requires investor-owned utilities to meet a
minimum requirement percentage of their power that is provided by renewable sources each year.
Substitution of 28 GWh of electricity with a mix of sources similar to the current statewide mix
(emissions factor of 300.0 metric tons of CO2e/GWh1) would result in emissions of 8,400 metric tons of
1 eGrid 2012 Version 1.0 (Year 2009 data) CAMX subregion emissions factor for total output emissions rate.http://www.epa.gov/cleanenergy/documents/egridzips/eGRID2012V1_0_year09_SummaryTables.pdf
This document is not released as a draft EIR pursuant to CEQA Guidelines § 15087. As such, DWR is not soliciting and will not respond to commentssubmitted on this document, although any comments received will be retained and may be considered during preparation of a future draft EIR.

Chapter 25: Climate Change and Greenhouse Gas Emissions
PRELIMINARY – SUBJECT TO CHANGEPRELIMINARY ADMINISTRATIVE DRAFT DECEMBER 2013 25-17 NORTH-OF-THE-DELTA OFFSTREAM STORAGE PROJECT EIR/EISWBG020812033556SAC/433094/ (25-GHG_CC_PRELIM_ADMIN_DRAFT_DEC2013.DOCX)
CO2e; however, under expected future conditions (after full implementation of the RPS), emissions would
be 6,460 metric tons of CO2e2.
These emissions could contribute to a cumulatively considerable effect, and could, therefore, be a
potentially significant impact, when compared to Existing Conditions and the No Project/No Action
Alternative. However, these emissions would be caused by dozens of independent electricity users
making decisions about different ways to substitute for the lost power. Power purchases by private
entities or public utilities in the private marketplace necessitated by a reduction in available CVP-
generated hydroelectric power are beyond the control of the Lead Agencies. Further, monitoring to
determine the actual indirect change in emissions as a result of Alternative A implementation would not
be feasible.
Open Water Surfaces and Tailraces Emissions
Implementation of Alternative A would include the construction of a surface storage reservoir and would
result in the conversion of land that is currently used predominantly for cattle grazing to an open water
surface. Research indicates that the surfaces of some reservoirs may be emitting or absorbing GHGs at
material rates as a result of diffusion of CO2 and CH4 from the water into the atmosphere or from the
atmosphere into the water. In addition, as stored water passes through hydroelectric turbines, GHGs that
had been dissolved in the water come out of solution and are released to the atmosphere (also known as
tailrace emissions). These types of emissions could represent sources or sinks of emissions from
Alternative A; however, there are several factors that are not yet fully understood that make it difficult to
adequately quantify potential emissions rates from the proposed Alternative A surface storage facilities.
These factors have been identified in both the absorption and emission of GHGs from reservoirs and other
aquatic systems. In general, organic inputs, soil type and vegetation inundated, water quality parameters
(dissolved oxygen, CO2, and CH4, temperature, pH), and duration of inundation have all been found to
affect the GHG absorption and emissions characteristics of aquatic systems. In addition to these factors,
natural aquatic systems have been shown to be the primary pathway in the global carbon cycle for
transmitting carbon sequestered at the watershed level back to the atmosphere, into sediment deposition,
or as dissolved carbon to the oceans (Cole et al., 2007). Thus, even if emissions from the surface and
tailraces of reservoirs could be accurately quantified, it would not be clear whether the emissions of
GHGs measured at the reservoir were different from the emissions that would have occurred within the
watershed had the reservoir not been built. Because rivers are significant GHG emissions pathways, it is
necessary to compare pre-reservoir watershed emissions with post-reservoir watershed emissions to
determine the effect of the reservoir.
Recent studies have provided useful information about the potential scale of emissions from open water
systems in temperate areas. Fifty-nine hydropower reservoirs, natural lakes, and rivers in the western and
southwestern United States have been sampled to date (Soumis et al., 2004). This sampling shows that
some reservoirs in California, Oregon, and Washington are GHG sinks and others have gross emissions
equal to or less than natural lakes and rivers of the region (Tremblay et al., 2005). These studies suggest
that the proposed Sites Reservoir, Holthouse Reservoir, and other open water facilities associated with
Alternative A are unlikely to produce substantial GHG emissions.
2 Assumes a total output emissions rate of 230 mtCO2e/GWh based on shift in generation to 33 percent renewables for retail load.
This document is not released as a draft EIR pursuant to CEQA Guidelines § 15087. As such, DWR is not soliciting and will not respond to commentssubmitted on this document, although any comments received will be retained and may be considered during preparation of a future draft EIR.

Chapter 25: Climate Change and Greenhouse Gas Emissions
PRELIMINARY – SUBJECT TO CHANGENORTH-OF-THE-DELTA OFFSTREAM STORAGE PROJECT EIR/EIS 25-18 PRELIMINARY ADMINISTRATIVE DRAFT DECEMBER 2013
WBG020812033556SAC/433094/ (25-GHG_CC_PRELIM_ADMIN_DRAFT_DEC2013.DOCX)
Further, ARB has determined that, for the purpose of AB 32 Mandatory GHG Accounting, generation of
hydroelectric power shall be excluded from the regulation3. The USEPA in its eGrid database
(USEPA, 2012) of emissions factors for electricity generating facilities also associates a zero emissions
factor to hydroelectric power generation. And finally, excluding biogenic sources of emissions from
short-term changes in the form of carbon at stages of the active carbon cycle is a widely accepted practice
in GHG accounting as indicated by the lack of protocols, guidance, and tools provided for accounting for
these emissions in several important GHG protocols including: The GHG Protocol
(www.ghgprotocol.org), The Climate Registry (www.theclimateregistry.org), and The American Carbon
Registry (www.americancarbonregistry.org).
Based on these studies of emissions from open water systems and considering the zero emissions factor
typically assigned to hydroelectric power generation, emissions associated with Alternative A’s open
water surfaces and tailraces would likely be a less-than-significant impact, when compared to Existing
Conditions and the No Project/No Action Alternative. DWR has not quantified emissions from the
surface or tailraces of proposed Alternative A facilities because the quantification would be speculative,
considering the lack of protocols, guidance, and tools to do so.
Impacts Associated with Alternative B
Impact GHG-1: Generation of Cumulative GHG Emissions
Construction, Operation, and Maintenance of the Proposed Project
Project Construction Emissions
Construction-related GHG emissions associated with Alternative B would result primarily from fuel
combustion in construction equipment, trucks, and worker vehicles, and also from the production of
concrete used for construction and from the generation of electricity used during construction. Total
estimated GHG emissions resulting from construction of Alternative B are summarized in Table 25-7.
Table 25-7Estimated Total GHG Emissions from Construction of Alternative B (Metric Tons CO2e)*
Emissions from MobileConstructionEquipment*
Emissions FromConcrete
Production
Emissions from ConstructionElectricity Usage/Tunnel Boring
MachineTotal Construction-Related Emissions
228,475 50,376 4,297 283,148
*Calculated emissions based on Table 24A. B-5 in Appendix 24A.
The emissions shown in Table 25-7 are the estimated total cumulative CO2e emissions that would occur
over the nine-year construction period of Alternative B. Within the nine-year construction period, annual
emissions would fluctuate. Because GHG emissions are well dispersed in the atmosphere and persist for
long periods of time (hundreds or thousands of years), estimates of emissions on a yearly basis are less
meaningful than the total amount of emissions released during the discrete construction phase. After
construction is complete, emissions from these sources would cease.
Once construction is complete, proposed Alternative B facilities would begin to operate. Unlike
construction emissions, operations emissions would occur over a long period of time, i.e., the useful life
of the proposed Project. Operation of the proposed Alternative B facilities would involve both the use and
3 California Code of Regulations, Title 17, Division 3, Chapter 1, Subchapter 10, Article 2, Section 95100.
This document is not released as a draft EIR pursuant to CEQA Guidelines § 15087. As such, DWR is not soliciting and will not respond to commentssubmitted on this document, although any comments received will be retained and may be considered during preparation of a future draft EIR.

Chapter 25: Climate Change and Greenhouse Gas Emissions
PRELIMINARY – SUBJECT TO CHANGEPRELIMINARY ADMINISTRATIVE DRAFT DECEMBER 2013 25-19 NORTH-OF-THE-DELTA OFFSTREAM STORAGE PROJECT EIR/EISWBG020812033556SAC/433094/ (25-GHG_CC_PRELIM_ADMIN_DRAFT_DEC2013.DOCX)
generation of electricity, as described in Chapter 31 Power Production and Energy. The amount of GHG
emissions from operation of Alternative B would depend on the specific sources of energy used for
pumping water into the reservoir and other operational parameters. Further, electricity needed to pump
water into the reservoirs and electricity generated by releasing water from the reservoirs would vary
annually and seasonally, depending on hydrologic conditions.
As shown in Table 25-8, operation of the proposed Alternative B facilities (without consideration of
pumpback operations) would result in a long-term average net generation of -79 GWh/year (i.e., to
operate the Alternative B facilities, all of the energy generated at the facilities would be needed and an
additional 79 GWh of energy would be needed from other sources).
Table 25-8Estimated Electricity Generation and Use from Operation of Alternative B Facilities without
Consideration of Pumpback Operations (GWh/Year)a
ExistingConditions
NoProject/No
ActionAlternative
AlternativeB
AlternativeB minusExisting
Conditions
AlternativeB minus
NoProject/No
ActionAlternative
Project Facilitiesb
EnergyGeneration
Long-Termc 0 0 104 104 104
Dry and Criticald 0 0 100 100 100
Energy Use Long-Term 13 13 195 183 182
Dry and Critical 11 12 106 95 95
Net Generation Long-Term -13 -13 -91 -79 -78
Dry and Critical -11 -12 -6 5 6
aResults are estimated using the NODOS Power model using data from the CALSIM II model.bOther related Tehama-Colusa Canal and Glenn-Colusa Irrigation District Canal pumping facilities are included; this results innon-zero values for Existing Condition and No Project/No Action Alternative. Tehama-Colusa Canal pumping facilities are alsoreported as CVP facilities in Table 25-10.cLong-Term is the average quantity for the calendar years 1922 to 2002.dDry and Critical is the average quantity for Dry and Critical years according to the Sacramento River 40-30-30 index.
Note:
GWh/year = gigawatt hours per year
Although operation of the proposed Alternative B facilities would result in a long-term average net use of
electricity, the way the facilities would be operated and integrated into the California electricity market
would actually result in annual reductions in GHG emissions. As discussed in Chapter 31 Power
Production and Energy, water pumping would occur to the extent possible during times when renewable
(zero emissions) electricity is available, and releases of water, which generate electricity, would be done
to the extent possible when electricity is in high demand. Therefore, electricity generated at the proposed
Alternative B facilities – with no emission of GHGs – would offset some of the most inefficient and
highest emitting generating resources in the electricity market.
In addition to the analysis provided above, the proposed Alternative B facilities would be configured to
allow substantial pumpback operations; i.e., pumping water from the proposed Holthouse Reservoir into
the proposed Sites Reservoir during nighttime hours (when excess clean/cheap electricity is available) and
then releasing the water back from the proposed Sites Reservoir to the proposed Holthouse Reservoir
This document is not released as a draft EIR pursuant to CEQA Guidelines § 15087. As such, DWR is not soliciting and will not respond to commentssubmitted on this document, although any comments received will be retained and may be considered during preparation of a future draft EIR.

Chapter 25: Climate Change and Greenhouse Gas Emissions
PRELIMINARY – SUBJECT TO CHANGENORTH-OF-THE-DELTA OFFSTREAM STORAGE PROJECT EIR/EIS 25-20 PRELIMINARY ADMINISTRATIVE DRAFT DECEMBER 2013
WBG020812033556SAC/433094/ (25-GHG_CC_PRELIM_ADMIN_DRAFT_DEC2013.DOCX)
during peak demand hours during the day (when the electricity generated can displace high emitting/high
cost sources).
Alternative B would also be able to provide critical renewable integration services to the California grid
that would facilitate additional renewable energy generation and further reduce GHG emissions. Solar and
wind power are intermittent electricity sources; the electricity generated at a solar or wind power station
fluctuates unpredictably as clouds obscure the sun or wind speeds decrease. To effectively integrate solar
and wind power into an electricity grid, there must be appropriate backup power supplies to ensure that
fluctuations in solar or wind generation are smoothed out so that sufficient supply exists in the grid to
meet demand. Alternative B could provide this renewable integration service. Both in the pumping and
generating phase, Alternative B would have the flexibility to modify its operations to balance generation
from intermittent renewable electricity supplies. In the pumping phase, the Alternative B would have
ample storage at the proposed Holthouse Reservoir and variable speed pumps at the proposed Sites
Pumping Plant that could quickly ramp up or down so that pumping from the proposed Holthouse
Reservoir to the proposed Sites Reservoir could be slowed or delayed for up to several days to coincide
with available renewable electricity. In the generation phase, the proposed Sites Pumping Plant’s variable
speed turbines could quickly ramp up or ramp down to provide additional generation when renewable
electricity decreases or additional pumping load when renewable generation increases.
Chapter 3 Description of the Proposed Project/Proposed Action and Alternatives describes the proposed
Project’s commitment to obtain at least 20 percent of the power used for pumping water from the
Sacramento River and the proposed Holthouse Reservoir into the proposed Sites Reservoir from wind
and/or solar energy, and to use at least 20 percent of the proposed Project’s generated power and/or
served pump load to provide integration services needed to firm up highly variable wind and/or solar
generation. At this level of renewables use and renewable integration service, operational analyses
indicate that implementation of Alternative B would result in GHG emissions reductions of
approximately 29,400 metric tons of CO2e per year (Appendix 25A). This represents a very conservative
estimate of the level of renewables that would be used to operate Alternative B and the level of renewable
integration service that Alternative B could provide. If Alternative B were operated with 80 percent
renewable power for pumping and provided 20 percent of pumping load for integration services, and
100 percent of generated electricity was used for integration services, operational analyses indicate that
Alternative B would result in GHG emissions reductions of more than 135,600 metric tons of CO2e per
year. Although operations would vary each year, all of these features would contribute to reducing overall
GHG emissions from Alternative B and from the larger California electrical power grid. These two data
points represent the likely potential range of GHG emissions reductions that would result from operation
of Alternative B.
Maintenance of Alternative B facilities would include regular inspections, land management activities,
sediment removal from forebays, and servicing of pumping plants. Estimated emissions from
maintenance activities are detailed in Appendix 24A and would total approximately 1,500 metric tons of
CO2e per year.
As discussed in Section 25.4.2.1, any increase in emissions above net zero associated with Alternative B
would be adverse.
Construction of Alternative B would generate approximately 283,000 metric tons of CO2e emissions over
the nine-year construction period. Once operations begin, maintenance activities would increase GHG
emissions by 1,500 metric tons of CO2e; however, operations of Alternative B would be expected to
This document is not released as a draft EIR pursuant to CEQA Guidelines § 15087. As such, DWR is not soliciting and will not respond to commentssubmitted on this document, although any comments received will be retained and may be considered during preparation of a future draft EIR.

Chapter 25: Climate Change and Greenhouse Gas Emissions
PRELIMINARY – SUBJECT TO CHANGEPRELIMINARY ADMINISTRATIVE DRAFT DECEMBER 2013 25-21 NORTH-OF-THE-DELTA OFFSTREAM STORAGE PROJECT EIR/EISWBG020812033556SAC/433094/ (25-GHG_CC_PRELIM_ADMIN_DRAFT_DEC2013.DOCX)
reduce annual GHG emissions by between 29,400 and 135,600 metric tons of CO2e per year
(Appendix 25A). Thus, it would take between two and 10 years of operation to completely offset the
GHG emissions released during construction. After that time period, operation of Alternative B would
contribute to lowering California’s GHG emissions and would help California achieve its AB 32 GHG
emissions reduction goals.
Because increases in GHG emissions from construction would be more than offset by reductions in GHG
emissions from operation, there would be no long-term increase over the net-zero threshold. Over the life
of the proposed Project, Alternative B would be likely to substantially reduce GHG emissions. Therefore,
Alternative B would result in a less-than-significant impact, when compared to Existing Conditions and
the No Project/No Action Alternative.
Project Operation and Maintenance Emissions
Existing State Water Project Facilities Operational Emissions
Operation of Alternative B would result in modifications to the operations of existing SWP facilities
including Lake Oroville and the Thermalito Complex, and pumping and generating facilities along the
California Aqueduct.
Table 25-9 shows that net generation (the amount of energy generated at hydroelectric generating
facilities minus the amount of energy used at pumping facilities) would be negative, i.e., Alternative B
would result in a net increase in the amount of energy needed annually to operate the SWP.
Table 25-9Electricity Generation and Use from Expected Changes in Operation at Existing State Water
Project Facilities as a Result of Implementation of Alternative B (GWh/Year)a
ExistingConditions
NoProject/No
ActionAlternative
AlternativeB
AlternativeB minusExisting
Conditions
AlternativeB minus
NoProject/No
ActionAlternative
SWP Facilities
EnergyGeneration
Long-Termb 4,326 4,386 4,493 167 107
Dry and Criticalc 3,033 2,909 3,128 96 220
Energy Use Long-Term 7,848 8,088 8,464 616 376
Dry and Critical 6,354 6,013 6,727 373 714
Net Generation Long-Term -3,522 -3,702 -3,971 -449 -269
Dry and Critical -3,321 -3,104 -3,599 -277 -494
aResults are estimated using the SWP Power model using data from the CALSIM II model.bLong-Term is the average quantity for the calendar years 1922 to 2002.cDry and Critical is the average quantity for Dry and Critical years according to the Sacramento River 40-30-30 index.
Notes:
GWh/year = gigawatt hours per yearSWP = State Water Project
Alternative B would add approximately 449 GWh of additional net electricity demand over Existing
Conditions on a long-term annual basis and 269 GWh of additional net electricity demand over the No
Project/No Action Alternative on a long-term annual basis.
This document is not released as a draft EIR pursuant to CEQA Guidelines § 15087. As such, DWR is not soliciting and will not respond to commentssubmitted on this document, although any comments received will be retained and may be considered during preparation of a future draft EIR.

Chapter 25: Climate Change and Greenhouse Gas Emissions
PRELIMINARY – SUBJECT TO CHANGENORTH-OF-THE-DELTA OFFSTREAM STORAGE PROJECT EIR/EIS 25-22 PRELIMINARY ADMINISTRATIVE DRAFT DECEMBER 2013
WBG020812033556SAC/433094/ (25-GHG_CC_PRELIM_ADMIN_DRAFT_DEC2013.DOCX)
Additional energy needed to operate existing SWP facilities would be purchased by DWR as part of its
ongoing energy purchasing and scheduling responsibilities for the SWP. Thus, analysis of the GHG impact
of this additional electricity will be analyzed pursuant to the DWR GGERP framework (DWR, 2012a).
Operation of Alternative B would result in additional SWP energy demands in excess of 15 GWh/year;
therefore, the GGERP procedure has been followed for projects that would increase SWP energy demand
by 15 GWh/year or more.
In the GGERP, DWR developed estimates of historical, current, and future GHG emissions. Figure 25-3
shows those emissions as they were projected in the GGERP and how those emissions projections would
change with the additional electricity demands needed to operate the SWP with the addition of
Alternative B. As shown in Figure 25-3, in 2022 (the year that Alternative B is projected to go online),
DWR total emissions would increase from approximately 977,000 metric tons of CO2e to nearly
1.17 million metric tons of CO2e. This elevated level would be approximately 145,000 metric tons of
CO2e below DWR’s designated GHG emissions reduction trajectory red line, which is the linear
interpolation between DWR’s 2020 GHG emissions goal and DWR’s 2050 GHG emissions goal. The
projection indicates DWR has already built in sufficient excess GHG emissions reductions into its future
activities that even with the addition of 449 GWh of demand, DWR would remain below its emissions
reduction trajectory and would maintain its downward trajectory toward achieving its GHG emissions
reduction goals. The calculations associated with projected emissions are included in Appendix 25A.
Given the scale of additional emissions that Alternative B would add to DWR’s total GHG emissions,
DWR finds that no additional actions or commitments are required to implement Alternative B.
As shown in the analysis above and consistent with the analysis contained in the GGERP and associated
Initial Study and Negative Declaration for the GGERP, Alternative B would not adversely affect DWR’s
ability to achieve the GHG emissions reduction goals set forth in the GGERP and would not conflict with
any of the specific action GHG emissions reduction measures set forth in the GGERP. Consistent with the
programmatic analysis framework set up in the GGERP, Alternative B would result in a less-than-
significant impact, when compared to Existing Conditions and the No Project/No Action Alternative.
Existing Central Valley Project Facilities Operational Emissions
DWR’s GGERP cannot be used to evaluate environmental impacts associated with increased CVP
pumping because emissions associated with CVP are not under DWR’s control and are not included in
the GGERP. Accordingly, GHG emissions resulting from increased CVP energy use are evaluated
separately from GHG emissions generated as a result of SWP energy use.
Table 25-10 shows that under Existing Conditions and No Project/No Action Alternative, the CVP would
generate approximately 3,590 GWh of excess hydroelectric power. This electricity would be sold into the
California electricity market or directly to energy users.
Implementation of Alternative B would result in an increase of 14 to 17 GWh per year in CVP electricity
use. This additional demand would be served by energy generated at CVP hydroelectric facilities that
emit no GHGs, and therefore, would result in no GHG emissions.
With implementation of Alternative B, operation of the CVP would continue to yield a large net
generation of clean GHG-emissions-free hydroelectric energy. However, the small increase in electricity
usage to operate the CVP with Alternative B would result in a corresponding reduction in the supply of
GHG-emissions-free electricity available to sell to California electricity users. This reduction in
This document is not released as a draft EIR pursuant to CEQA Guidelines § 15087. As such, DWR is not soliciting and will not respond to commentssubmitted on this document, although any comments received will be retained and may be considered during preparation of a future draft EIR.

Chapter 25: Climate Change and Greenhouse Gas Emissions
PRELIMINARY – SUBJECT TO CHANGEPRELIMINARY ADMINISTRATIVE DRAFT DECEMBER 2013 25-23 NORTH-OF-THE-DELTA OFFSTREAM STORAGE PROJECT EIR/EISWBG020812033556SAC/433094/ (25-GHG_CC_PRELIM_ADMIN_DRAFT_DEC2013.DOCX)
hydroelectric energy available for sale could result in a potential indirect effect from Alternative B, as
electricity users acquire substitute electricity supplies that may result in GHG emissions (although
additional conservation is also a possible outcome as well).
It is unknown what type of power source (e.g., renewable, natural gas) would be substituted for CVP
electricity or if some of the lost power would be made up with higher efficiency. Given State mandates for
renewable energy and incentives for energy efficiency, it is possible that a considerable amount of this power
would be replaced by renewable resources or would cease to be needed as a result of higher efficiency.
However, to ensure a conservative analysis, indirect emissions were quantified for the entire quantity of
electricity (32 GWh) using the current and future statewide energy mix (adjusted to reflect the RPS).
Table 25-10Electricity Generation and Use from Expected Changes in Operation at Existing Central Valley
Project Facilities as a Result of Implementation of Alternative B (GWh/Year)a
ExistingCondition
s
NoProject/No
ActionAlternativ
eAlternative
B
Alternative B MinusExisting
Conditions
AlternativeB Minus NoProject/No
ActionAlternative
CVP Facilitiesb
EnergyGeneration
Long-Termc 4,712 4,701 4,718 6 18
Dry and Criticald 3,533 3,513 3,506 -27 -6
Energy Use Long-Term 1,124 1,116 1,147 23 32
Dry and Critical 894 878 902 8 25
Net Generationd Long-Term 3,588 3,585 3,571 -17 -14
Dry and Critical 2,639 2,635 2,604 -35 -31
aResults are estimated using the LT-GEN model using data from the CALSIM II model.bTehama-Colusa Canal pumping facilities are also reported as Project facilities in Table 25-8.cLong-Term is the average quantity for the calendar years 1922 to 2002.dDry and Critical is the average quantity for Dry and Critical years according to the Sacramento River 40-30-30 index.
Notes:
CVP = Central Valley ProjectGWh/year = gigawatt hours per year
Substitution of 32 GWh of electricity with a mix of sources similar to the current statewide mix
(emissions factor of 300.0 mtCO2e/GWh4) would result in emissions of 9,600 metric tons of CO2e;
however, under expected future conditions (after full implementation of the RPS), emissions would be
7,360 metric tons of CO2e5.
These emissions could contribute to a cumulatively considerable effect, and could, therefore, be a
potentially significant impact, when compared to Existing Conditions and the No Project/No Action
Alternative. However, these emissions would be caused by dozens of independent electricity users
making decisions about different ways to substitute for the lost power. Power purchases by private
entities or public utilities in the private marketplace necessitated by a reduction in available CVP-
4 eGrid 2012 Version 1.0 (Year 2009 data) CAMX subregion emissions factor for total output emissions rate.http://www.epa.gov/cleanenergy/documents/egridzips/eGRID2012V1_0_year09_SummaryTables.pdf5 Assumes a total output emissions rate of 230 mtCO2e/GWh based on shift in generation to 33 percent renewables for retail load.
This document is not released as a draft EIR pursuant to CEQA Guidelines § 15087. As such, DWR is not soliciting and will not respond to commentssubmitted on this document, although any comments received will be retained and may be considered during preparation of a future draft EIR.

Chapter 25: Climate Change and Greenhouse Gas Emissions
PRELIMINARY – SUBJECT TO CHANGENORTH-OF-THE-DELTA OFFSTREAM STORAGE PROJECT EIR/EIS 25-24 PRELIMINARY ADMINISTRATIVE DRAFT DECEMBER 2013
WBG020812033556SAC/433094/ (25-GHG_CC_PRELIM_ADMIN_DRAFT_DEC2013.DOCX)
generated hydroelectric power are beyond the control of the Lead Agencies. Further, monitoring to
determine the actual indirect change in emissions as a result of Alternative B would not be feasible.
Open Water Surfaces and Tailraces Emissions
Refer to the Impact GHG-1 discussion for Alternative A for open water surfaces and tailraces. That
discussion also applies to Alternative B.
Impacts Associated with Alternative C
Impact GHG-1: Generation of Cumulative GHG Emissions
Construction, Operation, and Maintenance of the Proposed Project
Project Construction Emissions
Construction-related GHG emissions would result primarily from fuel combustion in construction
equipment, trucks, and worker vehicles, and also from the production of concrete used for construction
and from the generation of electricity used during construction. Total GHG emissions resulting from
construction of Alternative C are summarized in 25-11.
Table 25-11Estimated Total GHG Emissions from Construction of Alternative C (Metric Tons CO2e)*
Emissions from MobileConstructionEquipment*
Emissions FromConcrete
Production
Emissions from ConstructionElectricity Usage/Tunnel Boring
Machine
TotalConstruction-
Related Emissions
228,475 50,376 4,297 283,148
*Calculated emissions based on Table 24A. B-5 in Appendix 24A.
The emissions shown in Table 25-11 are the estimated total cumulative CO2e emissions that would occur
over the nine-year construction period of Alternative C. Within the nine-year construction period, annual
emissions would fluctuate. Because GHG emissions are well dispersed in the atmosphere and persist for
long periods of time (hundreds or thousands of years), estimates of emissions on a yearly basis are less
meaningful than the total amount of emissions released during the discrete construction phase. After
construction is complete, emissions from these sources would cease.
Once construction is complete, proposed Alternative C facilities would begin to operate. Unlike
construction emissions, operations emissions would occur over a long and unknown period of time,
i.e., the useful life of the proposed Project. Operation of the proposed Alternative C facilities would
involve both the use and generation of electricity, as described in Chapter 31 Power Production and
Energy. The amount of GHG emissions from operation of Alternative C would depend on the specific
sources of energy used for pumping water into the reservoir and other operational parameters. Further,
electricity needed to pump water into the reservoirs and electricity generated by releasing water from the
reservoirs would vary annually and seasonally, depending on hydrologic conditions.
As shown in Table 25-12, operation of the Alternative C facilities (without consideration of pumpback
operations) would result in a long-term average net generation of -108 GWh/year (i.e., to operate the
Alternative C facilities, all of the energy generated at the facilities would be needed and an additional
108 GWh of energy would be needed from other sources).
This document is not released as a draft EIR pursuant to CEQA Guidelines § 15087. As such, DWR is not soliciting and will not respond to commentssubmitted on this document, although any comments received will be retained and may be considered during preparation of a future draft EIR.

Chapter 25: Climate Change and Greenhouse Gas Emissions
PRELIMINARY – SUBJECT TO CHANGEPRELIMINARY ADMINISTRATIVE DRAFT DECEMBER 2013 25-25 NORTH-OF-THE-DELTA OFFSTREAM STORAGE PROJECT EIR/EISWBG020812033556SAC/433094/ (25-GHG_CC_PRELIM_ADMIN_DRAFT_DEC2013.DOCX)
Although operation of the Alternative C facilities would result in a long-term average net use of
electricity, the way the facilities would be operated and integrated into the California electricity market
would actually result in annual reductions in GHG emissions. As discussed in Chapter 31 Power
Production and Energy, water pumping would occur to the extent possible during times when renewable
(zero emissions) electricity is available, and releases of water, which generate electricity, would be done
to the extent possible when electricity is in high demand. Therefore, electricity generated at the proposed
Alternative C facilities – with no emission of GHGs – would offset some of the most inefficient and
highest emitting generating resources in the electricity market.
Table 25-12Estimated Electricity Generation and Use from Operation of Alternative C Facilities without
Consideration of Pumpback Operations (GWh/Year)a
ExistingCondition
s
NoProject/No
ActionAlternativ
eAlternative
C
Alternative C MinusExisting
Conditions
AlternativeC Minus NoProject/No
ActionAlternative
Project Facilitiesb
EnergyGeneration
Long-Termc 0 0 157 157 157
Dry and Criticald 0 0 173 173 173
Energy Use Long-Term 13 13 278 265 265
Dry and Critical 11 12 199 188 11
Net Generation Long-Term -13 -13 -121 -108 -108
Dry and Critical -11 -12 -26 -15 -14
aResults are estimated using the NODOS Power model using data from the CALSIM II model.bOther related Tehama-Colusa Canal and Glenn-Colusa Irrigation District Canal pumping facilities are included; this results innon-zero values for Existing Condition and No Project/No Action Alternative. Tehama-Colusa Canal pumping facilities are alsoreported as CVP facilities in Table 25-14.cLong-Term is the average quantity for the calendar years 1922 to 2002.dDry and Critical is the average quantity for Dry and Critical years according to the Sacramento River 40-30-30 index.
Note:
GWh/year = gigawatt hours per year
In addition to the analysis provided above, the proposed Alternative C facilities would be configured to
allow substantial pumpback operations; i.e., pumping water from the proposed Holthouse Reservoir into
the proposed Sites Reservoir during nighttime hours (when excess clean/cheap electricity is available) and
then releasing the water back from the proposed Sites Reservoir to the proposed Holthouse Reservoir
during peak demand hours during the day (when the electricity generated can displace high emitting/high
cost sources).
Alternative C would also be able to provide critical renewable integration services to the California grid
that would facilitate additional renewable energy generation and further reduce GHG emissions. Solar and
wind power are intermittent electricity sources; the electricity generated at a solar or wind power station
fluctuates unpredictably as clouds obscure the sun or wind speeds die down. To effectively integrate solar
and wind power into an electricity grid, there must be appropriate backup power supplies to ensure that
fluctuations in solar or wind generation are smoothed out so that sufficient supply exists in the grid to
meet demand. Alternative C could provide this integration service. Both in the pumping and generating
phase, the Alternative C would have the flexibility to modify its operations to balance generation from
intermittent renewable electricity supplies. In the pumping phase, has Alternative C would have ample
This document is not released as a draft EIR pursuant to CEQA Guidelines § 15087. As such, DWR is not soliciting and will not respond to commentssubmitted on this document, although any comments received will be retained and may be considered during preparation of a future draft EIR.

Chapter 25: Climate Change and Greenhouse Gas Emissions
PRELIMINARY – SUBJECT TO CHANGENORTH-OF-THE-DELTA OFFSTREAM STORAGE PROJECT EIR/EIS 25-26 PRELIMINARY ADMINISTRATIVE DRAFT DECEMBER 2013
WBG020812033556SAC/433094/ (25-GHG_CC_PRELIM_ADMIN_DRAFT_DEC2013.DOCX)
storage at the proposed Holthouse Reservoir and variable speed pumps at the proposed Sites Pumping
Plant that could quickly ramp up or down so that pumping from the proposed Holthouse Reservoir to the
proposed Sites Reservoir could be slowed or delayed for up to several days to coincide with available
renewable electricity. In the generation phase, the proposed Sites Pumping Plant’s variable speed turbines
could quickly ramp up or ramp down to provide additional generation when renewable electricity
decreases or additional pumping load when renewable generation increases.
Chapter 3 Description of the Proposed Project/Proposed Action and Alternatives describes the proposed
Project’s commitment to obtain at least 20 percent of the power used for pumping water from the
Sacramento River and the proposed Holthouse Reservoir into the proposed Sites Reservoir from wind
and/or solar energy, and to use at least 20 percent of the proposed Project’s generated power and/or
served pump load to provide integration services needed to firm up highly variable wind and/or solar
generation. At this level of renewables use and renewable integration service, operational analyses
indicate that Alternative C would result in GHG emissions reductions of approximately 25,000 metric
tons of CO2e per year (Appendix 25A). This represents a very conservative estimate of the level of
renewables that would be used to operate Alternative C and the level of renewable integration service that
Alternative C could provide. If Alternative C were operated with 80 percent renewable power for
pumping and provided 20 percent of pumping load for integration services, and 100 percent of generated
electricity was used for integration services, operational analyses indicate that Alternative C would result
in GHG emissions reductions of more than 147,500 metric tons of CO2e per year. Although operations
would vary each year, all of these features would contribute to reducing overall GHG emissions from
Alternative C and from the larger California electrical power grid. These two data points represent the
likely potential range of GHG emissions reductions that would result from operation of Alternative C.
Maintenance of Alternative C facilities would include regular inspections, land management activities,
sediment removal from forebays, and servicing of pumping plants. Estimated emissions from
maintenance activities are detailed in Appendix 24A and would total approximately 1,500 metric tons of
CO2e per year.
As discussed in Section 25.4.2.1, any increase in emissions above net zero associated with Alternative C
would be adverse.
Construction of Alternative C would generate approximately 283,000 metric tons of CO2e emissions over the
nine-year construction period. Once operations begin, maintenance activities would increase GHG emissions
by 1,500 metric tons of CO2e; however, operations of Alternative C would be expected to reduce annual GHG
emissions by between 25,000 and 147,500 metric tons of CO2e per year (Appendix 25A). Thus, it would take
between two and 12 years of operation to completely offset the GHG emissions released during construction.
After that time period, operation of Alternative C would contribute to lowering California’s GHG emissions
and would help California achieve its AB 32 GHG emissions reduction goals.
Because increases in GHG emissions from construction would be more than offset by reductions in GHG
emissions from operation, there would be no long-term increase over the net-zero threshold. Over the life
of the proposed Project, Alternative C would be likely to substantially reduce GHG emissions. Therefore,
Alternative C would result in a less-than-significant impact, when compared to Existing Conditions and
the No Project/No Action Alternative.
This document is not released as a draft EIR pursuant to CEQA Guidelines § 15087. As such, DWR is not soliciting and will not respond to commentssubmitted on this document, although any comments received will be retained and may be considered during preparation of a future draft EIR.

Chapter 25: Climate Change and Greenhouse Gas Emissions
PRELIMINARY – SUBJECT TO CHANGEPRELIMINARY ADMINISTRATIVE DRAFT DECEMBER 2013 25-27 NORTH-OF-THE-DELTA OFFSTREAM STORAGE PROJECT EIR/EISWBG020812033556SAC/433094/ (25-GHG_CC_PRELIM_ADMIN_DRAFT_DEC2013.DOCX)
Project Operation and Maintenance Emissions
Existing State Water Project Facilities Operational Emissions
Operation of Alternative C would result in modifications to the operations of existing SWP facilities
including Lake Oroville and the Thermalito Complex, and pumping and generating facilities along the
California Aqueduct.
Table 25-13 shows that net generation (the amount of energy generated at hydroelectric generating
facilities minus the amount of energy used at pumping facilities) would be negative, i.e., Alternative C
would result in a net increase in the amount of energy needed annually to operate the SWP.
Table 25-13Electricity Generation and Use from Expected Changes in Operation at Existing State Water
Project Facilities as a Result of Implementation of Alternative C (GWh/Year)a
ExistingConditions
NoProject/No
ActionAlternative
AlternativeC
AlternativeC MinusExisting
Conditions
AlternativeC Minus NoProject/No
ActionAlternative
SWP Facilities
Energy Generation Long-Termb 4,326 4,386 4,496 170 110
Dry and Criticalc 3,033 2,909 3,168 136 259
Energy Use Long-Term 7,848 8,088 8,473 625 385
Dry and Critical 6,354 6,013 6,848 494 834
Net Generation Long-Term -3,522 -3,702 -3,977 -455 -275
Dry and Critical -3,321 -3,104 -3,679 -358 -575aResults are estimated using the SWP Power model using data from the CALSIM II model.bLong-Term is the average quantity for the calendar years 1922 to 2002.cDry and Critical is the average quantity for Dry and Critical years according to the Sacramento River 40-30-30 index.
Notes:
GWh/year = gigawatt hours per yearSWP = State Water Project
Alternative C would add approximately 455 GWh of additional net electricity demand over Existing
Conditions on a long-term annual basis and 275 GWh of additional net electricity demand over the No
Project/No Action Alternative on a long-term annual basis.
Additional energy needed to operate existing SWP facilities would be purchased by DWR as part of its
ongoing energy purchasing and scheduling responsibilities for the SWP. Thus, analysis of the GHG impact
of this additional electricity will be analyzed pursuant to the DWR GGERP framework (DWR, 2012a).
Operation of Alternative C would result in additional SWP energy demands in excess of 15 GWh/year;
therefore, the GGERP procedure has been followed for projects that would increase SWP energy demand
by 15 GWh/year or more.
In the GGERP, DWR developed estimates of historical, current, and future GHG emissions. Figure 25-4
shows those emissions as they were projected in the GGERP and how those emissions projections would
change with the additional electricity demands needed to operate the SWP with the addition of
Alternative C. As shown in Figure 25-4, in 2022 (the year that Alternative C is projected to go online),
DWR total emissions would increase from approximately 977,000 metric tons of CO2e to nearly
1.18 million metric tons of CO2e. This elevated level is still approximately 140,000 metric tons of CO2e
This document is not released as a draft EIR pursuant to CEQA Guidelines § 15087. As such, DWR is not soliciting and will not respond to commentssubmitted on this document, although any comments received will be retained and may be considered during preparation of a future draft EIR.

Chapter 25: Climate Change and Greenhouse Gas Emissions
PRELIMINARY – SUBJECT TO CHANGENORTH-OF-THE-DELTA OFFSTREAM STORAGE PROJECT EIR/EIS 25-28 PRELIMINARY ADMINISTRATIVE DRAFT DECEMBER 2013
WBG020812033556SAC/433094/ (25-GHG_CC_PRELIM_ADMIN_DRAFT_DEC2013.DOCX)
below DWR’s designated GHG emissions reduction trajectory red line, which is the linear interpolation
between DWR’s 2020 GHG emissions goal and DWR’s 2050 GHG emissions goal. The projection
indicates DWR has already built in sufficient excess GHG emissions reductions into its future activities
that even with the addition of 455 GWh of demand, DWR would remain below its emissions reduction
trajectory and would maintain its downward trajectory toward achieving its GHG emissions reduction
goals. The calculations associated with projected emissions are included in Appendix 25A.
Given the scale of additional emissions that Alternative C would add to DWR’s total GHG emissions,
DWR finds that no additional actions or commitments are required to implement Alternative C.
As shown in the analysis above and consistent with the analysis contained in the GGERP and associated
Initial Study and Negative Declaration for the GGERP, Alternative C would not adversely affect DWR’s
ability to achieve the GHG emissions reduction goals set forth in the GGERP and would not conflict with any
of the specific action GHG emissions reduction measures set forth in the GGERP. Consistent with the
programmatic analysis framework set up in the GGERP, Alternative C would result in a less-than-significant
impact, when compared to Existing Conditions and the No Project/No Action Alternative.
Existing Central Valley Project Facilities Operational Emissions
DWR’s GGERP cannot be used to evaluate environmental impacts associated with increased CVP
pumping, as emissions associated with CVP are not under DWR’s control and are not included in the
GGERP. Accordingly, GHG emissions resulting from increased CVP energy use are evaluated separately
from GHG emissions generated as a result of SWP energy use.
Table 25-14 shows that under Existing Conditions and No Project/No Action Alternative, the CVP would
generate approximately 3,590 GWh of excess hydroelectric power. This electricity would be sold into the
California electricity market or directly to energy users.
Table 25-14Electricity Generation and Use from Expected Changes in Operation at Existing Central Valley
Project Facilities as a Result of Implementation of Alternative C (GWh/Year)a
ExistingConditions
NoProject/No
ActionAlternative
AlternativeC
AlternativeC MinusExisting
Conditions
AlternativeC Minus NoProject/No
ActionAlternative
CVP Facilitiesb
Energy Generation Long-Termc 4,712 4,701 4,715 3 14
Dry and Criticald 3,533 3,513 3,479 -54 -34
Energy Use Long-Term 1,124 1,116 1,155 31 40
Dry and Critical 894 878 901 8 24
Net Generationd Long-Term 3,588 3,585 3,559 -28 -26
Dry and Critical 2,639 2,635 2,578 -62 -58aResults are estimated using the LT-GEN model using data from the CALSIM II model.bTehama-Colusa Canal pumping facilities are also reported as Project facilities in Table 25-12.cLong-Term is the average quantity for the calendar years 1922 to 2002.dDry and Critical is the average quantity for Dry and Critical years according to the Sacramento River 40-30-30 index.
Notes:
CVP = Central Valley ProjectGWh/year = gigawatt hours per year
This document is not released as a draft EIR pursuant to CEQA Guidelines § 15087. As such, DWR is not soliciting and will not respond to commentssubmitted on this document, although any comments received will be retained and may be considered during preparation of a future draft EIR.
Chapter 25: Climate Change and Greenhouse Gas Emissions
PRELIMINARY – SUBJECT TO CHANGEPRELIMINARY ADMINISTRATIVE DRAFT DECEMBER 2013 25-29 NORTH-OF-THE-DELTA OFFSTREAM STORAGE PROJECT EIR/EISWBG020812033556SAC/433094/ (25-GHG_CC_PRELIM_ADMIN_DRAFT_DEC2013.DOCX)
Implementation of Alternative C would result in an increase of 26 to 28 GWh per year in CVP electricity
use. This additional demand would be served by energy generated at CVP hydroelectric facilities that
emit no GHGs, and therefore, would result in no GHG emissions.
With implementation of Alternative C, operation of the CVP would continue to yield a large net
generation of clean GHG-emissions-free hydroelectric energy. However, the small increase in electricity
usage to operate the CVP with Alternative C would result in a corresponding reduction in the supply of
GHG-emissions-free electricity available to sell to California electricity users. This reduction in
hydroelectric energy available for sale could result in a potential indirect effect from Alternative C, as
electricity users acquire substitute electricity supplies that may result in GHG emissions (although
additional conservation is also a possible outcome as well).
It is unknown what type of power source (e.g., renewable, natural gas) would be substituted for CVP
electricity or if some of the lost power would be made up with higher efficiency. Given State mandates for
renewable energy and incentives for energy efficiency, it is possible that a considerable amount of this power
would be replaced by renewable resources or would cease to be needed as a result of higher efficiency.
However, to ensure a conservative analysis, indirect emissions were quantified for the entire quantity of
electricity (28 GWh) using the current and future statewide energy mix (adjusted to reflect the RPS).
Substitution of 28 GWh of electricity with a mix of sources similar to the current statewide mix
(emissions factor of 300.0 mtCO2e/GWh6) would result in emissions of 8,400 metric tons of CO2e;
however, under expected future conditions (after full implementation of the RPS), emissions would be
6,460 metric tons of CO2e7.
These emissions could contribute to a cumulatively considerable effect, and could, therefore, be a
potentially significant impact, when compared to Existing Conditions and the No Project/No Action
Alternative. However, these emissions would be caused by dozens of independent electricity users
making decisions about different ways to substitute for the lost power. Power purchases by private
entities or public utilities in the private marketplace necessitated by a reduction in available CVP-
generated hydroelectric power are beyond the control of the Lead Agencies. Further, monitoring to
determine the actual indirect change in emissions as a result of Alternative C would not be feasible.
Open Water Surfaces and Tailraces
Refer to the Impact GHG-1 discussion for Alternative A for open water surfaces and tailraces. That
discussion also applies to Alternative C.
Mitigation Measures
Mitigation measures are provided below and summarized in Table 25-15 for the impacts that have been
identified as significant or potentially significant.
Because monitoring to determine the actual indirect change in emissions as a result of proposed Project
operations would not be feasible, and because power purchases by private entities or public utilities in the
private marketplace necessitated by a reduction in available CVP-generated hydroelectric power are
beyond the control of the Lead Agencies, there are no feasible mitigation measures that could reduce this
6 eGrid 2012 Version 1.0 (Year 2009 data) CAMX subregion emissions factor for total output emissions rate.http://www.epa.gov/cleanenergy/documents/egridzips/eGRID2012V1_0_year09_SummaryTables.pdf7 Assumes a total output emissions rate of 230 mtCO2e/GWh based on shift in generation to 33 percent renewables for retail load.
This document is not released as a draft EIR pursuant to CEQA Guidelines § 15087. As such, DWR is not soliciting and will not respond to commentssubmitted on this document, although any comments received will be retained and may be considered during preparation of a future draft EIR.
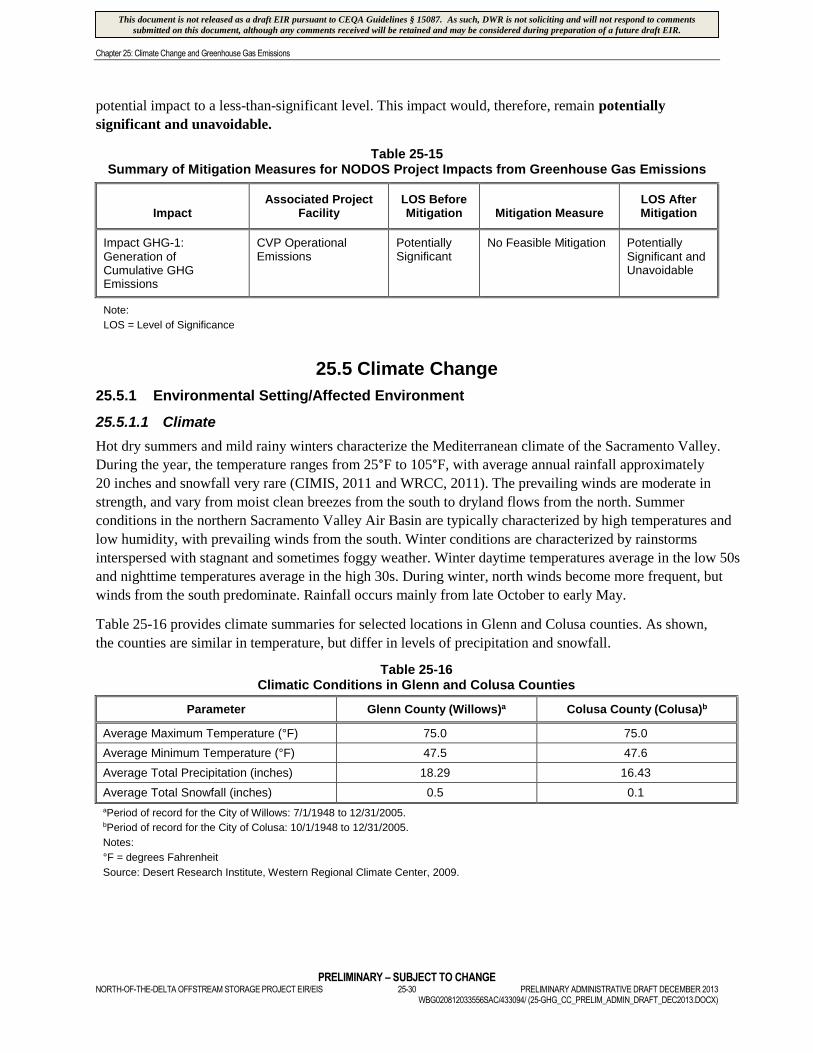
Chapter 25: Climate Change and Greenhouse Gas Emissions
PRELIMINARY – SUBJECT TO CHANGENORTH-OF-THE-DELTA OFFSTREAM STORAGE PROJECT EIR/EIS 25-30 PRELIMINARY ADMINISTRATIVE DRAFT DECEMBER 2013
WBG020812033556SAC/433094/ (25-GHG_CC_PRELIM_ADMIN_DRAFT_DEC2013.DOCX)
potential impact to a less-than-significant level. This impact would, therefore, remain potentially
significant and unavoidable.
Table 25-15Summary of Mitigation Measures for NODOS Project Impacts from Greenhouse Gas Emissions
ImpactAssociated Project
FacilityLOS BeforeMitigation Mitigation Measure
LOS AfterMitigation
Impact GHG-1:Generation ofCumulative GHGEmissions
CVP OperationalEmissions
PotentiallySignificant
No Feasible Mitigation PotentiallySignificant andUnavoidable
Note:
LOS = Level of Significance
25.5 Climate Change
25.5.1 Environmental Setting/Affected Environment
25.5.1.1 Climate
Hot dry summers and mild rainy winters characterize the Mediterranean climate of the Sacramento Valley.
During the year, the temperature ranges from 25°F to 105°F, with average annual rainfall approximately
20 inches and snowfall very rare (CIMIS, 2011 and WRCC, 2011). The prevailing winds are moderate in
strength, and vary from moist clean breezes from the south to dryland flows from the north. Summer
conditions in the northern Sacramento Valley Air Basin are typically characterized by high temperatures and
low humidity, with prevailing winds from the south. Winter conditions are characterized by rainstorms
interspersed with stagnant and sometimes foggy weather. Winter daytime temperatures average in the low 50s
and nighttime temperatures average in the high 30s. During winter, north winds become more frequent, but
winds from the south predominate. Rainfall occurs mainly from late October to early May.
Table 25-16 provides climate summaries for selected locations in Glenn and Colusa counties. As shown,
the counties are similar in temperature, but differ in levels of precipitation and snowfall.
Table 25-16Climatic Conditions in Glenn and Colusa Counties
Parameter Glenn County (Willows)a Colusa County (Colusa)b
Average Maximum Temperature (°F) 75.0 75.0
Average Minimum Temperature (°F) 47.5 47.6
Average Total Precipitation (inches) 18.29 16.43
Average Total Snowfall (inches) 0.5 0.1
aPeriod of record for the City of Willows: 7/1/1948 to 12/31/2005.bPeriod of record for the City of Colusa: 10/1/1948 to 12/31/2005.
Notes:
°F = degrees Fahrenheit
Source: Desert Research Institute, Western Regional Climate Center, 2009.
This document is not released as a draft EIR pursuant to CEQA Guidelines § 15087. As such, DWR is not soliciting and will not respond to commentssubmitted on this document, although any comments received will be retained and may be considered during preparation of a future draft EIR.

Chapter 25: Climate Change and Greenhouse Gas Emissions
PRELIMINARY – SUBJECT TO CHANGEPRELIMINARY ADMINISTRATIVE DRAFT DECEMBER 2013 25-31 NORTH-OF-THE-DELTA OFFSTREAM STORAGE PROJECT EIR/EISWBG020812033556SAC/433094/ (25-GHG_CC_PRELIM_ADMIN_DRAFT_DEC2013.DOCX)
25.5.1.2 Global Climate Trends
Recent Trends
A vast amount of scientific research on climate change, both its causes and effects, at all geographic
scales has been conducted during the last 50 years. Scientific measurements have shown that changes in
the global climate system are already occurring. These include: rising air temperatures; rising ocean
temperatures; rising ocean salinity; rising global sea levels; changes in precipitation patterns; and
increased intensity and frequency of extreme events such as storms, droughts, and wildfires
(IPCC, 2007b; DWR 2009).
The Earth’s average surface temperature rose by 0.74±0.18 °C (1.33±0.32F) over the period 1906 to
2005. The rate of warming over the last half of that period was almost double that for the period as a
whole (IPCC, 2007a). Fourteen of the 15 years from 1997 to 2011 rank among the 15 warmest years in
the instrumental record of global average temperature (going back to 1880) (Blunden and Arndt, 2012).
During the same period over which this increased global warming has occurred, many other changes have
occurred in other natural systems. Sea levels have risen on average 1.8 millimeters (0.07 inch) per year;
precipitation patterns throughout the world have shifted, with some areas becoming wetter and others
drier; tropical cyclone activity in the North Atlantic has increased; peak runoff timing of many glacial and
snowfed rivers has shifted earlier; and numerous other changed conditions have been observed. Although
it is difficult to prove a definitive cause and effect relationship between global warming and other
observed changes to natural systems, there is high confidence in the scientific community that these
changes are a direct result of increased global temperatures (IPCC, 2007a).
Much of the western United States has experienced warming during the 20th century (roughly 2°F
[1.1°C]) and is projected to experience further warming during the 21st century with central estimates
varying from roughly 5°F to 7°F (2.8°C to 3.8°C), depending on location (Reclamation, 2011a).
Historical trends in annual precipitation are less apparent. Future projections suggest that the northwestern
and north-central portions of the United States gradually may become wetter (e.g., Columbia Basin and
Missouri River basin) while the southwestern and south-central portions may gradually become drier
(e.g., San Joaquin, Truckee, and Rio Grande river basins and the Middle to Lower Colorado River Basin).
Areas in between have median projected changes closer to no change, meaning they have roughly equal
chances of becoming wetter or drier (e.g., Klamath and Sacramento basins and the Upper Colorado
Basin). These summary statements refer to median projected changes in temperature and precipitation,
characterized generally across the western United States. Projections show that there is significant
variability and uncertainty about these projected conditions both geographically and with time
(Reclamation, 2011a).
Warming trends appear to have led to a shift in cool season precipitation toward more rain and less snow,
which has caused increased rainfall runoff volume during the cool season accompanied by less snowpack
accumulation in some western United States locations (Reclamation, 2011a). Hydrologic analyses-based
future climate projections suggest that warming and associated loss of snowpack will persist over much of
the western United States. However, there are some geographic contrasts. Snowpack losses are projected
to be greatest where the baseline climate is closer to freezing thresholds (e.g., lower lying valley areas and
lower altitude mountain ranges). It also appears that, in high altitude and high latitude areas, there is a
chance that cool season snowpack actually could increase during the 21st century (e.g., Columbia
headwaters in Canada, Colorado headwaters in Wyoming), because precipitation increases are projected
and appear to offset the snow-reduction effects of warming in these locations (Reclamation, 2011a).
This document is not released as a draft EIR pursuant to CEQA Guidelines § 15087. As such, DWR is not soliciting and will not respond to commentssubmitted on this document, although any comments received will be retained and may be considered during preparation of a future draft EIR.

Chapter 25: Climate Change and Greenhouse Gas Emissions
PRELIMINARY – SUBJECT TO CHANGENORTH-OF-THE-DELTA OFFSTREAM STORAGE PROJECT EIR/EIS 25-32 PRELIMINARY ADMINISTRATIVE DRAFT DECEMBER 2013
WBG020812033556SAC/433094/ (25-GHG_CC_PRELIM_ADMIN_DRAFT_DEC2013.DOCX)
Average sea level rise over the period 1961 to 2003 was 1.8 millimeters (0.07 inch) per year. Over the
period of 1993 to 2003, the rate of sea level rise increased to 3.1 millimeters (0.12 inch) per year. Total
average worldwide sea level rise over the 20th century has been 6.7 inches (IPCC, 2007a). Observed
trends in sea level rise can be attributed to both thermal expansion of the world’s oceans and the melting
of ice sheets (polar and alpine). Also during a similar period (1900 to 2007), measurements have shown
increases in global ocean temperature (since 1961); a decline in the extent of mountain glaciers and global
snow cover; increased atmospheric water vapor content; loss in mass of the polar ice sheets; decreased
extent of Arctic sea ice; increased precipitation in the eastern portions of North and South America,
northern Europe and northern and central Asia; drying conditions in the Sahel region of the Sahara Desert
in Africa, the Mediterranean, and southern Africa; strengthening in mid-latitude westerly winds (since the
1960s); more intense and longer drought conditions in the tropics and sub-tropics (since the 1970s);
increased frequency of extreme precipitation events over land areas; higher average night time
temperatures; decreased frost days and increased frequency and duration of extreme heat events (since the
1950s); and increased tropical cyclone activity in the North Atlantic (IPCC, 2007a). There may also be
additional synergistic impacts of extreme weather events, such as the sea level rise coupled with high tide
and extreme storm surges. The above listed changes are, in turn, resulting in changes to the climate of
California as the regional climate is moderated by sea surface temperature, westerly wind patterns, the El
Niño Southern Oscillation (ENSO), and Pacific storm patterns.
Projections to 2100
Climate models indicate that global average surface temperature will increase at a rate of approximately
0.4°F (0.2°C) per decade for the period 2000 to 2020, and will increase by at least that amount per decade
during the period 2020 to 2080. Based on a number of emissions scenarios, the IPCC projected an
average increase in surface temperatures of 3.2 to 7.2°F by 2100 compared to 1980 through 1999 levels,
with a likely range of 2.0 to 11.5°F when accounting for the uncertainty in climate science (IPCC, 2007a).
Approximately half of this warming is the result of past GHG emissions and will occur even if GHG
emissions were halted at 2000 levels. Some regions of the globe, particularly high latitudes, will
experience much larger changes relative to Existing Conditions. Corresponding global average sea level
rise during the period 2000 to 2100 are estimated to be between seven inches (18 centimeters) and
23 inches (58 centimeters) (IPCC, 2007a). However, recent scientific data now strongly suggests that
these sea level rise projections are likely too low and that actual sea level rise may be significantly greater
than initially estimated (Rahmstorf, 2007; NRC, 2012).8
The following additional changes to the global climate system are projected: increased ocean acidity due
to increased carbon dioxide uptake by the oceans; reduced global snow cover; increased thaw depth in
permafrost regions; decrease in sea ice with potential full disappearance in summer months; increased
frequency in heat waves and heavy precipitation events; increased intensity of tropical cyclone events;
northward movement of extra-tropical storm tracks; increased precipitation at high latitudes and
decreased precipitation in tropical and sub-tropical regions; and increased melting of the ice sheets
(IPCC, 2007a).
8California agencies, including the Bay Conservation and Development Commission (BCDC) and DWR, are using the more recentdata of Rahmstorf et al. 2007 in their sea level rise planning efforts in lieu of the estimates reported by IPCC in the Fourth AssessmentReport.
This document is not released as a draft EIR pursuant to CEQA Guidelines § 15087. As such, DWR is not soliciting and will not respond to commentssubmitted on this document, although any comments received will be retained and may be considered during preparation of a future draft EIR.

Chapter 25: Climate Change and Greenhouse Gas Emissions
PRELIMINARY – SUBJECT TO CHANGEPRELIMINARY ADMINISTRATIVE DRAFT DECEMBER 2013 25-33 NORTH-OF-THE-DELTA OFFSTREAM STORAGE PROJECT EIR/EISWBG020812033556SAC/433094/ (25-GHG_CC_PRELIM_ADMIN_DRAFT_DEC2013.DOCX)
25.5.1.3 Climate Change Effects on California
Recent Trends
Scientific measurements and observations indicate that California’s climate is already changing in a
manner consistent with what would be expected from global climate change. Since 1920, California’s
average temperature has been increasing, although this change, or any climate change impact, is not
uniform across California. Nighttime temperatures are rising across California and at a higher rate than
daytime temperatures. Further, daytime and nighttime heat wave events throughout California have
increased in intensity, particularly the nighttime component (Moser et al., 2009).
Water level measurements from the San Francisco gage (CA Station ID: 9414290) indicate that mean sea
level rose by an average of 2.01 millimeters (mm) (0.08 inch) per year from 1897 to 2006, equivalent to a
change of eight inches in the last century (CCCC, 2009).
California’s water supply system is dependent on snowpack storage in the Sierra Nevada. Temperatures over
the Sierra Nevada have increased during the last 100 years, resulting in less snowfall (and more rainfall) and
an earlier snowmelt (Moser et al., 2009). From 1930 to 2009, the peak timing of Sierra Nevada runoff
analyzed by Kapnick and Hall (2009) exhibited a trend toward earlier in the season of 0.4 day per decade. The
average early spring snowpack in the Sierra Nevada has decreased by approximately 10 percent since the
early 20th century, a loss of 1.5 million acre-feet of snowpack storage (DWR, 2008).
Data also show evidence for the following additional changes to California climate and conditions during the
last 50 years: the warming of Lake Tahoe; decreasing chill hours and increased stresses on California
agriculture; shifts and disturbances in managed landscapes; increased frequency of wildfire; changes in Santa
Ana winds; increases in photochemical smog production in southern California; increased frequency and
intensity of heat wave events; changes in the El Niño Southern Oscillation and the impact on California
temperatures; and changes in extreme precipitation events and daily average precipitation (CEC, 2011).9
Plants and animals around the globe are already reacting to changes caused by increasing temperatures. In
California, species are also reacting to extreme conditions, including heat waves (and the fires generated
by that heat), cold snaps, droughts (and the Delta saltwater intrusion that droughts often cause), floods,
and coastal upwelling. Observed changes also include altered timing of animal and plant lifecycles
(phenology), disruption of biotic interactions, changes in physiological performance, species range and
abundance, increase in invasive species, altered migration patterns of fishes, aquatic-breeding
amphibians, birds and mammals, changes in forage base, local extinction of plant and animal populations,
and changes in habitat, vegetation structure, and plant and animal communities (DFG, 2010).
Projections to 2100
Average annual surface temperatures for California are projected to increase by between 2F and 5F by
2050 and between 4F and 9F by 2100, depending on the GHG emissions scenario assumed. Warming
will not be uniform seasonally or across California. Climate models project a greater amount of warming
during summer months, during nighttime, and in the interior regions of California. Chill hours in the
Central Valley are expected to decrease, but unprecedented extremes of cold weather are still possible
(Gershunov, 2011). Changes in temperature and humidity have implications for agriculture in the Central
9The State of California under the auspices of the California Energy Commission (CEC) is conducting comprehensive and detailedresearch into a range of climate change impacts in California as well as research aimed at developing adaptation strategies to dealwith impacts already underway and that can no longer be avoided. The majority of this research is available through the CaliforniaClimate Change Portal. Available at: <http://www.climatechange.ca.gov/>.
This document is not released as a draft EIR pursuant to CEQA Guidelines § 15087. As such, DWR is not soliciting and will not respond to commentssubmitted on this document, although any comments received will be retained and may be considered during preparation of a future draft EIR.
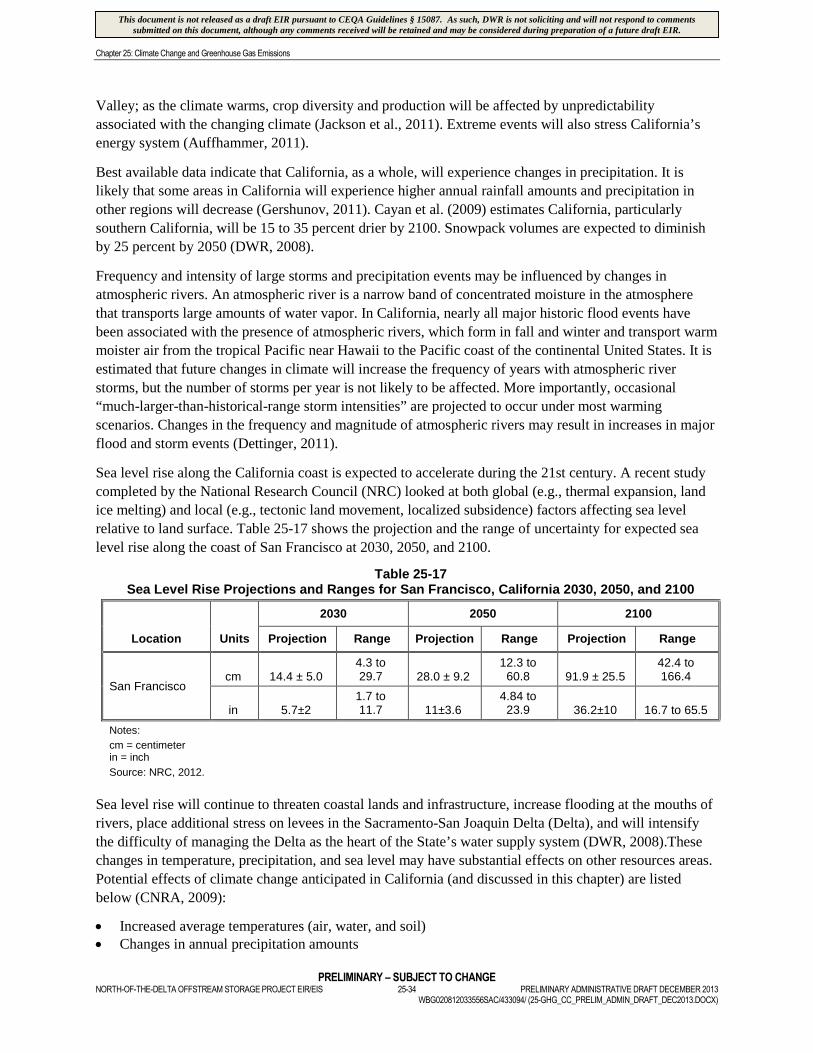
Chapter 25: Climate Change and Greenhouse Gas Emissions
PRELIMINARY – SUBJECT TO CHANGENORTH-OF-THE-DELTA OFFSTREAM STORAGE PROJECT EIR/EIS 25-34 PRELIMINARY ADMINISTRATIVE DRAFT DECEMBER 2013
WBG020812033556SAC/433094/ (25-GHG_CC_PRELIM_ADMIN_DRAFT_DEC2013.DOCX)
Valley; as the climate warms, crop diversity and production will be affected by unpredictability
associated with the changing climate (Jackson et al., 2011). Extreme events will also stress California’s
energy system (Auffhammer, 2011).
Best available data indicate that California, as a whole, will experience changes in precipitation. It is
likely that some areas in California will experience higher annual rainfall amounts and precipitation in
other regions will decrease (Gershunov, 2011). Cayan et al. (2009) estimates California, particularly
southern California, will be 15 to 35 percent drier by 2100. Snowpack volumes are expected to diminish
by 25 percent by 2050 (DWR, 2008).
Frequency and intensity of large storms and precipitation events may be influenced by changes in
atmospheric rivers. An atmospheric river is a narrow band of concentrated moisture in the atmosphere
that transports large amounts of water vapor. In California, nearly all major historic flood events have
been associated with the presence of atmospheric rivers, which form in fall and winter and transport warm
moister air from the tropical Pacific near Hawaii to the Pacific coast of the continental United States. It is
estimated that future changes in climate will increase the frequency of years with atmospheric river
storms, but the number of storms per year is not likely to be affected. More importantly, occasional
“much-larger-than-historical-range storm intensities” are projected to occur under most warming
scenarios. Changes in the frequency and magnitude of atmospheric rivers may result in increases in major
flood and storm events (Dettinger, 2011).
Sea level rise along the California coast is expected to accelerate during the 21st century. A recent study
completed by the National Research Council (NRC) looked at both global (e.g., thermal expansion, land
ice melting) and local (e.g., tectonic land movement, localized subsidence) factors affecting sea level
relative to land surface. Table 25-17 shows the projection and the range of uncertainty for expected sea
level rise along the coast of San Francisco at 2030, 2050, and 2100.
Table 25-17Sea Level Rise Projections and Ranges for San Francisco, California 2030, 2050, and 2100
Location Units
2030 2050 2100
Projection Range Projection Range Projection Range
San Franciscocm 14.4 ± 5.0
4.3 to29.7 28.0 ± 9.2
12.3 to60.8 91.9 ± 25.5
42.4 to166.4
in 5.7±21.7 to11.7 11±3.6
4.84 to23.9 36.2±10 16.7 to 65.5
Notes:
cm = centimeterin = inch
Source: NRC, 2012.
Sea level rise will continue to threaten coastal lands and infrastructure, increase flooding at the mouths of
rivers, place additional stress on levees in the Sacramento-San Joaquin Delta (Delta), and will intensify
the difficulty of managing the Delta as the heart of the State’s water supply system (DWR, 2008).These
changes in temperature, precipitation, and sea level may have substantial effects on other resources areas.
Potential effects of climate change anticipated in California (and discussed in this chapter) are listed
below (CNRA, 2009):
Increased average temperatures (air, water, and soil) Changes in annual precipitation amounts
This document is not released as a draft EIR pursuant to CEQA Guidelines § 15087. As such, DWR is not soliciting and will not respond to commentssubmitted on this document, although any comments received will be retained and may be considered during preparation of a future draft EIR.

Chapter 25: Climate Change and Greenhouse Gas Emissions
PRELIMINARY – SUBJECT TO CHANGEPRELIMINARY ADMINISTRATIVE DRAFT DECEMBER 2013 25-35 NORTH-OF-THE-DELTA OFFSTREAM STORAGE PROJECT EIR/EISWBG020812033556SAC/433094/ (25-GHG_CC_PRELIM_ADMIN_DRAFT_DEC2013.DOCX)
Change from snowfall (and spring snowmelt) to rainfall Decreased Sierra snowpack (earlier runoff, reduced maximum storage) Increased evapotranspiration Increased frequency and intensity of Pacific storms (flood events) Increased severity of droughts Increased frequency and severity of extreme heat events Increased frequency and severity of wildfire events Sea level rise (with increased salt water intrusion in the Delta) Changes in species distribution and ranges Decreased number of species Increased number of vector-borne diseases and pests (including impacts to agriculture) Altered timing of animal and plant lifecycles (phenology) Disruption of biotic interactions Changes in physiological performance, including reproductive success and survival of plants and animals Increase in invasive species Altered migration patterns of fishes, aquatic-breeding amphibians, birds, and mammals Changes in food (forage) base
Changes in habitat, vegetation structure, and plant and animal communities
These changes have significant implications for water quality, water supply, flooding, aquatic ecosystems,
energy generation, and recreation throughout the State. Several guidance documents have been drafted or
have been published to discuss strategies to protect resources from climate change in California, such as
the 2009 California Climate Adaptation Strategy (CNRA, 2009).
25.5.1.4 Climate Change and Sea Level Rise Effects on California’s Water Resources
Although measured effects of climate change are occurring, significant uncertainty remains about the
specific magnitude and in some cases even the direction of changes expected in the future. Temperature,
precipitation, and sea level are all expected to change and will affect California’s water resources in
measureable ways.
Numerous studies and publications have noted the importance of considering climate change in water
resources planning. The California Water Plan update 2009 states, “planning for and adapting to [climate]
changes … will be among the most significant challenges facing water and flood managers this century”
(DWR, 2009). Both DWR and Reclamation have noted the need to consider climate change effects in
water resources planning studies. For the purposes of this Draft EIR/EIS and the companion Draft
Feasibility Report, the potential effects of climate change on California’s water resources, as well as on
the proposed Project alternatives, are considered.
25.5.1.5 Water Management and Climate
Water management includes the development and fulfillment of operating schemes on a variety of time
scales from days to decades (Reclamation, 2011a). Within water management planning, climate
characterization informs estimations of future water supplies, future water demands, and boundaries of
system operation. Climate information influences evaluation of resource management strategies through
assumptions or characterization of future potential temperature, precipitation, and runoff conditions
among other weather information. Water supply estimates are developed by making determinations of
what Wet, Dry, and Normal periods may be like in the future and include the potential for hydrologic
extremes that can create flood risks and droughts. Water demand estimates are developed across water
This document is not released as a draft EIR pursuant to CEQA Guidelines § 15087. As such, DWR is not soliciting and will not respond to commentssubmitted on this document, although any comments received will be retained and may be considered during preparation of a future draft EIR.
Chapter 25: Climate Change and Greenhouse Gas Emissions
PRELIMINARY – SUBJECT TO CHANGENORTH-OF-THE-DELTA OFFSTREAM STORAGE PROJECT EIR/EIS 25-36 PRELIMINARY ADMINISTRATIVE DRAFT DECEMBER 2013
WBG020812033556SAC/433094/ (25-GHG_CC_PRELIM_ADMIN_DRAFT_DEC2013.DOCX)
management system uses, which include both the natural and the socioeconomic systems, including
agriculture, municipal and industrial, environmental, and hydroelectric power generation.
25.5.1.6 Water Management, Climate Change Effects, and Associated Challenges
There are climate change effects and challenges that are especially relevant to water resources. These
effects and challenges are described below as background to the climate change sensitivity analysis.
Reclamation Literature Synthesis
To support longer-term planning processes, Reclamation has created a region-specific literature synthesis
of studies relating to climate change implications for Reclamation operations and activities in the
17 western states (Reclamation, 2011b). This report summarizes recent literature on the past and projected
effects of climate change on hydrology and water resources, and summarizes implications for key
resource areas featured in Reclamation planning processes. The Mid-Pacific Region section of the report
describes scientific studies related to climate change for an area that includes most of California, as well
as the Klamath River watershed that originates in southern Oregon and the Lahontan watershed that is
mainly in Nevada. The Colorado River basin of California is not included within the region. Several
observations from the Mid-Pacific Region literature synthesis are listed below by category:
Historical Climate and Hydrology
Western United States spring temperatures increased 1 to 3°C (1.8 to 5.4F) between the 1970s and
late 1990s. Increasing winter temperature trends observed in central California averaged
approximately 0.5°C (0.9F) per decade from the late 1940s to the early 1990s (Dettinger and Cayan
1995).
Increased winter precipitation trends are noted during 1950 to 1999 at many western United States
sites, including several in California’s Sierra Nevada; but a consistent region-wide trend is not
apparent.
Coincident with these trends, the western United States and Mid-Pacific Region also experienced a
general decline in spring snowpack, reduced snowfall to winter precipitation ratios, and earlier
snowmelt runoff from the late 1940s to early 2000s.
On explaining historical trends in regional climate and hydrology, several studies indicate that most
observed trends for snow water equivalent (SWE), soil moisture, and runoff in the western United
States are the result of increasing temperatures rather than precipitation effects (Lettenmaier et al.,
2008).
In many Mid-Pacific Region headwater basins, even with precipitation being equal, warmer
temperatures in these watersheds cause reduced snowpack development during winter, more runoff
during the winter season, and earlier spring peak flows associated with an earlier snowmelt.
Projected Future Climate and Hydrology
Several studies have been conducted to relate potential future climate scenarios to Mid-Pacific Region
runoff and water resources management impacts. In general, there is greater agreement reported
between model projections of temperature and, thus, higher confidence in future temperature change
relative to precipitation change.
Several studies have examined potential hydrologic impacts associated with projected climate change.
Analyses show that runoff could occur as much as two months earlier than what currently occurs, and
This document is not released as a draft EIR pursuant to CEQA Guidelines § 15087. As such, DWR is not soliciting and will not respond to commentssubmitted on this document, although any comments received will be retained and may be considered during preparation of a future draft EIR.

Chapter 25: Climate Change and Greenhouse Gas Emissions
PRELIMINARY – SUBJECT TO CHANGEPRELIMINARY ADMINISTRATIVE DRAFT DECEMBER 2013 25-37 NORTH-OF-THE-DELTA OFFSTREAM STORAGE PROJECT EIR/EISWBG020812033556SAC/433094/ (25-GHG_CC_PRELIM_ADMIN_DRAFT_DEC2013.DOCX)
earlier runoff timing of at least 15 days in early-, middle-, and late-season flow is projected for almost
all mountainous areas where runoff is snowmelt driven.
Future impacts on hydrology have been shown to have implications for water resources management.
Management of western United States reservoir systems is very likely to become more challenging as
net annual runoff decreases and interannual patterns continue to change as the result of climate
change.
Recently developed climate projection scenarios (Moser et al., 2009) suggest that current climate
projections for California would lead to decreased snowpack by the end of the century (20 to
40 percent, depending on emissions scenarios), increased risk of winter flooding, earlier timing of
meltwater runoff and greater vulnerability to summer shortfalls, decreased hydropower generation
(under dry warming), and decreased quality of winter recreation.
Studies of Impacts on Natural Resources
Biodiversity may be affected by climate change (Janetos et al., 2008), and many studies have been
published about the impacts of climate change on individual species and ecosystems. Climate change
also has affected forest insect species range and abundance through changes in insect survival rates,
increases in life cycle development rates, facilitation of range expansion, and the effect on host plant
capacity to resist attack (Ryan et al., 2008). Predicted future impacts are primarily associated with
projected increases in air and water temperatures and are expected to result in poleward shifts in the
range of many species, adjustment of migratory species arrival and departure, amphibian population
declines, and effects on pests and pathogens in ecosystems.
Studies of the effects of climate change on agriculture and water resources focus on the many issues
associated with future agricultural water demands; only a few studies have attempted to predict
climate change impacts on irrigation demands. Limited study findings suggest significant irrigation
requirement increases for corn and alfalfa, demand decreases due to crop failures caused by pests and
disease exacerbated by climate change, and demand increases if growing seasons become longer or
farming practices are adapted by planting more crop cycles per growing season.
Increased air temperatures could increase aquatic temperatures and affect fisheries habitat. In general,
studies of climate change impacts on freshwater ecosystems are more straightforward with streams
and rivers, which are typically well mixed and track air temperature closely, as opposed to lakes and
reservoirs, where thermal stratification and depth affect habitat (Allan et al., 2005).
Warmer water temperatures also could exacerbate invasive species issues (e.g., quagga mussel
reproduction cycles would respond favorably to warmer water temperatures); moreover, climate
change could decrease the effectiveness of chemical or biological agents used to control invasive
species (Hellmann et al., 2008). Warmer water temperatures also could facilitate the growth of algae,
which could result in eutrophic conditions in lakes, declines in water quality (Lettenmaier et al.,
2008), and changes in species composition.
Another potential effect of climate change impacts on ecosystems and watershed hydrology involves
changes in vegetation disturbances due to wildfires and forest dieback. In the western United States,
increases in spring-summer temperatures lead to reduced snow melt, soil moisture, and fuel moisture
conditions. These reductions, in turn, affect wildland fire activity.
This document is not released as a draft EIR pursuant to CEQA Guidelines § 15087. As such, DWR is not soliciting and will not respond to commentssubmitted on this document, although any comments received will be retained and may be considered during preparation of a future draft EIR.

Chapter 25: Climate Change and Greenhouse Gas Emissions
PRELIMINARY – SUBJECT TO CHANGENORTH-OF-THE-DELTA OFFSTREAM STORAGE PROJECT EIR/EIS 25-38 PRELIMINARY ADMINISTRATIVE DRAFT DECEMBER 2013
WBG020812033556SAC/433094/ (25-GHG_CC_PRELIM_ADMIN_DRAFT_DEC2013.DOCX)
Studies on Historical Sea Level Trends and Projected Sea Level Rise Under Climate Change
Sea level conditions at San Francisco Bay’s Golden Gate Bridge (Golden Gate) affect water level and
salinity conditions in the upstream Delta. Throughout the 20th century, sea levels near San Francisco
Bay increased by more than 0.21 meters (8 inches) (Anderson et al., 2006).Veermeer and Rahmstorf,
(2009) present a dual component relationship with short- and long-term sea level response
components to temperature change. Based on this work and applying the IPCC emission scenarios, by
2100, sea levels are predicted to be 1 to 2 meters (39.4 to 78.7 inches) higher than at present.
Climate Change Challenges
DWR has noted similar anticipated effects and associated challenges for California’s water resources. The
trends of the last century – especially the increases in hydrological variability – will likely intensify this
century, and abrupt changes in climate could also occur (DWR, 2008). DWR’s list of climate change
challenges includes the following:
Loss of Natural Snowpack Storage: One of the most critical impacts for California water
management may be the projected reduction in the Sierra Nevada snowpack – California’s largest
surface “reservoir.” Snowmelt currently provides an annual average of 15 million acre-feet of water,
slowly released between April and July each year. Much of the State’s water infrastructure was
designed to capture the slow spring runoff and deliver it during the drier summer and fall months.
Based upon historical data and modeling, DWR projects that the Sierra snowpack will experience a
25 to 40 percent reduction from its historic average by 2050.
Drought: Warming temperatures, combined with changes in rainfall and runoff patterns will
exacerbate the frequency and intensity of droughts. Regions that rely heavily upon surface water
(rivers, streams, and lakes) could be particularly affected as runoff becomes more variable, and more
demand is placed on groundwater. Along with drier soils, forests will experience more frequent and
intense fires, resulting in subsequent changes in vegetation, and eventually a reduction in the water
supply and storage capacity benefits of a healthy forest. Climate change will also affect water
demand. Warmer temperatures will likely increase evapotranspiration rates and extend growing
seasons, thereby increasing the amount of water that is needed for the irrigation of many crops, urban
landscaping and environmental water needs. Other challenge factors related to drought include stress
upon the State’s forests, environment, non-irrigated agriculture and rangeland, and recreation.
Floods: The amount of snow is critical for water supply and environmental needs, but so is the timing
of snowmelt runoff into rivers and streams. Rising snowlines caused by climate change will allow
more of the Sierra Nevada watersheds to contribute to peak storm runoff. Along with reductions in
the amount of the snowpack and accelerated snowmelt, scientists project greater storm intensity,
resulting in more direct runoff and flooding. Other related challenge factors include erosion, habitat,
and water quality. Flood planners will need to factor a new level of safety into the design, operation,
and regulation of flood protection facilities such as dams, floodways, bypasses and levees, as well as
the design of local sewers and storm drains.
Water Quality: Changes in the timing of river flows and warming atmospheric temperatures may
affect water quality and water uses in many different ways. Among other water quality effects,
warmer water will distress many fish species and could require additional cold water reservoir
releases.
This document is not released as a draft EIR pursuant to CEQA Guidelines § 15087. As such, DWR is not soliciting and will not respond to commentssubmitted on this document, although any comments received will be retained and may be considered during preparation of a future draft EIR.

Chapter 25: Climate Change and Greenhouse Gas Emissions
PRELIMINARY – SUBJECT TO CHANGEPRELIMINARY ADMINISTRATIVE DRAFT DECEMBER 2013 25-39 NORTH-OF-THE-DELTA OFFSTREAM STORAGE PROJECT EIR/EISWBG020812033556SAC/433094/ (25-GHG_CC_PRELIM_ADMIN_DRAFT_DEC2013.DOCX)
Sea Level Rise: Sea levels are rising, and it is generally accepted that this trend will continue and
likely accelerate. However, the exact rate of rise is unknown, due to ongoing scientific uncertainty
about the melting of ice sheets on western Antarctica and Greenland and the potential for abrupt
changes in ocean conditions.
The Delta (i.e., channels and waterways) serves as an integral component of California’s water supply
system. Much of the Delta is located at or near sea level and is influenced by tidal conditions. Delta water
supplies and aquatic habitat will be affected by sea level rise due to saltwater intrusion. An increase in the
penetration of seawater into the Delta will further degrade drinking and agricultural water quality and
alter ecosystem conditions. More freshwater releases from upstream reservoirs will be required to
maintain salinity levels for municipal, industrial, agricultural, and existing ecological water uses.
Hydroelectric Generation: Climate change will reduce the reliability of California’s hydroelectricity
operations, which, according to the California Climate Action Registry and the California Air
Resources Board, is the State’s largest source of greenhouse gas emissions-free energy. Changes in
the timing of inflows to reservoirs may exceed generation capacity, forcing water releases over
spillways and resulting in lost opportunities to generate hydropower. Higher snow elevations,
decreased snowpack, and earlier snowmelt may result in less water available for clean power
generation during hot summer months, when energy demand is highest. The impact is compounded
overall by anticipated increased energy consumption due to higher temperatures and greater water
demands in summer when less water is available.
25.5.2 Environmental Impacts/Environmental Consequences
25.5.2.1 Climate Change and Sea Level Rise Sensitivity Analysis
Climate Change Effects on the Proposed Project
A detailed and comprehensive analysis of the effects of the proposed Project alternatives, assuming
current climate and variability, is presented in each of the resource chapters of this document (i.e.,
Chapters 6 though 31). The sensitivity analysis of potential climate change effects on the proposed Project
alternatives is described below. The climate change sensitivity analysis and results are described in
greater detail in Appendix 25B. The sensitivity analysis uses a methodology that was selected because of
its ability to depict both a trend and a potential range of effects.
This sensitivity analysis attempts to help answer the following questions:
How would climate change and sea level rise effects (especially modified runoff and hydrology)
influence diversion to proposed Project storage?
How would climate change and sea level rise affect the proposed Project’s ability to provide system
flexibility (i.e., water in storage)?
How would climate change and sea level rise affect the ability of the proposed Project to provide
primary objective benefits, including water supply reliability, fish survival, Delta water quality, and
flexible hydropower generation?
How would climate change and sea level rise affect the environmental effects of the proposed Project?
The NODOS climate change and sea level rise sensitivity analysis has been prepared as a tool for
planners, resources specialists, stakeholders, and the public to consider the influence of climate change
and sea level rise on the performance of the proposed Project and on the potential effects of the proposed
This document is not released as a draft EIR pursuant to CEQA Guidelines § 15087. As such, DWR is not soliciting and will not respond to commentssubmitted on this document, although any comments received will be retained and may be considered during preparation of a future draft EIR.

Chapter 25: Climate Change and Greenhouse Gas Emissions
PRELIMINARY – SUBJECT TO CHANGENORTH-OF-THE-DELTA OFFSTREAM STORAGE PROJECT EIR/EIS 25-40 PRELIMINARY ADMINISTRATIVE DRAFT DECEMBER 2013
WBG020812033556SAC/433094/ (25-GHG_CC_PRELIM_ADMIN_DRAFT_DEC2013.DOCX)
Project. The sensitivity analysis provides a context for consideration of uncertainty and anticipated trends
due to climate change throughout the planning horizon for the proposed Project. A comparison of the No
Project/No Action Alternative, with and without climate change and sea level rise, is intended to help the
reader understand the trend and potential range of effects upon California’s major water systems
associated with climate change and sea level rise. In addition, the sensitivity analysis is intended to help
the reader understand how the trend and range of potential climate change and sea level rise effects will
impact the performance of the proposed Project action alternatives.
Provided below is a description of the methodology used for the sensitivity analysis and some of the
results and findings of the sensitivity analysis.
Approach and Assumptions
NODOS Project Detailed Evaluation Scenarios
In the detailed evaluation of the proposed Project alternatives in the DEIR/EIS and Draft Feasibility
Report, the SWP and CVP operations model (CALSIM II) was used to simulate the following scenarios,
assuming the current climate and sea level condition:
Existing Conditions
No Project/No Action Alternative
Alternative A: includes a 1.27-MAF Sites Reservoir with conveyance to and from the reservoir
provided by the existing Tehama-Colusa (T-C) and GCID canals and a new Delevan Pipeline
(2,000 cfs diversion/1,500-cfs release)
Alternative B: includes a 1.81-MAF Sites Reservoir with conveyance to and from the reservoir
provided by the existing T-C and GCID canals, and a new release-only Delevan Pipeline (1,500-cfs
release)
Alternative C: includes a 1.81-MAF Sites Reservoir with conveyance to and from the reservoir
provided by the existing T-C and GCID canals and a new Delevan Pipeline (2,000-cfs
diversion/1,500-cfs release)
The detailed evaluation of the proposed Project alternatives also used several hydrologic, operations,
water quality, fisheries, riverine geomorphic and sediment, power, and economics models. The detailed
evaluation involved the simulation and analysis of more than 100 parameters describing water flow,
storage, diversion, temperature, salinity, fish population and mortality, power generation and use, and
various revenues and costs associated with the water system included in the three study areas. A more
detailed description of the suite of models that were used is presented in Appendix 6B.
For the climate change and sea level rise sensitivity analysis, the No Project/No Action Alternative and
Alternatives A, B, and C were simulated for four additional climate and sea level scenarios. However, the
modeling for the sensitivity analysis included only the CALSIM II operations simulation model. The
CALSIM II model description, assumptions, and results are included in Appendix 6A and Appendix 6C.
This document is not released as a draft EIR pursuant to CEQA Guidelines § 15087. As such, DWR is not soliciting and will not respond to commentssubmitted on this document, although any comments received will be retained and may be considered during preparation of a future draft EIR.

Chapter 25: Climate Change and Greenhouse Gas Emissions
PRELIMINARY – SUBJECT TO CHANGEPRELIMINARY ADMINISTRATIVE DRAFT DECEMBER 2013 25-41 NORTH-OF-THE-DELTA OFFSTREAM STORAGE PROJECT EIR/EISWBG020812033556SAC/433094/ (25-GHG_CC_PRELIM_ADMIN_DRAFT_DEC2013.DOCX)
Climate and Sea Level Scenarios
The climate and sea level scenarios used in this sensitivity analysis were previously developed for the Bay
Delta Conservation Plan10 (BDCP) Effects Analysis and DEIR/S11 and documented in the BDCP Effects
Analysis Appendix 5.A.2 (DWR, 2012b) and the BDCP DEIR/S Appendix 5A (DWR, 2012c).The
DWR modeling team developed climate and sea level scenarios for evaluation of the BDCP alternatives.
The Lead Agencies for the BDCP collaborated on the methodology and approved the selection and use of
scenarios for the Effects Analysis and DEIR/S for that program. The BDCP appendix describes the
methodology and selection of the climate and sea level scenarios and the development of the inputs and
modifications for the CALSIM II model. This methodology separates potential climate futures into
quadrants (Q1to Q4 and a central or median “quadrant” called Q5), where temperature increase and
precipitation varies. A more detailed discussion of the quadrants is found below in the Climate Scenarios
discussion. The concept of the quadrants is illustrated in Figure 25-5, which shows an example of using
the quadrants to describe climate in the Feather River basin.
For the NODOS Project sensitivity analysis, four climate and sea level scenarios, in addition to the
current climate and sea level scenario (Current), were selected for comparative analyses:
The Early Long Term (ELT) scenario assuming the median (Q5) of an ensemble of Global Climate
Model (GCM) projections at a point in time 15 years into the future (from the baseline date of 2009
for BDCP and also referred to as approximately 2025) and a sea level rise of 15 cm (6 inches). The
ELT Q5 scenario is referred to later in this section as one point in the climate change trend.
The Late Long Term (LLT) Q5 scenario assuming the median of an ensemble of GCM projections at
a point in time 50 years into the future (~2060) and a sea level rise of 45 cm (18 inches). The
LLT Q5 scenario is also referred to later in this section as one point in the climate change trend.
The LLT Q2 scenario assuming the “drier, more warming” lower bound (Q2) of an ensemble of GCM
projections at a point in time 50 years into the future (~2060) and a sea level rise of 45 cm (18
inches). The LLT Q2 scenario is referred to later in this section as the Lower potential range of effect
associated with climate change.
The LLT Q4 scenario assuming the “wetter, less warming” upper bound (Q4) of an ensemble of
GCM projections at a point in time 50 years into the future (~2060) and a sea level rise of 45 cm
(18 inches). The LLT Q4 scenario is referred to later in this section as the Upper potential range of
effect associated with climate change.
An example parameter showing the relationship between the Current, ELT Q5, LLT Q5, LLT Q2, and
LLT Q4 scenarios is shown in Figure 25-6. The figure shows the CALSIM II model results for the No
Project/No Action Alternative for Shasta Lake end-of-September storage conditions, and how these
conditions are affected by climate change. This graphic indicates, in part, an anticipated trend as well as
potential range of effect of climate change for one parameter (Shasta Lake end-of-September storage).
The trend of climate change effect is indicated by the blue line that is described by the Current, ELT Q5,
10 As of 2013, the Bay Delta Conservation Plan (BDCP) is being prepared by a group of local water agencies, environmental andconservation organizations, State and federal agencies, and other interest groups. DWR and Reclamation are the State and federallead agencies, respectively.11 The BDCP is being developed in compliance with the Federal Endangered Species Act and the California Natural CommunitiesConservation Planning Act. When complete, the BDCP will provide the basis for the issuance of endangered species permits for theoperation of the State and federal water projects. The plan would be implemented over the next 50 years. The heart of the BDCP isa long-term conservation strategy that sets forth actions needed for a healthy Sacramento-San Joaquin Delta.
This document is not released as a draft EIR pursuant to CEQA Guidelines § 15087. As such, DWR is not soliciting and will not respond to commentssubmitted on this document, although any comments received will be retained and may be considered during preparation of a future draft EIR.
Chapter 25: Climate Change and Greenhouse Gas Emissions
PRELIMINARY – SUBJECT TO CHANGENORTH-OF-THE-DELTA OFFSTREAM STORAGE PROJECT EIR/EIS 25-42 PRELIMINARY ADMINISTRATIVE DRAFT DECEMBER 2013
WBG020812033556SAC/433094/ (25-GHG_CC_PRELIM_ADMIN_DRAFT_DEC2013.DOCX)
and LLT Q5 scenarios. The nomenclature “trend” is used because Q5 is the median climate change
projection at 15 and 50 years. Thus, Q5 represents a central tendency of potential climate futures. The
potential range of effects associated with climate change is described by the Q2 and Q4 climate change
projections. As might be anticipated, for Shasta Lake end-of-September storage, LLT Q5 falls between
the range Q2 (Lower) and Q4 (Upper). This result, where LLT Q5 falls between LLT Q2 and LLT Q4, is
often, but not always, true.
Current, ELT Q5, and LLT Q5 Trend
The trend in climate and sea level conditions over the next 50 years is shown by the results of the
three point trend of Current, ELT Q5, and LLT Q5 in climate and sea level conditions. Because this
chapter seeks to describe a trend in the performance and impacts of the proposed Project alternatives
under potential future climate and sea level conditions, comparisons were made between the proposed
Project action alternatives (Alternative C in this chapter, as described below, and Alternatives A, B, and C
in Appendix 25B) and the No Project/No Action Alternative with the same climate and sea level
assumptions. The trend is described by the following data points for a given metric:
NODOS action alternative (Current) minus No Project/No Action Alternative (Current) NODOS action alternative at ELT Q5 minus No Project/No Action Alternative at ELT Q5
NODOS action alternative at LLT Q5 minus No Project/No Action Alternative at LLT Q5
In this section, the analysis of alternatives without climate change is referred to as Current because these
analyses use current or historic hydrology and sea level conditions. These analyses, comparing proposed
Project action alternatives to the No Project/No Action Alternative, with consistent climate and sea level
scenarios, highlights potential future conditions that would exist with implementation of each of the
proposed alternatives if climate changed consistent with the scenarios described. The use of three
different climate scenarios (Current, ELT Q5, and LLT Q5) represent a central estimate of climate and sea
level rise conditions that would persist at each time period, referred to as the climate change and sea level
rise trend.
LLT Q2 and LLT Q4 Uncertainty Range
Because this chapter seeks to also describe a range in the performance and impacts of the proposed
Project alternatives under a potential range of projected future climate and sea level conditions,
comparisons were made between the proposed Project action alternatives (Alternative C in this chapter, as
described below, and Alternatives A, B, and C in Appendix 25B) and the No Project/No Action
Alternative with the same climate and sea level assumptions. The range is described by the following data
points for a given metric:
NODOS action alternative at LLT Q2 minus No Project/No Action Alternative at LLT Q2
NODOS action alternative at LLT Q4 minus No Project/No Action Alternative at LLT Q4
Selected model inputs and results for the No Project/No Action Alternative are compiled in
Appendix 25B. This compilation is helpful to understand the magnitude of potential changes associated
exclusively with climate change and sea level rise without proposed Project implementation.
Model results for all proposed Project alternatives are compiled in Appendix 25B. This compilation is
helpful to understand the magnitude of potential changes in the performance and effects of the proposed
Project alternatives due to climate change and sea level rise.
This document is not released as a draft EIR pursuant to CEQA Guidelines § 15087. As such, DWR is not soliciting and will not respond to commentssubmitted on this document, although any comments received will be retained and may be considered during preparation of a future draft EIR.

Chapter 25: Climate Change and Greenhouse Gas Emissions
PRELIMINARY – SUBJECT TO CHANGE PRELIMINARY ADMINISTRATIVE DRAFT DECEMBER 2013 25-43 NORTH-OF-THE-DELTA OFFSTREAM STORAGE PROJECT EIR/EIS WBG020812033556SAC/433094/ (25-GHG_CC_PRELIM_ADMIN_DRAFT_DEC2013.DOCX)
The results of the sensitivity analysis are not intended to be used for detailed evaluation of proposed Project alternatives, and are subject to some limitations.
Use of Analytical Tools
The analytical process for incorporating climate and sea level scenarios into the CALSIM II simulation model includes the use of several sequenced analytical tools. These tools and the analytical process are shown conceptually in Figure 25-7. This process includes modified hydrologic inputs (inflow time-series) and modified flow-salinity relationships for Delta salinity compliance modeling.
Climate Scenarios
For the NODOS Project sensitivity analysis, ELT and LLT scenario representations (called scenarios) were selected. These scenarios were developed from a larger set of projections and were statistically derived from those projections. The ELT scenario considers climate conditions (temperature and precipitation) for a period of 30 years centered on analysis year 2025 (years 2011 to 2040) and projected sea level conditions at year 2025. Likewise, the LLT scenario considers climate conditions for a period of 30 years centered on analysis year 2060 (years 2046 to 2075) and projected sea level conditions at year 2060.
Consistent with the projections used in the IPCC Fourth Assessment Report (IPCC, 2007a), a collection of 112 future climate scenario projections (i.e., Global Climate Models) based on multiple models and multiple emission scenarios was used in the development of the ELT and LLT scenarios. The 112 future climate projections and the resultant five ensembles (Q1 through Q5) are graphically depicted in an example in Figure 25-5 using downscaled climate projections for a region in the Feather River watershed.
Based on the median (50th percentile) change of both annual temperature and annual precipitation (dashed blue lines in Figure 25-5), the state of change for a 30-year climate period can be broken into quadrants (or regions) representing Q1: drier, less warming; Q2: drier, more warming; Q3: wetter, more warming; and Q4: wetter, less warming. In addition, a fifth region Q5 can be described using samples from inner-quartiles (25th to 75th percentile) of the collection. In each of the five regions, the ensemble of climate change projections, made up of those contained within the region bounds, is identified. The Q5 ensemble was derived from the central trending climate projections and thus favors the consensus of the collection. Additional technical information related to the climate change scenarios used for the NODOS Project sensitivity analysis can be found in Appendix 25B.
Using ensembles, one ELT scenario and three LLT scenarios were selected to describe the sensitivity of California’s water resources systems and the sensitivity of the proposed Project alternatives. For evaluating proposed Project alternatives along the trend in climate and sea level conditions over the next 50 years, the ELT and LLT Q5 scenarios were selected. For evaluating proposed Project alternatives throughout the potential range of climate and sea level conditions at 50 years, near the mid-point of the proposed Project planning period, the LLT Q2 (drier, more warming) and Q4 (wetter, less warming) scenarios were selected because these scenarios would likely capture the bounding conditions of climate change and sea level rise relevant to the proposed Project alternatives being considered.
For a climate scenario, the statistics of the appropriate ensemble of downscaled climate change projections were used to develop modified hydrology for the 22 tributary watersheds of the Central Valley. The downscaled climate projections were used to create modified temperature and precipitation inputs for the Variable Infiltration Capacity (VIC) hydrology model. The VIC model simulates
This document is not released as a draft EIR pursuant to CEQA Guidelines § 15087. As such, DWR is not soliciting and will not respond to commentssubmitted on this document, although any comments received will be retained and may be considered during preparation of a future draft EIR.

Chapter 25: Climate Change and Greenhouse Gas Emissions
PRELIMINARY – SUBJECT TO CHANGENORTH-OF-THE-DELTA OFFSTREAM STORAGE PROJECT EIR/EIS 25-44 PRELIMINARY ADMINISTRATIVE DRAFT DECEMBER 2013
WBG020812033556SAC/433094/ (25-GHG_CC_PRELIM_ADMIN_DRAFT_DEC2013.DOCX)
hydrologic processes on the one-eighth degree scale spatial resolution to produce statistics of watershed
runoff. The changes in reservoir inflows and downstream accretions/depletions were translated into
modified input time series for the CALSIM II model.
Sea Level Scenarios
Sea level projections were based on an existing empirical method (Rahmstorf, 2007). This method better
reproduces historical sea levels and generally produces larger estimates of sea level rise than those
indicated by the IPCC (IPCC, 2007a). When evaluating all projections of global air temperature, this
method projects a mid-range sea level rise of 70 to 100 cm (28 to 40 inches) by the end of the century,
and when factoring the full range of uncertainty, the projected rise is 50 to 140 cm (20 to 55 inches).
Using this method, the projected sea level rise at year 2025 would be approximately 12 to18 cm (5 to
7 inches), and at year 2060 would be approximately 30 to 60 cm (12 to 24 inches). These sea level rise
estimates are also consistent with those outlined in the recent USACE guidance circular for incorporating
sea-level changes in civil works programs (USACE, 2009). For the proposed Project sensitivity analysis,
a sea level rise of 15 cm (6 inches) was assumed for the ELT scenario and a sea level rise of 45 cm
(18 inches) was assumed for all LLT scenarios.
Limitations of Sensitivity Analysis
There are limitations associated with the application and use of the NODOS Project climate change and
sea level rise sensitivity analysis. The limitations are summarized below and described in greater detail in
Appendix 25B.
The NODOS Project sensitivity analysis is limited by uncertainty related to climate change and sea level
rise modeling. There is uncertainty in each sequenced step depicted in Figure 25-7. There are also specific
uncertainties related to how operations may need to be modified to adapt to climate change, especially to
mitigate the frequency of dead storage conditions at reservoirs caused by climate change and sea level
rise. In addition, proposed Project operations may need to be modified to adapt to climate change and sea
level rise effects to maximize the effectiveness of the additional storage provided by potential proposed
Project implementation. These latter two limitations are related to the adjustment of operations that occur
over time. Operators have learned how to operate the system of reservoirs and delivery facilities
effectively with historic and current climate. Operators, as well as modelers, understand and learn what
works and what does not work for the current climate, system requirements, and commitments.
Consequently, operations effectively become “tuned” to the current climate. As climate change effects
intensify, modified operations, or refinements, will likely be necessary to meet the multiple objectives of
the CVP, SWP, and Central Valley systems. Also, proposed Project operations have been refined for the
current climate analysis associated with the detailed evaluation of reasonably foreseeable conditions
described in the remainder of the DEIR/EIS. As described below, information available as a result of the
detailed and iterative modeling of the current climate was helpful in developing operations that minimize
impacts and maximize benefits associated with adding offstream surface storage north of the Delta. In
contrast, the refining of proposed Project operations for the ELT Q5, LLT Q5, LLT Q2, and LLT Q4
scenarios was less precise and of less quality because detailed modeling was not used.
NODOS Project Assumptions and Operating Criteria
As described above, the CALSIM II simulations of the proposed Project action alternatives were
developed and refined to the conditions of the existing water resources system and current climate. This
process was iterative using the full suite of hydrologic, operations, water quality, fisheries, power, and
This document is not released as a draft EIR pursuant to CEQA Guidelines § 15087. As such, DWR is not soliciting and will not respond to commentssubmitted on this document, although any comments received will be retained and may be considered during preparation of a future draft EIR.
Chapter 25: Climate Change and Greenhouse Gas Emissions
PRELIMINARY – SUBJECT TO CHANGEPRELIMINARY ADMINISTRATIVE DRAFT DECEMBER 2013 25-45 NORTH-OF-THE-DELTA OFFSTREAM STORAGE PROJECT EIR/EISWBG020812033556SAC/433094/ (25-GHG_CC_PRELIM_ADMIN_DRAFT_DEC2013.DOCX)
economics models applied to the detailed evaluation of proposed Project action alternatives. A description
of the suite of models is provided in Appendix 6B. This refinement process was performed for each
individual operational element that depends on the proposed Sites Reservoir, and included definition of
metrics, assessment of beneficiary performance, modification of assumptions and inputs to improve
performance, and prioritization of beneficiary performance.
However, only the CALSIM II model was used for the sensitivity analysis; therefore, much of the
information required to provide feedback to the NODOS Project operating criteria was not available.
There was limited consideration of how potential benefits may have been impacted due to climate change
and sea level rise; therefore, additional refinements of NODOS Project operating criteria under climate
change and sea level rise conditions were limited as well.
Following the initial set of sensitivity analyses simulations, with only the CALSIM II model results
available, it was evident that some significant changes would occur in the performance of the proposed
Project action alternatives. Based upon these observed changes, a minor alternative refinement was made
for the NODOS climate change sensitivity analysis. An increased need for improved storage and
maintenance of coldwater pools under ELT Q5 and substantially more under LLT Q2 and Q5 climate and
sea level conditions was identified. A decision was made to limit other operations that put the higher
priority Ecosystem Enhancement Storage Account (EESA) actions related to coldwater pools at risk.
These variations in the NODOS Project operating criteria assumed throughout the climate and sea level
rise scenarios are shown in Appendix 25B, Table 25-2. This limited refinement is reflected in the action
alternative results discussed below.
Limitations Considerations
The results of the sensitivity analysis should be considered as a tool to provide a comparative understanding
of the trend of climate change effects and the relative performance of NODOS Project alternatives with
climate change. Any conclusions derived from the sensitivity analysis results should be considered to be
qualitative and as an indicator of potential changes related to climate change and sea level rise.
Consequently, the results of this analysis should not be used independently for decision making purposes,
but rather as supplemental to the detailed evaluations in the Draft Feasibility Report and DEIR/EIS.
In the CALSIM II model, dead pool conditions are assumed at 240 TAF for Trinity Lake, 550 TAF for Shasta
Lake, 30 TAF for Lake Oroville, and 90 TAF for Folsom Lake. These are extreme operational limits and are
well below the range of reasonable reservoir operations. In real-time reservoir operations, operators and
regulators would significantly modify operations to avoid a dead pool condition. As storage in a reservoir
approaches dead pool, operators and regulators would initiate an emergency consultation and agree on a
modified operational strategy to meet various commitments in a more limited way. This type of modified
operation is not included in the CALSIM II operations simulation since the circumstances of an emergency
consultation can vary in significant ways. While CALSIM II results are not considered to be predictive
generally, the limitations regarding results that indicate dead pool conditions at a reservoir are especially
important to understand. Dead pool occurrences in this document should be understood to mean that a
reservoir, and more broadly a system of reservoirs, would likely be operating in an emergency condition. The
ability to meet one or more system objectives will be impaired and normal operations cannot be sustained.
Analysis Results
The results of the NODOS Project climate change and sea level rise sensitivity analysis include both an
effect trend as well as a potential range of effect related to climate change and sea level rise.
This document is not released as a draft EIR pursuant to CEQA Guidelines § 15087. As such, DWR is not soliciting and will not respond to commentssubmitted on this document, although any comments received will be retained and may be considered during preparation of a future draft EIR.

Chapter 25: Climate Change and Greenhouse Gas Emissions
PRELIMINARY – SUBJECT TO CHANGENORTH-OF-THE-DELTA OFFSTREAM STORAGE PROJECT EIR/EIS 25-46 PRELIMINARY ADMINISTRATIVE DRAFT DECEMBER 2013
WBG020812033556SAC/433094/ (25-GHG_CC_PRELIM_ADMIN_DRAFT_DEC2013.DOCX)
Model inputs and results for the No Project/No Action Alternative and for all proposed Project action
alternatives are compiled in Appendix 25B. Some additional results and findings are presented below.
No Project/No Action Alternative Findings
The No Project/No Action Alternative findings are based on a sensitivity analysis of changes in theSWP/CVP/Delta system that are expected to occur over the next 50 years as a result of a changing climateonly (i.e., without implementation of a proposed Project).
The following observations related to the effect of climate change and sea level rise are primarily basedon the Current, ELT Q5, and LLT Q5 scenario trend differences. Generally, these observations areconsistent with water management and climate change effects expected and described previously. Theyare based on the results of VIC simulations of the climate and sea level scenarios selected and thesubsequent results of CALSIM II simulations of the No Project/No Action Alternative:
Increased runoff in late winter/early spring and reduced runoff in late spring and summer
Increased salinity in the western and central Delta
Reduced river and Delta inflow due to decreases in runoff, specifically in summer months and Dry
and Critically Dry year conditions
Increased Delta outflow requirements in Dry and Critically Dry year conditions due to increased
salinity conditions
Increased use of reservoir storage to maintain flow, temperature, and Delta salinity requirements
Decreased use of reservoir storage to meet demands for agricultural and urban water use
Decreased reservoir storage conditions in summer and fall and uncertain changes in frequency of
annual refilling of existing reservoirs
Increased variability and overall decreased water allocations for SWP and CVP Delta exports and
other diversions
Increased occurrence of dead pool12 storage at reservoirs and potential operational interruptions
The CALSIM II results indicate changes in flows and storage conditions from the Current, ELT Q5, and
LLT Q5 scenario trend, and to some extent the potential range of LLT Q2 and Q4 scenarios, such that the
following is expected (but has not been confirmed with detailed modeling):
Increased water temperatures in reservoirs and rivers
Reduced suitable riverine habitat for coldwater fish due to warmer water temperatures throughout all
seasons and lower flows during late spring and summer
Modified peak and natural pulse flow conditions
Of particular importance is the finding of increased salinity in the western and central Delta. This salinity
effect would be caused primarily by sea level rise, where sea water from San Francisco Bay would intrude
into the Delta. The observed trend and range of effects to the X2 position is almost exclusively eastward,
12 For the purposes of this analysis, “dead pool” occurs when the operating storage in a reservoir equals zero. For most reservoirs,some water would remain in storage as described previously, but it could not be released for any downstream purpose because thewater is at or below the lowest intake level.
This document is not released as a draft EIR pursuant to CEQA Guidelines § 15087. As such, DWR is not soliciting and will not respond to commentssubmitted on this document, although any comments received will be retained and may be considered during preparation of a future draft EIR.

Chapter 25: Climate Change and Greenhouse Gas Emissions
PRELIMINARY – SUBJECT TO CHANGEPRELIMINARY ADMINISTRATIVE DRAFT DECEMBER 2013 25-47 NORTH-OF-THE-DELTA OFFSTREAM STORAGE PROJECT EIR/EISWBG020812033556SAC/433094/ (25-GHG_CC_PRELIM_ADMIN_DRAFT_DEC2013.DOCX)
indicating increased salinity. As shown in Table 25B-20 of Appendix 25B, X2 movement associated with
climate change ranges between -0.3 km (0 percent) in October to 3.6 km (5 percent) in May. All months
except October show positive or eastward movement, indicating diminished water quality. This result is
indicated by comparing average X2 position associated with the No Project/No Action Alternative using
current climate and the LLT Q5 trend. Consequently, Delta outflow would need to be increased because
more water would be required to meet water quality requirements. The result would be a reduced amount
of water available in storage to manage the system for all other uses. Consequently, storage in the major
CVP and SWP reservoirs north of the Delta (including Trinity Lake, Shasta Lake, Lake Oroville, and
Folsom Lake) would decrease, and exports from the Delta would be reduced. These results are consistent
with previous studies finding that CVP and SWP operations would be most affected by annual runoff
through mid-century, and then sea level rise becomes the most critical factor by the end of the century
(Wang et al., 2011).
In addition, the climate change sensitivity analysis findings indicate that California’s major water systems
would become increasingly vulnerable to operational interruptions. For example, the occurrence of dead
pool conditions at system reservoirs would increase with climate change. This type of vulnerability to
operational interruptions is discussed in greater detail below and in Appendix 25B.
Proposed Project Action Alternatives Findings
Model results for all alternatives are compiled in Appendix 25B. The results in the appendix are shown in
tables as seasonal, annual, and selected monthly values; differences with the Current climate and sea level
scenario; and differences with the No Project/No Action Alternative for Current, ELT Q5, and LLT Q5
climate and sea level scenarios. The results are presented for long-term and upper, above median, below
median, and lower quartile range averages. The results are also shown graphically as seasonal, annual,
and selected monthly values ranked and charted against probability of exceedance; exceedance figures
show the entire range of probability.
The following conclusions were made based on the comparison of the results of the CALSIM II
simulations for the proposed Project action alternatives with the No Project/No Action Alternative
evaluated for Current, ELT, and all LLT climate and sea level scenarios:
The ability to divert water into proposed Project storage would be the same or slightly increased due
to changes in the timing of snowmelt runoff and the continued opportunity to use the intakes under a
wide range of climate scenarios.
The proposed Project action alternatives could provide a similar array of potential benefits under a
range of climate and sea level scenarios, including the primary objectives of (1) increasing survival of
anadromous fish populations, (2) improving water supply reliability for agricultural, urban, and
environmental uses, and (3) improving drinking and environmental water quality in the Delta.
The proposed Project action alternatives would improve system storage conditions and could mitigate
some of the effects of climate change and sea level rise specifically related to impacts on storage
operations and associated increase in vulnerability of the water resources system to operational
interruption.
The sensitivity analysis did not include the full suite of models that are listed in Appendix 6B, such as
daily operations, temperature, fisheries, and economics modeling. However, the CALSIM II results do
indicate changes in flows and storage conditions between the proposed Project action alternatives and the
This document is not released as a draft EIR pursuant to CEQA Guidelines § 15087. As such, DWR is not soliciting and will not respond to commentssubmitted on this document, although any comments received will be retained and may be considered during preparation of a future draft EIR.
Chapter 25: Climate Change and Greenhouse Gas Emissions
PRELIMINARY – SUBJECT TO CHANGENORTH-OF-THE-DELTA OFFSTREAM STORAGE PROJECT EIR/EIS 25-48 PRELIMINARY ADMINISTRATIVE DRAFT DECEMBER 2013
WBG020812033556SAC/433094/ (25-GHG_CC_PRELIM_ADMIN_DRAFT_DEC2013.DOCX)
No Project/No Action Alternative throughout the Current, ELT, and all LLT scenarios such that the
following is expected (but has not been confirmed with modeling):
The proposed Project with climate change would likely improve the temperature regime of the upper
Sacramento River for salmonids, when compared to the No Project/No Action Alternative with
climate change.
As observed, the No Project/No Action Alternative performance of the CVP and SWP systems (for
the purposes of water supply, water quality maintenance, and maintenance of aquatic habitats) would
decrease with climate change and sea level rise because the systems would have less water to manage.
Because the reliability of the SWP and CVP would be diminished with climate change, the economic
value of additional water would likely be enhanced. The total value of proposed Project benefits may
be greater as well.
Specific Effects of Climate Change and the Proposed Project
The analysis and discussion of effects to proposed Project action alternatives associated with climate
change and sea level rise included both the trend (which includes the Current, ELT Q5, and LLT Q5
scenarios) and the range of potential effects (which includes LLT Q2 and LLT Q4 scenarios). The
analysis and discussion focused on the sensitivity effects upon Alternative C. As shown in the
comprehensive presentation of effects based upon detailed modeling, Alternative C consistently has the
greatest effect upon resources, when compared to the No Project/No Action Alternative. Consequently,
Alternative C likely reflects the greatest effect associated with climate change and sea level rise. The
following observations were made based upon analyses and review of the sensitivity analysis results. A
change in the trend of a metric of greater than five percent was considered to be a sensitive response to
that metric. A change of less than five percent was considered to be minimally sensitive. Where
appropriate, the cases where results support the anticipated effects described in the preliminary sections
are identified.
1. Diversion to proposed Project storage for improved flexibility and benefits appears resilient to climate
change and sea level rise effects. Diversion to proposed Project storage would be minimally sensitive
to climate change and sea level rise, as shown in Figure 25-8. The trend in diversion to proposed
Project storage indicates that there would be a reduction of less than one percent in the ELT Q5
scenario, and increases in diversion for all LLT scenarios. The observed LLT Q5 trend of diversion to
proposed Project storage indicates an increase of 4.4 percent, when compared to the Current scenario.
The increase in diversion to fill the proposed Sites Reservoir under all LLT climate and sea level
scenarios demonstrates the resilience of the proposed Project in capturing excess flows for later use.
This finding is consistent with and supported by the finding of increased runoff in late winter/early
spring due to increased temperature effects on the timing of snowmelt runoff in the ELT and LLT
scenarios.
The proposed Project would rely on water from a combination of sources, including the Sacramento
River that flows into and through Shasta Lake, the Trinity River, and the tributaries between Shasta
Lake and the proposed Delevan Pipeline. The result described above associated with proposed Project
diversion capability indicates more specifically the resilience of the source waters for the proposed
Project as their runoff pattern is modified by climate change and sea level rise. Meanwhile, a
downward trend in north-of-the-Delta storage (at Trinity, Shasta, Oroville, and Folsom) was observed
in the No Project/No Action Alternative and all proposed Project action alternative scenarios for the
ELT Q5 and LLT Q5 climate and sea level scenarios. The rate of decline in storage conditions would
This document is not released as a draft EIR pursuant to CEQA Guidelines § 15087. As such, DWR is not soliciting and will not respond to commentssubmitted on this document, although any comments received will be retained and may be considered during preparation of a future draft EIR.
Chapter 25: Climate Change and Greenhouse Gas Emissions
PRELIMINARY – SUBJECT TO CHANGEPRELIMINARY ADMINISTRATIVE DRAFT DECEMBER 2013 25-49 NORTH-OF-THE-DELTA OFFSTREAM STORAGE PROJECT EIR/EISWBG020812033556SAC/433094/ (25-GHG_CC_PRELIM_ADMIN_DRAFT_DEC2013.DOCX)
be slowed by the addition of the proposed Sites Reservoir to the water system. The expected increase
of diversion to fill Sites Reservoir, for proposed Project action alternatives under all climate and sea
level scenarios, coupled with the observed decrease in Sites Reservoir storage conditions relative to
the Current scenario indicates that Sites Reservoir would fill and release at higher rates, potentially
producing greater levels of benefits as climate change and sea level rise worsen.
2. System flexibility improvements (previously identified as a system need), as measured by end-of-
May additional water in storage, would be minimally sensitive to climate change and sea level rise.
Water in storage in May was shown because it represents the quantity of water available for system
uses by water managers and operators as they enter the high water use season (for water supply, water
quality maintenance in the Delta, and upstream habitat requirements). The trend of average additional
water in storage in May, as shown in Figure 25-9 would be reduced by 0.25 percent for the ELT Q5
scenario and by 4.1 percent for the LLT Q5 scenario. As climate change and sea level rise effects
increase, the ability of the proposed Project to improve flexibility would be somewhat diminished.
The potential range of effect would range from a 1.8 percent increase to a 9.0 percent decrease. The
amount of additional water available in storage in Trinity Lake, Shasta Lake, Lake Oroville, Folsom
Lake, and the proposed Sites Reservoir would improve water and fisheries managers’ ability to
respond to various uncertainties and challenges, including climate change and sea level rise.
For the proposed Project action alternatives, Sites Reservoir storage conditions would decrease
consistent with the trend observed in existing SWP and CVP storage across the ELT Q5 and LLT Q5
climate and sea level scenarios. These trends are similar; however, not as large as the trends seen for
the No Project/No Action Alternative. The distinct difference in these trends in total storage between
the proposed Project action alternatives and the No Project/No Action Alternative is that the No
Project/No Action Alternative results show a substantial loss in systemwide storage due to climate
change and sea level rise. The proposed Project action alternatives show improved storage, when
compared to the No Project/No Action Alternative. As climate change and sea level rise effects
increase, the gain in storage in comparison to the No Project/No Action Alternative (without climate
change and sea level rise) would be lost. The results over the ELT Q5 and LLT Q5 trend show that
the proposed Project action alternatives could mitigate the loss in storage associated with the ELT Q5
scenario and, depending on the alternative, much of the loss in storage associated with the LLT Q5
scenario. The proposed Project action alternatives could not mitigate for the loss in storage in the
LLT Q2 scenario. Also, the ability of the proposed Project action alternatives to accomplish the
proposed Project’s primary objectives would depend primarily on the ability of the action alternative
to store and manage additional flows not otherwise available in the No Project/No Action Alternative.
Under all climate and sea level conditions, including Current, there would be improvements in
operations of these reservoirs with the proposed Project action alternatives, when compared to the No
Project/No Action Alternative under the same climate and sea level condition. It is assumed that
reduction in these extreme operations (operating at dead pool conditions) would improve compliance
with minimum flow criteria and Delta salinities standards, and would help to meet allocated diversion
volumes and water rights priorities, as well as operating agreement requirements.
Finally, system flexibility (water in storage) is an excellent indicator of the viability and sustainability
of the SWP and CVP water management systems. The ability of the systems to accomplish most of
their purposes, including water supply, instream flows, temperature and habitat maintenance, Delta
water quality, hydropower generation, and recreation, depend upon water in storage. Therefore, it is
likely that if water in storage is improved by implementation of the proposed Project, then the long-
This document is not released as a draft EIR pursuant to CEQA Guidelines § 15087. As such, DWR is not soliciting and will not respond to commentssubmitted on this document, although any comments received will be retained and may be considered during preparation of a future draft EIR.

Chapter 25: Climate Change and Greenhouse Gas Emissions
PRELIMINARY – SUBJECT TO CHANGENORTH-OF-THE-DELTA OFFSTREAM STORAGE PROJECT EIR/EIS 25-50 PRELIMINARY ADMINISTRATIVE DRAFT DECEMBER 2013
WBG020812033556SAC/433094/ (25-GHG_CC_PRELIM_ADMIN_DRAFT_DEC2013.DOCX)
term viability and sustainability of California’s water management system would be improved as
well.
The ability of the proposed Project to provide benefits (i.e., meet Project objectives) is measured by
metrics chosen to represent the three main proposed Project water benefits. These benefits are fish
survival (indicated by the coldwater pools at existing reservoirs), water supply reliability (indicated
by Delta deliveries to SWP and CVP contractors), and improved water quality (indicated by the X2
position). These metrics are described below in items 3 through 5.
3. Cold water pool improvements at the existing reservoirs, as indicated by additional end-of-September
storage at Trinity Lake, Shasta Lake, Lake Oroville, and Folsom Lake, would be sensitive to climate
change and sea level rise (Figure 25-10). The trend of Alternative C additional water in storage at
existing reservoirs would be reduced by 13.2 percent and 16.8 percent for the ELT Q5 and LLT Q5
scenarios, respectively. The potential range of effect on the coldwater pool improvement does not
contain the trend. For most metrics, Q5 falls within the Q2 to Q4 range. In this case, the coldwater
pool improvement would be 3.2 percent to 41.0 percent for Q4 and Q2, respectively. For the primary
Project objective of increasing survival of anadromous fish populations, the highest priority would be
to maintain improved storage conditions through the Dry years and summer months (July through
September season). The improvement in storage conditions during these periods would retain cooler
water (i.e., a coldwater pool improvement) and allow for more water releases for improving
temperature conditions in the river reaches downstream of these reservoirs. As indicated by the
improvement in the beginning (end-of-May storage) and ending (end-of-September storage) of the
coldwater pool maintenance period, there would be a potential improvement in temperature
conditions downstream of Trinity Lake, Shasta Lake, Lake Oroville and Folsom Lake with the
proposed Project action alternatives, when compared to the No Project/No Action Alternative under
the same climate and sea level scenario. This was found to be the case under the Current scenario
evaluated in the Draft Feasibility Report and in the detailed evaluation of the Draft EIR/EIS.
Consistent with the intent of the proposed Project action alternatives operations, the most substantial
relative improvement in storage would be at Shasta Lake.
Habitat suitability for anadromous fish populations is dependent upon both temperature and flow
conditions. The expected improvement in storage conditions during the Dry years and summer
months (July through September season) for cooler water (i.e., a coldwater pool improvement) and
more water with the proposed Project action alternatives would result in temperature and flow
improvements through increases in reservoir releases during Dry years and summer months (July
through September season). These results indicate that proposed Project action alternatives would
continue to improve conditions for fish survival with climate change.
4. Water supply reliability improvements, as indicated by exports from the Banks and Tracy pumping
plants, would be minimally sensitive to climate change and sea level rise (Figure 25-11). Between
Current, ELT Q5, and LLT Q5 climate and sea level scenarios, for all proposed Project action
alternatives, long-term average annual total exports from the Banks Pumping Plant and Jones
Pumping Plant would increase, when compared to the No Project/No Action Alternative. There are
variations in these changes across climate scenarios as the changing conditions for Delta exports vary.
This variation was described for the No Project/No Action Alternative. The values vary more in the
LLT Q2 and Q4 results. Across all climate and sea level scenarios, below median and Dry year (lower
quartile) averages show additional exports are sustained in drier year types due to the proposed
This document is not released as a draft EIR pursuant to CEQA Guidelines § 15087. As such, DWR is not soliciting and will not respond to commentssubmitted on this document, although any comments received will be retained and may be considered during preparation of a future draft EIR.
Chapter 25: Climate Change and Greenhouse Gas Emissions
PRELIMINARY – SUBJECT TO CHANGEPRELIMINARY ADMINISTRATIVE DRAFT DECEMBER 2013 25-51 NORTH-OF-THE-DELTA OFFSTREAM STORAGE PROJECT EIR/EISWBG020812033556SAC/433094/ (25-GHG_CC_PRELIM_ADMIN_DRAFT_DEC2013.DOCX)
Project action alternatives. The absolute and relative magnitude of improvement increasing as the
effect of climate change and sea level rise increases.
The relative increase in annual total exports under below median and Dry year average conditions is
an indicator of the economic impact of the primary Project objective of improving water supply
reliability for urban uses. The economic value of a given increment of water for urban use would
increase as the “without project supply condition” deteriorates with climate change and sea level rise.
The results of the sensitivity analysis indicate that the increment of water provided by the proposed
Project action alternatives could increase even as overall system supply decreases. The primary
Project objective of water supply reliability also includes agricultural and environmental uses (such as
the replacement of wildlife refuge water supplies). The economic value of each of these supplies
would be increased by storing and exporting these supplies through the Delta and making them
available to the south-of-the-Delta water resources system. The results of the absolute and relative
trends, when compared to the No Project/No Action Alternative, for below median and Dry year
pumping at Banks Pumping Plant and Jones Pumping Plant indicate that the proposed Project action
alternatives would continue to perform well (i.e., reliability improvements are sustained when
comparing without climate change against with climate change) for the primary Project objective of
increasing water supply reliability and indicate a trend of increased economic value of the exports as
climate change and sea level rise occurs.
5. Water quality improvements, as indicated by the X2 position during July through September, would
be minimally sensitive to climate change and sea level rise (Figure 25-12). The sensitivity analysis
indicates that the trend of the X2 position would diminish by 0.1 percent in the ELT Q5 scenario and
increase by 0.1 percent in the LLT Q5 scenario, when compared to the Current scenario. Between
Current, ELT Q5, and LLT Q5 climate and sea level scenarios, the X2 position (and Old River at
Rock Slough salinity conditions) would be improved during April through December. An
improvement is indicated by a westward movement (i.e., reduction) in the X2 position (distance from
the Golden Gate Bridge in kilometers) or a reduction in electrical conductivity (EC). The No
Project/No Action Alternative results indicate that the degree of impact to the X2 position would vary
according to Delta outflow conditions, and that the X2 position would move further eastward (i.e., it
would increase) under all climate and sea level scenarios, when compared to the Current scenario.
The improvement shown in the ELT Q5 and LLT Q5 scenarios, when comparing the proposed
Project action alternatives and the No Project/No Action Alternative at a specific climate and sea
level condition, would result from the operation of the proposed Project for supplemental Delta
outflows to improve water quality conditions for urban intakes and environmental benefit in the
Delta. These releases would occur in the summer (July through September) and fall (October through
December). The effectiveness of improving Delta water quality conditions with supplemental releases
from the proposed Project would decrease with sea level rise. Water quality would still be improved
with the proposed Project, but to a lesser degree. Under ELT Q5 and LLT Q4 scenario conditions, the
releases would be as effective as, or more effective than, under the Current scenario; however, under
LLT Q5 and LLT Q2, the effectiveness of releases would be further diminished. For this reason, the
Ecosystem Enhancement Storage Account (EESA) Action 5 (Delta outflow for Delta Smelt Habitat
Improvement) was removed from the climate change sensitivity analysis. This EESA water is instead
used in this sensitivity analysis to further enhance the increase coldwater pool actions at the existing
reservoirs. Consequently, the water quality improvement provided by the proposed Project is less than
in the detailed analysis, which includes the ecosystem water quality action.
This document is not released as a draft EIR pursuant to CEQA Guidelines § 15087. As such, DWR is not soliciting and will not respond to commentssubmitted on this document, although any comments received will be retained and may be considered during preparation of a future draft EIR.
Chapter 25: Climate Change and Greenhouse Gas Emissions
PRELIMINARY – SUBJECT TO CHANGENORTH-OF-THE-DELTA OFFSTREAM STORAGE PROJECT EIR/EIS 25-52 PRELIMINARY ADMINISTRATIVE DRAFT DECEMBER 2013
WBG020812033556SAC/433094/ (25-GHG_CC_PRELIM_ADMIN_DRAFT_DEC2013.DOCX)
The results of the X2 position and the Old River at Rock Slough salinity results indicate that in
summer and fall (July through December), there would be a potential benefit of operating the
proposed Project action alternatives for the primary Project objective of improving drinking water
quality and environmental water quality in the Delta. Water quality improvements would still be
achievable even in climate change and sea level rise scenarios where the improvement would require
relatively more water than in the Current scenario.
6. The sustainability of system reservoirs would be sensitive to climate change and sea level rise, as
indicated by the trend increase of dead storage occurrences associated with the No Project/No Action
Alternative. The proposed Project would have the ability to provide improved system sustainability,
as indicated by reductions in occurrences of dead storage at system reservoirs; however, this ability
would be sensitive to climate change and sea level rise. Dead storage occurrences would increase
from 28 to 69 to 123 for the No Project/No Action Alternative under the Current, ELT Q5, and LLT
Q5 scenarios, respectively. With Alternative C, the occurrences would be reduced to 9, 35, and 111,
respectively. Both the No Project/No Action Alternative and Alternative C expected occurrences of
dead storage are shown in Figure 25-13. The proposed Project effect of mitigating occurrences of
dead storage would be reduced as the trend of climate change and sea level rise continues, with
reductions of 67.8 percent, 49.3 percent, and 9.8 percent for the Current, ELT Q5, and LLT Q5
scenarios, respectively. The frequency of dead pool conditions would increase under ELT Q5 and
LLT Q5 climate and sea level scenarios.
NODOS Effects with Climate Change and Sea Level Rise
The NODOS Project climate change and sea level rise sensitivity analysis compares some metrics
associated with some environmental resources. As a sensitivity analysis, the evaluation is not as
comprehensive or precise as the detailed evaluation of effects in the environmental resource chapters of
this EIR/EIS (i.e., Chapters 6 through 31). The evaluations of proposed Project effects within the
environmental resource chapters are based upon Current climate conditions.
The following discussion provides a general understanding of how environmental resources and effects
associated with the proposed Project action alternatives may be altered with climate change. Each of the
environmental resource categories are described with consideration of the anticipated general climate
change effects to the resource, the potential for changed proposed Project effects with climate change, as
compared to without climate change (i.e., as presented in the environmental resource chapters), and
potential resiliency improvements that may be provided by proposed Project implementation. For this
discussion, resilience for a resource is a potential improvement of the capacity for that resource to return
to prior conditions after anticipated climate change and sea level rise effects.
Generally, the relative degree of environmental effects would be greater under the Current climate
scenario because the SWP and CVP systems are already subject to significant environmental effects with
the No Project/No Action Alternative in the climate change and sea level rise scenarios. If a significant
effect were identified for the Current scenario, the effect would likely be relatively less significant in the
sensitivity analysis scenario. As previously noted, effects to resources associated with the detailed
evaluation and Current climate are evaluated using more comprehensive and detailed analysis and
modeling. These more detailed evaluations and descriptions of proposed Project effects are found in the
individual resources chapters. These more comprehensive analyses were not included as part of the
climate change and sea level rise sensitivity analysis. Consequently, more precise determinations of
effects associated with the sensitivity analysis are not available.
This document is not released as a draft EIR pursuant to CEQA Guidelines § 15087. As such, DWR is not soliciting and will not respond to commentssubmitted on this document, although any comments received will be retained and may be considered during preparation of a future draft EIR.

Chapter 25: Climate Change and Greenhouse Gas Emissions
PRELIMINARY – SUBJECT TO CHANGEPRELIMINARY ADMINISTRATIVE DRAFT DECEMBER 2013 25-53 NORTH-OF-THE-DELTA OFFSTREAM STORAGE PROJECT EIR/EISWBG020812033556SAC/433094/ (25-GHG_CC_PRELIM_ADMIN_DRAFT_DEC2013.DOCX)
Surface Water Resources (Chapter 6)
Climate change and sea level rise are expected to affect surface water resources due to the anticipated
increased air, water, and soil temperatures; altered runoff; increased frequency and severity of floods and
droughts; and Delta salinity intrusion. Most of these effects were evaluated in the NODOS Project climate
change sensitivity analysis in this chapter. The sensitivity analysis results indicate that most metrics of
surface water resources, including reservoir storage, streamflow, and deliveries, would trend negatively as
climate change and sea level rise effects increase in the future. However, with implementation of
Alternatives A, B, and C, water supply reliability would be maintained or increased, when compared to
the No Project/No Action Alternative. The NODOS Project formulations were developed to add
resiliency to the CVP, SWP, and Central Valley water systems. As noted, these systems have an
identified need for flexibility (i.e., water in storage) that would be demonstrably enhanced by
implementation of the proposed Project. In addition, the proposed Project’s ability to meet objectives that
require additional water, including fish survival, water supply reliability, water quality, and flexible
generation hydropower, appears resilient to climate change and sea level rise effects. Having more water
in storage, both in the proposed Sites Reservoir and in existing reservoirs, would allow water system
operators and managers to more easily adapt to a number of future uncertainties, including climate
change.
Surface Water Quality (Chapter 7)
Climate change and sea level rise are expected to affect surface water quality due to the anticipated
increased water temperatures, altered runoff, increased frequency and severity of floods and droughts, and
increased Delta salinity. As noted previously, salinity in the western and central Delta is expected to
increase due to both sea level rise and changes in runoff, especially during summer/fall months and drier
year type conditions. As in the detailed Current climate analysis comparison of proposed Project effects,
the X2 position would generally increase during the winter/spring period when the proposed Project
would divert, and the X2 position would improve (i.e., decrease) during summer/fall, reflecting the Delta
water quality proposed Project objective improvements. According to the sensitivity analysis, changes to
the X2 position with climate change would be similar to those with Current climate. Improvements to the
X2 position supported by the proposed Project water quality objective operations would, however,
become relatively less effective with climate change and sea level rise. As noted in the Surface Water
Resources discussion presented above, the proposed Project action alternatives would be a helpful
adaptive asset and provide resilience because water system operators and managers would have more
water in storage to manage Delta water quality, among other proposed Project and existing system
objectives.
Fluvial Geomorphology and Riparian Habitat (Chapter 8)
Climate change and sea level rise may change our rivers geomorphic characteristics and associated
riparian habitat. Changes could occur as a result of the anticipated increased frequency and severity of
high flow events and erosion, and changes in runoff timing. In addition, future reservoir operations would
be maintained at relatively lower levels to respond to increased demand. These operations would allow a
greater percentage of flood flows to be managed by existing reservoirs, thereby reducing geomorphic
function and riparian succession below those facilities. The total direction and magnitude of these effects
associated with climate change and sea level rise are uncertain. However, the adaptive capability and
resilience of the system, as described above, would be improved with proposed Project implementation.
This document is not released as a draft EIR pursuant to CEQA Guidelines § 15087. As such, DWR is not soliciting and will not respond to commentssubmitted on this document, although any comments received will be retained and may be considered during preparation of a future draft EIR.

Chapter 25: Climate Change and Greenhouse Gas Emissions
PRELIMINARY – SUBJECT TO CHANGENORTH-OF-THE-DELTA OFFSTREAM STORAGE PROJECT EIR/EIS 25-54 PRELIMINARY ADMINISTRATIVE DRAFT DECEMBER 2013
WBG020812033556SAC/433094/ (25-GHG_CC_PRELIM_ADMIN_DRAFT_DEC2013.DOCX)
Relatively fuller reservoirs (such as associated with proposed Project implementation) may improve
resiliency to climate change and sea level rise for geomorphic functions and riparian success.
Flood Control and Management (Chapter 9)
Climate change and sea level rise are anticipated to affect flood management. Water storage levels in
existing reservoirs with climate change and sea level rise are expected to trend down. This result is shown
in the sensitivity analysis No Project/No Action scenario. This effect could provide some improvement in
flood management capability by providing more space in reservoirs for flood events. However, expected
increases in the frequency and severity of high flow events would diminish flood management capability.
The total magnitude and direction of effects on flood management is uncertain, and therefore, speculative.
As noted in Chapter 9 Flood Control and Management, there would be some flood management benefit
for the areas immediately downstream of the proposed Project dams that are prone to flooding. The
adaptive capability related to flood management is less certain. As noted above, water system operators
and managers would have more water to manage with proposed Project implementation than without. The
expected additional water in storage could potentially provide operators and flood and water managers
additional system resources to shift additional flood management protection to existing reservoirs, thus
providing some resilience. This type of operation was not included in the proposed Project action
alternatives formulations. Although this type of adaptive operation would be possible and would provide
some resilience for flood management, this type of flood management operational change is speculative.
Groundwater Resources (Chapter 10)
Groundwater resources are likely to be affected by climate change and sea level rise. Groundwater use is
expected to increase as surface water availability is affected by increasing temperatures, as runoff shifts,
and due to Delta salinity intrusion that would require additional water quality dedicated releases from
reservoirs. Comparative effects of the proposed Project would likely be similar with current conditions,
when compared to climate change and sea level rise conditions. Some resilience of groundwater resources
may be provided by proposed Project benefits because the water system (i.e., surface and groundwater)
would be improved by proposed Project reliability benefits and improved surface water storage
conditions. For example, a more reliable surface water system would reduce dependence upon the
groundwater system. Consequently, the adaptive capability and resilience of the surface water system
would improve the resiliency of the groundwater resources that are expected to lose resilience with
climate change and sea level rise.
Groundwater Quality (Chapter 11)
Climate change and sea level rise are expected to affect groundwater quality due to the anticipated
changes in runoff, increased soil temperature, and Delta salinity intrusion. Specific climate change and
sea level rise effects, as well as potential changes to identified proposed Project impacts to groundwater
quality within the three study areas, are uncertain.
Aquatic Biological Resources (Chapter 12)
Climate change and sea level rise are expected to affect aquatic biological resources due to the anticipated
increased air and water temperatures, altered runoff and erosion, Delta salinity intrusion, and increased
acidification of ocean waters from increased CO2. The ability of water system operators to maintain
stream temperatures that support salmonids would likely be increasingly challenged as the coldwater
pools at existing reservoirs are compromised due to other increasing system needs. Increased air
This document is not released as a draft EIR pursuant to CEQA Guidelines § 15087. As such, DWR is not soliciting and will not respond to commentssubmitted on this document, although any comments received will be retained and may be considered during preparation of a future draft EIR.
Chapter 25: Climate Change and Greenhouse Gas Emissions
PRELIMINARY – SUBJECT TO CHANGEPRELIMINARY ADMINISTRATIVE DRAFT DECEMBER 2013 25-55 NORTH-OF-THE-DELTA OFFSTREAM STORAGE PROJECT EIR/EISWBG020812033556SAC/433094/ (25-GHG_CC_PRELIM_ADMIN_DRAFT_DEC2013.DOCX)
temperatures are expected to lead to increased water temperatures in streams and reservoirs. The climate
change and sea level rise sensitivity analysis indicates a trend of decreased water in storage for the No
Project/No Action Alternative. As climate change effects increase over time, more water is expected to be
required to meet Delta salinity standards, which would decrease the amount of water available for all
other purposes, including instream fishery needs such as coldwater pool management and stream
temperature maintenance.
As noted previously, the proposed Project alternative operations with climate change were modified
(when compared to the proposed Project alternatives operations with current climate) to emphasize
coldwater pool management over the delta smelt habitat supplemental flows. Some Project-related water
quality improvements would persist (as noted above). The proposed Project would provide significant
adaptive capability for water and fishery managers that face uncertain future conditions, including climate
change and sea level rise. The fish survival actions that improve the coldwater pools at existing reservoirs
and provides supplemental temperature flows downstream would provide some resilience to increased
water temperatures that are expected with climate change and sea level rise. Improved water in storage
would improve water system operators’ ability to support system objectives, including maintaining and
improving anadromous fish habitat. The benefits associated with fish survival, with the exception of
supplemental flows for delta smelt, appear to be sustainable with the climate change and sea level rise
trend.
The NODOS Investigation has made recommendations to support an adaptive approach to the fishery
benefits provided by the proposed Project. Conceptually, the fishery benefits would be supported by a
proposed Project EESA, as described in Chapter 3 Description of the Proposed Project/Proposed Action
and Alternatives. More practically, a portion of proposed Project resources (i.e., storage and conveyance)
would be committed to providing eight water-related actions to improve anadromous fish habitat at and
downstream of existing CVP and SWP reservoirs and in the Delta. The relative priorities of ecosystem
actions supported by the EESA may change over time. Climate change and sea level rise effects may
warrant some adaptation of the EESA. Modifications could be made with the approval of member
agencies of a proposed governing board. This adaptive capability would support the resilience of the
proposed Project and its benefits.
Botanical Resources (Chapter 13)
Climate change and sea level rise are expected to affect botanical resources due to the anticipated
increased air and water temperatures, altered runoff and erosion, increased frequency and severity of
flood and drought events, and salinity intrusion in the Delta. These effects could result in changes in
vegetation species abundance (including invasive species), habitat quality, species range, and the spread
of pests. The relative effect of climate change and sea level rise upon the identified proposed Project
impacts to botanical resources is uncertain.
Terrestrial Biological Resources (Chapter 14)
Climate change and sea level rise are expected to affect terrestrial biological resources due to the
anticipated higher temperatures, altered runoff and erosion, increased frequency and severity of flood and
drought events, and Delta salinity intrusion. These effects are expected to contribute to decreased wildlife
species abundance and habitat quality. However, some of these effects could improve conditions for
certain species. For example, the anticipated increased frequency and severity of flood events and
This document is not released as a draft EIR pursuant to CEQA Guidelines § 15087. As such, DWR is not soliciting and will not respond to commentssubmitted on this document, although any comments received will be retained and may be considered during preparation of a future draft EIR.
Chapter 25: Climate Change and Greenhouse Gas Emissions
PRELIMINARY – SUBJECT TO CHANGENORTH-OF-THE-DELTA OFFSTREAM STORAGE PROJECT EIR/EIS 25-56 PRELIMINARY ADMINISTRATIVE DRAFT DECEMBER 2013
WBG020812033556SAC/433094/ (25-GHG_CC_PRELIM_ADMIN_DRAFT_DEC2013.DOCX)
associated erosion with climate change would likely increase the quantity and quality of bank swallow
nesting habitat.
The climate change sensitivity analysis indicates a general decrease in storage at existing reservoirs with
the No Project/No Action Alternative. The analysis also indicates an increase in storage with proposed
Project implementation, when compared to the No Project/No Action Alternative. This Project-related
increase in storage would likely benefit bald eagles because long-term monitoring data from Shasta
Reservoir indicate that bald eagle production increases as reservoir surface water elevation increases. The
relative effect of climate change and sea level rise upon the identified proposed Project impacts to
terrestrial biological resources is uncertain.
Wetlands and Other Waters of the U.S. (Chapter 15)
Climate change and sea level rise are expected to affect wetlands and other waters of the U.S. Because
wetlands and waters of the U.S. are a subset of surface water resources, the effects described for surface
water resources would also apply to this resource. The effects include increased air, water, and soil
temperatures; altered runoff; increased frequency and severity of floods and droughts; and Delta salinity
intrusion. In addition, decreased species abundance and habitat quality, the spread of pests, and increased
fire risk would affect wetlands. The proposed Project would provide improvements and adaptive
capability to the water resources systems of the State, including the CVP and SWP and their respective
facilities and associated watersheds, including improved storage conditions. Improved storage may
provide some resilience to the effects of climate change and sea level rise upon wetlands and waters of the
U.S. Relatively fuller reservoirs would more effectively support downstream wetlands and waters of the
U.S. that are dependent upon either deliveries or streamflow. The relative effect of climate change and sea
level rise upon the identified proposed Project impacts to wetlands and other waters of the U.S. is
uncertain.
Geology, Minerals, Soils, and Paleontology (Chapter 16)
Climate change and sea level rise could affect geology, minerals, soils, and paleontology due to the
anticipated increased soil temperature, altered runoff, increased frequency and severity of flood and
drought events, increased Delta salinity intrusion, and changes in rates of erosion. The relative effect of
climate change and sea level rise upon identified proposed Project impacts to these resources is uncertain.
Faults and Seismicity (Chapter 17)
Faults and seismicity are not expected to be affected by climate change and sea level rise. However, if
there is an effect, the relative effect of climate change and sea level rise upon identified proposed Project
impacts to this resource is uncertain.
Cultural Resources (Chapter 18)
Climate change and sea level rise are expected to affect cultural resources due to the anticipated increased
soil temperatures, altered runoff and erosion, increased frequency and severity of flood and drought
events, Delta salinity intrusion, and increased fire risk. The relative effect of climate change and sea level
rise upon identified proposed Project impacts to cultural resources is uncertain.
This document is not released as a draft EIR pursuant to CEQA Guidelines § 15087. As such, DWR is not soliciting and will not respond to commentssubmitted on this document, although any comments received will be retained and may be considered during preparation of a future draft EIR.
Chapter 25: Climate Change and Greenhouse Gas Emissions
PRELIMINARY – SUBJECT TO CHANGEPRELIMINARY ADMINISTRATIVE DRAFT DECEMBER 2013 25-57 NORTH-OF-THE-DELTA OFFSTREAM STORAGE PROJECT EIR/EISWBG020812033556SAC/433094/ (25-GHG_CC_PRELIM_ADMIN_DRAFT_DEC2013.DOCX)
Indian Trust Assets (Chapter 19)
The nature of Indian Trust Assets indicates a potential connection to other resource areas including land
use, surface water, minerals, and terrestrial and aquatic biological resources. However, as noted in
Chapter 19, there are no ITAs within the vicinity of the proposed Project study areas.
Land Use (Chapter 20)
Land use is expected to be affected by climate change and sea level rise due to the anticipated increased
air and soil temperature, altered runoff, Delta salinity intrusion, and increased fire risk. The relative effect
of climate change and sea level rise upon identified proposed Project impacts to land use is uncertain.
Recreation Resources (Chapter 21)
Climate change and sea level rise are expected to affect recreation resources due to the anticipated
increased temperatures, altered runoff, increased frequency and severity of flood and drought events, and
Delta salinity intrusion. These effects could result in changes in species abundance, habitat quality, pest
populations, and fire risk. Proposed Project implementation would result in increased surface water level
fluctuations at San Luis Reservoir. The relative effect of climate change and sea level rise upon identified
proposed Project impacts to San Luis Reservoir is uncertain.
Generally, recreation opportunities would be diminished when reservoir water storage levels are low.
Implementation of the proposed Project action alternatives is expected to improve storage conditions in
the reservoirs north of the Delta, including Trinity, Shasta, Oroville, and Folsom. The higher reservoir
levels associated with proposed Project implementation would provide recreation benefits at those
reservoirs. With climate change and sea level rise, the trend of Alternative C additional water in storage at
existing reservoirs would be reduced, but would still be an improvement, when compared to the No
Project/No Action Alternative.
Socioeconomics (Chapter 22)
Climate change and sea level rise are expected to affect socioeconomics due to the anticipated increased
temperatures, altered runoff, increased frequency and severity of flood and drought events, Delta salinity
intrusion, spread of pests, and increased fire risk. Specifically, climate change and sea level rise effects to
the CVP and SWP water systems could have various negative effects to socioeconomics, including an
increase in the price and availability of water, increasing crop prices as well. The relative effect of climate
change and sea level rise upon identified proposed Project impacts to socioeconomics is uncertain. From a
proposed Project perspective, the array of benefits appears to be sustainable with climate change and sea
level rise (refer to Figures 25-10 through 25-12). The unit value of the benefits would likely be greater
with the effects of climate change and sea level rise, assuming a typical supply and demand response
(i.e., as supply is diminished by climate change and sea level rise effects, a shortage would result in
higher water prices or value). Because the proposed Project benefits associated with Project objectives
appear sustainable and the unit values would likely be greater, some resilience or positive socioeconomic
effects appear likely with climate change and sea level rise as well.
Environmental Justice (Chapter 23)
Climate change and sea level rise are expected to affect the general population. Consequently, similar
effects are anticipated with minorities and low-income populations (i.e., environmental justice
populations) as well due to the anticipated increased temperatures, increased severity and frequency of
This document is not released as a draft EIR pursuant to CEQA Guidelines § 15087. As such, DWR is not soliciting and will not respond to commentssubmitted on this document, although any comments received will be retained and may be considered during preparation of a future draft EIR.

Chapter 25: Climate Change and Greenhouse Gas Emissions
PRELIMINARY – SUBJECT TO CHANGENORTH-OF-THE-DELTA OFFSTREAM STORAGE PROJECT EIR/EIS 25-58 PRELIMINARY ADMINISTRATIVE DRAFT DECEMBER 2013
WBG020812033556SAC/433094/ (25-GHG_CC_PRELIM_ADMIN_DRAFT_DEC2013.DOCX)
flood and drought events, Delta salinity intrusion, changes in species range, and distribution, and
increased fire risk. The relative effect of climate change and sea level rise upon identified proposed
Project impacts to environmental justice populations is uncertain.
Air Quality (Chapter 24)
Climate change and sea level rise are expected to affect air quality due to the anticipated increased air
temperatures, increased frequency and severity of floods, increased fire risk, and ocean acidification. The
relative effect of climate change and sea level rise upon identified proposed Project impacts to air quality
is uncertain.
Climate Change and Greenhouse Gas Emissions (Chapter 25)
Proposed Project operations would be similar with and without climate change and sea level rise. The
effects upon total GHG emissions associated with the proposed Project and pumping specifically would
be compensated by the GHG emission improvements related to the renewable integration operation of the
Project, as described in the GHG emissions portion of this chapter.
Navigation, Transportation, and Traffic (Chapter 26)
Climate change and sea level rise are expected to affect navigation, transportation, and traffic due to the
anticipated increased frequency and severity of floods. The relative effect of climate change and sea level
rise upon identified proposed Project impacts to navigation, transportation, and traffic is uncertain.
Noise (Chapter 27)
Noise is not expected to be affected by climate change and sea level rise. However, if there is an effect,
the relative effect of climate change and sea level rise upon identified proposed Project impacts to this
resource is uncertain.
Public Health and Environmental Hazards (Chapter 28)
Climate change and sea level rise are expected to affect public health and environmental hazards due to
the anticipated increased temperatures, increased frequency and severity of floods and droughts, Delta
salinity intrusion, spread of pests, and increased fire risk. The relative effect of climate change and sea
level rise upon identified proposed Project effects to public health and environmental hazards is uncertain.
Public Services and Utilities (Chapter 29)
Climate change and sea level rise is expected to potentially affect public services and utilities due to
anticipated increased temperature, increased frequency and severity of flood and drought events, spread
of pests, and increased fire risk. The relative effect of climate change and sea level rise upon identified
proposed Project effects to public service and utilities is uncertain.
Visual Resources (Chapter 30)
Climate change and sea level rise are expected to affect visual resources due to the anticipated increased
air and water temperatures, increased severity and frequency of flood and drought events, changes in
vegetation and wildlife species distribution, and increased fire risk. The relative effect of climate change
and sea level rise upon identified proposed Project effects to visual resources is uncertain.
This document is not released as a draft EIR pursuant to CEQA Guidelines § 15087. As such, DWR is not soliciting and will not respond to commentssubmitted on this document, although any comments received will be retained and may be considered during preparation of a future draft EIR.

Chapter 25: Climate Change and Greenhouse Gas Emissions
PRELIMINARY – SUBJECT TO CHANGEPRELIMINARY ADMINISTRATIVE DRAFT DECEMBER 2013 25-59 NORTH-OF-THE-DELTA OFFSTREAM STORAGE PROJECT EIR/EISWBG020812033556SAC/433094/ (25-GHG_CC_PRELIM_ADMIN_DRAFT_DEC2013.DOCX)
Power Production and Energy (Chapter 31)
Climate change and sea level rise are expected to affect power production and energy due to the
anticipated increased temperatures, altered runoff, and increased frequency and severity of flood and
drought events. Some of these climate change and sea level rise effects would increase or decrease
hydropower production; some would increase or decrease energy needs associated with the CVP and
SWP systems. The proposed Project is intended to provide a specific kind of adaptive capability for
power production and energy. Consistent with hydropower project objective, the proposed Project would
provide hydropower facilities to support integration of renewable energy sources. The relative effect of
climate change and sea level rise upon identified proposed Project impacts to power production and
energy is uncertain.
25.6 References
Allan, J. D., M. A. Palmer, and N. L. Poff (Allan et al.). (2005). Climate change and freshwater
ecosystems. In: Lovejoy TE, Hannah L (eds), Climate change and Biodiversity. Yale University
Press, New Haven, CT, pp 274–290. Accessed online at http://www-
personal.umich.edu/~dallan/pdfs/Allan_etal_2005_climate_freshwater.pdf
Anderson, J., F. Chung, M. Anderson, L. Brekke, D. Easton, M. Ejeta, R. Peterson, and R. Snyder
(Anderson et al.). 2006. Progress on Incorporating Climate Change into Management of
California’s Water Resources. Accessed online at
http://www.water.ca.gov/climatechange/docs/DWRClimateChangeJuly06.pdf
Auffhammer, M. 2011. Potential Impacts of Extreme Events on Electrical Energy Demand and
Infrastructure. Proceedings from Vulnerability and Adaptation to Extreme Events in California in
the Context of a Changing Climate: New Scientific Findings. Scripps Institute of Oceanography.
Tuesday, December 13, 2011.
Barnes, J. URS Corp. 2011. Personal communication with Pamela Vanderbilt/CH2M HILL. Construction
Equipment Data. July 2011.
Barnett, T. P., J. C. Adam, and D. P. Lettenmaier (Lettenmaier et al.). 2008. Potential impacts of a
warming climate on water availability in snow-dominated regions. Accessed online at
http://www.nature.com/nature/journal/v438/n7066/full/nature04141.html
Blunden, J. and D. S. Arndt, Eds. 2012. State of the Climate in 2011. Bulletin of the American
Meteorological Society 93 (7). SI-S264. Accessed online at
http://www1.ncdc.noaa.gov/pub/data/cmb/bams-sotc/climate-assessment-2011-lo-rez.pdf
California Air Pollution Control Officers Association (CAPCOA). 2013. California Emissions Estimator
Model – CalEEMod, 2013. Accessed online at http://www.caleemod.com/
California Air Resources Board (ARB). 2013. California Greenhouse Gas Inventory for 2000-2011 – by
Category as Defined in the 2008 Scoping Plan. Accessed online at
http://www.arb.ca.gov/cc/inventory/data/tables/ghg_inventory_scopingplan_00-11_2013-08-01.pdf
California Air Resources Board (ARB). 2011. Mobile Source Emission Inventory – EMFAC2011-LDV.
Accessed online at http://www.arb.ca.gov/msei/emfac2011_ldv.htm
This document is not released as a draft EIR pursuant to CEQA Guidelines § 15087. As such, DWR is not soliciting and will not respond to commentssubmitted on this document, although any comments received will be retained and may be considered during preparation of a future draft EIR.
Chapter 25: Climate Change and Greenhouse Gas Emissions
PRELIMINARY – SUBJECT TO CHANGENORTH-OF-THE-DELTA OFFSTREAM STORAGE PROJECT EIR/EIS 25-60 PRELIMINARY ADMINISTRATIVE DRAFT DECEMBER 2013
WBG020812033556SAC/433094/ (25-GHG_CC_PRELIM_ADMIN_DRAFT_DEC2013.DOCX)
California Climate Change Center (CCCC). 2009. The Impacts of Sea-level Rise on the California Coast.
CEC-500-2009-024-F. August 2009.
California Department of Fish and Game (DFG). 2010. Climate Change: Confronting the Challenge, Fall
2010. Accessed online at
http://nrm.dfg.ca.gov/FileHandler.ashx?DocumentID=31839&inline=true
California Department of Water Resources (DWR). 2012a. DWR Climate Action Plan Phase 1,
Greenhouse Gas Emissions Reduction Plan, May 2012. Accessed online at
http://www.water.ca.gov/climatechange/docs/Final-DWR-ClimateActionPlan.pdf
California Department of Water Resources (DWR). 2012b. Draft Bay Delta Conservation Plan, Effects
Analysis, Appendix 5.A.2, April 2012.
California Department of Water Resources (DWR). 2012c. Bay Delta Conservation Plan, Administrative
Draft Environmental Impact Report/Environmental Impact, Appendix 5A, June 2012.
California Department of Water Resources (DWR). 2011. Equipment and personnel estimates for
maintenance of facilities for proposed Project’s Alternatives A, B, and C
California Department of Water Resources (DWR). 2009. California Water Plan Update, Bulletin 160-09,
December 2009. Accessed online at
http://www.waterplan.water.ca.gov/docs/cwpu2009/0310final/v1_all_cwp2009.pdf
California Department of Water Resources (DWR). 2008. Managing an Uncertain Future. Climate
Change Adaptation Strategies for California’s Water. October 2008. Accessed online at
http://www.water.ca.gov/climatechange/docs/ClimateChangeWhitePaper.pdf
California Energy Commission (CEC). 2011. California Climate Change Portal. Accessed online at
http://www.climatechange.ca.gov/
California Irrigation Management Information System (CIMIS). 2011. CIMIS Data. Environmental
database retrieval of meteorological data. Sacramento, California. Accessed online at
http://wwwcimis.water.ca.gov/cimis/
California Natural Resources Agency (CNRA). 2009. California Climate Adaptation Strategy: A Report
to the Governor and Legislature in Response to Executive Order S0308. December 2009.
Accessed online at http://www.climatechange.ca.gov/adaptation/
Cayan, D., M. Tyree, M. Dettinger, H. Hidalgo, T. Das, E. Maurer, P. Bromirski, N. Graham, and R.
Flick (Cayan et al.). 2009. Climate Change Scenarios and SLR Estimates for the California 2008
Climate Change Scenarios Assessment. Prepared by the California Climate Change Center for the
California. Accessed online at http://www.energy.ca.gov/2009publications/CEC-500-2009-
014/CEC-500-2009-014-D.PDF
Cole, J. J., Y. T. Prairie, N. F. Caraco, W. H. McDowell, L. J. Tranvik, R. G. Striegl, C. M. Duarte, P.
Kortelainen, J. A. Downing, J. J. Middelburg, and J. Melack (Cole et al.). 2007. Plumbing the
global carbon cycle: Integrating inland waters into the terrestrial carbon budget. Ecosystems 10:
171–184. Accessed online at http://www.ymparisto.fi/download.asp?contentid=67358
This document is not released as a draft EIR pursuant to CEQA Guidelines § 15087. As such, DWR is not soliciting and will not respond to commentssubmitted on this document, although any comments received will be retained and may be considered during preparation of a future draft EIR.

Chapter 25: Climate Change and Greenhouse Gas Emissions
PRELIMINARY – SUBJECT TO CHANGEPRELIMINARY ADMINISTRATIVE DRAFT DECEMBER 2013 25-61 NORTH-OF-THE-DELTA OFFSTREAM STORAGE PROJECT EIR/EISWBG020812033556SAC/433094/ (25-GHG_CC_PRELIM_ADMIN_DRAFT_DEC2013.DOCX)
Desert Research Institute, Western Regional Climate Center. 2009. Accessed online at
http://www.wrcc.dri.edu/summary/climsmnca.html; Tehama County – Redbluff -
http://www.wrcc.dri.edu/cgi-bin/cliMAIN.pl?caredb+nca; Glenn County – Willows 6 -
http://www.wrcc.dri.edu/cgi-bin/cliMAIN.pl?cawil6+nca; and Colusa County – Colusa 2 SSW -
http://www.wrcc.dri.edu/cgi-bin/cliMAIN.pl?cacolu+nca.
Dettinger, M. 2011. Climate Change, Atmospheric Rivers, and Floods in California – A Multimodel
Analysis of Storm Frequency and Magnitude Changes. Journal of the American Water Resources
Association (JAWRA) 47(3). Accessed online at
http://onlinelibrary.wiley.com/doi/10.1111/j.1752-1688.2011.00546.x/abstract
Dettinger, Michael D. and Daniel R. Cayan. 1995. Large-Scale Atmospheric Forcing of Recent Trends
toward Early Snowmelt Runoff in California. J. Climate, 8, 606–623. Accessed online at
http://journals.ametsoc.org/doi/abs/10.1175/1520-
0442(1995)008%3C0606%3ALSAFOR%3E2.0.CO%3B2
Gershunov, A. 2011. Expected Changes in Key Weather Related Extreme Events in California.
Proceedings from Vulnerability and Adaptation to Extreme Events in California in the Context of
a Changing Climate: New Scientific Findings. Scripps Institute of Oceanography. Tuesday,
December 13, 2011.
Hellmann, J., J. Byers, B. Bierwagen, and J. Dukes (Hellman et al.). 2008. Five Potential Consequences
of Climate Change for Invasive Species. Accessed online at
http://onlinelibrary.wiley.com/doi/10.1111/j.1523-1739.2008.00951.x/abstract
Intergovernmental Panel on Climate Change (IPCC). 2007a. Climate Change 2007: The Physical Science
Basis. Contribution of Working Group I to the Fourth Assessment Report of the
Intergovernmental Panel on Climate Change. S. Solomon, D. Qin, M. Manning, Z. Chen, M.
Marquis, K. B. Averyt, M. Tignor and H. L. Miller (eds.). New York, NY: Cambridge University
Press. Accessed online at
http://www.ipcc.ch/publications_and_data/publications_and_data_reports.shtml
Intergovernmental Panel on Climate Change (IPCC). 2007b. Climate Change 2007: Impacts, Adaptation
and Vulnerability. Contribution of Working Group II to the Fourth Assessment Report of the
Intergovernmental Panel on Climate Change. M. L. Parry, O. F. Canziani, J. P. Palutikof, P. J.
van der Linden and C. E. Hanson (eds.). New York, NY: Cambridge University Press. Accessed
online at http://www.ipcc.ch/publications_and_data/publications_and_data_reports.shtml
Intergovernmental Panel on Climate Change (IPCC). 2001. Third Assessment Report - Climate Change
2001. Accessed online at http://www.grida.no/publications/other/ipcc_tar/
Intergovernmental Panel on Climate Change (IPCC). 1996. Revised 1996 IPCC Guidelines for National
Greenhouse Gas Inventories. Accessed online at http://www.ipcc-
nggip.iges.or.jp/public/gl/invs1.html
Jackson, L. 2011. Extreme Events and Agriculture Production in California. Proceedings from Vulnerability
and Adaptation to Extreme Events in California in the Context of a Changing Climate: New Scientific
Findings. Scripps Institute of Oceanography. Tuesday, December 13, 2011.
This document is not released as a draft EIR pursuant to CEQA Guidelines § 15087. As such, DWR is not soliciting and will not respond to commentssubmitted on this document, although any comments received will be retained and may be considered during preparation of a future draft EIR.

Chapter 25: Climate Change and Greenhouse Gas Emissions
PRELIMINARY – SUBJECT TO CHANGENORTH-OF-THE-DELTA OFFSTREAM STORAGE PROJECT EIR/EIS 25-62 PRELIMINARY ADMINISTRATIVE DRAFT DECEMBER 2013
WBG020812033556SAC/433094/ (25-GHG_CC_PRELIM_ADMIN_DRAFT_DEC2013.DOCX)
Janetos, A., L. Hansen, D. Inouye, B. P. Kelly, L. Meyerson, B. Peterson, and R. Shaw (Janetos et al.).
2008. The effects of climate change on agriculture, land resources, water resources, and
biodiversity in the United States. A report by the U.S. Climate Change Science Program and the
subcommittee on Global Change Research. Washington, DC. 362 pp. Accessed online at
http://www.amwa.net/galleries/climate-change/CCSP_Ag_Report.pdf
Kapnick, Sarah and Alex Hall (Kapnick and Hall). 2009. Observed Changes in Sierra Nevada Snowpack:
Potential Causes and Concerns. March 2009. Accessed online at
http://www.energy.ca.gov/2009publications/CEC-500-2009-016/CEC-500-2009-016-F.PDF
Moser, S., G. Franco, S. Pittiglio, W. Chou, and D. Cayan (Moser et al.). 2009. The Future is Now: An
Update on 19 Climate Change Science Impacts and Response Options for California (Special
Report California 20 Climate Change Center). Prepared for the California Energy Commission.
May 2009. Accessed online at http://www.energy.ca.gov/2008publications/CEC-500-2008-
071/CEC-500-2008-071.PDF
National Oceanic & Atmospheric Administration (NOAA). 2005. Frequently Asked Questions –
Questions about Greenhouse Gases. Accessed online at
http://www.esrl.noaa.gov/gmd/outreach/faq_cat-3.html
National Research Council (NRC). 2012. Sea-Level Rise for the Coasts of California, Oregon, and
Washington: Past, Present, and Future (2012). Accessed online at
http://www.nap.edu/catalog.php?record_id=13389
Rahmstorf, S. 2007. A Semi-Empirical Approach to Projecting Future Sea Level Rise. Science 315:368–370.
DOI: 10.1126/science.1141283. Accessed online at http://www.pik-
potsdam.de/~stefan/Publications/Nature/rahmstorf_science_2007.pdf
Ryan, M. G., S. R. Archer, R. Birdsey, C. Dahm, L. Heath, J. Hicke, D. Hollinger, T. Huxman, G. Okin,
R. Oren, J. Randerson, and W. Schlesinger (Ryan et al.). 2008. “Land Resources.” The Effects of
climate change on Agriculture, Land Resources, Water Resources, and Biodiversity in the United
States. A report by the U.S. Climate Change Science Program and the subcommittee on Global
Change Research. Washington, DC. Accessed online at http://www.amwa.net/galleries/climate-
change/CCSP_Ag_Report.pdf
Soumis, N., E. Duchemin, R. Canuel, and M. Lucotte (Soumis et al.). 2004. Greenhouse gas emissions
from reservoirs of the western United States. Accessed online at
http://onlinelibrary.wiley.com/doi/10.1029/2003GB002197/full
Tremblay, A., J. Therrien, B. Hamlin, A. Wichmann, and L. J. LeDrew (Tremblay et al.). 2005. GHG
Emissions from Boreal Reservoirs and Natural Aquatic Ecosystems. Accessed online at
http://link.springer.com/chapter/10.1007%2F978-3-540-26643-3_9
U.S. Army Corps of Engineers (USACE). 2009. Water Resource Policies and Authorities Incorporating
Sea-level Change Considerations in Civil Works Programs. 2009. Accessed online at
http://planning.usace.army.mil/toolbox/library/ECs/EC1165-2-211_1Jul2009.pdf
U.S. Bureau of Reclamation (Reclamation). 2011a. SECURE Water Act Section 9503(c) – Reclamation
Climate Change and Water, April 2011. Accessed online at
http://www.usbr.gov/climate/SECURE/docs/SECUREWaterReport.pdf
This document is not released as a draft EIR pursuant to CEQA Guidelines § 15087. As such, DWR is not soliciting and will not respond to commentssubmitted on this document, although any comments received will be retained and may be considered during preparation of a future draft EIR.

Chapter 25: Climate Change and Greenhouse Gas Emissions
PRELIMINARY – SUBJECT TO CHANGEPRELIMINARY ADMINISTRATIVE DRAFT DECEMBER 2013 25-63 NORTH-OF-THE-DELTA OFFSTREAM STORAGE PROJECT EIR/EISWBG020812033556SAC/433094/ (25-GHG_CC_PRELIM_ADMIN_DRAFT_DEC2013.DOCX)
U.S. Bureau of Reclamation (Reclamation). 2011b. Technical Memorandum 86-68210-2010-03.
Literature Synthesis on Climate Change Implications for Water and Environmental Resources,
Second Edition, January 2011. Accessed online at
http://www.usbr.gov/research/docs/climatechangelitsynthesis.pdf
U.S. Environmental Protection Agency (USEPA). 2013. Inventory of U.S. Greenhouse Gas Emissions
and Sinks: 1990 – 2011. April 12. Accessed online at
http://www.epa.gov/climatechange/Downloads/ghgemissions/US-GHG-Inventory-2013-Main-
Text.pdf
U.S. Environmental Protection Agency (USEPA). 2012. eGrid 2012 Version 1.0. (Year 2009 data)
CAMX subregion emissions factor for total output emissions rate. Accessed online at
http://www.epa.gov/cleanenergy/documents/egridzips/eGRID2012V1_0_year09_SummaryTables
Veermeer, M. and S. Rahmstorf. 2009. Global sea level linked to global temperature. Accessed online at
http://www.pik-potsdam.de/~stefan/Publications/Journals/vermeer_rahmstorf_2009.pdf
Wang, J., H. Yin, and F. Chung. 2011. Isolated and Integrated Effects of Sea Level Rise, Seasonal Runoff
Shifts, and Annual Runoff Volume on California’s Largest Water Supply, Journal of Hydrology.
May 2011. Accessed online at
http://www.sciencedirect.com/science/article/pii/S0022169411003222
This document is not released as a draft EIR pursuant to CEQA Guidelines § 15087. As such, DWR is not soliciting and will not respond to commentssubmitted on this document, although any comments received will be retained and may be considered during preparation of a future draft EIR.

F igures
This document is not released as a draft EIR pursuant to CEQA Guidelines § 15087. As such, DWR is not soliciting and will not respond to commentssubmitted on this document, although any comments received will be retained and may be considered during preparation of a future draft EIR.
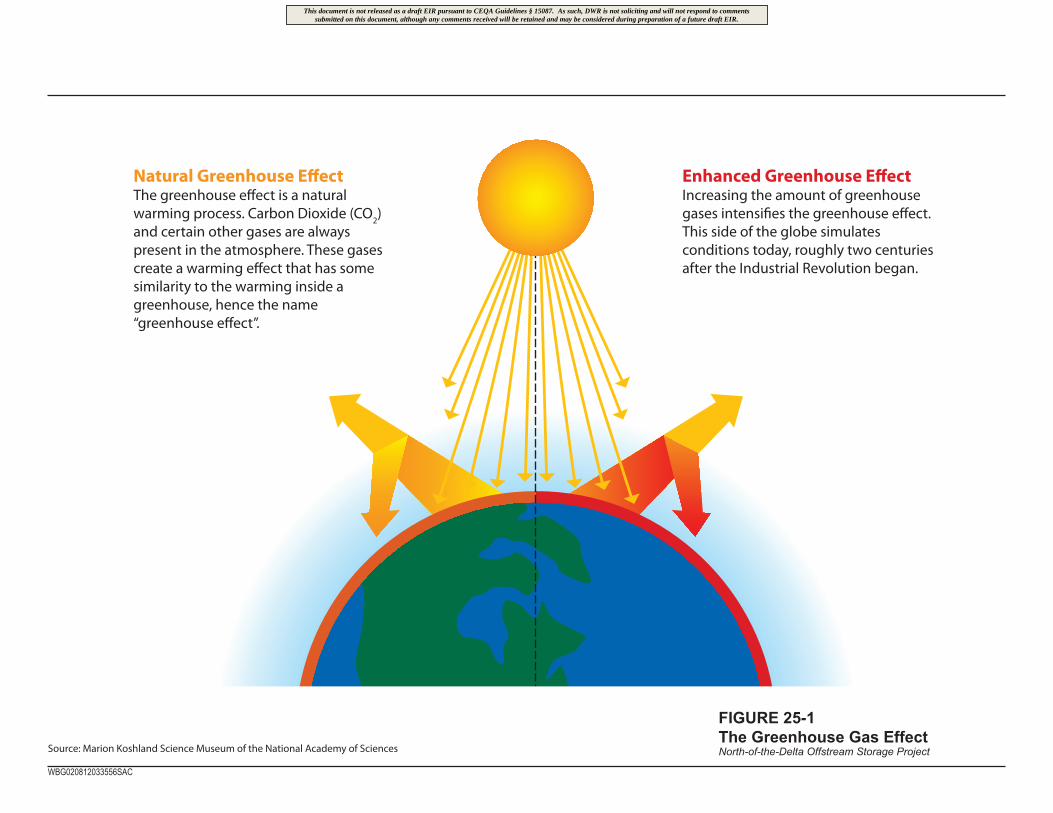
Natural Greenhouse EffectThe greenhouse effect is a natural warming process. Carbon Dioxide (CO
2)
and certain other gases are always present in the atmosphere. These gases create a warming effect that has some similarity to the warming inside a greenhouse, hence the name “greenhouse effect”.
Enhanced Greenhouse EffectIncreasing the amount of greenhouse gases intensifies the greenhouse effect. This side of the globe simulates conditions today, roughly two centuries after the Industrial Revolution began.
Source: Marion Koshland Science Museum of the National Academy of Sciences
FIGURE 25-1The Greenhouse Gas EffectNorth-of-the-Delta Offstream Storage Project
WBG020812033556SAC
This document is not released as a draft EIR pursuant to CEQA Guidelines § 15087. As such, DWR is not soliciting and will not respond to commentssubmitted on this document, although any comments received will be retained and may be considered during preparation of a future draft EIR.

FIGURE 25-2Alternative A Total Emissions - Historical and Projected, 1990-2050North-of-the-Delta Offstream Storage Project
WBG020812033556SAC
This document is not released as a draft EIR pursuant to CEQA Guidelines § 15087. As such, DWR is not soliciting and will not respond to commentssubmitted on this document, although any comments received will be retained and may be considered during preparation of a future draft EIR.

FIGURE 25-3Alternative B Total Emissions - Historical and Projected, 1990-2050North-of-the-Delta Offstream Storage Project
WBG020812033556SAC
This document is not released as a draft EIR pursuant to CEQA Guidelines § 15087. As such, DWR is not soliciting and will not respond to commentssubmitted on this document, although any comments received will be retained and may be considered during preparation of a future draft EIR.
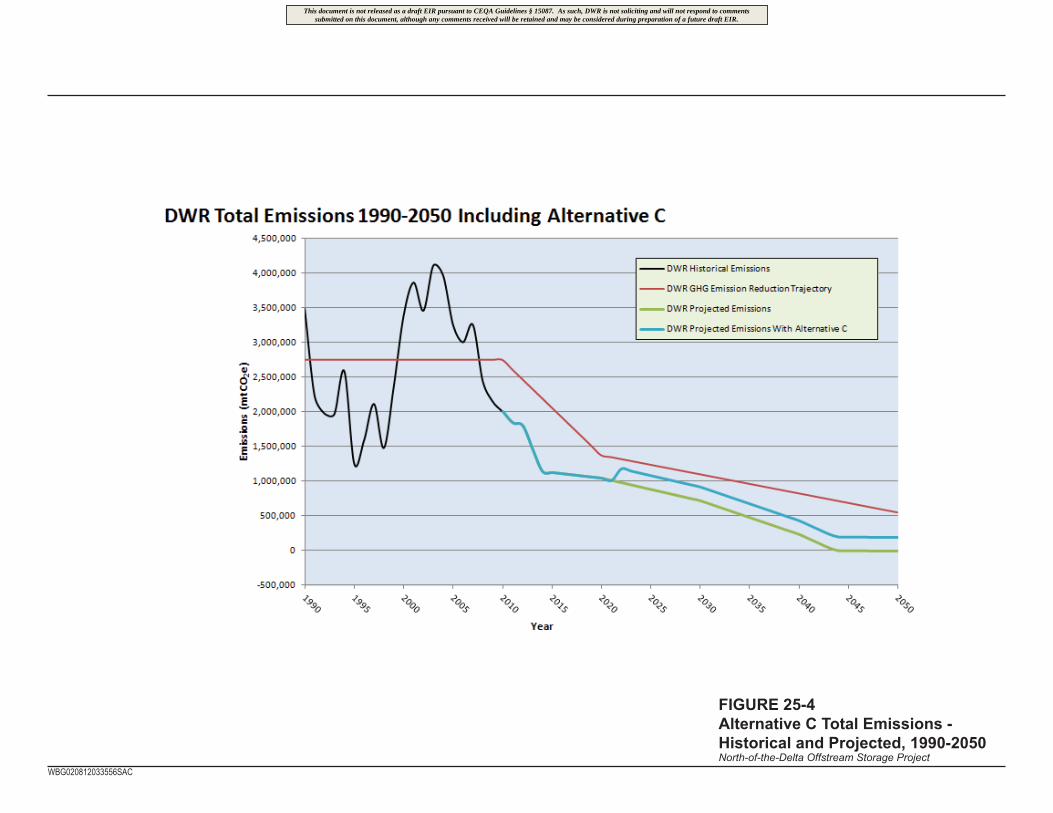
FIGURE 25-4Alternative C Total Emissions - Historical and Projected, 1990-2050North-of-the-Delta Offstream Storage Project
WBG020812033556SAC
This document is not released as a draft EIR pursuant to CEQA Guidelines § 15087. As such, DWR is not soliciting and will not respond to commentssubmitted on this document, although any comments received will be retained and may be considered during preparation of a future draft EIR.

0.0
0.5
1.0
1.5
2.0
2.5
-30.0 -20.0 -10.0 0.0 10.0 20.0 30.0
Tem
pera
ture
Cha
nge
(C)
Precipitation Change (%)
112 GCMs
Q1 (10NN)
Q2 (10NN)
Q3 (10NN)
Q4 (10NN)
T50
P50
T10
P10
T90
P90
T25
P25
T75
P75
Q2 (drier, more warming)
Q4 (we er, less warming)Q1 (drier, less warming)
Q3 (we er, more warming)
Q5
Relationship Between Changes in Mean Annual Temperature and PrecipitationEnsembles - 10 NN Method
Feather River Basin (Example)
FIGURE 25-5Example Downscaled Climate Projections used for Deriving Climate Ensembles (Q1-Q5) for the Feather River Basin for the ELT Scenario (Year 2025, Climate Period 2011 to 2040)North-of-the-Delta Offstream Storage Project
WBG020812033556SAC
Note: The Q5 ensemble is bounded by the 25th and 75th percentile joint temperature-precipitation change. Ensembles Q1-Q4 are selected to reflect the results of the ten (10) projections nearest each of 10th and 90th joint temperature-precipitation change bounds.
This document is not released as a draft EIR pursuant to CEQA Guidelines § 15087. As such, DWR is not soliciting and will not respond to commentssubmitted on this document, although any comments received will be retained and may be considered during preparation of a future draft EIR.

FIGURE 25-6No Project/No Action Alternative Showing the Trend and Range of Impact of ELT Q5, LLT Q5, LLT Q2, and LLT Q4 Climate Change and Sea Level Rise Scenarios on Average Shasta Lake End-of-September StorageNorth-of-the-Delta Offstream Storage Project
WBG020812033556SAC
LLT Q4
Current
ELT Q5
LLT Q5
2,200
2,400
2,600
2,800
age
(TAF
)No Project/No Action Alternative
Shasta Lake, Storage (End of September)
LLT Q2
1,600
1,800
2,000
Current Year 15 Year 50
Stor
a
Upper (Current LLT Q4)
Trend (Current ELT LLT Q5)
Lower (Current LLT Q2)
This document is not released as a draft EIR pursuant to CEQA Guidelines § 15087. As such, DWR is not soliciting and will not respond to commentssubmitted on this document, although any comments received will be retained and may be considered during preparation of a future draft EIR.
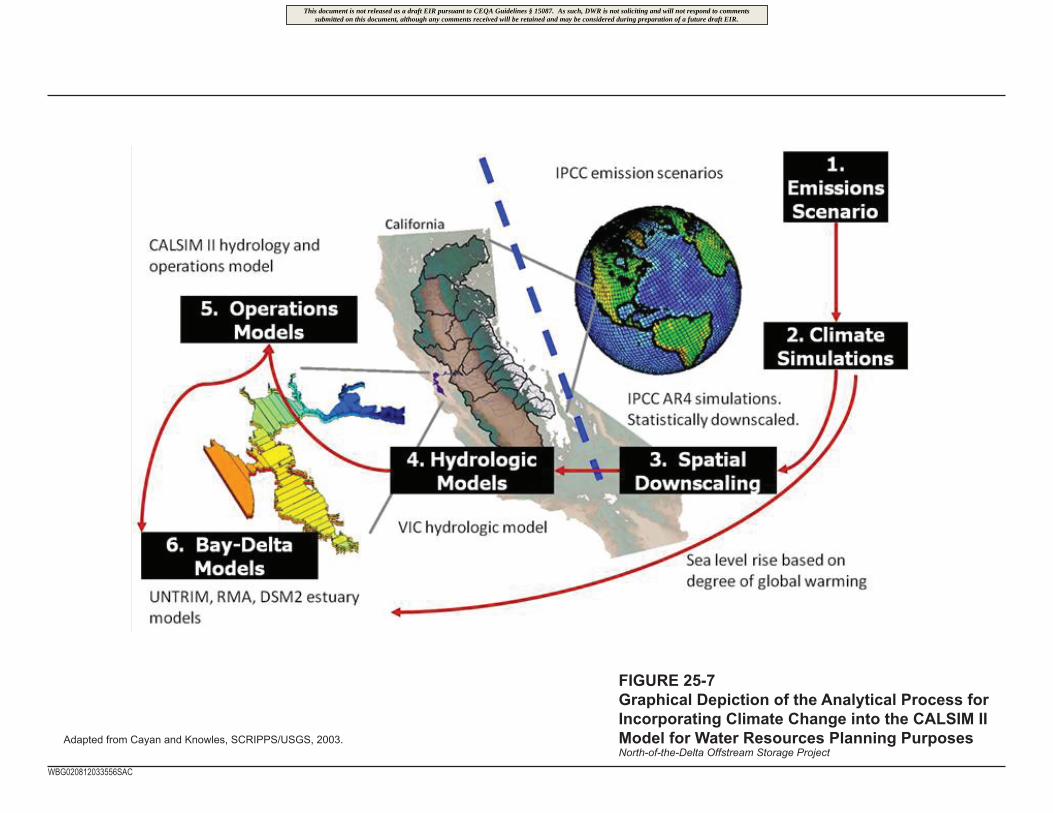
FIGURE 25-7Graphical Depiction of the Analytical Process for Incorporating Climate Change into the CALSIM IIModel for Water Resources Planning PurposesNorth-of-the-Delta Offstream Storage Project
WBG020812033556SAC
Adapted from Cayan and Knowles, SCRIPPS/USGS, 2003.
This document is not released as a draft EIR pursuant to CEQA Guidelines § 15087. As such, DWR is not soliciting and will not respond to commentssubmitted on this document, although any comments received will be retained and may be considered during preparation of a future draft EIR.
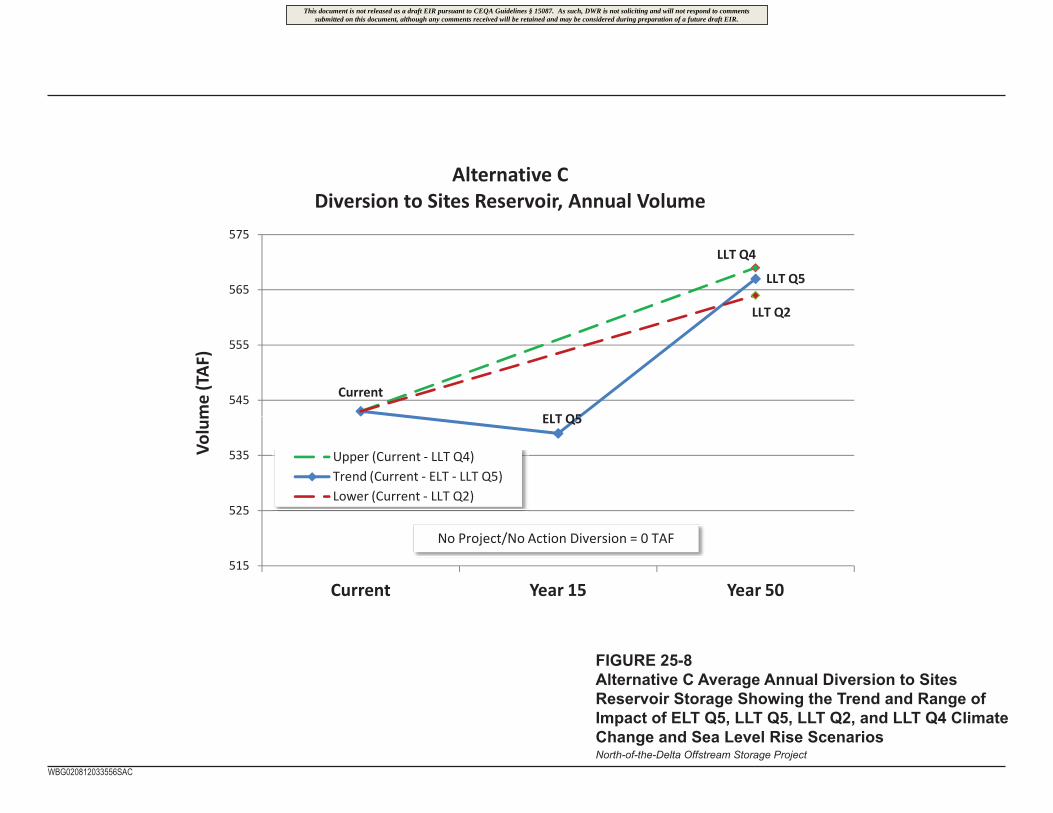
FIGURE 25-8Alternative C Average Annual Diversion to Sites Reservoir Storage Showing the Trend and Range of Impact of ELT Q5, LLT Q5, LLT Q2, and LLT Q4 Climate Change and Sea Level Rise Scenarios North-of-the-Delta Offstream Storage Project
WBG020812033556SAC
LLT Q4
Current
ELT Q5
LLT Q5
LLT Q2
545
555
565
575
me
(TAF
)Alternative C
Diversion to Sites Reservoir, Annual Volume
ELT Q5
515
525
535
Current Year 15 Year 50
Volu
m
Upper (Current LLT Q4)
Trend (Current ELT LLT Q5)
Lower (Current LLT Q2)
No Project/No Action Diversion = 0 TAF
This document is not released as a draft EIR pursuant to CEQA Guidelines § 15087. As such, DWR is not soliciting and will not respond to commentssubmitted on this document, although any comments received will be retained and may be considered during preparation of a future draft EIR.

FIGURE 25-9Alternative C Average Additional Water in Storage compared to the No Project/No Action Alternative, End of September, Including Trinity, Shasta, Oroville, and Folsom Reservoirs Showing the Trend and Range of Impact of ELT Q5, LLT Q5, LLT Q2, and LLT Q4 Climate Change and Sea Level Rise ScenariosNorth-of-the-Delta Offstream Storage Project
WBG020812033556SAC
LLT Q4
Current ELT Q5
LLT Q5
1,550
1,600
1,650of
May
Stor
age
(TAF
)
Alternative CNorth of Delta, Additional Storage (End of May)
LLT Q2
1,400
1,450
1,500
Current Year 15 Year 50
Addi
tiona
lEnd
o
Upper (Current LLT Q4)
Trend (Current ELT LLT Q5)
Lower (Current LLT Q2)
This document is not released as a draft EIR pursuant to CEQA Guidelines § 15087. As such, DWR is not soliciting and will not respond to commentssubmitted on this document, although any comments received will be retained and may be considered during preparation of a future draft EIR.
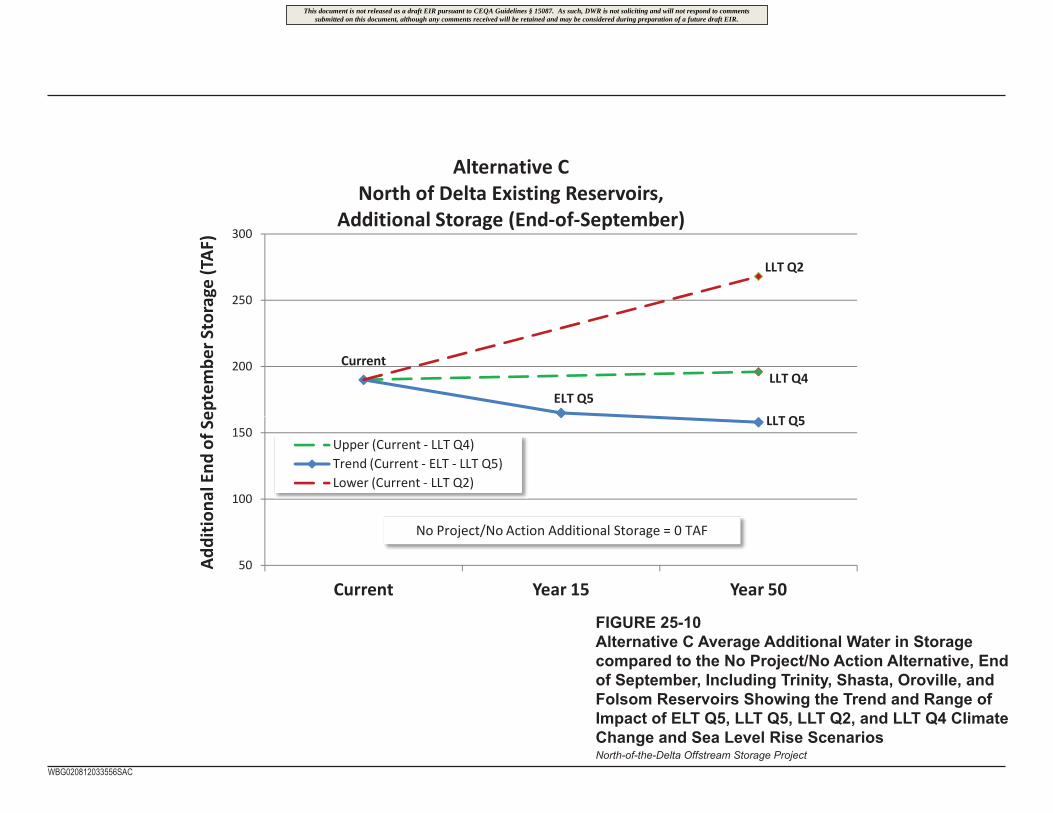
FIGURE 25-10Alternative C Average Additional Water in Storage compared to the No Project/No Action Alternative, End of September, Including Trinity, Shasta, Oroville, and Folsom Reservoirs Showing the Trend and Range of Impact of ELT Q5, LLT Q5, LLT Q2, and LLT Q4 Climate Change and Sea Level Rise ScenariosNorth-of-the-Delta Offstream Storage Project
WBG020812033556SAC
LLT Q4Current
ELT Q5LLT Q5
LLT Q2
200
250
300
epte
mbe
rSto
rage
(TAF
)
Alternative CNorth of Delta Existing Reservoirs,
Additional Storage (End of September)
LLT Q5
50
100
150
Current Year 15 Year 50
Addi
tiona
lEnd
ofSe
Upper (Current LLT Q4)
Trend (Current ELT LLT Q5)
Lower (Current LLT Q2)
No Project/No Action Additional Storage = 0 TAF
This document is not released as a draft EIR pursuant to CEQA Guidelines § 15087. As such, DWR is not soliciting and will not respond to commentssubmitted on this document, although any comments received will be retained and may be considered during preparation of a future draft EIR.

FIGURE 25-11Alternative C Average SWP and CVP Exports from the Delta Showing the Trend and Range of Impact of ELT Q5, LLT Q5, LLT Q2, and LLT Q4 Climate Change and Sea Level Rise ScenariosNorth-of-the-Delta Offstream Storage Project
WBG020812033556SAC
Current
ELT Q5
LLT Q5LLT Q2
5 100
5,110
5,120
5,130
5,140
5,150
iver
sion
(TAF
)
Alternative CBanks (SWP) and Jones (CVP) Pumping Plants,
Annual Diversion
LLT Q4
5,060
5,070
5,080
5,090
5,100
Current Year 15 Year 50
Di
Upper (Current LLT Q4)
Trend (Current ELT LLT Q5)
Lower (Current LLT Q2)
No Project/No Action Diversion = 4,902 TAF
This document is not released as a draft EIR pursuant to CEQA Guidelines § 15087. As such, DWR is not soliciting and will not respond to commentssubmitted on this document, although any comments received will be retained and may be considered during preparation of a future draft EIR.

FIGURE 25-12Alternative C Average X2 Position During July through September Showing the Trend and Range of Impact of ELT Q5, LLT Q5, LLT Q2, and LLT Q4 Climate Change and Sea Level Rise ScenariosNorth-of-the-Delta Offstream Storage Project
WBG020812033556SAC
LLT Q2
82.0
82.2
82.4
82.6
82.8
83.0on
(Kilo
met
ers)
Alternative CX2 Position, Average July through September
Upper (Current LLT Q4)
Trend (Current ELT LLT Q5)
Lower (Current LLT Q2)
LLT Q4
CurrentELT Q5
LLT Q5
81.2
81.4
81.6
81.8
82.0
Current Year 15 Year 50
X2Po
sitio
No Project/No Action X2 Position = 83.0 km
This document is not released as a draft EIR pursuant to CEQA Guidelines § 15087. As such, DWR is not soliciting and will not respond to commentssubmitted on this document, although any comments received will be retained and may be considered during preparation of a future draft EIR.

FIGURE 25-13No Project/No Action Alternative and Alternative C Average Dead Storage Occurrences (Number of Months) at Trinity, Shasta, Oroville, Folsom, and San Luis reservoirs (Trend with Current, ELT Q5, and LLT Q5 Scenarios)North-of-the-Delta Offstream Storage Project
WBG020812033556SAC
LLT Q5
60
80
100
120
140
mon
thsa
tres
ervo
irs)
Alternative CDead Pool Storage Conditions at System Reservoirs
Alternative C (Current ELT LLT Q5)
No Project/No Action (Current ELT LLT Q5)
Current
ELT Q5
0
20
40
60
Current Year 15 Year 50
Occ
uren
ces
(m
This document is not released as a draft EIR pursuant to CEQA Guidelines § 15087. As such, DWR is not soliciting and will not respond to commentssubmitted on this document, although any comments received will be retained and may be considered during preparation of a future draft EIR.