Embed Size (px)
Citation preview
25-05-2018
1
Central Water Commission 2
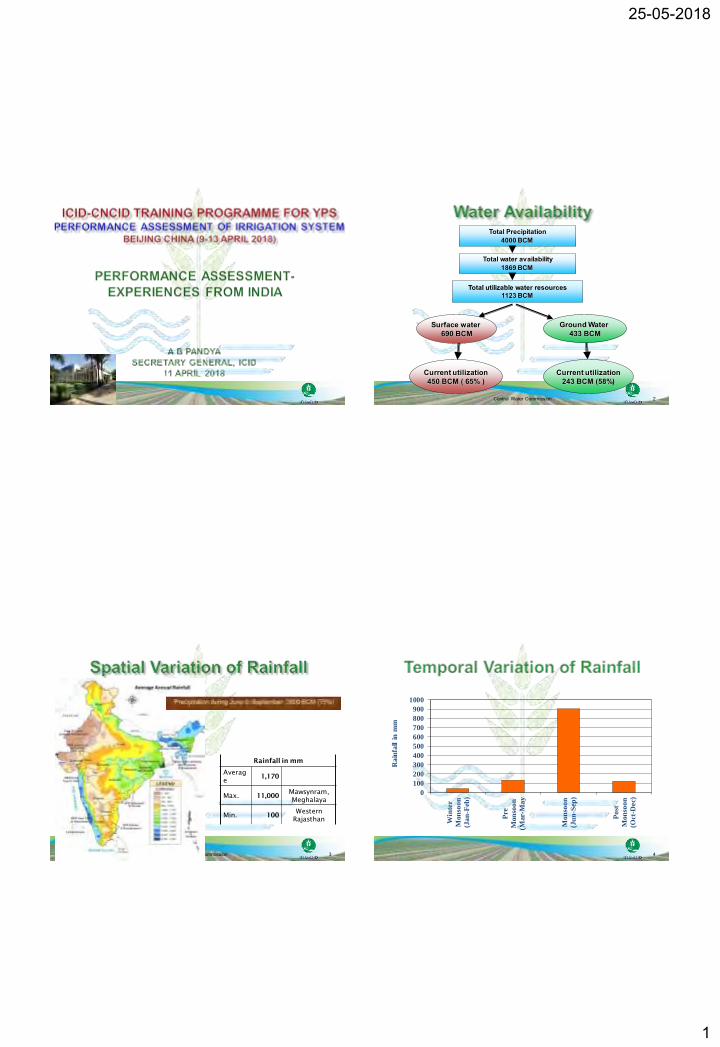
Total utilizable water resources1123 BCM
Ground Water 433 BCM
Surface water 690 BCM
Current utilization450 BCM ( 65% )
Current utilization243 BCM (58%)
Total water availability1869 BCM
Total Precipitation4000 BCM
Central Water Commission 3
Rainfall in mm
Averag
e1,170
Max. 11,000Mawsynram,
Meghalaya
Min. 100Western
Rajasthan
4
0
100
200
300
400
500
600
700
800
900
1000
Win
ter
Mon
soo
n
(Ja
n-F
eb)
Pre
Mon
soo
n
(Mar-
Ma
y
Mon
soo
n
(Ju
n-S
ep)
Po
st
Mon
soo
n
(Oct
-Dec)
Ra
infa
ll in
mm

25-05-2018
2
5
SlNo.
Total Water Requirement for Different Uses (in BCM)
Uses Year 2025 Year 2050
1. Irrigation 611 807
2. Domestic 62 111
3. Industries 67 81
4. Power 33 70
5. Others 70 111
Total 843 1180
Population Estimate
1.3 Billion 1.5 Billion
Assumptions: ▪ Increase in efficiency in irrigation from present level of 35% to 60% by 2050▪ Increase in productivity for rainfed agriculture from 1 to 1.5 and Irrigated
agriculture from 3.0 to 4.0 t/ha
➢ Total Cultivable Land: 181.98 Mha➢ Ultimate Irrigation Potential: 139.89 Mha➢ Potential Created (Mar 12): 113.53 Mha
Major & Medium: 47.97 Mha Minor: 65.56 Mha
➢ Gross Sown Area: 195.25 Mha➢ Gross Irrigated Area: 91.53 Mha➢ Net Sown Area: 140.80 Mha➢ Net Irrigated Area: 65.26 MHa
6
To answer Why, What and How to improve the efficiency of the project
To setup a benchmark to evaluate the projects against them for prioritisation of improvement measures, if any.
To adjust the project to new demand scenario emerging out of long term developments.
To find the design and planning deviations affecting the performance of the project to an optimum level.
Leverage the new technologies available now for better management of the project.
Efficiency Values (%)Reservoir Efficiency 95%-98%Conveyance Efficiency
Fully Lined systemPartially Lined systemUnlined system
70%-75%65%60%
On farm application Efficiency
Sprinkler/Drip IrrigationBasin/Furrow Irrigation
85%60%
Drainage Efficiency 80%IPU/IPC 85%
Overall WUE 60-65%
How to reach

25-05-2018
3
Input resource assessment- The yield patterns achieved against those assumed in the design, especially the temporal distribution
Distribution system capabilities- constraints of implementation, unauthorised extensions, new demands, state of the system
On farm usage- cropping patterns, application methods, present agro-climatic environment
Management- systems in place, social structues and management methods needing improvement/ introduction
Key takeaway is that these are all interrelated. Attacking any single aspect will not yield the desired results.
Inflow + Sediment
Seepage from bed and sides
Evaporation from surface
Power releases
Seepage back to system
Seepage contributing to
groundwater
Releases for use
Direct leakage/Uncontrolled
spills
PH
Operation Policy
Unaccounted withdrawal form reservoir
STORAGE
Head works
Missing/ broken Regulator structure/Measuring device for Supply to WUAs
ID Channels (Main, Br., Dy. (> 150 Cusecs)
WUAs Minor Channels (< 150 Cusecs)
Loss Delivery
Project
CONVEYANCE SYSTEM UNDER WRD/WUA CONTROL
Fields
Farm Inlet (Nakas)
A. Inappropriate design, siltationB. Evaporation loss from canal surfaceC. Transpiration from HyacinthD. Seepage from bed, sidesE. Unaccounted withdrawal as a lossF. Management based (operational) lossesG. Diversions for other use H. Inappropriate outlet designI. Unaccounted outlet/field channel losses/
over irrigation
A B C
D E F G
B
C
G
D
F
A
IH
E
Rainfall DewPumped Ground Water
Initial Soil Water Moisture
On-farm supply
On-Farm Storage Storage
AugmentationOn Farm Storage Loss
Evaporation, TranspirationSeepage, Leakage
Farmer’s Field
Water supplied by WUA though outlet/field rotation
FIELD APPLICATION/CROP PRODUCTIVITY
Soil Moisture retained for crop production
Crop Produced
Water Consumed by crop
Water Transpired by Crop, Soil
Water loss transpired by weed
Soil Moisture required for leaching
25-05-2018
4
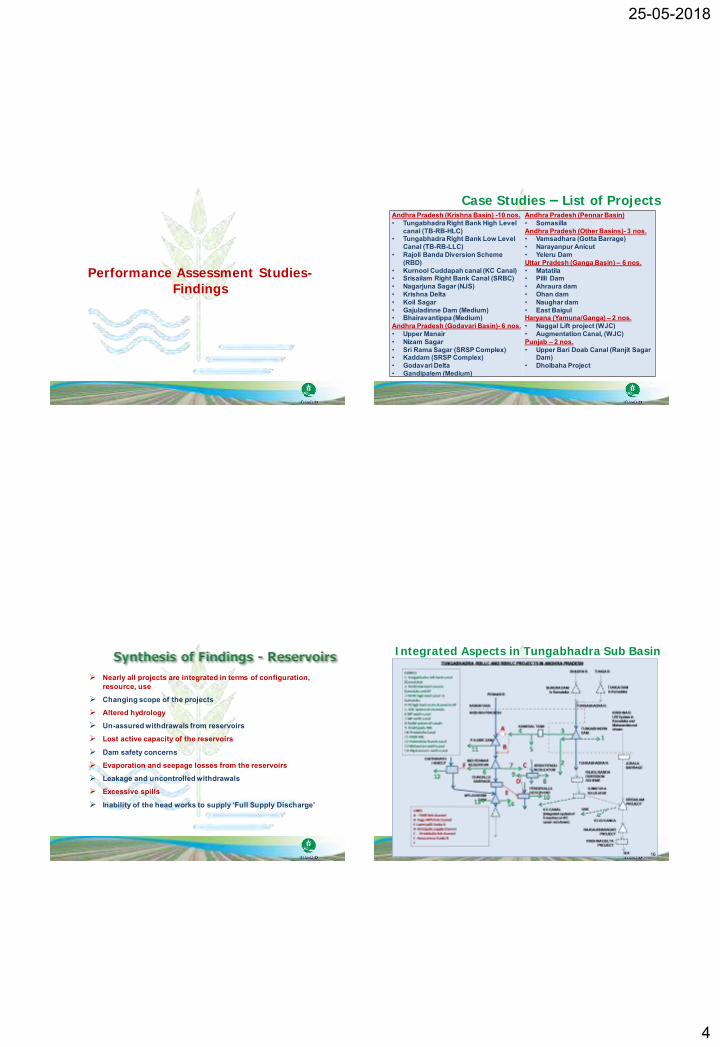
Performance Assessment Studies-
Findings
Andhra Pradesh (Krishna Basin) -10 nos.• Tungabhadra Right Bank High Level
canal (TB-RB-HLC)• Tungabhadra Right Bank Low Level
Canal (TB-RB-LLC) • Rajoli Banda Diversion Scheme
(RBD)• Kurnool Cuddapah canal (KC Canal) • Srisailam Right Bank Canal (SRBC)• Nagarjuna Sagar (NJS)• Krishna Delta• Koil Sagar• Gajuladinne Dam (Medium)• Bhairavantippa (Medium)Andhra Pradesh (Godavari Basin)- 6 nos.• Upper Manair• Nizam Sagar• Sri Rama Sagar (SRSP Complex)• Kaddam (SRSP Complex)• Godavari Delta• Gandipalem (Medium)
Andhra Pradesh (Pennar Basin)• Somasilla Andhra Pradesh (Other Basins)- 3 nos.• Vamsadhara (Gotta Barrage)• Narayanpur Anicut• Yeleru DamUttar Pradesh (Ganga Basin) – 6 nos.• Matatila• Pilli Dam• Ahraura dam • Ohan dam• Naughar dam• East BaigulHaryana (Yamuna/Ganga) – 2 nos.• Naggal Lift project (WJC) • Augmentation Canal, (WJC) Punjab – 2 nos. • Upper Bari Doab Canal (Ranjit Sagar
Dam)• Dholbaha Project
Case Studies – List of Projects
➢ Nearly all projects are integrated in terms of configuration, resource, use
➢ Changing scope of the projects➢ Altered hydrology➢ Un-assured withdrawals from reservoirs➢ Lost active capacity of the reservoirs
➢ Dam safety concerns➢ Evaporation and seepage losses from the reservoirs➢ Leakage and uncontrolled withdrawals➢ Excessive spills
➢ Inability of the head works to supply ‘Full Supply Discharge’
Integrated Aspects in Tungabhadra Sub Basin
16
25-05-2018
5
Maharashtra: GWDT Allocation
623 MCM (22 TMC)CA – 10484 Sq. Km.
KarnatakaGWDT Allocation:
404 MCM (14.27 TMC)CA- 3688 Sq. Km.
Andhra Pradesh:GWDT allocation:
1784 MCM (63 TMC) CA- 7521 Sq. Km.
Sri Ram Sagar Reservoir
Manjira dam
Tiruna dam
Choukinala dam
Karanjia dam
Singur dam
Manjira Barrage
Ghanpur Anicut
Nizam Sagar Anicut
Nizam Sagar CommandDy. 1 to 49 (56152 ha)
Nizam Sagar CommandDy. 50 to 72 (21769 ha)
Nizam Sagar CommandDy. 73 to 82 (15699 ha )
CA below Nizam Sagar - 9151 Sq. Km.
Aliagar LIS
Gutpah LIS
Nizam Sagar CommandDy. 73 to 82 (13408 ha )
Shifted to SRSP
Nizam Sagar Command 107028 ha
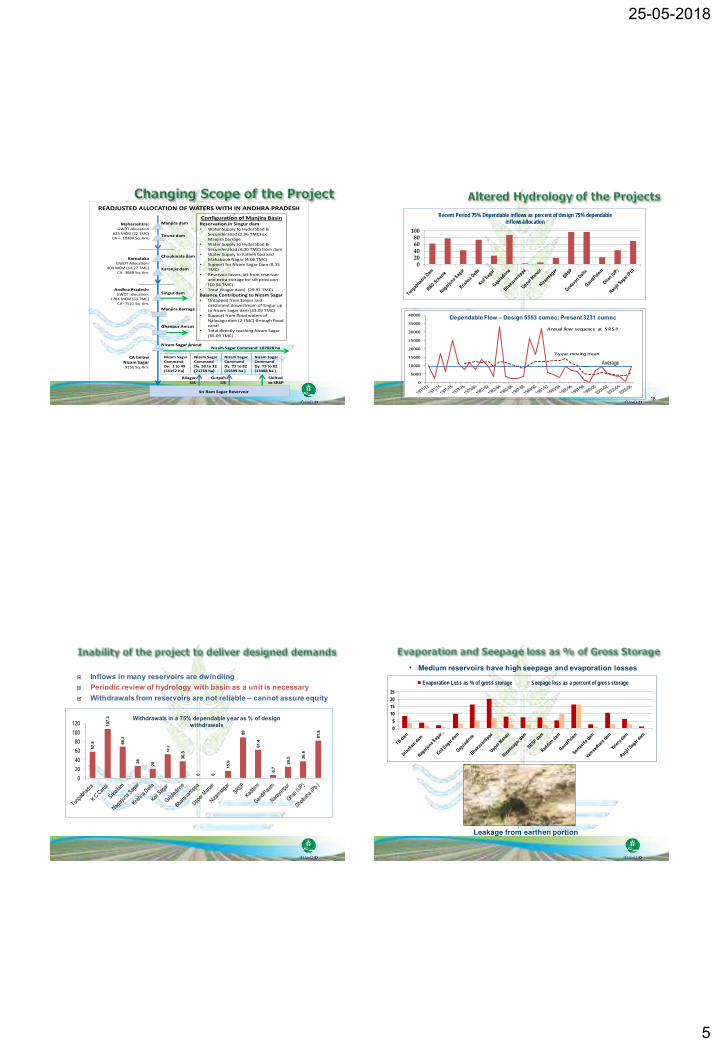
Configuration of Manjira BasinReservation in Singur dam• Water Supply to Hyderabad &
Secunderabad (2.96 TMC) ex Manjira barrage
• Water Supply to Hyderabad & Secunderabad (4.00 TMC) from dam
• Water Supply to Fatheh bad and Mahaboob Nagar (4.06 TMC)
• Support for Nizam Sagar Dam (8.35 TMC)
• Reservoir losses, lift from reservoir and extra storage for silt provision (10 54 TMC)
• Total )Singur dam) (29.91 TMC)
Balance Contributing to Nizam Sagar • Untapped from Singur and
catchment downstream of Singur up to Nizam Sagar dam (33.09 TMC)
• Support from flood waters of Nalavagu dam (2 TMC) through flood canal
• Total directly reaching Nizam Sagar (35.09 TMC)
READJUSTED ALLOCATION OF WATERS WITH IN ANDHRA PRADESH
18
020406080
100
Recent Period 75% Dependable inflows as percent of design 75% dependable inflows/allocation
0
5000
10000
15000
20000
25000
30000
35000
40000
Annual flow sequence at SRSP
7-year moving mean
Dependable Flow – Design 5553 cumec; Present 3231 cumec
Average
Inflows in many reservoirs are dwindling Periodic review of hydrology with basin as a unit is necessary Withdrawals from reservoirs are not reliable – cannot assure equity
57.8
107.
3
68.3
26 20
52.2
36.3
0 0
15.9
89
61.4
6.7
24.5 36
.6
81.8
0
20
40
60
80
100
120Withdrawals in a 75% dependable year as % of design
withdrawals0
5
10
15
20
25
Evaporation Loss as % of gross storage Seepage loss as a percent of gross storage
• Medium reservoirs have high seepage and evaporation losses
Leakage from earthen portion
25-05-2018
6
60
73
50
100
30
0
50
89
100
45
30
0
100
82
20
0
100
100
70
0
10
100
0 0
0
20
40
60
80
100
120
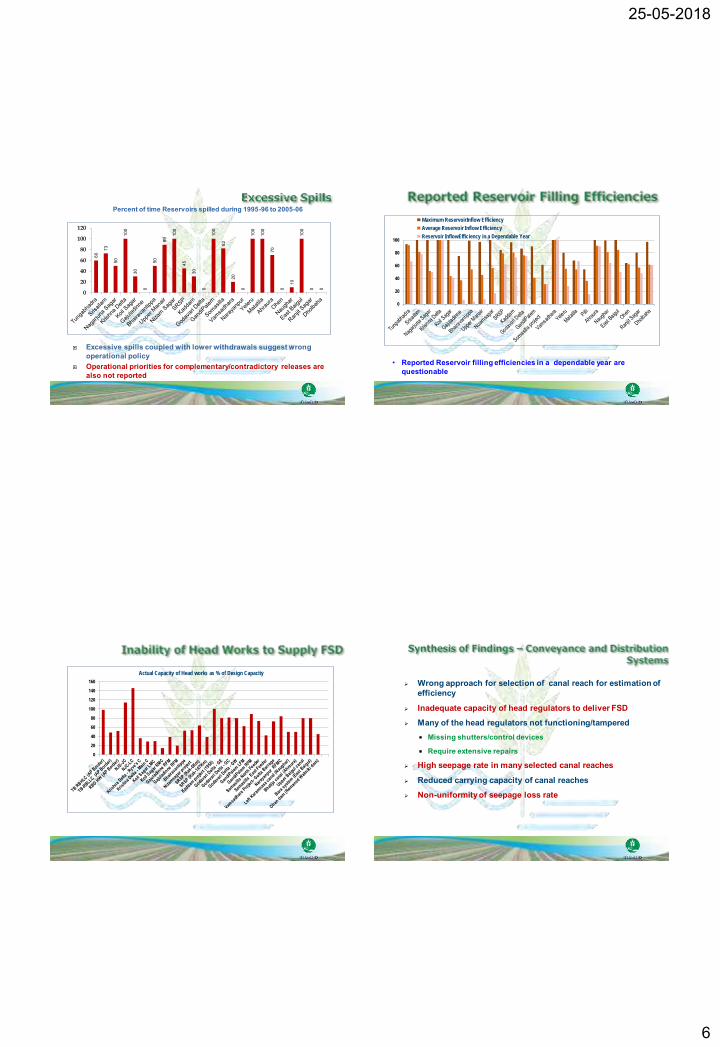
Percent of time Reservoirs spilled during 1995-96 to 2005-06
Excessive spills coupled with lower withdrawals suggest wrong operational policy
Operational priorities for complementary/contradictory releases are also not reported
0
20
40
60
80
100
Maximum ReservoirInflow Efficiency
Average Reservoir Inflow Efficiency
Reservoir InflowEfficiency in a Dependable Year
• Reported Reservoir filling efficiencies in a dependable year are questionable
0
20
40
60
80
100
120
140
160
Actual Capacity of Head works as % of Design Capacity
➢ Wrong approach for selection of canal reach for estimation of efficiency
➢ Inadequate capacity of head regulators to deliver FSD➢ Many of the head regulators not functioning/tampered
Missing shutters/control devices
Require extensive repairs
➢ High seepage rate in many selected canal reaches
➢ Reduced carrying capacity of canal reaches ➢ Non-uniformity of seepage loss rate

25-05-2018
7
➢ PIM Act not enacted/ functional in some states
➢ Canal Operational Concerns High leakages, over withdrawals, thefts common
Assurance on supplies non-existent
Information on farm delivery not recorded
Warabandi/ canal roster not adhered to
Sometimes only one watering is given
0
40
80
120
160
200
TB
-RB
LL
C (
AP
)
RB
D (
AP
)
KC
Ca
nal
(R
each
-1)
(New
)
Na
gar
jun
a J
C
Na
gar
jun
a -
LC
Kri
sh
na
Del
ta (
Ry
ves
)
Kri
sh
na
Del
ta (
WC
)
Ko
il S
aga
r (L
MC
)
Ko
il S
aga
r (R
MC
)
Gaj
ula
din
ne
(RF
MC
)
Bh
air
ava
nti
pp
a (
RF
MC
)
Niz
am
sag
ar
pro
ject
SR
SP
(K
akti
ya 0
Km
)
SR
SP
(K
akti
ya 1
47 K
m)
Ka
dd
am (
LM
C)
Go
da
vari
Del
ta (
Eas
t)
Go
da
vari
Del
ta (
Wes
t)
Go
da
vari
Del
ta (
Ce
ntr
al)
Gan
diP
ale
m (
LF
MC
)
Gan
diP
ale
m (
RF
MC
)
So
ma
sill
a (S
ou
th F
eed
er)
So
ma
sill
a (N
ort
h F
eed
er)
Na
raya
np
ur
(RF
MC
)
Na
raya
np
ur
(Dy)
Ch
au
kia
Dy.
(A
hru
ra)
(UP
)
Mu
gal
Sa
rai m
ain
can
al (
Ah
rura
)…
Da
ula
tab
ad (
Ah
rura
) (U
P)
Go
bin
dp
ur
(Nau
gh
ar)
(U
P)
Sid
ha
Dy
. (N
au
gh
ar)
(UP
)
Bh
ati
ja D
y. (
Na
ug
har
) (U
P)
Au
gm
enta
tio
n c
ana
l (H
ary
ana
)
Oh
en
(A
gh
ud
ya
Min
or)
(U
P)
Oh
en
(A
rwar
a M
ino
r) (
UP
)
Oh
en
dam
(M
ain
) (U
P)
Pam
bra
Dy
. (D
ho
lbah
a)
(Pb
.)
HR MR TR
0
10
20
30
Canal Loss - cumec/million sq m
010203040506070
Canal Loss - cumec/million sq m
Design loss rate: Rock 0.91, Black Cotton Soil – 1.83, Alluvium Soils – 2.74, Decayed rock or gravel – 3.0 cumec/million sq m
0
20
40
60
80
100

25-05-2018
8
Water Availability : Farmers feed back
S. No. Availability of irrigation water at required time
Farmers
Number Percent
1 Yes 221 42.7
2 No 296 57.3
Total 517 100.0
Table. Availability of irrigation water at required time
249
115
41 27
84.138.8
13.8 9.10
50
100
150
200
250
300
Conveyancesystem is faulty
Head reachfarmers are notreleasing water
Water is notreleased as andwhen required
Canal runsbelow the level
of fields
Number of farmers Percent
Fig. Reasons for not getting the irrigation water
➢ Cropping pattern in most of the dams is not changed, only crop area changed to suit water availability (SRBC is an exception)
➢ Wherever groundwater coexists, cropped area is stabilized
➢ Diversification from paddy to irrigated dry crops suggested without any assurance on farmers income/alternate livelihood
➢ Drainage is not a real issue except in case of Delta area projects
➢ Waterlogging is a concern in some of the canal commands
➢ Created irrigation potential does not match CCA – PPA/localized command area is proposed for irrigation potential creation;
➢ Utilized irrigation potential matches creation in some of the years suggesting gap in potential due to development is reduced
➢ However, gap in potential increases in the years of low flow, suggesting reduced cropped area due to non availability of water in canals
02,00,0004,00,0006,00,0008,00,000
10,00,00012,00,000
Area under crop reported by ID (2005-06) Area under crop reported by APSRAC (2005-06)
98
513
161
63
0 18 20
246
105
440
0
130
90 67
11 41
76
0
97
191
0100200300400500600
Percent growth of crops from other source as reported by Irrigation Department
63
25 12 17
53 44
114
59
244
82
59
35
2 11
37
0
50
100
150
200
250
300
Ground water utilization as percent of ground water recharge from irrigation in case of projects from Andhra Pradesh

25-05-2018
9
58
45
52
45
34
54
46
75
45
67
45
57
36
54
38
32
58
31 28
80
65
27
72
65
91
0
20
40
60
80
100 Baseline On-farm water use efficiencies
47
32
43
28
17
22
40
62
36
58
39
45
18
45
28
18
53
15 14
54
38
22
57
33
53
010203040506070 Target efficiency line (60%) Project Efficiency
0
20
40
60
80
100
120
IPU as % of IPC in a year of maximum potential utilized IPU as % of IPC in a year of munimum potential utilized
Attributes Score Attributes Score
1 Project is inter-state 23/30 12 PIM introduced but not yet implemented
20/30
2 Project is integrated 22/30 13 IMT has taken place 0/303 Hydrology is disturbed 17/21 14 Warabandi is being implemented 4/304 Project is not able to meet
requirements15/20 15 CD & CM are not in order 17/26
5 Active live storage is affected 16/24 16 Water measuring devices are not in place
30/30
6 Project has dam safety concerns 25/28 17 Actual cropping pattern deviates from design cropping pattern
6/19
7 Evaporation losses from reservoir are excessive
7/20 18 Irrigation from other source is substantial
23/27
8 Seepage losses from reservoir are excessive
5/19 19 Diversification from paddy is recommended
16/29
9 Head work is not capable of taking FSD
21/29 20 Drainage is not adequate 7/28
10 Head regulators are not supplying FSD
19/25 21 New/field/intermediate and link drains required
5/29
11 Canal capacities do not meet design discharge
23/25 22 Water logging salinity/alkalinity is a concern
9/29
• Storage: Consistent and continuous efforts in improving the performance of storage infrastructure within the basin context to improve availability of flows at canal head(s);
• Conveyance: Better design and improved conveyance and distribution system in both engineering and management sense;
• On-Farm application: Improving on-farm efficiencies through better practices, improved drainage and ensuring other quality inputs leading to better production and productivity;
• Participatory: Gradually decreasing the role of administration in managing the canal systems and promoting the role of beneficiaries in asset management in an accountable and sustainable manner;
• Crop management: Crop diversification, adoption of low water intensive crops, better farm management practices, micro irrigation systems and quality inputs to improve productivity;
• R&D: Continued research and development, and periodic monitoring and evaluation through water auditing and benchmarking

25-05-2018
10
37
Assessment of Gap in EfficienciesProject Type Conveyance
EfficiencyOn- Farm Efficiency Project Efficiency
To be achieved
Gap To be achieved
Gap To be achieved
Gap
Large Storage systems
90% 0-47% 66.67% 0-40% 60% 2-46%
Diversion 85% 2-23% 70.59% 19-25% 60% 17-31%
Delta 95% 4-48% 63.16% 5-32% 60% 7-45%
• Attaining 60% efficiency would be a difficult task
• As a short term solution CADWM Programme component on ‘Correction of System Deficiencies’ may be reviewed using MASSCOTE approach of FAO;
• Long run solution to improve Conveyance would be to shift to basin approach under IWRM
• Improving On farm efficiency – conservation and integration of all sources of water within command, harvest rainwater, diversification to low water intensive varieties, adopting improved methods of cultivation- SRI / SSI, shift to MIS-drip and sprinkler for new projects
➢ Land Resources - 2.45%➢ Renewable Water Resources - 4%➢ Population - 18%
39
Land Resources Renewable Water Population
5177
2200
114013401545
1820
0
1000
2000
3000
4000
5000
6000
1951 1991 2001 2011 2025 2050
Wat
er A
vaili
bilty
(Cub
ic m
etre
per
ca
pita
per
yea
r)
Water Scarcity Line1000 cu. m. per person per year
Water Stress Line1700 cu. m. per person per year
25-05-2018
11
41
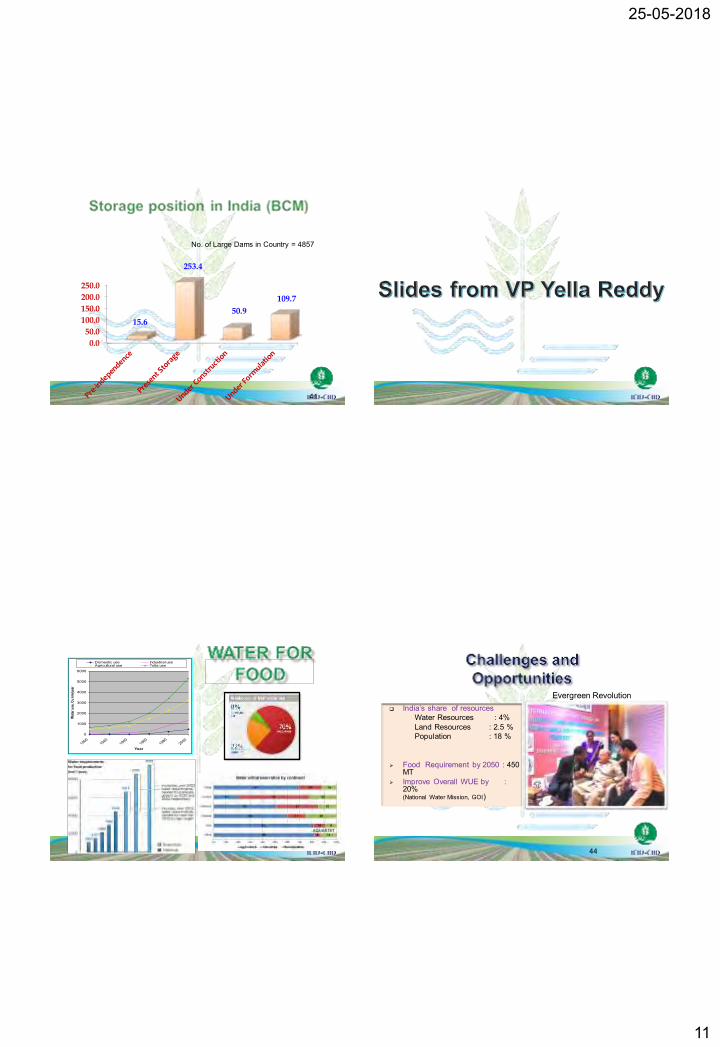
0.0
50.0
100.0
150.0
200.0
250.0
15.6
253.4
50.9
109.7
No. of Large Dams in Country = 4857
0
1000
2000
3000
4000
5000
6000
19001920
19401960
19802000
Year
Wate
r use
, Cu k
m/ye
ar
Domestic use Industrial useAgricultural use Totla use
❑ India’s share of resourcesWater Resources : 4% Land Resources : 2.5 %Population : 18 %
➢ Food Requirement by 2050 : 450 MT
➢ Improve Overall WUE by : 20%(National Water Mission, GOI)
44
Evergreen Revolution

25-05-2018
12
Water for domestic demand
46
47
S. N. Project Reservoir ᶯ Canal ɳ On-Farm ᶯ Overall ᶯ
1 KDS 100 87.4 46.18 40.36
2 GDS 100 83.21 46.09 45.05
3 KC Canal NA 62.25 45.15 28.10
4 NSP 100 55.96 38.93 21.80
5 Nizamsagar 75.95 87 45.32 39.43
6 RDS 100 82.83 51.51 42.66
7 Somasila 72.16 56.3 31.84 18.00
8 SRSP 95.05 77.98 57.28 44.66
9 TBPHLC 42.51 80.90 58.32 47.13
10 TBPLLC 100 72.13 44.80 32.23
11 Vamsadhara 100 90.50 58.47 52.91
12 Yeleru 28 50.00 28.42 14.21

25-05-2018
13
Common reasons for low WUE Common recommendations for improvement of WUE
i) Damaged structures ii) Silting in the canal system iii) Poor maintenance iv) Weed growth in the canal
system v) Seepage in the system vi) Over-irrigation vii) Un trained farmers viii) Changing the cropping
pattern
Rehabilitation and restoration of damaged/siltedcanal systemProper and timely maintenance of the systemSelective lining of the canal and distribution systemRealistic and scientific systemoperationRevision of cropping pattern, if neededRestoration/provision of appropriate controlstructuresEfficient and reliable communication systemReliable and accurate water measuring systemConjunctive use of ground and surface waterRegular revision of water rate Encouragement forformation of Water Users’AssociationTraining to farmersMicro-credit facilitiesAgricultural extension servicesEncouragement to farmers for raising livestock
49
Priority on use of water NWP on impact of climate change Enhancing water availability for different use Demand management
Project appraisal and environmental impact assessment for water uses to inter-alia include:
i) analysis of water foot prints,ii) recycle and reuse including return flows ,iii)incentivizing economic use of water iv)adaptation to water saving means v) performance monitoring and vi) reclamation of commands from water logging,
salinity and alkalinity.
Regulation of water prices Project planning & implementation Data base and information needs (WRIS) Capacity building, research and training needs
o Increase water use efficiency by 20%
o Water Footprints and Water Auditing (assessment of water
use),
need to be developed.
o Continuous water balance and water accounting studies
o Methods to encourage water saving (Ex. Micro Irrigation)
o Conjunctive ground water use
o Participatory Approach: Users of water should be involved in
monitoring the pattern of water use
Water Footprint is quite simply the volume of water used. At theindividual level, this is expressed in litres. But at the national level, thisbecomes complex - The water footprint of a nation is equal to the useof domestic water resources, minus the virtual water export flows, plusthe virtual water import flows.
VIRTUAL WATERThe term ‘virtual water’ was introduced by Tony Allan in the early1990s. It is defined as the volume of water required to produce acommodity or service.

25-05-2018
14
Eating water? YesHow many litre a day
1.3 billion ton food is lost or wasted every
year (FAO)
Water MeasurementThe engineers of I&CAD Department should installspecial water measurement structures like RBCflumes as a standard procedure in all their newirrigation projects; the same applies for theirmodernization projects of existing schemes.
54
The engineers of I&CAD Department, officials of
Agriculture and Ground Water Department should
be offered trainings on a regular basis on irrigation
modernisation, crop irrigation requirements
including effective rainfall contribution, water
budgeting, latest aspects of water measurement
and regulation, participatory approaches in water
management and women’s participation in AWM.
Direct seeding / MSRI / AWD for rice in harmony with soil microbial technologies in maximizing the water use efficiency.
Water Saving Crop Production Technologies
25-05-2018
15
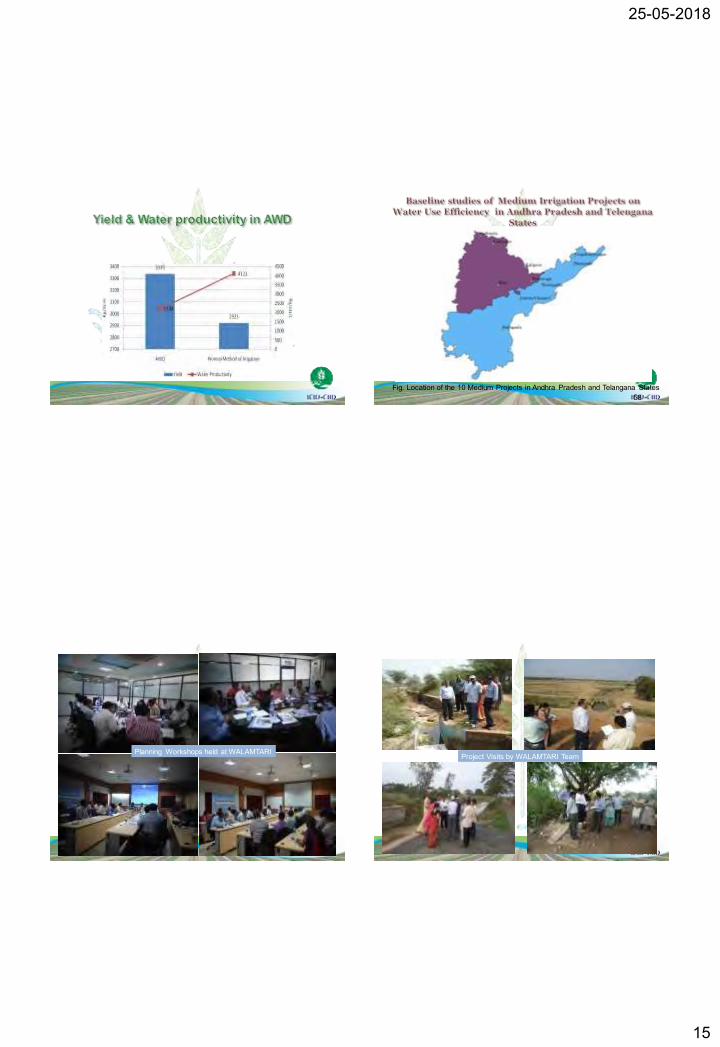
58Fig. Location of the 10 Medium Projects in Andhra Pradesh and Telangana States
Planning Workshops held at WALAMTARI Project Visits by WALAMTARI Team

25-05-2018
16
Stakeholder Workshops
Thatipudi ReservoirTorrigadda Main Canal
Musi Reservoir Vattivagu Reservoir
Detailed Investigations
Socioeconomic SurveyCanal Hydraulic Studies
Velocity Measurement Crop Ground Truth
Irrigation Infrastructure Application

25-05-2018
17
Crop Ground Truth Application
66
To irrigate and fertigate the plant instead of soil
AP Micro Irrigation Project: lunched in 2003
Target : 0.25 M ha with Rs11,760 million in 5 yr
Achieved: 1.1M ha with Rs 41,700 million in 10 yr
National Task Force on MI in 2003: 69 M ha potential
I. Total Area Covered : 1.0427 m haa) Drip : 0.7617 m hab) Sprinkler : 0.2810 m ha
II. MI system costa) Total : Rs 41,708 Million b) Farmers contribution : Rs
10,427 MillionIII. Annual cost (CRF 0.2055) based on
a) Total cost : Rs 8,571 Million b) Farmers contribution : Rs 2,143
MillionIV. Additional yield
@Rs 15,000/ha minimum : Rs 15,640 MillionV. Payback period based (II/IV)
a) Total cost : 2.7 yearsb) Farmers contribution : 0.7 year
VI. Every rupee on MI yields (IV/III)a) Total annual cost : Rs 1.8b) Farmers annual cost : Rs 7.3
Additional benefitsa. Water saving : 149 TMCb. Energy saving: 417 million
unitc. Labor savingd. Employment avenue
LAYOUT OF LIMIP
WATER DISTRIBUTION NETWORK OF LIMIP
Distributory
Sump 2
Sump 1
DP 2
DP 1 PVC pipe
PVC pipe
CROSS SECTIONAL VIEW
Minor
➢ Sump is required to store water during non-pumping hours
➢ Capacity depends upon a) Duty of the water b) Area under each sumpc) Operating time of irrigation system
MICROIRRIGATION IN CANAL COMMANDS

25-05-2018
18
DC4 MIRYALAGUDA
S.
No.
WUA Name and
No.
1 Borraipalem-23
2Applalmmagud
em-24
3 Kallepally-25
4 Kondrapolu-26
5Damarcherla-
27
6 Kesavapur-28
Area: 8497 ha
DC2
1 NARSARAOPET
S.
No.
WUA Name and
No.
1Gollapadu -
167
2Sathuluru -
168
3Kanaparru –
169
4Nadendla 1 -
170
5Erlla Padu -
171
6Kavuru 2 -
172
7Nadendla 2 -
173
Adaptation to climate change: An integrated science-stakeholder-policy approach for water and agricultural sectors
PROJECT PAERTNERS
Project AchievementsImportance of CC &WUEInteraction with Scientists and line dept officialsExhibition of technologiesFarmers Feedback
SCHOOL CHIDREN
AWARENESS AND
TRAINING

25-05-2018
19
Water is an Economic Good
Water Measurement
Demand Based Water Delivery
Virtual Water Approach
Incentivizing WUE
Irrigation Asset Management
Promoting PIM
Respect Agriculture
73