Embed Size (px)
Citation preview


29MAR201010272681
Starwood Property Trust, Inc.591 West Putnam Avenue
Greenwich, Connecticut 06830
April 3, 2013
Dear Fellow Shareholder,
When Starwood Property Trust, Inc. (STWD) was created just three and a half years ago, it wasour stated intention to build a commercial real estate (CRE) finance business focused on providing ourshareholders a superior risk adjusted yield represented by a predictable dividend through a diversifiedportfolio of CRE loans and securities. The timing of our IPO in August 2009 was opportune because asignificant number of capital providers, including banks and shadow finance companies, had eitherexited the business or were constrained by new and proposed financial regulations. There was a needfor a new finance entity to fill the void. In addition, we believed our point of entry was the best time ina generation as CRE prices were significantly depressed but had stabilized and would likely rise.
Today Starwood Property Trust is the largest commercial mortgage REIT in the United States witha market capitalization approaching $4.0 billion. In our short tenure we’ve invested nearly $7.0 billionacross a multitude of property types throughout the entire country, as well as in England and Germany.We have built a full service loan origination platform, propelling us into a leadership position in theCRE finance community. We have become valued by market participants for our experience, speed,creativity and proven ability to execute. Our brand is now known globally as a trusted relationship-driven lender who can provide ‘‘one-stop’’ solutions for large complex CRE transactions. This is adirect result of our substantial scale in the CRE debt marketplace which has allowed us to become thelender of choice for large, complex CRE transactions. We are able to offer a single solution to ourborrowers because of our extensive array of financing facilities coupled with our experienced team ofreal estate and loan syndication professionals who give us the market knowledge and presence toconfidently originate an entire whole loan and enhance returns by ‘‘auctioning’’ off senior ‘‘A’’ notecomponents in a timely and efficient manner.
We have established a culture of granular underwriting of real estate credit risk, evaluating eachtransaction from both a lender’s and an equity investor’s perspective. Our investment committee iscomprised of 11 highly experienced finance professionals, with an average of 22 years of capitalmarkets and CRE experience. Unlike many of our competitors, our approach is unencumbered bysometimes inflexible regulatory restrictions or rating agency criteria and, accordingly, we are able tointelligently structure complex transactions quickly and effectively in today’s competitive marketplace.Everything we do is measured by rewards and risks.
It is our goal to see every CRE debt transaction in the United States that is relevant to ourinvestment criteria and we believe the numbers support this statement. In 2012 we invested over$2.6 billion and our team evaluated 614 transactions totaling over $46 billion in the United Statesalone. Going forward, with our pending acquisition of LNR Property LLC (LNR), we expect thisnumber to grow. Our levered return in 2012 of 11.37% on a portfolio with a weighted average lastdollar LTV of 63% is extraordinary when compared to any similar treasury security.
We currently have over 40 professionals fully dedicated to STWD, as well as the support of over200 professionals worldwide at Starwood Capital Group who also contribute materially to our success.

31MAR201012340896
The broad reach of Starwood Capital Group and its best in class debt and equity teams coupled withSTWD’s permanent capital base gives us a sustainable competitive advantage, enabling STWD to cast aglobal net in search of investment opportunities that meet our risk adjusted returns.
Going forward, we are poised to further expand our business through the acquisition of LNR.STWD will acquire the vast majority of LNR including its Special Servicing unit, US investmentsecurities portfolio, Archetype Mortgage Capital, Archetype Financial Services and LNR Europe. Thesenew business units are complimentary with minimal functional overlap. They should further diversifySTWD’s revenue sources, add significant scale to our asset management operations, expand ourorigination platform and provide a proprietary pipeline for new loans. LNR’s complimentary businesslines create natural hedges which should drive superior risk adjusted returns regardless of marketconditions. With the addition of LNR, we believe that we will have taken one additional step to createthe robust full service commercial real estate platform which was one of our stated objectives at thetime of our IPO.
In order to fully leverage our brand, along with the business lines and additional capabilities weare acquiring with the purchase of LNR, this year we plan to focus on the following opportunities:
– Continue to expand our market presence as a leading provider of acquisition, refinance, anddevelopment capital to larger real estate projects (greater than $50 million) in infill locationsand other attractive market niches where our scale enables us to provide a ‘‘one-stop’’ lendingsolution for real estate developers, owners and operators
– Expand into the medium sized commercial real estate lending market (loans between $15 millionand $50 million) by leveraging LNR’s proprietary market data, systems and credit underwritingcapabilities
– Expand investment activities in subordinated CMBS and special servicing
– Continue to increase our capabilities in syndication and securitization, which provide attractivelypriced, non-recourse matched term financing
– Leveraging Starwood Capital Group’s expanded presence in Europe and LNR’s market leadingEuropean CRE operations to take advantage of significant opportunities to invest throughoutEurope
As we look forward in 2013 and beyond, we are excited by our market leading position and oursignificantly expanded opportunities. However, we are steadfast in our determination that we willmaintain our disciplined approach to originating loans and growing STWD’s scale. The caliber of ourteam and the quality of our leadership combined with our global relationships creates a significantsustainable competitive advantage for STWD. We thank our shareholders, our talented employees andBoard of Directors for their efforts and support over the past year.
Yours very truly,
Barry S. SternlichtChairman and Chief Executive Officer

UNITED STATESSECURITIES AND EXCHANGE COMMISSION
Washington, D.C. 20549
FORM 10-K� ANNUAL REPORT PURSUANT TO SECTION 13 OR 15(d) OF THE
SECURITIES EXCHANGE ACT OF 1934For the fiscal year ended December 31, 2012
or
� TRANSITION REPORT PURSUANT TO SECTION 13 OR 15(d) OF THESECURITIES EXCHANGE ACT OF 1934
For the transition period from to
Commission file number 001-34436
Starwood Property Trust, Inc.(Exact name of registrant as specified in its charter)
Maryland 27-0247747(State or other jurisdiction of (I.R.S. Employer Identification Number)incorporation or organization)
591 West Putnam Avenue 06830Greenwich, Connecticut (Zip Code)
(Address of Principal Executive Offices)
Registrant’s phone number, including area code (203) 422-8100
Securities registered pursuant to 12(b) of the Act:Title of each class Name of each exchange on which registered
Common Stock, $0.01 par value per share New York Stock Exchange
Securities registered pursuant to 12(g) of the Act: None
Indicate by check mark if the registrant is a well-known seasoned issuer, as defined in Rule 405 of the SecuritiesAct. Yes � No �
Indicate by check mark if the registrant is not required to file reports pursuant to Section 13 or Section 15(d) of theAct. Yes � No �
Indicate by check mark whether the registrant (1) has filed all reports required to be filed by Section 13 or 15(d) of theSecurities Exchange Act of 1934 during the preceding 12 months (or for such shorter period that the registrant was required tofile such reports), and (2) has been subject to such filing requirements for the past 90 days. Yes � No �
Indicate by check mark whether the registrant has submitted electronically and posted on its corporate Web site, if any,every Interactive Data File required to be submitted and posted pursuant to Rule 405 of Regulation S-T (§232.405) during thepreceding 12 months (or for such shorter period that the registrant was required to submit and post such files). Yes � No �
Indicate by check mark if disclosure of delinquent filers pursuant to Item 405 of Regulation S-K (§229.405) is notcontained herein, and will not be contained, to the best of the registrant’s knowledge, in definitive proxy or informationstatements incorporated by reference in Part III of this Form 10-K or any amendment to this Form 10-K. �
Indicate by check mark whether the registrant is a large accelerated filer, an accelerated filer, a non-accelerated filer, or asmaller reporting company. See definition of ‘‘accelerated filer, large accelerated filer, and smaller reporting company’’ inRule 12b-2 of the Exchange Act. (Check one):
Large accelerated filer � Accelerated filer � Non-accelerated filer � Smaller reporting company �(Do not check if a
smaller reporting company)
Indicate by check mark whether the registrant is a shell company (as defined in Rule 12b-2 of the Act). Yes � No �
As of June 30, 2012, the aggregate market value of the voting stock held by non-affiliates was $2,437,849,786 based on thereported last sale price of our common stock on June 30, 2012. Shares of our common stock held by each officer and directorand by each person who owns 5% or more of the outstanding common stock have been excluded from this calculation in thatsuch persons may be deemed to be affiliates. This calculation does not reflect a determination that persons are affiliates for anyother purposes.
The number of shares of the issuer’s common stock, $0.01 par value, outstanding as of February 26, 2013 was 135,499,506.
DOCUMENTS INCORPORATED BY REFERENCEPortions of the registrant’s Definitive Proxy Statement to be filed on or about April 1, 2013 (the ‘‘Proxy Statement’’) are
incorporated by reference in Part III of this Annual Report on Form 10-K.


TABLE OF CONTENTS
Page
Part I . . . . . . . . . . . . . . . . . . . . . . . . . . . . . . . . . . . . . . . . . . . . . . . . . . . . . . . . . . . . . . . . . . . 1Item 1. Business . . . . . . . . . . . . . . . . . . . . . . . . . . . . . . . . . . . . . . . . . . . . . . . . . . . . . . . . . 1Item 1A. Risk Factors . . . . . . . . . . . . . . . . . . . . . . . . . . . . . . . . . . . . . . . . . . . . . . . . . . . . . 13Item 1B. Unresolved Staff Comments . . . . . . . . . . . . . . . . . . . . . . . . . . . . . . . . . . . . . . . . . . 52Item 2. Properties . . . . . . . . . . . . . . . . . . . . . . . . . . . . . . . . . . . . . . . . . . . . . . . . . . . . . . . . 52Item 3. Legal Proceedings . . . . . . . . . . . . . . . . . . . . . . . . . . . . . . . . . . . . . . . . . . . . . . . . . . 52Item 4. Mine Safety Disclosures . . . . . . . . . . . . . . . . . . . . . . . . . . . . . . . . . . . . . . . . . . . . . . 52
Part II . . . . . . . . . . . . . . . . . . . . . . . . . . . . . . . . . . . . . . . . . . . . . . . . . . . . . . . . . . . . . . . . . . 53Item 5. Market for Registrant’s Common Equity, Related Stockholder Matters and Issuer
Purchases of Equity Securities . . . . . . . . . . . . . . . . . . . . . . . . . . . . . . . . . . . . . . . . . . . . . . 53Item 6. Selected Financial Data . . . . . . . . . . . . . . . . . . . . . . . . . . . . . . . . . . . . . . . . . . . . . . 55Item 7. Management’s Discussion and Analysis of Financial Condition and Results of
Operations . . . . . . . . . . . . . . . . . . . . . . . . . . . . . . . . . . . . . . . . . . . . . . . . . . . . . . . . . . . . 56Item 7A. Quantitative and Qualitative Disclosures about Market Risk . . . . . . . . . . . . . . . . . . . 77Item 8. Financial Statements and Supplementary Data . . . . . . . . . . . . . . . . . . . . . . . . . . . . . . 83Item 9. Changes in and Disagreements with Accountants on Accounting and Financial
Disclosure . . . . . . . . . . . . . . . . . . . . . . . . . . . . . . . . . . . . . . . . . . . . . . . . . . . . . . . . . . . . 146Item 9A. Controls and Procedures . . . . . . . . . . . . . . . . . . . . . . . . . . . . . . . . . . . . . . . . . . . . 146Item 9B. Other Information . . . . . . . . . . . . . . . . . . . . . . . . . . . . . . . . . . . . . . . . . . . . . . . . . 147
Part III . . . . . . . . . . . . . . . . . . . . . . . . . . . . . . . . . . . . . . . . . . . . . . . . . . . . . . . . . . . . . . . . . 148Item 10. Directors, Executive Officers and Corporate Governance . . . . . . . . . . . . . . . . . . . . . 148Item 11. Executive Compensation . . . . . . . . . . . . . . . . . . . . . . . . . . . . . . . . . . . . . . . . . . . . . 148Item 12. Security Ownership of Certain Beneficial Owners and Management and Related
Stockholder Matters . . . . . . . . . . . . . . . . . . . . . . . . . . . . . . . . . . . . . . . . . . . . . . . . . . . . . 148Item 13. Certain Relationships and Related Transactions, and Director Independence . . . . . . . 149Item 14. Principal Accountant Fees and Services . . . . . . . . . . . . . . . . . . . . . . . . . . . . . . . . . . 149
Part IV . . . . . . . . . . . . . . . . . . . . . . . . . . . . . . . . . . . . . . . . . . . . . . . . . . . . . . . . . . . . . . . . . . 150Item 15. Exhibits and Financial Statement Schedules . . . . . . . . . . . . . . . . . . . . . . . . . . . . . . . 150
Signatures . . . . . . . . . . . . . . . . . . . . . . . . . . . . . . . . . . . . . . . . . . . . . . . . . . . . . . . . . . . . . . . 152

(This page has been left blank intentionally.)

Special Note Regarding Forward Looking Statements
This Annual Report on Form 10-K contains certain forward-looking statements, including withoutlimitation, statements concerning our operations, economic performance and financial condition. Theseforward-looking statements are made pursuant to the safe harbor provisions of the Private SecuritiesLitigation Reform Act of 1995. Forward-looking statements are developed by combining currentlyavailable information with our beliefs and assumptions and are generally identified by the words‘‘believe,’’ ‘‘expect,’’ ‘‘anticipate’’ and other similar expressions. Forward-looking statements do notguarantee future performance, which may be materially different from that expressed in, or implied by,any such statements. Readers are cautioned not to place undue reliance on these forward-lookingstatements, which speak only as of their dates.
These forward-looking statements are based largely on our current beliefs, assumptions andexpectations of our future performance taking into account all information currently available to us.These beliefs, assumptions and expectations can change as a result of many possible events or factors,not all of which are known to us or within our control, and which could materially affect actual results,performance or achievements. Factors that may cause actual results to vary from our forward-lookingstatements include, but are not limited to:
• factors described in this Annual Report on Form 10-K, including those set forth under thecaptions ‘‘Risk Factors’’ and ‘‘Business’’;
• defaults by borrowers in paying debt service on outstanding items;
• impairment in the value of real estate property securing our loans;
• availability of mortgage origination and acquisition opportunities acceptable to us;
• the Company’s ability to complete its pending acquisition of LNR Property LLC, a Delawarelimited liability company (‘‘LNR’’), as described below and the performance of LNR subsequentto the acquisition;
• the Company’s ability to integrate LNR into its business and achieve the benefits that theCompany anticipates from its acquisition of LNR;
• potential mismatches in the timing of asset repayments and the maturity of the associatedfinancing agreements;
• national and local economic and business conditions;
• general and local commercial real estate property conditions;
• changes in federal government policies;
• changes in federal, state and local governmental laws and regulations;
• increased competition from entities engaged in mortgage lending;
• changes in interest rates;
• changes in the exchange rates between the U.S. dollar and the respective currencies for theCompany’s non-U.S. dollar denominated investments; and
• the availability of and costs associated with sources of liquidity.
In light of these risks and uncertainties, there can be no assurances that the results referred to inthe forward-looking statements contained in this Annual Report on Form 10-K will in fact occur.Except to the extent required by applicable law or regulation, we undertake no obligation to, andexpressly disclaim any such obligation to, update or revise any forward-looking statements to reflectchanged assumptions, the occurrence of anticipated or unanticipated events, changes to future resultsover time or otherwise.

(This page has been left blank intentionally.)

PART I
Item 1. Business.
The following description of our business should be read in conjunction with the information includedelsewhere in this Annual Report on Form 10-K for the year ended December 31, 2012. This descriptioncontains forward-looking statements that involve risks and uncertainties. Actual results could differsignificantly from the results discussed in the forward-looking statements due to the factors set forth in ‘‘RiskFactors’’ and elsewhere in this Annual Report on Form 10-K. References in this Annual Report onForm 10-K to ‘‘we,’’ ‘‘our,’’ ‘‘us,’’ or the ‘‘Company,’’ refer to Starwood Property Trust, Inc. All amounts arein thousands (000’s) except share and per share data.
General
Starwood Property Trust, Inc. is a Maryland corporation that commenced operations on August 17,2009, upon the completion of our initial public offering. We are focused on originating, investing in,financing and managing commercial mortgage loans and other commercial real estate debt investments,commercial mortgage-backed securities (‘‘CMBS’’), and other commercial real estate-related debtinvestments. We collectively refer to commercial mortgage loans, other commercial real estate debtinvestments, CMBS, and other commercial real estate-related debt investments as our target assets. Wealso invest in residential mortgage-backed securities (‘‘RMBS’’) and residential REO and non-performing loans, and may invest in commercial properties subject to net leases. As market conditionschange over time, we may adjust our strategy to take advantage of changes in interest rates and creditspreads as well as economic and credit conditions. Our objective is to provide attractive risk-adjustedtotal returns to our investors over the long term, primarily through dividends and secondarily throughcapital appreciation. In order to achieve these objectives, we focus on asset selection and the relativevalue of various sectors within the debt market to construct a diversified investment portfolio designedto produce attractive returns across a variety of market conditions and economic cycles. We employleverage, to the extent available, to fund the acquisition of our target assets, increase potential returnsto our stockholders and meet our return objectives. Leverage can either be direct by utilizing privatethird-party financing, or indirect through originating, acquiring, or retaining subordinated mortgages,B-Notes, subordinated loan participations or mezzanine loans. Under our current repurchaseagreements and bank credit facility, our total leverage may not exceed 75%, excluding the impact ofbona-fide loan sales that must be accounted for as financings and consolidating any variable interestentities pursuant to accounting principles generally accepted in the United States of America(‘‘GAAP’’). We are organized as a holding company and conduct our business primarily through ourvarious subsidiaries.
We are externally managed and advised by SPT Management, LLC (our ‘‘Manager’’) pursuant tothe terms of a management agreement. Our Manager is controlled by Barry Sternlicht, our Chairmanand Chief Executive Officer. Our Manager is an affiliate of Starwood Capital Group, a privately-heldprivate equity firm founded and controlled by Mr. Sternlicht. Since its inception in 1991, StarwoodCapital Group (including Starwood Capital-named affiliates controlled by Mr. Sternlicht) has sponsorednumerous opportunistic funds, including dedicated debt funds, dedicated hotel funds and standaloneand co-investment partnerships.
On January 23, 2013, we entered into a Unit Purchase Agreement with LNR Property, LLC(‘‘LNR’’), Aozora Investments LLC, CBR I LLC, iStar Marlin LLC, Opps VIIb LProp, L.P., and VNOLNR Holdco LLC, pursuant to which we agreed to acquire all the outstanding equity interests of LNR.LNR is a diversified real estate investment, management, finance and development company whoseprincipal line of business is serving as a special servicer for CMBS transactions. The acquisition of LNRhas not been completed, and accordingly this Annual Report on Form 10-K and the consolidatedfinancial statements included herein do not reflect the results of LNR’s business.
We have elected to be taxed as a real estate investment trust (‘‘REIT’’) for U.S. federal income taxpurposes commencing with our taxable year ended December 31, 2009. We generally will not be subject
1

to U.S. federal income taxes on our taxable income to the extent that we meet certain asset, income,and stock ownership tests to qualify as a REIT, and annually distribute all of our taxable income tostockholders. We also operate our business in a manner that permits us to maintain our exemptionfrom registration under the Investment Company Act of 1940, as amended (the ‘‘1940 Act’’).
Our corporate headquarters office is located at 591 West Putnam Avenue, Greenwich, Connecticut,and our telephone number is (203) 422-8100.
Investment Strategy
We seek to attain attractive risk adjusted returns for our investors over the long term by sourcingand managing a diversified portfolio of target assets, financed in a manner that is designed to deliverattractive returns across a variety of market conditions and economic cycles. Our investment strategyfocuses on a few fundamental themes:
• origination and acquisition of real estate debt assets with an implied basis sufficiently low toweather significant declines in asset values;
• focus on real estate markets and assets classes with strong supply and demand fundamentalsand/or barriers to entry;
• structuring and financing each transaction in a manner that reflects the risk of the underlyingasset’s cash flow stream and credit risk profile, and efficiently manages and maintains thetransaction’s interest rate and currency exposures at levels consistent with management’s riskobjectives;
• seeking situations where our size, scale, speed, and sophistication allow us to position ourselvesas a ‘‘one-stop’’ lending solution for real estate owner/operators;
• utilizing the skills, expertise, and contacts developed by our M over the past twenty plus years asone of the premier global real estate investment managers to correctly anticipate trends andidentify attractive risk adjusted investment opportunities in U.S. and European real estate debtcapital markets; and
• utilizing the skills, expertise, and infrastructure we anticipate acquiring through our recentlyannounced planned acquisition of LNR (see detail provided below), a market leading diversifiedreal estate investment management and loan servicing company, to expand and diversify ourpresence in various segments of real estate lending and debt securities, including:
• origination of small and medium sized loan transactions ($10 to $50mm) for bothinvestment and securitization/gain-on-sale;
• investment in commercial mortgage backed securities; and
• special servicing of commercial real estate loans in commercial real estate securitizationtransactions.
In order to capitalize on the changing sets of investment opportunities that may be present in thevarious points of an economic cycle, we may expand or refocus our investment strategy by emphasizinginvestments in different parts of the capital structure and different sectors of real estate. Ourinvestment strategy may be amended from time to time, if recommended by our Manager andapproved by our board of directors, without the approval of our stockholders. In addition to ourManager making direct investments on our behalf, we may enter into joint venture, management orother agreements with persons that have special expertise or sourcing capabilities.
On January 23, 2013, we entered into a Unit Purchase Agreement with LNR, AozoraInvestments LLC, CBR I LLC, iStar Marlin LLC, Opps VIIb LProp, L.P., and VNO LNRHoldco LLC, pursuant to which we agreed to acquire all the outstanding equity interests of LNR. LNRis a diversified real estate investment, management, finance and development company whose principalline of business is serving as a special servicer for CMBS transactions. Under the terms of thetransaction, we will acquire the following LNR business segments for a total cash purchase price of
2

$843 million. The remainder of the LNR businesses, totaling approximately $206 million, will beacquired by an investment fund controlled by an affiliate of our Manager:
• U.S. Special Servicer—A U.S. special servicer of commercial loans with approximately$133.6 billion in loans under management and real estate owned as of December 31, 2012;
• U.S. Investment Securities Portfolio—a portfolio of whole loans, CMBS and collateralized debtobligation (‘‘CDO’’) investments;
• Archetype Mortgage Capital—a commercial real estate conduit loan origination platform;
• Archetype Financial Institution Services—an acquirer, manager, and servicer of portfolios ofsmall balance commercial loans;
• LNR Europe—consists of Hatfield Philips, a wholly-owned subsidiary that is an independentprimary and special servicer in Europe, and a non-controlling interest in LNR EuropeanInvestment Fund, a European CRE debt fund; and
• Auction.com—50 percent of LNR’s interest in a real estate exchange selling residential andcommercial real estate via auction.
Financing Strategy
Subject to maintaining our qualification as a REIT for U.S. federal income tax purposes and ourexemption from registering under the 1940 Act, we may finance the acquisition of our target assets, tothe extent available to us, through the following methods:
• sources of private financing, including long and short-term repurchase agreements andwarehouse and bank credit facilities;
• loan sales, syndications, and/or securitizations; and
• public offerings of our equity and/or debt securities.
We may also utilize other sources of financing to the extent available to us.
Our Target Assets
We invest in target assets secured primarily by U.S. collateral. We focus primarily on originating oropportunistically acquiring commercial mortgage whole loans, B-notes, mezzanine loans, preferredequity and mortgage-backed securities. We may invest in performing and non-performing mortgageloans and other real estate-related loans and debt investments. We may acquire target assets throughportfolio or other acquisitions. Our Manager targets markets where it has a view on the expectedcyclical recovery as well as expertise in the real estate collateral underlying the assets being acquired.Our target assets include the following types of loans and other investments with respect to commercialreal estate:
• whole mortgage loans: loans secured by a first mortgage lien on a commercial property thatprovide long-term mortgage financing to commercial property developers or owners generallyhaving maturity dates ranging from three to ten years;
• bridge loans: whole mortgage loans secured by a first mortgage lien on a commercial propertythat provide interim or bridge financing to borrowers seeking short-term capital typically for theacquisition of real estate;
• B-Notes: typically a privately negotiated loan that is secured by a first mortgage on a single largecommercial property or group of related properties and subordinated to an A Note secured bythe same first mortgage on the same property or group;
• mezzanine loans: loans made to commercial property owners that are secured by pledges of theborrower’s ownership interests in the property and/or the property owner, subordinate to wholemortgage loans secured by first or second mortgage liens on the property and senior to theborrower’s equity in the property;
3
• construction or rehabilitation loans: mortgage loans and mezzanine loans to finance the cost ofconstruction or rehabilitation of a commercial property;
• CMBS: securities that are collateralized by commercial mortgage loans, including:
• senior and subordinated investment grade CMBS,
• below investment grade CMBS, and
• unrated CMBS;
• corporate bank debt: term loans and revolving credit facilities of commercial real estate operatingor finance companies, each of which are generally secured by such companies’ assets;
• corporate bonds: debt securities issued by commercial real estate operating or finance companiesthat may or may not be secured by such companies’ assets, including:
• investment grade corporate bonds,
• below investment grade corporate bonds, and
• unrated corporate bonds.
We have also invested in the following types of loans and other debt investments relating toresidential real estate:
• Non-Agency RMBS: securities collateralized by residential mortgage loans that are notguaranteed by any U.S. Government agency or federally chartered corporation;
• Real estate owned (REO): residential real estate that is primarily comprised of single familyhomes; and
• Residential mortgage loans: loans secured by a first mortgage lien on residential property;
In addition, we may invest in the following real estate related investments:
• net leases: commercial properties subject to net leases, which leases typically have longer termsthan gross leases, require tenants to pay substantially all of the operating costs associated withthe properties and often have contractually specified rent increases throughout their terms; and
• Agency RMBS: RMBS for which a U.S. Government agency or a federally chartered corporationguarantees payments of principal and interest on the securities.
4

Our Portfolio
Investment Activities
The following table sets forth the amount of each category of investments we owned across variousproperty types (1) as of December 31, 2012 (amounts in thousands):
WeightedCarrying Face % Net Average
Investment Value Amount Owned Financing Investment Rating Vintage
First mortgagesLoan acquisitions . . . . . . $ 520,219 $ 551,912 100%$ 321,976 $ 198,243 N/A 1989–2012Loan originations . . . . . . 1,027,349 1,036,808 100% 405,628 621,721 N/A 2009–2012
Total first mortgages . . . . . 1,547,568 1,588,720 727,604 819,964Subordinated mortgage
loans and mezzanineloansLoan acquisitions . . . . . . 620,700 673,421 100% 209,975 410,725 N/A 1999–2012Loan originations . . . . . . 834,128 836,919 100% 2,000 832,128 N/A 2009–2013
Total subordinated debt . . . 1,454,828 1,510,340 211,975 1,242,853Loan loss allowance . . . . . . (2,061) — — (2,061) N/A N/ACMBS—AFS(2) . . . . . . . . . 529,434 519,575 100% 291,004 238,430 BB+(3) 2010–2012RMBS—AFS(2) . . . . . . . . 333,153 489,220 100% 163,122 170,031 B� 2003–2007Other Investments . . . . . . . 221,983 221,983 100% — 221,983 N/A N/A
$4,084,905 $4,329,838 $1,393,705 $2,691,200
(1) Refer to Schedule IV for details of property type.(2) Commercial and residential mortgage-backed, available-for-sale (‘‘AFS’’) securities.(3) This rating, which was provided by Standard & Poor’s Ratings Services, Inc. (‘‘S&P’’), relates to
one position that represents 20.4% of the CMBS carrying value. The remaining 79.6% weresecurities where the obligors are certain special purpose entities that were formed to holdsubstantially all of the assets of a worldwide operator of hotels, resorts and timeshare properties;the securities are not rated but the loan-to-value ratio was estimated to be in the range of39%-44% at December 31, 2012.
5

As of December 31, 2012, the Company’s total investment portfolio, excluding other investments,had the following characteristics based on carrying values:
Collateral Property Type Geographic Location
Hospitality . . . . . . . . . . . . . . . . . . . . . . 45.3% West . . . . . . . . . . . . . . . . . . . . . . . . . . . 23.9%Office . . . . . . . . . . . . . . . . . . . . . . . . . . 17.6% North East . . . . . . . . . . . . . . . . . . . . . . 22.8%Retail . . . . . . . . . . . . . . . . . . . . . . . . . . 15.7% South East . . . . . . . . . . . . . . . . . . . . . . 16.5%Residential . . . . . . . . . . . . . . . . . . . . . . 8.6% Mid Atlantic . . . . . . . . . . . . . . . . . . . . . 12.7%Industrial . . . . . . . . . . . . . . . . . . . . . . . 2.5% Midwest . . . . . . . . . . . . . . . . . . . . . . . . 9.2%Mixed Use . . . . . . . . . . . . . . . . . . . . . . 3.5% International . . . . . . . . . . . . . . . . . . . . . 9.2%Multi-family . . . . . . . . . . . . . . . . . . . . . 2.1% South West . . . . . . . . . . . . . . . . . . . . . . 5.7%Other . . . . . . . . . . . . . . . . . . . . . . . . . . 4.7%
100.0% 100.0%
The following table sets forth the amount of each category of investments we owned across variousproperty types as of December 31, 2011 (amounts in thousands):
WeightedCarrying Face % Net Average
Investment Value Amount Owned Financing Investment Rating Vintage
First mortgagesLoan acquisitions . . . . . . $ 652,349 $ 694,600 100%$ 332,191 $ 320,158 N/A 1989–2011Loan originations . . . . . . 729,171 727,414 100% 451,092 278,079 N/A 2009–2011
Total first mortgages(1) . . . 1,381,520 1,422,014 783,283 598,237Subordinated loans and
mezzanine loansLoan acquisitions . . . . . . 649,864 713,679 100% 167,854 482,010 N/A 1999–2011Loan originations . . . . . . 416,124 416,327 100% — 416,124 N/A 2009–2011
Total subordinated debt . . . 1,065,988 1,130,006 167,854 898,134Loan loss allowance . . . . . . — — — — N/A N/ACMBS—AFS(2) . . . . . . . . . 176,786 195,842 100% 119,004 57,782 NR(4) 2010RMBS—AFS(2) . . . . . . . . 164,948 263,754 100% 86,575 78,373 B� 2003–2007Other investments . . . . . . . 44,379 44,379 100% — 44,379 N/A N/A
$2,833,621 $3,055,955 $1,156,716 $1,676,905
(1) Includes loans held-for-sale at fair value.
(2) Commercial and residential mortgage-backed AFS securities.
As of December 31, 2011, the Company’s total investment portfolio had the followingcharacteristics based on carrying values:
Collateral Property Type Geographic Location
Hospitality . . . . . . . . . . . . . . . . . . . . . . 39.9% West . . . . . . . . . . . . . . . . . . . . . . . . . . . 23.5%Office . . . . . . . . . . . . . . . . . . . . . . . . . . 20.1% North East . . . . . . . . . . . . . . . . . . . . . . 12.5%Retail . . . . . . . . . . . . . . . . . . . . . . . . . . 21.0% South East . . . . . . . . . . . . . . . . . . . . . . 19.0%Residential . . . . . . . . . . . . . . . . . . . . . . 5.9% Mid Atlantic . . . . . . . . . . . . . . . . . . . . . 19.7%Industrial . . . . . . . . . . . . . . . . . . . . . . . 3.8% Midwest . . . . . . . . . . . . . . . . . . . . . . . . 12.9%Mixed Use . . . . . . . . . . . . . . . . . . . . . . 5.6% International . . . . . . . . . . . . . . . . . . . . . 7.6%Multi-family . . . . . . . . . . . . . . . . . . . . . 3.3% South West . . . . . . . . . . . . . . . . . . . . . . 4.8%Other . . . . . . . . . . . . . . . . . . . . . . . . . . 0.4%
100.0% 100.0%
6

Our investment process includes sourcing and screening of investment opportunities, assessinginvestment suitability, conducting interest rate and prepayment analysis, evaluating cash flow andcollateral performance, reviewing legal structure and servicer and originator information and investmentstructuring, as appropriate, to seek an attractive return commensurate with the risk we are bearing.Upon identification of an investment opportunity, the investment will be screened and monitored by usto determine its impact on maintaining our REIT qualification and our exemption from registrationunder the 1940 Act. We will seek to make investments in sectors where we have strong corecompetencies and believe market risk and expected performance can be reasonably quantified.
We evaluate each one of our investment opportunities based on its expected risk-adjusted returnrelative to the returns available from other, comparable investments. In addition, we evaluate newopportunities based on their relative expected returns compared to comparable positions held in ourportfolio. The terms of any leverage available to us for use in funding an investment purchase are alsotaken into consideration, as are any risks posed by illiquidity or correlations with other securities in theportfolio. We also develop a macro outlook with respect to each target asset class by examining factorsin the broader economy such as gross domestic product, interest rates, unemployment rates andavailability of credit, among other things. We also analyze fundamental trends in the relevant targetasset class sector to adjust/maintain our outlook for that particular target asset class.
Loans
Our primary focus has been to build a portfolio of commercial mortgage and mezzanine loans atattractive risk adjusted returns by focusing on the underlying real estate fundamentals and creditanalysis of the borrowers. During the year ended December 31, 2012, we originated 22 loans andacquired 4 loans, as summarized below (amounts in thousands):
WeightedEquity Principal Average
Investment Funded Balance Coupon at Closing
First mortgages held for investment . . . . . . . . . . . . . . . . . . $ 855,260 $ 551,757 4.25%Subordinated mortgages held for investment . . . . . . . . . . . . 84,342 83,342 10.73%Mezzanine loans held for investment . . . . . . . . . . . . . . . . . 702,735 705,135 7.37%
Total loans originated or acquired in current year . . . . . . . . $1,642,337 $1,340,234
We continually monitor borrower performance and complete a detailed, loan-by-loan formal creditreview on a quarterly basis. The results of this review are incorporated into our quarterly assessment ofthe adequacy of the allowance for loan losses. As of December 31, 2012, none of our loans wasdelinquent.
Mortgage-Backed Securities
During the year ended December 31, 2012, we invested $372.3 million in various CMBS. As ofMarch 31, 2012, we had a debt investment secured by substantially all of a worldwide operator ofhotels, resorts and timeshare properties this investment was comprised of $115.1 million of loans and$387.6 million in securities. On April 16, 2012 the remaining $115.1 million of loans were converted tosecurities. The $421.8 million floating rate CMBS pay a spread of 2.3% over the index, which is theone month London Interbank Offered Rate (‘‘LIBOR’’). In the event of full extension, the spread overthe index will increase from the current 2.3% to 3.8%. As of December 31, 2012, the weighted-averagecoupon of all CMBS is 4.3%. The $97.8 million fixed rate CMBS pay a coupon of 11.6%.
During the year ended December 31, 2012, we invested $96.8 million in RMBS, net of sales andprincipal payments received. As of December 31, 2012, we held 78 RMBS positions.
7

The table below represents the summary of our investments in mortgage backed securities(‘‘MBS’’) as of December 31, 2012 (amounts in thousands):
Unrealized Gains or (Losses) Recognized inAccumulated Other Comprehensive
(Loss) Income
Purchase Recorded Net FairAmortized Credit Amortized Non-Credit Unrealized Unrealized Value Fair
December 31, 2012 Cost OTTI Cost OTTI Gains Losses Adjustment Value
CMBS . . . . . . . . . . . $498,064 $ — $498,064 $— $31,370 $ — $31,370 $529,434RMBS . . . . . . . . . . . 293,321 (10,194) 283,127 — 50,717 (691) 50,026 333,153
Total . . . . . . . . . . . $791,385 $(10,194) $781,191 $— $82,087 $(691) $81,396 $862,587
Weighted-AverageWeighted-Average Weighted-Average Life (‘‘WAL’’)
December 31, 2012 Coupon(1) Rating (Years)(3)
CMBS . . . . . . . . . . . . . . . . . . . . . 4.3% BB+(2) 3.4RMBS . . . . . . . . . . . . . . . . . . . . . 1.1% CCC+ 5.4
(1) Generally calculated using the December 31, 2012 one-month LIBOR rate of 0.2087%.
(2) This rating, which was provided by S&P, relates to one position that represents 20.4% ofthe CMBS carrying value. The remaining 79.6% were securities where the obligors arecertain special purpose entities that were formed to hold substantially all of the assets ofa worldwide operator of hotels, resorts and timeshare properties; the securities are notrated but the loan-to-value ratio was estimated to be in the range of 39%-44% atDecember 31, 2012.
(3) Represents the WAL of each respective group of MBS. The WAL of each individualsecurity is calculated as a fraction, the numerator of which is the sum of the timing (inyears) of each expected future principal payment multiplied by the balance of therespective payment, and with a denominator equal to the sum of the expected principalpayments. This calculation was made as of December 31, 2012. Assumptions for thecalculation of the WAL are adjusted as necessary for changes in projected principalrepayments and/or maturity dates of the MBS
The table below represents the summary of our MBS as of December 31, 2011 (amounts inthousands):
Unrealized Gains or (Losses) Recognized inAccumulated Other Comprehensive
Income (Loss)
Purchase Recorded Net FairAmortized Credit Amortized Non-Credit Unrealized Unrealized Value Fair
December 31, 2011 Cost OTTI Cost OTTI Gains Losses Adjustment Value
CMBS . . . . . . . . . . . . $177,353 $ — $177,353 $ — $ — $ (567) $(567) $176,786RMBS . . . . . . . . . . . . 170,424 (6,001) 164,423 (1,310) 3,367 (1,532) 525 164,948
Total . . . . . . . . . . . . . $347,777 $(6,001) $341,776 $(1,310) $3,367 $(2,099) $ (42) $341,734
8

Weighted-AverageWeighted-Average Weighted-Average Life (‘‘WAL’’)
December 31, 2011 Coupon(1) Rating (Years)(3)
CMBS . . . . . . . . . . . . . . . . . . . . . 2.1% NR(2) 3.5RMBS . . . . . . . . . . . . . . . . . . . . . 1.0% B� 4.8
(1) Generally calculated using the December 31, 2011 one-month LIBOR rate of 0.2953%.(2) Represents securities where the obligors are certain special purpose entities that were
formed to hold substantially all of the assets of a worldwide operator of hotels, resortsand timeshare properties; the securities are not rated but the loan-to-value ratio wasestimated to be in the range of 39%-44% at December 31, 2011.
(3) Represents the WAL of each respective group of MBS. The WAL of each individualsecurity is calculated as a fraction, the numerator of which is the sum of the timing (inyears) of each expected future principal payment multiplied by the balance of therespective payment, and with a denominator equal to the sum of the expected principalpayments. This calculation was made as of December 31, 2011. Assumptions for thecalculation of the WAL are adjusted as necessary for changes in projected principalrepayments and/or maturity dates of the MBS.
Summary of Interest CharacteristicsAs described in Item 7—‘‘Management’s Discussion and Analysis of Financial Condition and
Results of Operations,’’ and Item 7A—‘‘Quantitative and Qualitative Disclosures about Market Risk,’’we utilize certain interest rate risk management techniques, including both asset/liability matching andcertain other hedging transactions, in order to mitigate our exposure to interest rate risk.
As of December 31, 2012, 30.1% of our investments were comprised of fixed rate loans andsecurities with a weighted-average coupon of 9.4% and weighted-average life of 3.9 years, whereas64.8% of our investments were comprised of variable rate loans and securities with a LIBOR basedindex with a weighted-average spread of 4.8% and weighted-average life of 4.1 years and 5.1% of ourinvestments represented other investments.
As of December 31, 2011, 46.1% of our investments were comprised of fixed rate loans andsecurities with a weighted-average coupon of 8.9% and weighted-average life of 4.4 years, whereas52.4% of our investments were comprised of variable rate loans and securities with a LIBOR basedindex with a weighted-average spread of 3.52% and weighted-average life of 3.1 years and 1.5% of ourinvestments represented other investments.
Summary of MaturitiesAs of December 31, 2012, our loan and CMBS portfolios had a weighted-average maturity of
3.75 years, based on management’s judgment of extension options being exercised. The table belowshows the carrying value expected to mature annually over the next ten years for our investments inloans and CMBS (amounts in thousands, except number of investments maturing).
Number ofInvestments Carrying % of
Year of Maturity Maturing(1) Value Total
2013 . . . . . . . . . . . . . . . . . . . . . . . . . . . . . . . . . . . 9 $ 148,472 4.2%2014 . . . . . . . . . . . . . . . . . . . . . . . . . . . . . . . . . . . 15 353,721 10.0%2015 . . . . . . . . . . . . . . . . . . . . . . . . . . . . . . . . . . . 16 796,533 22.6%2016 . . . . . . . . . . . . . . . . . . . . . . . . . . . . . . . . . . . 31 758,764 21.5%2017 . . . . . . . . . . . . . . . . . . . . . . . . . . . . . . . . . . . 44 1,063,124 30.1%2018 . . . . . . . . . . . . . . . . . . . . . . . . . . . . . . . . . . . 14 250,662 7.0%2019 . . . . . . . . . . . . . . . . . . . . . . . . . . . . . . . . . . . 2 28,351 0.8%2020 . . . . . . . . . . . . . . . . . . . . . . . . . . . . . . . . . . . 2 48,961 1.4%2021 . . . . . . . . . . . . . . . . . . . . . . . . . . . . . . . . . . . 2 5,949 0.2%2022 and thereafter . . . . . . . . . . . . . . . . . . . . . . . . 12 77,293 2.2%Total . . . . . . . . . . . . . . . . . . . . . . . . . . . . . . . . . . 147 $3,531,830 100.0%
(1) Excludes other investments and RMBS.
9

Regulation
Our operations are subject, in certain instances, to supervision and regulation by state and federalgovernmental authorities and may be subject to various laws and judicial and administrative decisionsimposing various requirements and restrictions, which, among other things: (1) regulate credit grantingactivities; (2) establish maximum interest rates, finance charges and other charges; (3) requiredisclosures to customers; (4) govern secured transactions; and (5) set collection, foreclosure,repossession and claims handling procedures and other trade practices. Although most states do notregulate commercial finance, certain states impose limitations on interest rates and other charges andon certain collection practices and creditor remedies, and require licensing of lenders and financiersand adequate disclosure of certain contract terms. We are also required to comply with certainprovisions of the Equal Credit Opportunity Act that are applicable to commercial loans. We intend toconduct our business so that neither we nor any of our subsidiaries are required to register as aninvestment company under the 1940 Act.
In the judgment of management, existing statutes and regulations have not had a material adverseeffect on our business. In the wake of the recent financial crisis, legislators in the U.S. and in othercountries have said that greater regulation of financial services firms is needed, particularly in areassuch as risk management, leverage and disclosure. While we expect that new regulations in these areaswill be adopted in the future, it is not possible at this time to forecast the exact nature of any futurelegislation, regulations, judicial decisions, orders or interpretations, nor their impact upon our futurebusiness, financial condition or results of operations or prospects.
Competition
We are engaged in a competitive business. In our investment activities, we compete foropportunities with numerous public and private investment vehicles, including financial institutions,specialty finance companies, mortgage banks, pension funds, opportunity funds, hedge funds, insurancecompanies, REITs and other institutional investors, as well as individuals. Many competitors aresignificantly larger than us, have well established operating histories and may have greater access tocapital, more resources and other advantages over us. These competitors may be willing to accept lowerreturns on their investments or to compromise underwriting standards and, as a result, our originationvolume and profit margins could be adversely affected.
The Manager
We are externally managed and advised by our Manager and benefit from the personnel,relationships and experience of our Manager’s executive team and other personnel of Starwood CapitalGroup. Pursuant to the terms of a management agreement between our Manager and us, our Managerprovides us with our management team and appropriate support personnel. Pursuant to an investmentadvisory agreement between our Manager and Starwood Capital Group Management, LLC, ourManager has access to the personnel and resources of Starwood Capital Group necessary for theimplementation and execution of our business strategy.
Our Manager is an affiliate of Starwood Capital Group, a privately-held private equity firmfounded and controlled by Mr. Sternlicht. Starwood Capital Group has invested in most major classesof real estate, directly and indirectly, through operating companies, portfolios of properties and singleassets, including multifamily, office, retail, hotel, residential entitled land and communities, seniorhousing, mixed-use and golf courses. Starwood Capital Group invests at different levels of the capitalstructure, including equity, preferred equity, mezzanine debt and senior debt, depending on the assetrisk profile and return expectation.
Our Manager draws upon the experience and expertise of Starwood Capital Group’s team ofprofessionals and support personnel operating in eleven cities across six countries. Our Manager also
10

benefits from Starwood Capital Group’s dedicated asset management group operating in offices locatedin the U.S. and abroad. We also benefit from Starwood Capital Group’s portfolio management, financeand administration functions, which address legal, compliance, investor relations and operationalmatters, asset valuation, risk management and information technologies in connection with theperformance of our Manager’s duties.
Taxation of the Company
We have elected to be taxed as a REIT under the Internal Revenue Code of 1986, as amended(the ‘‘Code’’), for federal income tax purposes. We generally must distribute annually at least 90% ofour taxable income, subject to certain adjustments and excluding any net capital gain, in order forfederal corporate income tax not to apply to our earnings that we distribute. To the extent that wesatisfy this distribution requirement, but distribute less than 100% of our taxable income, we will besubject to federal corporate income tax on our undistributed taxable income. In addition, we will besubject to a 4% nondeductible excise tax if the actual amount that we pay out to our stockholders in acalendar year is less than a minimum amount specified under federal tax laws. Our qualification as aREIT also depends on our ability to meet various other requirements imposed by the Code, whichrelate to organizational structure, diversity of stock ownership and certain restrictions with regard toowned assets and categories of income. If we qualify for taxation as a REIT, we will generally not besubject to U.S. federal corporate income tax on our taxable income that is currently distributed tostockholders.
Even if we qualify as a REIT, we may be subject to certain federal excise taxes and state and localtaxes on our income and property. If we fail to qualify as a REIT in any taxable year, we will besubject to federal income taxes at regular corporate rates (including any applicable alternativeminimum tax) and will not be able to qualify as a REIT for four subsequent taxable years. REITs aresubject to a number of organizational and operational requirements under the Code.
We formed several taxable REIT subsidiaries (‘‘TRS’’) since 2010 to reduce the impact of theprohibited transaction tax and to avoid penalty for the holding of assets not qualifying as real estateassets for purposes of the REIT asset tests. Any income associated with a TRS is fully taxable becausea TRS is subject to federal and state income taxes as a domestic C corporation based upon its netincome.
See Item 1A—‘‘Risk Factors—Risks Related to Our Taxation as a REIT’’ for additional tax statusinformation.
Leverage Policies
We employ leverage, to the extent available, to fund the acquisition of our target assets, increasepotential returns to our stockholders and meet our return objectives. Although we are not required tomaintain any particular minimum leverage ratio, the amount of leverage we deploy for particularinvestments in our target assets depends upon our Manager’s assessment of a variety of factors, whichmay include the anticipated liquidity and price volatility of the assets in our investment portfolio, thepotential for losses and extension risk in our portfolio, the gap between the duration of our assets andliabilities, including hedges, the availability and cost of financing the assets, our opinion of thecreditworthiness of our financing counterparties, the health of the U.S. economy and commercial andresidential mortgage markets, our outlook for the level, slope, and volatility of interest rates, the creditquality of our assets, the collateral underlying our assets, and our outlook for asset spreads relative tothe LIBOR curve. Under our current repurchase agreements and bank credit facility, our total leveragemay not exceed 75%, excluding the impact of bona-fide loan sales that must be accounted for asfinancings and consolidating any variable interest entities pursuant to GAAP. As of December 31, 2012,our ratio of total debt to loans and MBS investments was 34.6%.
11

Investment Guidelines
Our board of directors has adopted the following investment guidelines:
• our investments will be in our target assets unless otherwise approved by the board of directors;
• no investment shall be made that would cause us to fail to qualify as a REIT for federal incometax purposes;
• no investment shall be made that would cause us or any of our subsidiaries to be required to beregistered as an investment company under the 1940 Act;
• not more than 25% of our equity will be invested in any individual asset without the consent ofa majority of our independent directors; and
• any investment of up to $25 million requires the approval of our Chief Executive Officer; anyinvestment from $25 million to $75 million requires the approval of our Manager’s InvestmentCommittee; any investment from $75 million to $150 million requires the approval of theInvestment Committee of our board of directors and our Manager’s Investment Committee; andany investment in excess of $150 million requires the approval of our board of directors.
These investment guidelines may be changed from time to time by our board of directors withoutthe approval of our stockholders. In addition, both our Manager and our board of directors mustapprove any change in our investment guidelines that would modify or expand the types of assets inwhich we invest.
Available Information
Our website address is www.starwoodpropertytrust.com. We make available free of charge throughour website our Annual Report on Form 10-K, Quarterly Reports on Form 10-Q, Current Reports onForm 8-K, all amendments to those reports and other filings as soon as reasonably practicable aftersuch material is electronically filed with or furnished to the Securities and Exchange Commission (the‘‘SEC’’), and also make available on our website the charters for the Audit, Compensation, Nominatingand Corporate Governance and Investment Committees of the board of directors and our Code ofBusiness Conduct and Ethics and Code of Conduct for Principal Executive Officer and Senior FinancialOfficers, as well as our corporate governance guidelines. Copies in print of these documents areavailable upon request to our Corporate Secretary at the address indicated on the cover of this report.The information on our website is not a part of, nor is it incorporated by reference into, this AnnualReport on Form 10-K.
We intend to post on our website any amendment to, or waiver of, a provision of our Code ofBusiness Conduct and Ethics or Code of Conduct for Principal Executive Officer and Senior FinancialOfficers that applies to our Chief Executive Officer, Chief Financial Officer and Controller or personsperforming similar functions and that relates to any element of the code of ethics definition set forth inItem 406 of Regulation S-K of the Securities Act of 1933, as amended.
To communicate with the board of directors electronically, we have established an e-mail address,[email protected], to which stockholders may send correspondence to the board ofdirectors or any such individual directors or group or committee of directors.
We have included as exhibits to this report the Sarbanes-Oxley Act of 2002 Section 302certifications of our Chief Executive Officer and Chief Financial Officer regarding the quality of ourpublic disclosure.
Information regarding our revenue, profit and losses and assets is set forth under Item 12 of thisAnnual Report on Form 10-K.
12

Item 1A. Risk Factors.
Risks Related to Our Relationship with Our Manager
We are dependent on Starwood Capital Group, including our Manager, and their key personnel, who provideservices to us through the management agreement, and we may not find a suitable replacement for ourManager and Starwood Capital Group if the management agreement is terminated, or for these key personnelif they leave Starwood Capital Group or otherwise become unavailable to us.
We have no separate facilities and are completely reliant on our Manager. Our Manager hassignificant discretion as to the implementation of our investment and operating policies and strategies.Accordingly, we believe that our success depends to a significant extent upon the efforts, experience,diligence, skill and network of business contacts of the officers and key personnel of our Manager. Theofficers and key personnel of our manager evaluate, negotiate, close and monitor our investments;therefore, our success depends on their continued service. The departure of any of the officers or keypersonnel of our Manager could have a material adverse effect on our performance.
We offer no assurance that our Manager will remain our investment manager or that we willcontinue to have access to our Manager’s officers and key personnel. The initial term of ourmanagement agreement with our Manager, and the initial term of the investment advisory agreementbetween our Manager and Starwood Capital Group Management, LLC expired on August 17, 2012,with automatic one-year renewals thereafter. If the management agreement and the investment advisoryagreement are terminated and no suitable replacement is found to manage us, we may not be able toexecute our business plan.
There are various conflicts of interest in our relationship with Starwood Capital Group, including ourManager, which could result in decisions that are not in the best interests of our stockholders.
We are subject to conflicts of interest arising out of our relationship with Starwood Capital Group,including our Manager. Specifically, Mr. Sternlicht, our Chairman and Chief Executive Officer, JeffreyG. Dishner, one of our directors, and certain of our executive officers are executives of StarwoodCapital Group. Our Manager and executive officers may have conflicts between their duties to us andtheir duties to, and interests in, Starwood Capital Group and its other investment funds. Currently,Starwood Global Opportunity Fund VIII, Starwood Global Opportunity Fund IX and Starwood CapitalHospitality Fund II Global, (collectively, the ‘‘Starwood Private Real Estate Funds’’), collectively havethe right to invest 25% of the equity capital proposed to be invested by any investment vehiclemanaged by an entity controlled by Starwood Capital Group in debt interests relating to real estate.Our co-investment rights are subject to, among other things, (i) the determination by our Manager thatthe proposed investment is suitable for us, and (ii) our manager’s sole discretion as to whether or notto exclude from our investment portfolio at any time any ‘‘medium-term loan to own’’ investment,which our Manager considers to be mortgage loans or other real estate-related loan or debtinvestments where the proposed originator or acquirer of any such investment has the intent and/orexpectation of foreclosing on, or otherwise acquiring the real property securing the loan or investmentat any time between 18 and 48 months of its origination or acquisition of the loan or investment. Inaddition, in the case of opportunities to invest in a portfolio of assets including both equity and debtreal estate related investments, we would not have the co-investment rights described above if ourManager determines that less than 50% of the aggregate anticipated investment returns from theportfolio is expected to come from our target assets. Since we are subject to the judgment of ourManager in the application of our co-investment rights, we may not always be allocated 75% of eachco-investment opportunity in our target asset classes. Our independent directors periodically review ourManager’s and Starwood Capital Group’s compliance with the co-investment provisions describedabove, but they do not approve each co-investment by the Starwood Private Real Estate Funds and usunless the amount of capital we invest in the proposed co-investment otherwise requires the review and
13

approval of our independent directors pursuant to our investment guidelines. Pursuant to the exclusivityprovisions of the Starwood Private Real Estate Funds, our investment strategy may not include either(i) equity interests in real estate or (ii) ‘‘near-term loan to own’’ investments, in each case (of both(i) and (ii)) if such investments are expected, at the time such investment is made, to produce aninternal rate of return (IRR) in excess of 14%. Therefore, our board of directors does not have theflexibility to expand our investment strategy to include equity interests in real estate or ‘‘near-term loanto own’’ investments with such an IRR expectation. Our Manager, Starwood Capital Group and theirrespective affiliates may sponsor or manage a U.S. publicly traded investment vehicle that investsgenerally in real estate assets but not primarily in our target assets, or a potential competing vehicle.Our Manager and Starwood Capital Group have also agreed that for so long as the managementagreement is in effect and our Manager and Starwood Capital Group are under common control, noentity controlled by Starwood Capital Group will sponsor or manage a potential competing vehicle orprivate or foreign competing vehicle, unless Starwood Capital Group adopts a policy that either(i) provides for the fair and equitable allocation of investment opportunities among all such vehiclesand us, or (ii) provides us the right to co-invest with such vehicles, in each case subject to the suitabilityof each investment opportunity for the particular vehicle and us and each such vehicle’s and ouravailability of cash for investment. To the extent that we have co-investment rights with these vehiclesin the future, there can be no assurance that these future rights will entitle us to a similar percentageallocation as we currently have with respect to the Starwood Private Real Estate Funds. To the extentthat our manager and Starwood Capital Group adopt an investment allocation policy in the future, wemay nonetheless compete with these vehicles for investment opportunities sourced by our Manager andStarwood Capital Group. As a result, we may either not be presented with the opportunity or may haveto compete with these vehicles to acquire these investments. Some or all of our executive officers, themembers of the investment committee of our Manager and other key personnel of our Manager wouldlikely be responsible for selecting investments for these vehicles and they may choose to allocatefavorable investments to one or more of these vehicles instead of to us.
Our board of directors has adopted a policy with respect to any proposed investments by thecovered persons in any of our target asset classes. This policy provides that any proposed investment bya covered person for his or her own account in any of our target asset classes will be permitted if thecapital required for the investment does not exceed the personal investment limit. To the extent that aproposed investment exceeds the personal investment limit, we expect that our board of directors willonly permit the covered person to make the investment (i) upon the approval of the disinteresteddirectors, or (ii) if the proposed investment otherwise complies with terms of any other related partytransaction policy our board of directors has adopted. Subject to compliance with all applicable laws,these individuals may make investments for their own account in our target assets which may presentcertain conflicts of interest not addressed by our current policies.
We pay our Manager substantial base management fees regardless of the performance of ourportfolio. Our Manager’s entitlement to a base management fee, which is not based upon performancemetrics or goals, might reduce its incentive to devote its time and effort to seeking investments thatprovide attractive risk-adjusted returns for our portfolio. This in turn could hurt both our ability tomake distributions to our stockholders and the market price of our common stock.
We do not have any employees except for Andrew Sossen, our Chief Operating Officer, ExecutiveVice President, General Counsel and Chief Compliance Officer, and Perry Stewart Ward, our ChiefFinancial Officer and Treasurer, who Starwood Capital Group has seconded to us exclusively.Mr. Sossen and Mr. Ward are also employees of other entities affiliated with our Manager and, as aresult, are subject to potential conflicts of interest in service as our employees and as an employees ofsuch entities.
14

The management agreement with our Manager was not negotiated on an arm’s-length basis and may not beas favorable to us as if it had been negotiated with an unaffiliated third party and may be costly and difficultto terminate.
Certain of our executive officers and three of our seven directors are executives of StarwoodCapital Group. Our management agreement with our Manager was negotiated between related partiesand its terms, including fees payable, may not be as favorable to us as if it had been negotiated with anunaffiliated third party.
Termination of the management agreement with our Manager without cause is difficult and costly.Our independent directors will review our Manager’s performance and the management fees annuallyand the management agreement may be terminated annually upon the affirmative vote of at leasttwo-thirds of our independent directors based upon: (i) our Manager’s unsatisfactory performance thatis materially detrimental to us, or (ii) a determination that the management fees payable to ourManager are not fair, subject to our Manager’s right to prevent termination based on unfair fees byaccepting a reduction of management fees agreed to by at least two-thirds of our independentdirectors. Our Manager will be provided 180 days prior notice of any such a termination. Additionally,upon such a termination, the management agreement provides that we will pay our manager atermination fee equal to three times the sum of the average annual base management fee and incentivefee received by our Manager during the prior 24-month period before such termination, calculated asof the end of the most recently completed fiscal quarter. These provisions may increase the cost to usof terminating the management agreement and adversely affect our ability to terminate our Managerwithout cause.
The initial term of our management agreement with our Manager, and the initial term of theinvestment advisory agreement between our Manager and Starwood Capital Group Management, LLCexpired on August 17, 2012, with automatic one-year renewals thereafter; provided, however, that ourManager may terminate the management agreement annually upon 180 days prior notice. If themanagement agreement is terminated and no suitable replacement is found to manage us, we may notbe able to execute our business plan.
Pursuant to the management agreement, our Manager does not assume any responsibility otherthan to render the services called for thereunder and is not responsible for any action of our board ofdirectors in following or declining to follow its advice or recommendations. Our Manager maintains acontractual as opposed to a fiduciary relationship with us. Under the terms of the managementagreement, our Manager, its officers, members, personnel, any person controlling or controlled by ourManager and any person providing sub-advisory services to our Manager will not be liable to us, anysubsidiary of ours, our directors, our stockholders or any subsidiary’s stockholders or partners for actsor omissions performed in accordance with and pursuant to the management agreement, exceptbecause of acts constituting bad faith, willful misconduct, gross negligence, or reckless disregard of theirduties under the management agreement. In addition, we have agreed to indemnify our Manager, itsofficers, stockholders, members, managers, directors, personnel, any person controlling or controlled byour Manager and any person providing sub-advisory services to our manager with respect to allexpenses, losses, damages, liabilities, demands, charges and claims arising from acts or omissions of ourManager not constituting bad faith, willful misconduct, gross negligence, or reckless disregard of duties,performed in good faith in accordance with and pursuant to the management agreement.
The incentive fee payable to our Manager under the management agreement is payable quarterly and is basedon our core earnings and therefore, may cause our manager to select investments in more risky assets toincrease its incentive compensation.
Our Manager is entitled to receive incentive compensation based upon our achievement oftargeted levels of core earnings. In evaluating investments and other management strategies, the
15

opportunity to earn incentive compensation based on core earnings may lead our manager to placeundue emphasis on the maximization of core earnings at the expense of other criteria, such aspreservation of capital, in order to achieve higher incentive compensation. Investments with higheryield potential are generally riskier or more speculative. This could result in increased risk to the valueof our investment portfolio.
Core earnings is a non-GAAP measure and is defined as GAAP net income (loss) excludingnon-cash equity compensation expense, the incentive fee, depreciation and amortization of real estate(to the extent that we own properties), any unrealized gains, losses or other non-cash items recorded innet income for the period, regardless of whether such items are included in other comprehensiveincome or loss, or in net income. The amount will be adjusted to exclude one-time events pursuant tochanges in GAAP and certain other non-cash charges after discussions between our Manager and ourindependent directors and after approval by a majority of our independent directors.
Our conflicts of interest policy may not adequately address all of the conflicts of interest that may arise withrespect to our investment activities and also may limit the allocation of investments to us.
In order to avoid any actual or perceived conflicts of interest with our Manager, Starwood CapitalGroup or any of the Starwood parties, we have adopted a conflicts of interest policy to specificallyaddress some of the conflicts relating to our investment opportunities. Although under this policy theapproval of a majority of our independent directors is required to approve (i) any purchase of ourassets by any of the Starwood parties and (ii) any purchase by us of any assets of any of the Starwoodparties, there is no assurance that this policy will be adequate to address all of the conflicts that mayarise or will address such conflicts in a manner that results in the allocation of a particular investmentopportunity to us or is otherwise favorable to us. In addition, the Starwood Private Real Estate Fundscurrently, and additional competing vehicles may in the future, participate in some of our investments,possibly at a more senior level in the capital structure of the underlying borrower and related realestate than our investment. Our interests in such investments may also conflict with the interests ofthese funds in the event of a default or restructuring of the investment. Participating investments willnot be the result of arm’s length negotiations and will involve potential conflicts between our interestsand those of the other participating funds in obtaining favorable terms. Since certain of our executivesare also executives of Starwood Capital Group, the same personnel may determine the price and termsfor the investments for both us and these funds and there can be no assurance that any proceduralprotections, such as obtaining market prices or other reliable indicators of fair value, will prevent theconsideration we pay for these investments from exceeding their fair value or ensure that we receiveterms for a particular investment opportunity that are as favorable as those available from anindependent third party.
Our board of directors has approved very broad investment guidelines for our Manager and does not approveeach investment and financing decision made by our Manager unless required by our investment guidelines.
Our Manager is authorized to follow very broad investment guidelines. Our board of directors willperiodically review our investment guidelines and our investment portfolio but will not, and will not berequired to, review all of our proposed investments, except if the investment requires us to commiteither at least $150 million of capital or 25% of our equity in any individual asset. In addition, inconducting periodic reviews, our board of directors may rely primarily on information provided to themby our Manager. Furthermore, our Manager may use complex strategies, and transactions entered intoby our Manager may be costly, difficult or impossible to unwind by the time they are reviewed by ourboard of directors. Our Manager has great latitude within the broad parameters of our investmentguidelines in determining the types and amounts of target assets it decides are attractive investmentsfor us, which could result in investment returns that are substantially below expectations or that resultin losses, which would materially and adversely affect our business operations and results. Further,
16

decisions made and investments and financing arrangements entered into by our Manager may not fullyreflect the best interests of our stockholders.
Risks Related to Our Company
Our board of directors may change any of our investment strategy or guidelines, financing strategy or leveragepolicies without stockholder consent.
Our board of directors may change any of our investment strategy or guidelines, financing strategyor leverage policies with respect to investments, acquisitions, growth, operations, indebtedness,capitalization and distributions at any time without the consent of our stockholders, which could resultin an investment portfolio with a different risk profile. A change in our investment strategy mayincrease our exposure to interest rate risk, default risk and real estate market fluctuations. Thesechanges could adversely affect our financial condition, results of operations, the market price of ourcommon stock and our ability to make distributions to our stockholders.
We are highly dependent on information systems and systems failures could significantly disrupt our business,which may, in turn, negatively affect the market price of our common stock and our ability to pay dividends.
Our business is highly dependent on communications and information systems of Starwood CapitalGroup. Any failure or interruption of Starwood Capital Group’s systems could cause delays or otherproblems, which could have a material adverse effect on our operating results and negatively affect themarket price of our common stock and our ability to pay dividends to our stockholders.
Terrorist attacks and other acts of violence or war may affect the real estate industry and our business,financial condition and results of operations.
The terrorist attacks on September 11, 2001 disrupted the U.S. financial markets, including thereal estate capital markets, and negatively impacted the U.S. economy in general. Any future terroristattacks, the anticipation of any such attacks, the consequences of any military or other response by theU.S. and its allies, and other armed conflicts could cause consumer confidence and spending todecrease or result in increased volatility in the U.S. and worldwide financial markets and economy. Theeconomic impact of these events could also adversely affect the credit quality of some of our loans andinvestments and the properties underlying our interests.
We may suffer losses as a result of the adverse impact of any future attacks and these losses mayadversely impact our performance and may cause the market value of our common stock to decline orbe more volatile. A prolonged economic slowdown, a recession or declining real estate values couldimpair the performance of our investments and harm our financial condition and results of operations,increase our funding costs, limit our access to the capital markets or result in a decision by lenders notto extend credit to us. We cannot predict the severity of the effect that potential future terrorist attackswould have on us. Losses resulting from these types of events may not be fully insurable.
In addition, the events of September 11, 2011 created significant uncertainty regarding the abilityof real estate owners of high profile assets to obtain insurance coverage protecting against terroristattacks at commercially reasonable rates, if at all. With the enactment of the Terrorism Risk InsuranceAct of 2002 (the ‘‘TRIA’’) and the subsequent enactment of the Terrorism Risk Insurance ProgramReauthorization Act of 2007, which extended the TRIA through the end of 2014, insurers must maketerrorism insurance available under their property and casualty insurance policies, but this legislationdoes not regulate the pricing of such insurance. The absence of affordable insurance coverage mayadversely affect the general real estate lending market, lending volume and the market’s overallliquidity and may reduce the number of suitable investment opportunities available to us and the paceat which we are able to make investments. If the properties underlying our interests are unable to
17

obtain affordable insurance coverage, the value of our interests could decline, and in the event of anuninsured loss, we could lose all or a portion of our investment.
We have not established a minimum distribution payment level and no assurance can be given that we will beable to make distributions to our stockholders in the future at current levels or at all.
We are generally required to distribute to our stockholders at least 90% of our taxable incomeeach year for us to qualify as a REIT under the Internal Revenue Code of 1986, as amended, or theCode, which requirement we currently intend to satisfy through quarterly distributions of all orsubstantially all of our REIT taxable income in such year, subject to certain adjustments. We have notestablished a minimum distribution payment level, and our ability to pay distributions may be adverselyaffected by a number of factors, including the risk factors contained in or incorporated by referenceinto this prospectus supplement and the accompanying prospectus. Although we have made, andanticipate continuing to make, quarterly distributions to our stockholders, our board of directors hasthe sole discretion to determine the timing, form and amount of any future distributions to ourstockholders, and such determination will depend on our earnings, our financial condition, debtcovenants, maintenance of our REIT qualification and other factors as our board of directors maydeem relevant from time to time. We believe that a change in any one of the following factors couldadversely affect our results of operations and impair our ability to continue to pay distributions to ourstockholders:
• the profitability of the investment of the net proceeds from our equity offerings;
• our ability to make profitable investments;
• margin calls or other expenses that reduce our cash flow;
• defaults in our asset portfolio or decreases in the value of our portfolio; and
• the fact that anticipated operating expense levels may not prove accurate, as actual results mayvary from estimates.
As a result, no assurance can be given that we will be able to continue to make distributions toour stockholders in the future or that the level of any future distributions we do make to ourstockholders will achieve a market yield or increase or even be maintained over time, any of whichcould materially and adversely affect us.
In addition, distributions that we make to our stockholders are generally taxable to ourstockholders as ordinary income. However, a portion of our distributions may be designated by us aslong-term capital gains to the extent that they are attributable to capital gain income recognized by usor may constitute a return of capital to the extent that they exceed our earnings and profits asdetermined for tax purposes. A return of capital is not taxable, but has the effect of reducing the basisof a stockholder’s investment in our common stock.
Risks Related to Sources of Financing
Our access to sources of financing may be limited and thus our ability to maximize our returns may beadversely affected.
Our financing sources currently include our credit agreement and our master repurchaseagreements, which may include additional borrowings in the form of bank credit facilities (includingterm loans and revolving facilities), repurchase agreements, warehouse facilities, structured financingarrangements, public and private equity and debt issuances and derivative instruments, in addition totransaction or asset specific funding arrangements.
18

Our access to additional sources of financing will depend upon a number of factors, over which wehave little or no control, including:
• general market conditions;
• the market’s view of the quality of our assets;
• the market’s perception of our growth potential;
• our current and potential future earnings and cash distributions; and
• the market price of the shares of our common stock.
The current dislocation and weakness in the capital and credit markets could adversely affect oneor more private lenders and could cause one or more of our private lenders to be unwilling or unableto provide us with financing or to increase the costs of that financing. In addition, if regulatory capitalrequirements imposed on our private lenders change, they may be required to limit, or increase thecost of, financing they provide to us. In general, this could potentially increase our financing costs andreduce our liquidity or require us to sell assets at an inopportune time or price.
To the extent structured financing arrangements are unavailable, we may have to rely more heavilyon additional equity issuances, which may be dilutive to our stockholders, or on less efficient forms ofdebt financing that require a larger portion of our cash flow from operations, thereby reducing fundsavailable for our operations, future business opportunities, cash distributions to our stockholders andother purposes. We cannot assure you that we will have access to such equity or debt capital onfavorable terms (including, without limitation, cost and term) at the desired times, or at all, which maycause us to curtail our asset acquisition activities and/or dispose of assets, which could negatively affectour results of operations.
We may incur significant debt, which will subject us to increased risk of loss and may reduce cash availablefor distributions to our stockholders.
Our outstanding indebtedness currently includes our credit agreement, our repurchase agreements,and our convertible notes. Subject to market conditions and availability, we may incur additional debtthrough bank credit facilities (including term loans and revolving facilities), repurchase agreements,warehouse facilities and structured financing arrangements, public and private debt issuances (refer toNote 16 of the 2012 consolidated financial statements for disclosure of our debt offering subsequent toDecember 31, 2012) and derivative instruments, in addition to transaction or asset specific fundingarrangements. The percentage of leverage we employ will vary depending on our available capital, ourability to obtain and access financing arrangements with lenders and the lenders’ and rating agencies’estimate of the stability of our investment portfolio’s cash flow. Our governing documents contain nolimitation on the amount of debt we may incur. We may significantly increase the amount of leveragewe utilize at any time without approval of our board of directors. However, under our currentrepurchase agreements and bank credit facility, our total leverage may not exceed 75% of total assets(as defined therein), as adjusted to remove the impact of bona-fide loan sales that are accounted for asfinancings and the consolidation of variable interest entities pursuant to GAAP. In addition, we mayleverage individual assets at substantially higher levels. Incurring substantial debt could subject us tomany risks that, if realized, would materially and adversely affect us, including the risk that:
• our cash flow from operations may be insufficient to make required payments of principal ofand interest on the debt or we may fail to comply with all of the other covenants contained inthe debt, which is likely to result in (i) acceleration of such debt (and any other debt containinga cross-default or cross-acceleration provision) that we may be unable to repay from internalfunds or to refinance on favorable terms, or at all, (ii) our inability to borrow unused amounts
19

under our financing arrangements, even if we are current in payments on borrowings underthose arrangements and/or (iii) the loss of some or all of our assets to foreclosure or sale;
• our debt may increase our vulnerability to adverse economic and industry conditions with noassurance that investment yields will increase with higher financing costs;
• we may be required to dedicate a substantial portion of our cash flow from operations topayments on our debt, thereby reducing funds available for operations, future businessopportunities, stockholder distributions or other purposes; and
• we may not be able to refinance debt that matures prior to the investment it was used to financeon favorable terms, or at all.
We are subject to margin calls from our lenders under our financing facilities.
Subject to certain conditions, our credit facility lenders retain the sole discretion over the marketvalue of loans and/or securities that serve as collateral for the borrowings under our financing facilitiesfor purposes of determining whether we are required to pay margin to such lenders.
Interest rate fluctuations could significantly decrease our results of operations and cash flows and the marketvalue of our investments.
Our primary interest rate exposures relate to the following:
• changes in interest rates may affect the yield on our investments and the financing cost of ourdebt, as well as the performance of our interest rate swaps that we utilize for hedging purposes,which could result in operating losses for us should interest expense exceed interest income;
• declines in interest rates may reduce the yield on existing floating rate assets and/or the yield onprospective investments;
• changes in the level of interest rates may affect our ability to source investments;
• increases in the level of interest rates may negatively impact the value of our investments andour ability to realize gains from the disposition of assets;
• increases in the level of interest rates may increase the credit risk of our assets by negativelyimpacting the ability of our borrowers to pay debt service on our floating rate loan assets,refinance our assets upon maturity, and can negatively impact the value of the real estatecollateral supporting our investments through the impact increases in interest rates can have onproperty valuation capitalization rates; and
• changes in interest rates and/or the differential between U.S. dollar interest rates and those ofnon-dollar currencies in which we invest can adversely affect the value of our non-dollar assetsand/or associated currency hedging transactions.
Any warehouse facilities that we obtain may limit our ability to acquire assets, and we may incur losses if thecollateral is liquidated.
We may utilize, if available, warehouse facilities pursuant to which we would accumulate mortgageloans in anticipation of a securitization financing, which assets would be pledged as collateral for suchfacilities until the securitization transaction is consummated. In order to borrow funds to acquire assetsunder any future warehouse facilities, we expect that our lenders thereunder would have the right toreview the potential assets for which we are seeking financing. We may be unable to obtain the consentof a lender to acquire assets that we believe would be beneficial to us and we may be unable to obtainalternate financing for such assets. In addition, no assurance can be given that a securitization structure
20

would be consummated with respect to the assets being warehoused. If the securitization is notconsummated, the lender could liquidate the warehoused collateral and we would then have to pay anyamount by which the original purchase price of the collateral assets exceeds its sale price, subject tonegotiated caps, if any, on our exposure. In addition, regardless of whether the securitization isconsummated, if any of the warehoused collateral is sold before the consummation, we would have tobear any resulting loss on the sale. Currently, we have no warehouse facilities in place, and noassurance can be given that we will be able to obtain one or more warehouse facilities on favorableterms, or at all.
The utilization of any of our repurchase facilities is subject to the pre-approval of the lender.
We utilize repurchase agreements to finance the purchase of certain investments. In order toborrow funds under a repurchase agreement, the lender has the right to review the potential assets forwhich we are seeking financing and approve such asset in its sole discretion. Accordingly, we may beunable to obtain the consent of a lender to finance an investment and alternate sources of financing forsuch asset may not exist.
A failure to comply with restrictive covenants in our repurchase agreements and financing facilities wouldhave a material adverse effect on us, and any future financings may require us to provide additional collateralor pay down debt.
We are subject to various restrictive covenants contained in our existing financing arrangementsand may become subject to additional covenants in connection with future financings. Our creditagreement contains covenants that restrict our ability to incur additional debt or liens, make certaininvestments or acquisitions, merge, consolidate or transfer or dispose of substantially all assets orotherwise dispose of property and assets, pay dividends and make certain other restricted payments,change the nature of our business, and enter into transactions with affiliates. The credit agreement, aswell as our master repurchase agreements, each requires us to maintain compliance with variousfinancial covenants, including a minimum tangible net worth and cash liquidity, and specified financialratios, such as total debt to total assets and EBITDA to fixed charges. These covenants may limit ourflexibility to pursue certain investments or incur additional debt. If we fail to meet or satisfy any ofthese covenants, we would be in default under these agreements, and our lenders could elect to declareoutstanding amounts due and payable, terminate their commitments, require the posting of additionalcollateral and enforce their interests against existing collateral. We may also be subject to cross-defaultand acceleration rights and, with respect to collateralized debt, the posting of additional collateral andforeclosure rights upon default. Further, this could also make it difficult for us to satisfy thedistribution requirements necessary to maintain our status as a REIT for U.S. federal income taxpurposes.
These types of financing arrangements also involve the risk that the market value of the loanspledged or sold by us to the repurchase agreement counterparty or provider of the bank credit facilitymay decline in value, in which case the lender may require us to provide additional collateral or torepay all or a portion of the funds advanced. We may not have the funds available to repay our debt atthat time, which would likely result in defaults unless we are able to raise the funds from alternativesources, which we may not be able to achieve on favorable terms or at all. Posting additional collateralwould reduce our liquidity and limit our ability to leverage our assets. If we cannot meet theserequirements, the lender could accelerate our indebtedness, increase the interest rate on advancedfunds and terminate our ability to borrow funds from them, which could materially and adversely affectour financial condition and ability to implement our business plan. In addition, in the event that thelender files for bankruptcy or becomes insolvent, our loans may become subject to bankruptcy orinsolvency proceedings, thus depriving us, at least temporarily, of the benefit of these assets. Such anevent could restrict our access to bank credit facilities and increase our cost of capital.
21

If one or more of our manager’s executive officers are no longer employed by our Manager, financialinstitutions providing any financing arrangements we may have may not provide future financing to us, whichcould materially and adversely affect us.
If financial institutions with whom we seek to finance our investments require that one or more ofour Manager’s executives continue to serve in such capacity and if one or more of our Manager’sexecutives are no longer employed by our Manager, it may constitute an event of default and thefinancial institution providing the arrangement may have acceleration rights with respect to outstandingborrowings and termination rights with respect to our ability to finance our future investments with thatinstitution. If we are unable to obtain financing for our accelerated borrowings and for our futureinvestments under such circumstances, we could be materially and adversely affected.
We directly or indirectly utilize non-recourse securitizations, and such structures expose us to risks that couldresult in losses to us.
We utilize non-recourse securitizations of our investments in mortgage loans to the extentconsistent with the maintenance of our REIT qualification and exemption from the InvestmentCompany Act, in order to generate cash for funding new investments and/or to leverage existing assets.In most instances, this involves us transferring our loans to a special purpose securitization entity inexchange for cash. In some sale transactions, we also retain a subordinated interest in the loans sold.The securitization of our portfolio investments might magnify our exposure to losses on those portfolioinvestments because the subordinated interest we retain in the loans sold would be subordinate to thesenior interest in the loans sold, and we would, therefore, absorb all of the losses sustained with respectto a loan sold before the owners of the senior interest experience any losses. Moreover, we cannot beassured that we will be able to access the securitization market in the future, or be able to do so atfavorable rates. The inability to consummate securitizations of our portfolio to finance our investmentson a long-term basis could require us to seek other forms of potentially less attractive financing or toliquidate assets at an inopportune time or price, which could adversely affect our performance and ourability to grow our business.
Risks Related to Hedging
We enter into hedging transactions that could expose us to contingent liabilities in the future.
Subject to maintaining our qualification as a REIT, part of our investment strategy involvesentering into hedging transactions that require us to fund cash payments in certain circumstances (suchas the early termination of the hedging instrument caused by an event of default or other earlytermination event, or the decision by a counterparty to request margin securities it is contractuallyowed under the terms of the hedging instrument). The amount due would be equal to the unrealizedloss of the open swap positions with the respective counterparty and could also include other fees andcharges. These economic losses will be reflected in our results of operations, and our ability to fundthese obligations will depend on the liquidity of our assets and access to capital at the time, and theneed to fund these obligations could adversely impact our financial condition.
Hedging may adversely affect our earnings, which could reduce our cash available for distribution to ourstockholders.
Subject to maintaining our qualification as a REIT, we pursue various hedging strategies to seek toreduce our exposure to adverse changes in interest rates. Our hedging activity varies in scope based onthe level and volatility of interest rates, exchange rates, the type of assets held and other changing
22

market conditions. Hedging may fail to protect or could adversely affect us because, among otherthings:
• interest rate, currency and/or credit hedging can be expensive and may result in us receiving lessinterest income;
• available interest rate hedges may not correspond directly with the interest rate risk for whichprotection is sought;
• due to a credit loss, prepayment or asset sale, the duration of the hedge may not match theduration of the related asset or liability;
• the amount of income that a REIT may earn from hedging transactions (other than hedgingtransactions that satisfy certain requirements of the Code or that are done through a TRS) tooffset losses is limited by U.S. federal tax provisions governing REITs;
• the credit quality of the hedging counterparty owing money on the hedge may be downgraded tosuch an extent that it impairs our ability to sell or assign our side of the hedging transaction;and
• the hedging counterparty owing money in the hedging transaction may default on its obligationto pay.
In addition, we may fail to recalculate, readjust and execute hedges in an efficient manner.
Any hedging activity in which we engage may materially and adversely affect our results ofoperations and cash flows. Therefore, while we may enter into such transactions seeking to reducerisks, unanticipated changes in interest rates, credit spreads or currencies may result in poorer overallinvestment performance than if we had not engaged in any such hedging transactions. In addition, thedegree of correlation between price movements of the instruments used in a hedging strategy and pricemovements in the portfolio positions or liabilities being hedged may vary materially. Moreover, for avariety of reasons, we may not seek to establish a perfect correlation between such hedging instrumentsand the portfolio positions or liabilities being hedged. Any such imperfect correlation may prevent usfrom achieving the intended hedge and expose us to risk of loss.
Hedging instruments often are not traded on regulated exchanges, guaranteed by an exchange or its clearinghouse, or regulated by any U.S. or foreign governmental authorities and involve risks and costs that couldresult in material losses.
The cost of using hedging instruments increases as the period covered by the instrument increasesand during periods of rising and volatile interest rates. In addition, some hedging instruments involverisk because they often are not traded on regulated exchanges, guaranteed by an exchange or itsclearing house, or regulated by any U.S. or foreign governmental authorities. Consequently, in manycases, there are no requirements with respect to record keeping, financial responsibility or segregationof customer funds and positions. Furthermore, the enforceability of agreements underlying hedgingtransactions may depend on compliance with applicable securities, commodity and other regulatoryrequirements and, depending on the identity of the counterparty, applicable international requirements.The business failure of a hedging counterparty with whom we enter into a hedging transaction that isnot cleared on a regulated centralized clearing house will most likely result in its default. Default by aparty with whom we enter into a hedging transaction may result in the loss of unrealized profits andforce us to cover our commitments, if any, at the then current market price. Although generally we willseek to reserve the right to terminate our hedging positions, it may not always be possible to dispose ofor close out a hedging position without the consent of the hedging counterparty and we may not beable to enter into an offsetting contract in order to cover our risk. We cannot assure you that a liquidsecondary market will exist for hedging instruments purchased or sold, and we may be required tomaintain a position until exercise or expiration, which could result in significant losses.
23
We may fail to qualify for, or choose not to elect, hedge accounting treatment.
We record derivative and hedging transactions in accordance with GAAP. Under these standards,we may fail to qualify for, or choose not to elect, hedge accounting treatment for a number of reasons,including if we use instruments that do not meet the definition of a derivative (such as short sales), wefail to satisfy hedge documentation and hedge effectiveness assessment requirements or our instrumentsare not highly effective. If we fail to qualify for, or chose not to elect, hedge accounting treatment, ouroperating results may be volatile because changes in the fair value of the derivatives that we enter intomay not be offset by a change in the fair value of the related hedged transaction or item.
We enter into derivative contracts that could expose us to contingent liabilities in the future.
Subject to maintaining our qualification as a REIT, we enter into derivative contracts that couldrequire us to fund cash payments in the future under certain circumstances (e.g., the early terminationof the derivative agreement caused by an event of default or other early termination event, or thedecision by a counterparty to request margin securities it is contractually owed under the terms of thederivative contract). The amount due would be equal to the unrealized loss of the open swap positionswith the respective counterparty and could also include other fees and charges. These economic lossesmay materially and adversely affect our results of operations and cash flows.
Risks Related to Our Investments
We may not be able to identify assets that meet our investment objective.
We cannot assure you that we will be able to identify additional assets that meet our investmentobjective, that we will be successful in consummating any investment opportunities we identify or thatone or more investments we may make will yield attractive risk-adjusted returns. Our inability to doany of the foregoing likely would materially and adversely affect our results of operations and cashflows and our ability to make distributions to our stockholders.
The lack of liquidity in our investments may adversely affect our business.
The lack of liquidity of our investments in real estate loans and investments other than certain ofour investments in mortgage-backed securities, or MBS, may make it difficult for us to sell suchinvestments if the need or desire arises. Many of the securities we purchase are not registered underthe relevant securities laws, resulting in a prohibition against their transfer, sale, pledge or theirdisposition except in a transaction that is exempt from the registration requirements of, or otherwise inaccordance with, those laws. In addition, certain investments such as B-Notes, mezzanine loans andbridge and other loans are also particularly illiquid investments due to their short life, their potentialunsuitability for securitization and the greater difficulty of recovery in the event of a borrower’s default.As a result, many of our current investments are, and our future investments will be, illiquid and if weare required to liquidate all or a portion of our portfolio quickly, we may realize significantly less thanthe value at which we have previously recorded our investments. Further, we may face other restrictionson our ability to liquidate an investment in a business entity to the extent that we or our manager hasor could be attributed with material, non-public information regarding such business entity. As a result,our ability to vary our portfolio in response to changes in economic and other conditions may berelatively limited, which could adversely affect our results of operations and financial condition.
Our investments may be concentrated and are subject to risk of default.
While we seek to diversify our portfolio of investments, we are not required to observe specificdiversification criteria, except as may be set forth in the investment guidelines adopted by our board ofdirectors. Therefore, our investments in our target assets may at times be concentrated in certainproperty types that are subject to higher risk of foreclosure, or secured by properties concentrated in alimited number of geographic locations. To the extent that our portfolio is concentrated in any one
24

region or type of asset, downturns relating generally to such region or type of asset may result indefaults on a number of our investments within a short time period, which may reduce our net incomeand the value of our common stock and accordingly reduce our ability to pay dividends to ourstockholders.
Difficult conditions in the mortgage, commercial and residential real estate markets may cause us toexperience market losses related to our holdings, and we do not expect these conditions to improve in the nearfuture.
Our results of operations are materially affected by conditions in the real estate markets, thefinancial markets and the economy generally. Continuing concerns about the declining real estatemarket, as well as inflation, energy costs, geopolitical issues and the availability and cost of credit, havecontributed to increased volatility and diminished expectations for the economy and markets goingforward. The mortgage market has been severely affected by changes in the lending landscape andthere is no assurance that these conditions have stabilized or that they will not worsen. The disruptionin the mortgage market has an impact on new demand for homes, which will compress the homeownership rates and weigh heavily on future home price performance. There is a strong correlationbetween home price growth rates and mortgage loan delinquencies. The further deterioration of thereal estate market may cause us to experience losses related to our assets and to sell assets at a loss.Declines in the market values of our investments may adversely affect our results of operations andcredit availability, which may reduce earnings and, in turn, cash available for distribution to ourstockholders.
Construction loans involve an increased risk of loss.
We invest in construction loans. If we fail to fund our entire commitment on a construction loanor if a borrower otherwise fails to complete the construction of a project, there could be adverseconsequences associated with the loan, including: a loss of the value of the property securing the loan,especially if the borrower is unable to raise funds to complete it from other sources; a borrower claimagainst us for failure to perform under the loan documents; increased costs to the borrower that theborrower is unable to pay; a bankruptcy filing by the borrower; and abandonment by the borrower ofthe collateral for the loan.
We operate in a highly competitive market for investment opportunities and competition may limit our abilityto acquire desirable investments in our target assets and could also affect the pricing of these securities.
We operate in a highly competitive market for investment opportunities. Our profitability depends,in large part, on our ability to acquire our target assets at attractive prices. In acquiring our targetassets, we compete with a variety of institutional investors, including other REITs, commercial andinvestment banks, specialty finance companies, public and private funds (including other funds managedby Starwood Capital Group), commercial finance and insurance companies and other financialinstitutions. Many of our competitors are substantially larger and have considerably greater financial,technical, marketing and other resources than we do. Several other REITs have recently raisedsignificant amounts of capital, and may have investment objectives that overlap with ours, which maycreate additional competition for investment opportunities. Some competitors may have a lower cost offunds and access to funding sources that may not be available to us, such as funding from the U.S.government, if we are not eligible to participate in programs established by the U.S. government. Manyof our competitors are not subject to the operating constraints associated with REIT tax compliance ormaintenance of an exemption from the Investment Company Act. In addition, some of our competitorsmay have higher risk tolerances or different risk assessments, which could allow them to consider awider variety of investments and establish more relationships than us. Furthermore, competition forinvestments in our target assets may lead to the price of such assets increasing, which may further limitour ability to generate desired returns. We cannot assure you that the competitive pressures we face
25

will not have a material adverse effect on our business, financial condition and results of operations.Also, as a result of this competition, desirable investments in our target assets may be limited in thefuture and we may not be able to continue to take advantage of attractive investment opportunitiesfrom time to time, as we can provide no assurance that we will be able to identify and makeinvestments that are consistent with our investment objectives.
The commercial mortgage loans we acquire and the mortgage loans underlying our CMBS investments aresubject to the ability of the commercial property owner to generate net income from operating the property aswell as the risks of delinquency and foreclosure.
Commercial mortgage loans are secured by multifamily or commercial property and are subject torisks of delinquency and foreclosure, and risks of loss that may be greater than similar risks associatedwith loans made on the security of single-family residential property. The ability of a borrower to repaya loan secured by an income-producing property typically is dependent primarily upon the successfuloperation of such property rather than upon the existence of independent income or assets of theborrower. If the net operating income of the property is reduced, the borrower’s ability to repay theloan may be impaired. Net operating income of an income-producing property can be adverselyaffected by, among other things,
• tenant mix;
• success of tenant businesses;
• property management decisions;
• property location, condition and design;
• competition from comparable types of properties;
• changes in laws that increase operating expenses or limit rents that may be charged;
• changes in national, regional or local economic conditions and/or specific industry segments,including the credit and securitization markets;
• declines in regional or local real estate values;
• declines in regional or local rental or occupancy rates;
• increases in interest rates, real estate tax rates and other operating expenses;
• costs of remediation and liabilities associated with environmental conditions;
• the potential for uninsured or underinsured property losses;
• changes in governmental laws and regulations, including fiscal policies, zoning ordinances andenvironmental legislation and the related costs of compliance; and
• acts of God, terrorist attacks, social unrest and civil disturbances.
In the event of any default under a mortgage loan held directly by us, we will bear a risk of loss ofprincipal to the extent of any deficiency between the value of the collateral and the principal andaccrued interest of the mortgage loan, which could have a material adverse effect on our cash flowfrom operations and limit amounts available for distribution to our stockholders. In the event of thebankruptcy of a mortgage loan borrower, the mortgage loan to such borrower will be deemed to besecured only to the extent of the value of the underlying collateral at the time of bankruptcy (asdetermined by the bankruptcy court), and the lien securing the mortgage loan will be subject to theavoidance powers of the bankruptcy trustee or debtor-in-possession to the extent the lien isunenforceable under state law. Foreclosure of a mortgage loan can be an expensive and lengthyprocess, which could have a substantial negative effect on our anticipated return on the foreclosedmortgage loan.
26

Our investments in CMBS are generally subject to losses.
Our investments in CMBS are subject to losses. In general, losses on a mortgaged propertysecuring a mortgage loan included in a securitization will be borne first by the equity holder of theproperty, then by a cash reserve fund or letter of credit, if any, then by the holder of a mezzanine loanor B-Note, if any, then by the ‘‘first loss’’ subordinated security holder (generally, the ‘‘B-Piece’’ buyer)and then by the holder of a higher-rated security. In the event of default and the exhaustion of anyequity support, reserve fund, letter of credit, mezzanine loans or B-Notes, and any classes of securitiesjunior to those in which we invest, we will not be able to recover all of our investment in the securitieswe purchase. In addition, if the underlying mortgage portfolio has been overvalued by the originator, orif the values subsequently decline and, as a result, less collateral is available to satisfy interest andprincipal payments due on the related MBS, there would be an increased risk of loss. The prices oflower credit quality securities are generally less sensitive to interest rate changes than more highly ratedinvestments, but more sensitive to adverse economic downturns or individual issuer developments.
If our Manager overestimates the yields or incorrectly prices the risks of our investments, we may experiencelosses.
Our Manager values our potential investments based on yields and risks, taking into accountestimated future losses on the mortgage loans and the underlying collateral included in thesecuritization’s pools, and the estimated impact of these losses on expected future cash flows andreturns. Our Manager’s loss estimates may not prove accurate, as actual results may vary fromestimates. In the event that our Manager underestimates the asset level losses relative to the price wepay for a particular investment, we may experience losses with respect to such investment.
Real estate valuation is inherently subjective and uncertain
The valuation of real estate and therefore the valuation of any underlying security relating to loansmade by us is inherently subjective due to, among other factors, the individual nature of each property,its location, the expected future rental revenues from that particular property and the valuationmethodology adopted. In addition, where we invest in construction loans, initial valuations will assumecompletion of the project. As a result, the valuations of the real estate assets against which we willmake loans are subject to a degree of uncertainty and are made on the basis of assumptions andmethodologies that may not prove to be accurate, particularly in periods of volatility, low transactionflow or restricted debt availability in the commercial or residential real estate markets.
Our investments in corporate bank debt and debt securities of commercial real estate operating or financecompanies are subject to the specific risks relating to the particular company and to the general risks ofinvesting in real estate-related loans and securities, which may result in significant losses.
We invest in corporate bank debt and may invest in debt securities of commercial real estateoperating or finance companies. These investments involve special risks relating to the particularcompany, including its financial condition, liquidity, results of operations, business and prospects. Inparticular, the debt securities are often non-collateralized and may also be subordinated to its otherobligations. We also invest in debt securities of companies that are not rated or are ratednon-investment grade by one or more rating agencies. Investments that are not rated or are ratednon-investment grade have a higher risk of default than investment grade rated assets and thereforemay result in losses to us. We have not adopted any limit on such investments.
These investments also subject us to the risks inherent with real estate-related investments,including:
• risks of delinquency and foreclosure, and risks of loss in the event thereof;
• the dependence upon the successful operation of, and net income from, real property;
27

• risks generally incident to interests in real property; and
• risks specific to the type and use of a particular property.
These risks may adversely affect the value of our investments in commercial real estate operatingand finance companies and the ability of the issuers thereof to make principal and interest payments ina timely manner, or at all, and could result in significant losses.
Investments in non-conforming and non-investment grade rated loans or securities involve increased risk ofloss.
Many of our investments do not conform to conventional loan standards applied by traditionallenders and either are not rated or rated as non-investment grade by the rating agencies. Thenon-investment grade ratings for these assets typically result from the overall leverage of the loans, thelack of a strong operating history for the properties underlying the loans, the borrowers’ credit history,the properties’ underlying cash flow or other factors. As a result, these investments have a higher riskof default and loss than investment grade rated assets. Any loss we incur may be significant and mayreduce distributions to our stockholders and adversely affect the market value of our common stock.There are no limits on the percentage of unrated or non-investment grade rated assets we may hold inour investment portfolio.
Any credit ratings assigned to our investments are subject to ongoing evaluations and revisions and we cannotassure you that those ratings will not be downgraded.
Some of our investments are rated by Moody’s Investors Service, Fitch Ratings, Standard & Poor’s,DBRS, Inc. or Realpoint LLC. Any credit ratings on our investments are subject to ongoing evaluationby credit rating agencies, and we cannot assure you that any such ratings will not be changed orwithdrawn by a rating agency in the future if, in its judgment, circumstances warrant. If rating agenciesassign a lower-than-expected rating or reduce or withdraw, or indicate that they may reduce orwithdraw, their ratings of our investments in the future, the value of these investments couldsignificantly decline, which would adversely affect the value of our investment portfolio and could resultin losses upon disposition or the failure of borrowers to satisfy their debt service obligations to us.
The B-Notes that we acquire may be subject to additional risks related to the privately negotiated structureand terms of the transaction, which may result in losses to us.
We may invest in B-Notes. B-Notes are mortgage loans typically (i) secured by a first mortgage ona single large commercial property or group of related properties and (ii) subordinated to an A-Notesecured by the same first mortgage on the same collateral. As a result, if a borrower defaults, theremay not be sufficient funds remaining for B-Note holders after payment to the A-Note holders.However, because each transaction is privately negotiated, B-Notes can vary in their structuralcharacteristics and risks. For example, the rights of holders of B-Notes to control the process followinga borrower default may vary from transaction to transaction. Further, B-Notes typically are secured bya single property and so reflect the risks associated with significant concentration. Significant lossesrelated to our B-Notes would result in operating losses for us and may limit our ability to makedistributions to our stockholders.
Our mezzanine loan assets involve greater risks of loss than senior loans secured by income-producingproperties.
We invest in mezzanine loans, which take the form of subordinated loans secured by secondmortgages on the underlying property or loans secured by a pledge of the ownership interests of eitherthe entity owning the property or a pledge of the ownership interests of the entity that owns theinterest in the entity owning the property. These types of assets involve a higher degree of risk thanlong-term senior mortgage lending secured by income-producing real property, because the loan may
28

become unsecured as a result of foreclosure by the senior lender. In the event of a bankruptcy of theentity providing the pledge of its ownership interests as security, we may not have full recourse to theassets of such entity, or the assets of the entity may not be sufficient to satisfy our mezzanine loan. If aborrower defaults on our mezzanine loan or debt senior to our loan, or in the event of a borrowerbankruptcy, our mezzanine loan will be satisfied only after the senior debt. As a result, we may notrecover some or all of our initial expenditure. In addition, mezzanine loans may have higherloan-to-value ratios than conventional mortgage loans, resulting in less equity in the property andincreasing the risk of loss of principal. Significant losses related to our mezzanine loans would result inoperating losses for us and may limit our ability to make distributions to our stockholders.
Bridge loans involve a greater risk of loss than traditional investment-grade mortgage loans with fully insuredborrowers.
We may acquire bridge loans secured by first lien mortgages on a property to borrowers who aretypically seeking short-term capital to be used in an acquisition, construction or rehabilitation of aproperty, or other short-term liquidity needs. The typical borrower under a bridge loan has usuallyidentified an undervalued asset that has been under-managed and/or is located in a recovering market.If the market in which the asset is located fails to recover according to the borrower’s projections, or ifthe borrower fails to improve the quality of the asset’s management and/or the value of the asset, theborrower may not receive a sufficient return on the asset to satisfy the bridge loan, and we bear therisk that we may not recover some or all of our initial expenditure.
In addition, borrowers usually use the proceeds of a conventional mortgage to repay a bridge loan.Bridge loans therefore are subject to risks of a borrower’s inability to obtain permanent financing torepay the bridge loan. Bridge loans are also subject to risks of borrower defaults, bankruptcies, fraud,losses and special hazard losses that are not covered by standard hazard insurance. In the event of anydefault under bridge loans held by us, we bear the risk of loss of principal and non-payment of interestand fees to the extent of any deficiency between the value of the mortgage collateral and the principalamount and unpaid interest of the bridge loan. To the extent we suffer such losses with respect to ourbridge loans, the value of our company and the price of our shares of common stock may be adverselyaffected.
We purchase securities backed by subprime or alternative documentation residential mortgage loans, which aresubject to increased risks.
We own non-agency RMBS backed by collateral pools of mortgage loans that have been originatedusing underwriting standards that are less restrictive than those used in underwriting ‘‘prime mortgageloans.’’ These lower standards include mortgage loans made to borrowers having imperfect or impairedcredit histories, mortgage loans where the amount of the loan at origination is 80% or more of thevalue of the mortgage property, mortgage loans made to borrowers with low credit scores, mortgageloans made to borrowers who have other debt that represents a large portion of their income andmortgage loans made to borrowers whose income is not required to be disclosed or verified. Due toeconomic conditions, including increased interest rates and lower home prices, as well as aggressivelending practices, subprime mortgage loans have in recent periods experienced increased rates ofdelinquency, foreclosure, bankruptcy and loss, and they are likely to continue to experiencedelinquency, foreclosure, bankruptcy and loss rates that are higher, and that may be substantiallyhigher, than those experienced by mortgage loans underwritten in a more traditional manner. Thus,because of the higher delinquency rates and losses associated with subprime mortgage loans andalternative documentation, or Alt A, mortgage loans, the performance of non-agency RMBS backed bysubprime mortgage loans and Alt A mortgage loans that we may acquire could be correspondinglyadversely affected, which could adversely impact our results of operations, financial condition andbusiness.
29

The residential mortgage loans that we acquire, and that underlie the RMBS we acquire, are subject to risksparticular to investments secured by mortgage loans on residential real estate property. These risks areheightened because we purchase non-performing loans.
Residential mortgage loans are secured by single family residential property and are subject torisks of delinquency and foreclosure and risks of loss. The ability of a borrower to repay a loan securedby a residential property typically is dependent upon the income or assets of the borrower. A numberof factors may impair borrowers’ abilities to repay their loans, including:
• changes in the borrower’s income or assets;
• acts of God, which may result in uninsured losses;
• acts of war or terrorism, including the consequences of events;
• adverse changes in national and local economic and market conditions;
• changes in governmental laws and regulations, including fiscal policies, zoning ordinances andenvironmental legislation and the related costs of compliance;
• costs of remediation and liabilities associated with environmental conditions; and
• the potential for uninsured or under-insured property losses.
In the event of any default under a mortgage loan held directly by us, we will bear a risk of loss ofprincipal to the extent of any deficiency between the value of the collateral and the price we paid forthe loan and any accrued interest of the mortgage loan plus advances made, which could have amaterial adverse effect on our cash flow from operations. In the event of the bankruptcy of a mortgageloan borrower, the mortgage loan to such borrower will be deemed to be secured only to the extent ofthe value of the underlying collateral at the time of bankruptcy (as determined by the bankruptcycourt), and the lien securing the mortgage loan will be subject to the avoidance powers of thebankruptcy trustee or debtor-in-possession to the extent the lien is unenforceable under state law.Additionally, foreclosure on a mortgage loan could subject us to greater concentration of the risks ofthe residential real estate markets and risks related to the ownership and management of real property.
We may acquire non-agency RMBS, which are backed by residential real estate property but, incontrast to agency RMBS, their principal and interest are not guaranteed by federally chartered entitiessuch as the Federal National Mortgage Association, or Fannie Mae, and the Federal Home LoanMortgage Corporation and, in the case of the Government National Mortgage Association, the U.S.government. Our investments in RMBS are subject to the risks of defaults, foreclosure timelineextension, fraud, home price depreciation and unfavorable modification of loan principal amount,interest rate and amortization of principal, accompanying the underlying residential mortgage loans. Tothe extent that assets underlying our investments are concentrated geographically, by property type orin certain other respects, we may be subject to certain of the foregoing risks to a greater extent. In theevent of defaults on the residential mortgage loans that underlie our investments in agency RMBS andthe exhaustion of any underlying or any additional credit support, we may not realize our anticipatedreturn on our investments and we may incur a loss on these investments.
Our inability to promptly foreclose upon defaulted mortgage loans could increase our cost of doing businessand/or diminish our expected return on investments.
Our ability to promptly foreclose upon defaulted mortgage loans and liquidate the underlying realproperty plays a critical role in our valuation of the assets in which we invest and our expected returnon those investments. There are a variety of factors that may inhibit our ability to foreclose upon amortgage loan and liquidate the real property within the time frames we model as part of our valuationprocess. These factors include, without limitation: federal, state or local legislative action or initiativesdesigned to provide homeowners with assistance in avoiding residential mortgage loan foreclosures and
30

that serve to delay the foreclosure process; Home Affordable Modification Program and otherprograms that require specific procedures to be followed to explore the refinancing of a mortgage loanprior to the commencement of a foreclosure proceeding; and continued declines in real estate valuesand sustained high levels of unemployment that increase the number of foreclosures and placeadditional pressure on the already overburdened judicial and administrative systems.
Prepayment rates may adversely affect the value of our investment portfolio.
The value of our investment portfolio is affected by prepayment rates on our mortgage assets. Inmany cases, borrowers are not prohibited from making prepayments on their mortgage loans.Prepayment rates are influenced by changes in interest rates and a variety of economic, geographic andother factors beyond our control, including, without limitation, housing and financial markets andrelative interest rates on fixed rate mortgage loans, and adjustable rate mortgage loans, or ARMs, andconsequently prepayment rates cannot be predicted.
We generally receive payments from principal payments that are made on our mortgage assets,including residential mortgage loans underlying the agency RMBS or the non-agency RMBS that weacquire. When borrowers prepay their residential mortgage loans faster than expected, it results inprepayments that are faster than expected on the RMBS. Faster than expected prepayments couldadversely affect our profitability and our ability to recoup our cost of certain investments purchased ata premium over par value, including in the following ways:
• We may purchase RMBS that have a higher interest rate than the market interest rate at thetime. In exchange for this higher interest rate, we may pay a premium over the par value toacquire our mortgage asset. In accordance with GAAP, we may amortize this premium over theestimated term of our mortgage asset. If our mortgage asset is prepaid in whole or in part priorto its maturity date, however, we may be required to expense the premium that was prepaid atthe time of the prepayment.
• Prepayment rates generally increase when interest rates fall and decrease when interest ratesrise, making it unlikely that we would be able to reinvest the proceeds of any prepayment inmortgage assets of similar quality and terms (including yield). If we are unable to invest insimilar mortgage assets, we would be adversely affected.
While we seek to minimize prepayment risk to the extent practical, in selecting investments wemust balance prepayment risk against other risks and the potential returns of each investment. Nostrategy can completely insulate us from prepayment risk.
Interest rate mismatches between our agency RMBS backed by ARMs and our borrowings used to fund ourpurchases of these assets may reduce our net interest income and cause us to suffer a loss during periods ofrising interest rates.
To the extent that we invest in agency RMBS backed by ARMs, we may finance these investmentswith borrowings that have interest rates that adjust more frequently than the interest rate indices andrepricing terms of agency RMBS backed by ARMs. Accordingly, if short-term interest rates increase,our borrowing costs may increase faster than the interest rates on agency RMBS backed byARMs adjust. As a result, in a period of rising interest rates, we could experience a decrease in netincome or a net loss. In most cases, the interest rate indices and repricing terms of agency RMBSbacked by ARMs and our borrowings will not be identical, thereby potentially creating an interest ratemismatch between our investments and our borrowings. While the historical spread between relevantshort-term interest rate indices has been relatively stable, there have been periods when the spreadbetween these indices was volatile. During periods of changing interest rates, these interest rate indexmismatches could reduce our net income or produce a net loss, and adversely affect our ability to makedistributions and the market price of our common stock.
31

In addition, agency RMBS backed by ARMs are typically subject to lifetime interest rate capswhich limit the amount an interest rate can increase through the maturity of the agency RMBS.However, our borrowings under repurchase agreements typically are not subject to similar restrictions.Accordingly, in a period of rapidly increasing interest rates, the interest rates paid on our borrowingscould increase without limitation while caps could limit the interest rates on these types of agencyRMBS. This problem is magnified for agency RMBS backed by ARMs that are not fully indexed.Further, some agency RMBS backed by ARMs may be subject to periodic payment caps that result in aportion of the interest being deferred and added to the principal outstanding. As a result, we mayreceive less cash income on these types of agency RMBS than we need to pay interest on our relatedborrowings. These factors could reduce our net interest income and cause us to suffer a loss duringperiods of rising interest rates.
Risks of cost overruns and noncompletion of renovation of the properties underlying rehabilitation loans mayresult in significant losses.
The renovation, refurbishment or expansion by a borrower under a mortgaged property involvesrisks of cost overruns and noncompletion. Estimates of the costs of improvements to bring an acquiredproperty up to standards established for the market position intended for that property may proveinaccurate. Other risks may include rehabilitation costs exceeding original estimates, possibly making aproject uneconomical, environmental risks and rehabilitation and subsequent leasing of the property notbeing completed on schedule. If such renovation is not completed in a timely manner, or if it costsmore than expected, the borrower may experience a prolonged impairment of net operating incomeand may not be able to make payments on our investment, which could result in significant losses.
Interest rate fluctuations could reduce our ability to generate income on our investments and may causelosses.
Changes in interest rates affect our net interest income, which is the difference between theinterest income we earn on our interest-earning investments and the interest expense we incur infinancing these investments. Changes in the level of interest rates also may affect our ability tooriginate and acquire assets, the value of our assets and our ability to realize gains from the dispositionof assets. Changes in interest rates may also affect borrower default rates. In a period of rising interestrates, our interest expense could increase, while the interest we earn on our fixed-rate debt investmentswould not change, adversely affecting our profitability. Our operating results depend in large part ondifferences between the income from our assets, net of credit losses, and our financing costs. Weanticipate that for any period during which our assets are not match-funded, the income from suchassets will respond more slowly to interest rate fluctuations than the cost of our borrowings.Consequently, changes in interest rates may significantly influence our net income. Increases in theserates tend to decrease our net income and the market value of our fixed rate assets. Interest ratefluctuations resulting in our interest expense exceeding interest income would result in operating lossesfor us.
We may experience a decline in the fair value of our assets.
A decline in the fair value of our assets may require us to recognize an ‘‘other-than-temporary’’impairment against such assets under GAAP if we were to determine that, with respect to any assets inunrealized loss positions, we do not have the ability and intent to hold such assets to maturity or for aperiod of time sufficient to allow for recovery to the amortized cost of such assets. If such adetermination were to be made, we would recognize unrealized losses through earnings and write downthe amortized cost of such assets to a new cost basis, based on the fair value of such assets on the datethey are considered to be other-than-temporarily impaired. Such impairment charges reflect non-cashlosses at the time of recognition; subsequent disposition or sale of such assets could further affect our
32

future losses or gains, as they are based on the difference between the sale price received and adjustedamortized cost of such assets at the time of sale.
Some of our portfolio investments are recorded at fair value and, as a result, there is uncertainty as to thevalue of these investments.
Some of our portfolio investments are in the form of positions or securities that are not publiclytraded. The fair value of securities and other investments that are not publicly traded may not bereadily determinable. We value these investments quarterly at fair value, as determined in accordancewith GAAP, which include consideration of unobservable inputs. Because such valuations are subjective,the fair value of certain of our assets may fluctuate over short periods of time and our determinationsof fair value may differ materially from the values that would have been used if a ready market forthese securities existed. The value of our common stock could be adversely affected if ourdeterminations regarding the fair value of these investments were materially higher than the values thatwe ultimately realize upon their disposal.
Liability relating to environmental matters may impact the value of properties that we may acquire uponforeclosure of the properties underlying our investments.
To the extent we foreclose on properties with respect to which we have extended mortgage loans,we may be subject to environmental liabilities arising from such foreclosed properties. Under variousU.S. federal, state and local laws, an owner or operator of real property may become liable for thecosts of removal of certain hazardous substances released on its property. These laws often imposeliability without regard to whether the owner or operator knew of, or was responsible for, the release ofsuch hazardous substances.
The presence of hazardous substances may adversely affect an owner’s ability to sell real estate orborrow using real estate as collateral. To the extent that an owner of a property underlying one of ourdebt investments becomes liable for removal costs, the ability of the owner to make payments to usmay be reduced, which in turn may adversely affect the value of the relevant mortgage asset held by usand our ability to make distributions to our stockholders.
If we foreclose on any properties underlying our investments, the presence of hazardous substanceson a property may adversely affect our ability to sell the property and we may incur substantialremediation costs, thus harming our financial condition. The discovery of material environmentalliabilities attached to such properties could have a material adverse effect on our results of operationsand financial condition and our ability to make distributions to our stockholders.
33

We may invest in triple net leases. Negative market conditions or adverse events affecting tenants, or theindustries in which they operate, could have an adverse impact on any triple net lease in which we invest.
We may enter into triple net leases. If we enter into triple net leases, cash flow from operationsdepends in part on the ability to lease space to tenants on economically favorable terms. If we enterinto triple net leases, we could be adversely affected by various facts and events over which we havelimited or no control, such as:
• lack of demand in areas where our properties are located;
• inability to retain existing tenants and attract new tenants;
• oversupply of space and changes in market rental rates;
• our tenants’ creditworthiness and ability to pay rent, which may be affected by their operations,the current economic situation and competition within their industries from other operators;
• defaults by and bankruptcies of tenants, failure of tenants to pay rent on a timely basis, orfailure of tenants to comply with their contractual obligations; and
• economic or physical decline of the areas where the properties are located.
At any time, any tenant may experience a downturn in its business that may weaken its operatingresults or overall financial condition. As a result, a tenant may delay lease commencement, fail to makerental payments when due, decline to extend a lease upon its expiration, become insolvent or declarebankruptcy. Any tenant bankruptcy or insolvency, leasing delay or failure to make rental paymentswhen due could result in the termination of the tenant’s lease and material losses to us.
If tenants do not renew their leases as they expire, we may not be able to rent or sell theproperties. Furthermore, leases that are renewed, and some new leases for properties that arere-leased, may have terms that are less economically favorable than expiring lease terms, or mayrequire us to incur significant costs, such as renovations, tenant improvements or lease transactioncosts. Negative market conditions may cause us to sell vacant properties for less than their carryingvalue, which could result in impairments. Any of these events could adversely affect cash flow fromoperations and our ability to make distributions to stockholders and service indebtedness. A significantportion of the costs of owning property, such as real estate taxes, insurance and maintenance, are notnecessarily reduced when circumstances cause a decrease in rental revenue from the properties. In aweakened financial condition, tenants may not be able to pay these costs of ownership and we may beunable to recover these operating expenses from them.
Further, the occurrence of a tenant bankruptcy or insolvency could diminish the income we receivefrom the tenant’s lease or leases. In addition, a bankruptcy court might authorize the tenant toterminate its leases with us. If that happens, our claim against the bankrupt tenant for unpaid futurerent would be subject to statutory limitations that most likely would be substantially less than theremaining rent we are owed under the leases. In addition, any claim we have for unpaid past rent, ifany, may not be paid in full. As a result, tenant bankruptcies may have a material adverse effect on ourresults of operations.
Past or future actions of the U.S. government for the purpose of reforming and/or stabilizing the financialmarkets may adversely affect our business.
In the aftermath of the financial crisis, the U.S. government, through the Federal Reserve, the U.S.Treasury, the SEC, the Federal Housing Administration, the Federal Deposit Insurance Corporation,and other governmental and regulatory bodies have taken or are considering taking various actions to
34

address the financial crisis. Many aspects of these actions are subject to rulemaking and will take effectover several years, making it difficult to anticipate the overall financial impact on us and, moregenerally, the financial services and mortgage industries. Additionally, we cannot predict whether therewill be additional proposed laws or reforms that would affect us, whether or when such changes may beadopted, how such changes may be interpreted and enforced or how such changes may affect us.However, the costs of complying with any additional laws or regulations could have a material adverseeffect on our financial condition and results of operations.
Investments outside the U.S. that are denominated in foreign currencies subject us to foreign currency risks,which may adversely affect our distributions and our REIT status.
Our investments outside the U.S. denominated in foreign currencies subject us to foreign currencyrisk due to potential fluctuations in exchange rates between foreign currencies and the U.S. dollar. As aresult, changes in exchange rates of any such foreign currency to U.S. dollars may affect our incomeand distributions and may also affect the book value of our assets and the amount of stockholders’equity.
Changes in foreign currency exchange rates used to value a REIT’s foreign assets may beconsidered changes in the value of the REIT’s assets. These changes may adversely affect our status asa REIT. Further, bank accounts in foreign currency which are not considered cash or cash equivalentsmay adversely affect our status as a REIT.
The ongoing Eurozone crisis may have an adverse effect on investments in Europe and the break up of theEurozone, or the exit of any member state, would create uncertainty and could affect our investments directly.
A portion of our investments consists of target assets secured by European collateral. The ongoingsituation relating to the sovereign debt of several countries, including Greece, Ireland, Italy, Spain andPortugal, together with the risk of contagion to other, more financially stable countries, has exacerbatedthe difficult global financial situation. The situation has also raised a number of uncertainties regardingthe stability and overall standing of the European Monetary Union. Any further deterioration in theglobal or Eurozone economy could have a significant adverse effect on our activities and the value ofour European collateral.
In addition, if we hold any assets that are denominated in Euros (including loans secured on suchassets), such as assets in continental Europe, further deterioration in the Eurozone economy could havea material adverse effect on the value of our investment in such assets and amplify the currency risksfaced by us.
If any country were to leave the Eurozone, or if the Eurozone were to break up entirely, thetreatment of debt obligations previously denominated in Euros is uncertain. A number of issues wouldbe raised, such as whether obligations which are expressed to be payable in Euros would bere-denominated into a new currency. The answer to this and other questions is uncertain and woulddepend on the way in which the break-up occurred and also on the nature of the transaction: the lawgoverning it; which courts have jurisdiction in relation to it; the place of payment; and the place ofincorporation of the payor. If we held any investments in Euros at the time of any Eurozone exits orbreak-up, this uncertainty and potential re-denomination could have a material adverse effect on thevalue of our investments and the income from them.
35

We have not previously invested in residential REO and our property management costs, capital expenditures,financing charges, property taxes and other fees and expenses could exceed our rental income from any suchinvestments.
Our board of directors has approved the expansion of our investment guidelines to includeresidential REO. Sales of pools of single to four family residential properties is a relatively recentoccurrence and the process for bidding on these assets is not yet well established. Our Manager willseek to perform extensive due diligence on these assets prior to purchase, but market and competitiveforces may make it difficult to do so. In addition, the preparation of detailed cost and revenueprojections prior to acquiring these assets will require us to make a number of estimates andassumptions, including assumptions about occupancy levels, capital expenditures, costs associated withcarrying and operating our portfolio, tenant defaults, trends in rental rates and other factors. Ourassumptions may prove, in hindsight, to be incorrect.
Our ability to generate positive cash flows from operations from residential REO will also beinfluenced by a variety of factors, many of which are beyond our control, including, without limitation,the following:
• overall conditions in the single to four family housing and rental markets, including:
• macroeconomic shifts in demand for residential rental properties;
• inability to lease or re-lease properties to tenants timely and on attractive terms or at all;
• failure of tenants to pay rent when due or otherwise perform their lease obligations;
• unanticipated repairs, capital expenditures or other costs;
• uninsured damages; and
• increases in property taxes and insurance costs;
• pace of residential foreclosures;
• level of competition for suitable target assets;
• terms and conditions of purchase contracts;
• availability of new government programs to reduce foreclosure rates or facilitate a recovery inthe housing markets;
• the impact of any ‘‘lease to own’’ or similar programs that we may employ with regard toresidential REO;
• changes in laws that increase operating expenses or limit rents that may be charged;
• limitations imposed upon us by government-related or other sellers on our ability to sellresidential REO during a certain time period;
• the short-term nature of most residential leases and the costs and potential delays in re-leasing;
• the amount and cost of debt financing we employ to leverage our returns;
• the geographic mix of our assets; and
• the cost, quality and condition of assets we are able to purchase.
36

The lack of liquidity of our residential REO investments may adversely affect our long-term profitability onsuch investments and increases the risk that we could suffer losses on such investments if our rental strategydoes not generate sufficient cash flows to sustain our portfolio until market conditions improve.
If we find it necessary to liquidate residential REO assets for any reason prior to a significantimprovement in the residential market, we may experience losses upon the sale of these investments.The illiquidity of residential REO assets means that our ability to vary our asset base in response tochanges in economic and other conditions may be severely constrained, which could adversely affectour results of operations and financial condition. In the event prices of residential assets increase, theremay be a limited number of potential purchasers of portfolios of such assets which may reduce ourefficiency and profits upon sales. We cannot predict whether we will be able to sell properties for theprices or on the terms set by us, or whether any price or other terms offered by a prospectivepurchaser would be acceptable to us. We cannot predict the length of time needed to find willingpurchasers and to close the sale of properties. If we are unable to sell properties when we determine todo so, or if we are prohibited from doing so, it could have a material adverse effect on our cash flowand results of operations from such investments.
We may rely on local, third-party service providers in connection with REO investments.
In connection with any REO investments, we may rely on local, third-party vendors and servicesproviders for certain services for our properties. For example, we may rely on third-party houseimprovement professionals, leasing agents and property management companies. We do not haveexclusive or long-term contractual relationships with any of these third-parties. Our cash flows fromREO properties may be adversely affected if third-party vendors and service providers with whom wedo business fail to provide quality services.
Risks Related to Our Organization and Structure
Certain provisions of Maryland law could inhibit changes in control.
Certain provisions of the Maryland General Corporation Law, or the MGCL, may have the effectof deterring a third party from making a proposal to acquire us or of impeding a change in controlunder circumstances that otherwise could provide the holders of our common stock with theopportunity to realize a premium over the then-prevailing market price of our common stock. We aresubject to the ‘‘business combination’’ provisions of the MGCL that, subject to limitations, prohibitcertain business combinations (including a merger, consolidation, share exchange, or, in circumstancesspecified in the statute, an asset transfer or issuance or reclassification of equity securities) between usand an ‘‘interested stockholder’’ (defined generally as any person who beneficially owns 10% or moreof our then outstanding voting capital stock or an affiliate or associate of ours who, at any time withinthe two-year period prior to the date in question, was the beneficial owner of 10% or more of our thenoutstanding voting capital stock) or an affiliate thereof for five years after the most recent date onwhich the stockholder becomes an interested stockholder. After the five-year prohibition, any businesscombination between us and an interested stockholder generally must be recommended by our board ofdirectors and approved by the affirmative vote of at least (i) 80% of the votes entitled to be cast byholders of outstanding shares of our voting capital stock and (ii) two-thirds of the votes entitled to becast by holders of voting capital stock of the corporation other than shares held by the interestedstockholder with whom or with whose affiliate the business combination is to be effected or held by anaffiliate or associate of the interested stockholder. These super-majority vote requirements do not applyif our common stockholders receive a minimum price, as defined under Maryland law, for their sharesin the form of cash or other consideration in the same form as previously paid by the interestedstockholder for its shares. These provisions of the MGCL do not apply, however, to businesscombinations that are approved or exempted by a board of directors prior to the time that the
37
interested stockholder becomes an interested stockholder. Pursuant to the statute, our board ofdirectors has by resolution exempted business combinations between us and any other person, providedthat such business combination is first approved by our board of directors (including a majority of ourdirectors who are not affiliates or associates of such person).
The ‘‘control share’’ provisions of the MGCL provide that ‘‘control shares’’ of a Marylandcorporation (defined as shares which, when aggregated with other shares controlled by the stockholder(except solely by virtue of a revocable proxy), entitle the stockholder to exercise one of three increasingranges of voting power in electing directors) acquired in a ‘‘control share acquisition’’ (defined as thedirect or indirect acquisition of ownership or control of ‘‘control shares’’) have no voting rights exceptto the extent approved by our stockholders by the affirmative vote of at least two-thirds of all the votesentitled to be cast on the matter, excluding votes entitled to be cast by the acquirer of control shares,our officers and our personnel who are also our directors. Our bylaws contain a provision exemptingfrom the control share acquisition statute any and all acquisitions by any person of shares of our stock.There can be no assurance that this provision will not be amended or eliminated at any time in thefuture.
The ‘‘unsolicited takeover’’ provisions of the MGCL permit our board of directors, withoutstockholder approval and regardless of what is currently provided in our charter or bylaws, toimplement takeover defenses, some of which (for example, a classified board) we do not yet have.These provisions may have the effect of inhibiting a third party from making an acquisition proposalfor us or of delaying, deferring or preventing a change in control of us under the circumstances thatotherwise could provide the holders of shares of common stock with the opportunity to realize apremium over the then current market price.
Our authorized but unissued shares of common and preferred stock may prevent a change in control.
Our charter authorizes us to issue additional authorized but unissued shares of common orpreferred stock. In addition, our board of directors may, without stockholder approval, amend ourcharter to increase the aggregate number of our shares of stock or the number of shares of stock ofany class or series that we have authority to issue and classify or reclassify any unissued shares ofcommon or preferred stock and set the preferences, rights and other terms of the classified orreclassified shares. As a result, our board of directors may establish a series of shares of common orpreferred stock that could delay or prevent a transaction or a change in control that might involve apremium price for our shares of common stock or otherwise be in the best interest of our stockholders.
Maintenance of our exemption from registration under the Investment Company Act imposes significant limitson our operations.
We intend to conduct our operations so that neither we nor any of our subsidiaries are required toregister as an investment company under the Investment Company Act. Because we are a holdingcompany that conducts our businesses primarily through wholly-owned subsidiaries, the securities issuedby these subsidiaries that are excepted from the definition of ‘‘investment company’’ underSection 3(c)(1) or Section 3(c)(7) of the Investment Company Act, together with any other investmentsecurities we own, may not have a combined value in excess of 40% of the value of our adjusted totalassets on an unconsolidated basis. This requirement limits the types of businesses in which we mayengage through our subsidiaries. In addition, the assets we and our subsidiaries may acquire are limitedby the provisions of the Investment Company Act and the rules and regulations promulgated under theInvestment Company Act, which may adversely affect our performance.
If the value of securities issued by our subsidiaries that are excepted from the definition of‘‘investment company’’ by Section 3(c)(1) or 3(c)(7) of the Investment Company Act, together with any
38

other investment securities we own, exceeds 40% of our adjusted total assets on an unconsolidatedbasis, or if one or more of such subsidiaries fail to maintain an exception or exemption from theInvestment Company Act, we could, among other things, be required either (i) to substantially changethe manner in which we conduct our operations to avoid being required to register as an investmentcompany or (ii) to register as an investment company under the Investment Company Act, either ofwhich could have an adverse effect on us and the market price of our securities. If we were required toregister as an investment company under the Investment Company Act, we would become subject tosubstantial regulation with respect to our capital structure (including our ability to use leverage),management, operations, transactions with affiliated persons (as defined in the Investment CompanyAct), portfolio composition, including restrictions with respect to diversification and industryconcentration, and other matters.
The SEC recently solicited public comment on a wide range of issues relating to Section 3(c)(5)(C)of the Investment Company Act, including the nature of the assets that qualify for purposes of theexemption and whether mortgage REITs should be regulated in a manner similar to investmentcompanies. There can be no assurance that the laws and regulations governing the InvestmentCompany Act status of REITs, including the Division of Investment Management of the SEC providingmore specific or different guidance regarding these exemptions, will not change in a manner thatadversely affects our operations. If we or our subsidiaries fail to maintain an exception of exemptionfrom the Investment Company Act, we could, among other things, be required to (i) change themanner in which we conduct our operations to avoid being required to register as an investmentcompany, (ii) effect sales of our assets in a manner that, or at a time when, we would not otherwisechoose to do so, or (iii) register as an investment company (which, among other things, would requireus to comply with the leverage constraints applicable to investment companies), any of which couldnegatively affect the value of our common stock, the sustainability of our business model, and ourability to make distributions to our stockholders, which could, in turn, materially and adversely affect usand the market price of our common stock.
Rapid changes in the values of our other real estate-related investments may make it more difficult for us tomaintain our qualification as a REIT or exemption from the Investment Company Act.
If the market value or income potential of real estate-related investments declines as a result ofincreased interest rates, prepayment rates or other factors, we may need to increase our real estateinvestments and income and/or liquidate our non-qualifying assets in order to maintain our REITqualification or exemption from the Investment Company Act. If the decline in real estate asset valuesand/or income occurs quickly, this may be especially difficult to accomplish. This difficulty may beexacerbated by the illiquid nature of any non-qualifying assets that we may own. We may have to makeinvestment decisions that we otherwise would not make absent the REIT and Investment Company Actconsiderations.
Our rights and the rights of our stockholders to take action against our directors and officers are limited,which could limit your recourse in the event of actions not in your best interests.
Under Maryland law generally, a director’s actions will be upheld if he or she performs his or herduties in good faith, in a manner he or she reasonably believes to be in our best interests and with thecare that an ordinarily prudent person in a like position would use under similar circumstances. In
39

addition, our charter limits the liability of our directors and officers to us and our stockholders formoney damages, except for liability resulting from:
• actual receipt of an improper benefit or profit in money, property or services; or
• active and deliberate dishonesty by the director or officer that was established by a finaljudgment as being material to the cause of action adjudicated.
Our charter authorizes us to indemnify our directors and officers for actions taken by them inthose capacities to the maximum extent permitted by Maryland law. Our bylaws require us to indemnifyeach director or officer, to the maximum extent permitted by Maryland law, in the defense of anyproceeding to which he or she is made, or threatened to be made, a party by reason of his or herservice to us. In addition, we may be obligated to fund the defense costs incurred by our directors andofficers. As a result, we and our stockholders may have more limited rights against our directors andofficers than might otherwise exist absent the current provisions in our charter and bylaws or thatmight exist with other companies.
Our charter contains provisions that make removal of our directors difficult, which could make it difficult forour stockholders to effect changes to our management.
Our charter provides that a director may only be removed for cause upon the affirmative vote ofholders of two-thirds of the votes entitled to be cast in the election of directors. Vacancies may be filledonly by a majority of the remaining directors in office, even if less than a quorum. These requirementsmake it more difficult to change our management by removing and replacing directors and may preventa change in control of our company that is in the best interests of our stockholders.
Ownership limitations may restrict change of control or business combination opportunities in which ourstockholders might receive a premium for their shares.
In order for us to qualify as a REIT, no more than 50% in value of our outstanding capital stockmay be owned, directly or indirectly, by five or fewer individuals during the last half of any calendaryear. ‘‘Individuals’’ for this purpose include natural persons, private foundations, some employee benefitplans and trusts, and some charitable trusts. To preserve our REIT qualification, our charter generallyprohibits any person from directly or indirectly owning more than 9.8% in value or in number ofshares, whichever is more restrictive, of the outstanding shares of our capital stock or more than 9.8%in value or in number of shares, whichever is more restrictive, of the outstanding shares of ourcommon stock. This ownership limitation could have the effect of discouraging a takeover or othertransaction in which holders of our common stock might receive a premium for their shares over thethen prevailing market price or which holders might believe to be otherwise in their best interests.
Risks Related to Our Taxation as a REIT
If we do not qualify as a REIT or fail to remain qualified as a REIT, we will be subject to tax as a regularcorporation and could face a substantial tax liability, which would reduce the amount of cash available fordistribution to our stockholders.
We intend to continue to operate in a manner that will allow us to qualify as a REIT for federalincome tax purposes. We have not requested nor obtained a ruling from the Internal Revenue Service,or the IRS, as to our REIT qualification. Our qualification as a REIT depends on our satisfaction ofcertain asset, income, organizational, distribution, stockholder ownership and other requirements on acontinuing basis. Our ability to satisfy the asset tests depends upon our analysis of the characterizationand fair values of our assets, some of which are not susceptible to a precise determination, and forwhich we will not obtain independent appraisals. Our compliance with the REIT income and quarterly
40

asset requirements also depends upon our ability to successfully manage the composition of our incomeand assets on an ongoing basis. Moreover, the proper classification of an instrument as debt or equityfor federal income tax purposes may be uncertain in some circumstances, which could affect theapplication of the REIT qualification requirements as described below. Accordingly, there can be noassurance that the IRS will not contend that our interests in subsidiaries or in securities of other issuerswill not cause a violation of the REIT requirements.
If we were to fail to qualify as a REIT in any taxable year, we would be subject to federal incometax, including any applicable alternative minimum tax, on our taxable income at regular corporate rates,and dividends paid to our stockholders would not be deductible by us in computing our taxable income.Any resulting corporate tax liability could be substantial and would reduce the amount of cash availablefor distribution to our stockholders, which in turn could have an adverse impact on the value of ourcommon stock. Unless we were entitled to relief under certain Code provisions, we also would bedisqualified from taxation as a REIT for the four taxable years following the year in which we failed toqualify as a REIT.
Dividends payable by REITs do not qualify for the reduced tax rates available for some dividends.
The maximum tax rate applicable to income from ‘‘qualified dividends’’ payable to domesticstockholders that are individuals, trusts and estates is currently 20%. Dividends payable by REITs,however, generally are not eligible for the reduced rates. Although this legislation does not adverselyaffect the taxation of REITs or dividends payable by REITs, the more favorable rates applicable toregular corporate qualified dividends could cause investors who are individuals, trusts and estates toperceive investments in REITs to be relatively less attractive than investments in the stocks ofnon-REIT corporations that pay dividends, which could adversely affect the value of the stock ofREITs, including our common stock.
REIT distribution requirements could adversely affect our ability to continue to execute our business plan.
We generally must distribute annually at least 90% of our taxable income, subject to certainadjustments and excluding any net capital gain, in order for federal corporate income tax not to applyto earnings that we distribute. To the extent that we satisfy this distribution requirement, but distributeless than 100% of our taxable income, we will be subject to federal corporate income tax on ourundistributed taxable income. In addition, we will be subject to a 4% nondeductible excise tax if theactual amount that we pay out to our stockholders in a calendar year is less than a minimum amountspecified under federal tax laws. We intend to continue to make distributions to our stockholders tocomply with the REIT requirements of the Code.
From time to time, we may generate taxable income greater than our income for financialreporting purposes prepared in accordance with GAAP, or differences in timing between therecognition of taxable income and the actual receipt of cash may occur. For example, we may berequired to accrue income from mortgage loans, MBS, and other types of debt securities or interests indebt securities before we receive any payments of interest or principal on such assets. We may alsoacquire distressed debt investments that are subsequently modified by agreement with the borrower. Ifthe amendments to the outstanding debt are ‘‘significant modifications’’ under the applicable U.S.Treasury regulations, the modified debt may be considered to have been reissued to us at a gain in adebt-for-debt exchange with the borrower, with gain recognized by us to the extent that the principalamount of the modified debt exceeds our cost of purchasing it prior to modification.
We may also be required under the terms of indebtedness that we incur to use cash received frominterest payments to make principal payments on that indebtedness, with the effect of recognizingincome but not having a corresponding amount of cash available for distribution to our stockholders.
41

As a result, we may find it difficult or impossible to meet distribution requirements from ourordinary operations in certain circumstances. In particular, where we experience differences in timingbetween the recognition of taxable income and the actual receipt of cash, the requirement to distributea substantial portion of our taxable income could cause us to: (i) sell assets in adverse marketconditions, (ii) borrow on unfavorable terms, (iii) distribute amounts that would otherwise be investedin future acquisitions, capital expenditures or repayment of debt or (iv) make a taxable distribution ofour shares, as part of a distribution in which stockholders may elect to receive shares (subject to a limitmeasured as a percentage of the total distribution), in order to comply with REIT requirements. Thesealternatives could increase our costs or reduce our equity. Thus, compliance with the REITrequirements may hinder our ability to grow, which could adversely affect the value of our commonstock.
We may choose to pay dividends in our own stock possibly requiring our stockholders to pay taxes in excess ofthe cash dividends they receive.
Although we have no current intention to do so, we may in the future distribute taxable dividendspayable either in cash or shares of our stock at the election of each stockholder, but subject to alimitation on the amount of cash that may be distributed. Taxable stockholders receiving such dividendswill be required to include the full amount of the dividend, whether received as cash or shares of ourcommon stock, as ordinary income to the extent of our current and accumulated earnings and profitsfor U.S. federal income tax purposes. As a result, stockholders may be required to pay income taxeswith respect to such dividends in excess of the cash dividends received.
The stock ownership limit imposed by the Code for REITs and our charter may restrict our businesscombination opportunities.
In order for us to maintain our qualification as a REIT under the Code, not more than 50% invalue of our outstanding stock may be owned, directly or indirectly, by five or fewer individuals (asdefined in the Code to include certain entities) at any time during the last half of each taxable yearfollowing our first year. Our charter, with certain exceptions, authorizes our board of directors to takethe actions that are necessary and desirable to preserve our qualification as a REIT. Unless exemptedby our board of directors, no person may own more than 9.8% of the aggregate value of ouroutstanding capital stock. Our board may grant an exemption in its sole discretion, subject to suchconditions, representations and undertakings as it may determine. The ownership limits imposed by thetax law are based upon direct or indirect ownership by ‘‘individuals,’’ but only during the last half of atax year. The ownership limits contained in our charter key off of the ownership at any time by any‘‘person,’’ which term includes entities. These ownership limitations in our charter are common inREIT charters and are intended to provide added assurance of compliance with the tax lawrequirements, and to minimize administrative burdens. However, these ownership limits might alsodelay or prevent a transaction or a change in our control that might involve a premium price for ourcommon stock or otherwise be in the best interest of our stockholders.
Even if we remain qualified as a REIT, we may face other tax liabilities that reduce our cash flow.
Even if we remain qualified for taxation as a REIT, we may be subject to certain federal, state andlocal taxes on our income and assets, including taxes on any undistributed income, tax on income fromsome activities conducted as a result of a foreclosure, and state or local income, property and transfertaxes, such as mortgage recording taxes. In addition, in order to continue to meet the REITqualification requirements, prevent the recognition of certain types of non-cash income, or to avert theimposition of a 100% tax that applies to certain gains derived by a REIT from dealer property orinventory, we may hold some of our assets through our TRS or other subsidiary corporations that will
42

be subject to corporate-level income tax at regular rates. In addition, if we lend money to a TRS, theTRS may be unable to deduct all or a portion of the interest paid to us, which could result in an evenhigher corporate-level tax liability. Any of these taxes would decrease cash available for distribution toour stockholders.
Complying with REIT requirements may cause us to forgo otherwise attractive opportunities.
To qualify as a REIT for federal income tax purposes, we must satisfy ongoing tests concerning,among other things, the sources of our income, the nature and diversification of our assets, theamounts that we distribute to our stockholders and the ownership of our stock. We may be required tomake distributions to stockholders at disadvantageous times or when we do not have funds readilyavailable for distribution, and may be unable to pursue investments that would be otherwiseadvantageous to us in order to satisfy the source-of-income or asset-diversification requirements forqualifying as a REIT. In addition, in certain cases, the modification of a debt instrument could result inthe conversion of the instrument from a qualifying real estate asset to a wholly or partiallynon-qualifying asset that must be contributed to a TRS or disposed of in order for us to maintain ourREIT status. Compliance with the source-of-income requirements may also limit our ability to acquiredebt instruments at a discount from their face amount. Thus, compliance with the REIT requirementsmay hinder our ability to make and, in certain cases, to maintain ownership of, certain attractiveinvestments.
Complying with REIT requirements may force us to liquidate otherwise attractive investments.
To qualify as a REIT, we must ensure that at the end of each calendar quarter, at least 75% of thevalue of our assets consists of cash, cash items, government securities and qualified REIT real estateassets, including certain mortgage loans and certain kinds of MBS. The remainder of our investment insecurities (other than government securities and qualified real estate assets) generally cannot includemore than 10% of the outstanding voting securities of any one issuer or more than 10% of the totalvalue of the outstanding securities of any one issuer. In addition, in general, no more than 5% of thevalue of our assets (other than government securities and qualified real estate assets) can consist of thesecurities of any one issuer, and no more than 25% of the value of our total securities can berepresented by securities of one or more TRSs. If we fail to comply with these requirements at the endof any calendar quarter, we must correct the failure within 30 days after the end of the calendarquarter or qualify for certain statutory relief provisions to avoid losing our REIT qualification andsuffering adverse tax consequences. As a result, we may be required to liquidate from our portfoliootherwise attractive investments. These actions could have the effect of reducing our income andamounts available for distribution to our stockholders.
The failure of assets subject to repurchase agreements to qualify as real estate assets could adversely affect ourability to qualify as a REIT.
We have entered into financing arrangements that are structured as sale and repurchaseagreements pursuant to which we would nominally sell certain of our assets to a counterparty andsimultaneously enter into an agreement to repurchase these assets at a later date in exchange for apurchase price. Economically, these agreements are financings which are secured by the assets soldpursuant thereto. We believe that we would be treated for REIT asset and income test purposes as theowner of the assets that are the subject of any such sale and repurchase agreement notwithstandingthat such agreement may transfer record ownership of the assets to the counterparty during the term ofthe agreement. It is possible, however, that the IRS could assert that we did not own the assets duringthe term of the sale and repurchase agreement, in which case we could fail to qualify as a REIT.
43

We may be required to report taxable income for certain investments in excess of the economic income weultimately realize from them.
We may acquire debt instruments in the secondary market for less than their face amount. Thediscount at which such debt instruments are acquired may reflect doubts about their ultimatecollectability rather than current market interest rates. The amount of such discount will neverthelessgenerally be treated as ‘‘market discount’’ for U.S. federal income tax purposes. Accrued marketdiscount is reported as income when, and to the extent that, any payment of principal of the debtinstrument is made. Payments on residential mortgage loans are ordinarily made monthly, andconsequently accrued market discount may have to be included in income each month as if the debtinstrument were assured of ultimately being collected in full. If we collect less on the debt instrumentthan our purchase price plus the market discount we had previously reported as income, we may not beable to benefit from any offsetting loss deductions. In addition, we may acquire distressed debtinvestments that are subsequently modified by agreement with the borrower. If the amendments to theoutstanding debt are ‘‘significant modifications’’ under applicable U.S. Treasury regulations, themodified debt may be considered to have been reissued to us at a gain in a debt-for-debt exchangewith the borrower. In that event, we may be required to recognize taxable gain to the extent theprincipal amount of the modified debt exceeds our adjusted tax basis in the unmodified debt, even ifthe value of the debt or the payment expectations have not changed.
Moreover, some of the MBS that we acquire may have been issued with original issue discount.We will be required to report such original issue discount based on a constant yield method and will betaxed based on the assumption that all future projected payments due on such MBS will be made. Ifsuch MBS turns out not to be fully collectible, an offsetting loss deduction will become available only inthe later year that uncollectibility is provable.
Finally, in the event that any debt instruments or MBS acquired by us are delinquent as tomandatory principal and interest payments, or in the event payments with respect to a particular debtinstrument are not made when due, we may nonetheless be required to continue to recognize theunpaid interest as taxable income as it accrues, despite doubt as to its ultimate collectability. Similarly,we may be required to accrue interest income with respect to subordinate MBS at its stated rateregardless of whether corresponding cash payments are received or are ultimately collectible. In eachcase, while we would in general ultimately have an offsetting loss deduction available to us when suchinterest was determined to be uncollectible, the utility of that deduction could depend on our havingtaxable income in that later year or thereafter.
44

The ‘‘taxable mortgage pool’’ rules may increase the taxes that we or our stockholders may incur, and maylimit the manner in which we effect future securitizations.
Securitizations could result in the creation of taxable mortgage pools for federal income taxpurposes. As a REIT, so long as we own 100% of the equity interests in a taxable mortgage pool, wegenerally would not be adversely affected by the characterization of the securitization as a taxablemortgage pool. Certain categories of stockholders, however, such as foreign stockholders eligible fortreaty or other benefits, stockholders with net operating losses, and certain tax-exempt stockholders thatare subject to unrelated business income tax, could be subject to increased taxes on a portion of theirdividend income from us that is attributable to the taxable mortgage pool. In addition, to the extentthat our stock is owned by tax-exempt ‘‘disqualified organizations,’’ such as certain government-relatedentities and charitable remainder trusts that are not subject to tax on unrelated business income, wemay incur a corporate level tax on a portion of our income from the taxable mortgage pool. In thatcase, we may reduce the amount of our distributions to any disqualified organization whose stockownership gave rise to the tax. Moreover, we would be precluded from selling equity interests in thesesecuritizations to outside investors, or selling any debt securities issued in connection with thesesecuritizations that might be considered to be equity interests for tax purposes. These limitations mayprevent us from using certain techniques to maximize our returns from securitization transactions.
The tax on prohibited transactions will limit our ability to engage in transactions, including certain methodsof securitizing mortgage loans, which would be treated as sales for federal income tax purposes.
A REIT’s net income from prohibited transactions is subject to a 100% tax. In general, prohibitedtransactions are sales or other dispositions of property, other than foreclosure property, but includingmortgage loans, held primarily for sale to customers in the ordinary course of business. We might besubject to this tax if we were to dispose of or securitize loans in a manner that was treated as a sale ofthe loans for federal income tax purposes. Therefore, in order to avoid the prohibited transactions tax,we may choose not to engage in certain sales of loans at the REIT level, and may limit the structureswe utilize for our securitization transactions, even though the sales or structures might otherwise bebeneficial to us.
Our investments in construction loans will require us to make estimates about the fair value of landimprovements that may be challenged by the IRS.
We may invest in construction loans, the interest from which will be qualifying income for purposesof the REIT income tests, provided that the loan value of the real property securing the constructionloan is equal to or greater than the highest outstanding principal amount of the construction loanduring any taxable year. For purposes of construction loans, the loan value of the real property is thefair value of the land plus the reasonably estimated cost of the improvements or developments (otherthan personal property) that will secure the loan and that are to be constructed from the proceeds ofthe loan. There can be no assurance that the IRS would not challenge our estimate of the loan value ofthe real property.
The failure of a mezzanine loan to qualify as a real estate asset could adversely affect our ability to qualify asa REIT.
We invest in mezzanine loans, for which the IRS has provided a safe harbor but not rules ofsubstantive law. Pursuant to the safe harbor, if a mezzanine loan meets certain requirements, it will betreated by the IRS as a real estate asset for purposes of the REIT asset tests, and interest derived fromthe mezzanine loan will be treated as qualifying mortgage interest for purposes of the REIT 75%income test. We may acquire mezzanine loans that do not meet all of the requirements of this safeharbor. In the event we own a mezzanine loan that does not meet the safe harbor, the IRS could
45

challenge such loan’s treatment as a real estate asset for purposes of the REIT asset and income testsand, if such a challenge were sustained, we could fail to qualify as a REIT.
Liquidation of assets may jeopardize our REIT qualification.
To qualify as a REIT, we must comply with requirements regarding our assets and our sources ofincome. If we are compelled to liquidate our investments to repay obligations to our lenders, we maybe unable to comply with these requirements, ultimately jeopardizing our qualification as a REIT, or wemay be subject to a 100% tax on any resultant gain if we sell assets that are treated as dealer propertyor inventory.
Complying with REIT requirements may limit our ability to hedge effectively and may cause us to incur taxliabilities.
The REIT provisions of the Code substantially limit our ability to hedge our liabilities. Any incomefrom a hedging transaction we enter into to manage risk of interest rate changes with respect toborrowings made or to be made to acquire or carry real estate assets does not constitute ‘‘grossincome’’ for purposes of the 75% or 95% gross income tests. To the extent that we enter into othertypes of hedging transactions, the income from those transactions is likely to be treated asnon-qualifying income for purposes of both of the gross income tests. As a result of these rules, weintend to limit our use of advantageous hedging techniques or implement those hedges through adomestic TRS. This could increase the cost of our hedging activities because our TRS would be subjectto tax on gains or expose us to greater risks associated with changes in interest rates than we wouldotherwise want to bear. In addition, losses in our TRS will generally not provide any tax benefit, exceptfor being carried forward against future taxable income in the TRS.
Qualifying as a REIT involves highly technical and complex provisions of the Code.
Qualification as a REIT involves the application of highly technical and complex Code provisionsfor which only limited judicial and administrative authorities exist. Even a technical or inadvertentviolation could jeopardize our REIT qualification. Our qualification as a REIT will depend on oursatisfaction of certain asset, income, organizational, distribution, stockholder ownership and otherrequirements on a continuing basis. In addition, our ability to satisfy the requirements to qualify as aREIT depends in part on the actions of third parties over which we have no control or only limitedinfluence, including in cases where we own an equity interest in an entity that is classified as apartnership for U.S. federal income tax purposes.
Risks Related to LNR’s Business and the Company’s Pending Acquisition of LNR
The acquisition of LNR, and particularly its special servicing business, potentially exposes us to risks that wedo not face in our current business.
LNR derives a substantial portion of its cash flows from the special servicing of pools ofcommercial mortgage loans. As special servicer, LNR typically receives fees based upon the outstandingbalance of the loans which are being specially serviced by LNR. We anticipate that the balance of loansin special servicing where LNR acts as special servicer will decline significantly over the next severalyears and that LNR’s servicing fees will likewise decline materially. The special servicing industry ishighly competitive, and LNR’s inability to compete successfully with other firms to maintain its existingservicing portfolio and obtain future servicing opportunities could have a material and adverse impacton LNR’s future cash flows and results of operations, which, in turn, could adversely affect our resultsof operations if the special servicing portfolio declines more than we projected in our underwriting ofthe acquisition. Because the right to appoint the special servicer for securitized mortgage loansgenerally resides with the holder of the ‘‘controlling class’’ position in the relevant trust and may
46
migrate to holders of different classes of securities as additional losses are realized, LNR’s ability tomaintain its existing servicing rights and obtain future servicing opportunities may require, in manycases, the acquisition of additional CMBS securities. Accordingly, LNR’s ability to compete effectivelymay depend, in part, on the availability of additional debt or equity capital to fund these purchases.Additionally, LNR’s existing servicing portfolio is subject to ‘‘run off,’’ meaning that mortgage loansserviced by it may be prepaid prior to maturity, refinanced with a mortgage not serviced by LNR orliquidated through foreclosure, deed-in-lieu of foreclosure or other liquidation processes or repaidthrough standard amortization of principal, resulting in lower servicing fees and/or lower returns on thesubordinated securities owned by LNR. Improving economic conditions and property prices, anddeclines in interest rates and greater availability of mortgage financing, can reduce the incidence ofassets going into special servicing and reduce LNR’s revenues from special servicing, including as aresult of lower fees under new arrangements. The fair value of LNR’s servicing rights may decreaseunder the foregoing circumstances, resulting in losses to us.
LNR’s conduit operations are subject to volatile market conditions and significant competition. Inaddition, the conduit business may suffer losses as a result of ineffective or inadequate hedges andcredit issues.
LNR’s businesses outside of the United States subject it to currency risks. Most of LNR Europe’sinvestments and liabilities are denominated in currencies other than U.S. dollars. LNR generally doesnot hedge currency risk. As a result, unfavorable changes in exchange rates could result in lossesindependent of the performance of the underlying business.
Upon the consummation of the LNR acquisition, the Company will be operating a special servicer businesswhich has certain unique risks.
In connection with the servicing of specially serviced mortgage loans, a special servicer may, at thedirection of the directing certificateholder, generally take actions with respect to the specially servicedmortgage loans that could adversely affect the holders of some or all of the more senior classes ofCMBS. We may hold subordinated CMBS and we may or may not be the directing holder in anyCMBS transaction in which LNR also acts as special servicer. We may have conflicts of interest inexercising LNR’s rights as holder of subordinated classes of CMBS and in owning the entity that alsoacts as the special servicer for such transactions. It is possible that LNR, acting as the directingcertificateholder for a CMBS transaction, may direct special servicer actions that conflict with theinterests of certain other classes of the CMBS issued in that transaction. The special servicer is notpermitted to take actions that are prohibited by law or that violate the servicing standard or the termsof the applicable CMBS documentation or the applicable mortgage loan documentation and LNR issubject to the risk of claims asserted by mortgage loan borrowers and the holders of other classes ofCMBS that it has violated applicable law or, if applicable, the servicing standard and its otherobligations under such CMBS documentation or mortgage loan documentation as a result of actions itmay take.
We may not realize all of the anticipated benefits of the LNR acquisition or such benefits may take longer torealize than expected.
The success of the LNR acquisition will depend, in part, on our ability to realize the anticipatedbenefits from successfully integrating LNR’s business with ours. The combination of two independentcompanies is a complex, costly and time-consuming process. As a result, we will be required to devotesignificant management attention and resources to integrating the business practices and operations ofLNR. The integration process may disrupt our business and, if implemented ineffectively, couldpreclude us from realizing all of the potential benefits we expect to realize with respect to theacquisition. Our failure to meet the challenges involved in integrating successfully our operations andLNR’s operations or otherwise to realize the anticipated benefits of the transaction could cause an
47
interruption of, or a loss of momentum in, our business and could seriously harm our results ofoperations. In addition, the overall integration of the two companies may result in materialunanticipated problems, expenses, liabilities, competitive responses, loss of business relationships anddiversion of management’s attention, and may cause our stock price to decline.
In addition, even if our operations and LNR’s are integrated successfully, we may not realize thefull benefits of the acquisition within the anticipated time frame, or at all.
LNR’s business is subject to an evolving regulatory environment that may affect certain aspects of its currentbusiness.
The pools of commercial loans in which LNR acquires subordinated securities and for which it actsas special servicer are structures commonly referred to as securitizations. As a result of the dislocationof the credit markets, the securitization industry has crafted and continues to craft proposed changes tosecuritization practices, including proposed new standard representations and warranties, underwritingguidelines and disclosure guidelines. In addition, the securitization industry is becoming far moreregulated. For example, pursuant to the Dodd-Frank Wall Street Reform and Consumer Protection Act(‘‘the Dodd-Frank Act’’) various federal agencies are in the process of promulgating regulations withrespect to various issues that affect securitizations, including (1) a requirement under the Dodd-FrankAct that issuers in securitizations retain 5% of the risk associated with the securities, (2) requirementsfor additional disclosure, (3) requirements for additional review and reporting and (4) a possiblerequirement that a portion of potential profit that would be realized on the securitization must bedeposited in a reserve account and used as additional credit support for the related commercialmortgage backed securities until the loans are repaid. The regulations ultimately adopted will takeeffect over the next few years, with the risk-retention regulations primarily taking effect in 2013.Certain proposed regulations, if adopted, could alter the structure of securitizations in the future andcould pose additional risks to our participation in future securitizations or could reduce or eliminatethe economic incentives of participating in future securitizations.
If financing for the acquisition of LNR becomes unavailable, we may be forced to liquidate other assets to payfor the acquisition or may be unable to close the acquisition.
We intend to finance a portion of the purchase price for the LNR acquisition with equity or debtfinancing. In connection with entering into the purchase agreement, we entered into a debtcommitment letter with Credit Suisse Securities (USA) LLC, Credit Suisse AG and Citigroup GlobalMarkets Inc. providing for a senior secured bridge facility in an aggregate amount of up to$300 million. There are a number of conditions in the debt commitment letter that must be satisfied orwaived in order for closing of the debt financing to occur, and there is a risk these conditions will notbe satisfied. In the event that the financing contemplated by the debt commitment letter or othersuitable equity or debt financing is not available to us, we may be required to obtain alternativefinancing on terms that are less favorable to us than those in the debt commitment letter. If otherfinancing becomes necessary and we are unable to secure such other financing on acceptable terms, wemay be forced to liquidate other assets in order to pay the purchase price of the acquisition, whichcould have an adverse effect on our results of operations and financial condition, or we may be unableto close the acquisition at all.
48
Failure to complete the acquisition of LNR could negatively impact our stock price and future business andfinancial results.
If the acquisition of LNR is not completed, we may be adversely affected and we will be subject toseveral risks and consequences, including the following:
• following the execution of the purchase agreement, we paid a $50 million deposit and, if theclosing has not occurred by April 1, 2013, we will be required to pay an additional $25 milliondeposit and an interest charge will accrue on the amount of the purchase price that we pay forthe acquisition. To the extent the transaction is not completed due to an uncured breach of thepurchase agreement by us, we will not recover any deposits or interest paid with respect to thetransaction;
• we will be required to pay certain costs relating to the acquisition, whether or not the acquisitionis completed, such as legal, accounting and financial advisor fees; and
• matters relating to the acquisition may require substantial commitments of time and resources byour management team, which could otherwise have been devoted to other opportunities thatmay have been beneficial to us.
In addition, if the acquisition is not completed, we may experience negative reactions from thefinancial markets and from our employees. We also could be subject in some circumstances tostockholder or other litigation relating to the failure to complete the acquisition, as well as proceedingsby the sellers to seek specific performance of our obligations under the purchase agreement or torecover damages for any breach by us of the purchase agreement.
We anticipate that we will acquire ‘‘taxable mortgage pools’’ in the acquisition of LNR, which may increasethe taxes that we or our stockholders incur.
We anticipate that we will acquire the equity interests in certain taxable mortgage pools in theacquisition of LNR. Certain categories of stockholders, such as foreign stockholders eligible for treatyor other benefits, stockholders with net operating losses, and certain tax-exempt stockholders that aresubject to unrelated business income tax, could be subject to increased taxes on a portion of theirdividend income from us that is attributable to such taxable mortgage pools. In addition, to the extentthat our stock is owned by tax-exempt ‘‘disqualified organizations,’’ such as certain government-relatedentities and charitable remainder trusts that are not subject to tax on unrelated business income, wemay incur a corporate level tax on a portion of our income from such taxable mortgage pools. In thatcase, we may reduce the amount of our distributions to any disqualified organization whose stockownership gave rise to the tax.
We anticipate that many of the assets that we acquire in the acquisition of LNR will be acquired by, or will beownership interests in, entities subject to entity level or foreign taxes, which cannot be passed through to, orused by, our stockholders to reduce taxes they owe.
We anticipate that most of the assets that we acquire in the acquisition of LNR will be heldthrough a taxable REIT subsidiary, or a TRS, which will be subject to entity level taxes on income thatit earns. We anticipate such taxes to materially increase the taxes paid by our TRSs. In addition, weanticipate that certain of the assets that we acquire in the acquisition of LNR will include entitiesorganized or assets located in foreign jurisdictions. Taxes that we or such entities pay in foreignjurisdictions may not be passed through to, or used by, our stockholders as a foreign tax credit orotherwise.
49

We may bear the costs of certain pre-closing taxes.
The acquisition of LNR will involve the purchase of the LNR companies, a significant portion ofwhich were historically C corporations for federal income tax purposes, some of which are currentlyunder audit by the Internal Revenue Service. While the sellers of LNR have generally agreed to pay(or indemnify us) for any pre-closing tax liabilities, such indemnity obligations are generally limited tothe amount of the purchase price for LNR and, in certain situations, limited to certain maximumamounts with respect to certain LNR entities, as agreed upon by the sellers and us. Furthermore,because any such pre-existing tax liabilities may not be assessed by the federal or state taxingauthorities, or may not be settled with such taxing authorities, prior to the release of the escrowedfunds to the sellers, there can be no assurance that we will be able to enforce payment orindemnification by the sellers of or with respect to any such pre-closing tax liabilities. While thesponsors of the sellers are providing a limited guarantee on certain pre-closing tax liabilities, suchguarantee is limited to certain specified entities and certain specified amounts, as agreed to between us,the sellers and such sponsors. Accordingly, such LNR companies may become liable for pre-closingtaxes, which pre-closing taxes may, in the event of an inability to enforce the indemnity or in the eventof a tax liability in excess of the agreed upon caps on such liabilities, be borne by us.
Our financial statement presentation will change materially as a result of our acquisition of LNR as we willconsolidate the assets and liabilities of CMBS pools in which LNR owns the controlling class of subordinatedsecurities and is considered the ‘‘primary beneficiary.’’
Upon our acquisition of LNR, we will be required to consolidate the assets and liabilities ofcertain CMBS pools in which LNR owns the controlling class of subordinated securities into ourfinancial statements, even though the value of the subordinated securities may represent a smallinterest relative to the size of the pool. Under GAAP, companies are required to consolidate variableinterest entities (‘‘VIEs’’) in which they are determined to be the primary beneficiary. A VIE must beconsolidated only by its primary beneficiary, which is defined as the party who, along with its affiliatesand agents, has a potentially significant interest in the entity and controls the entity’s significantdecisions. As a result of the foregoing, our financial statements may be more complex and moredifficult to understand than if we did not consolidate the CMBS pools.
Recent dislocations, illiquidity and volatility in the market for commercial real estate as well as the broaderfinancial markets have and may continue to adversely affect the performance and value of commercialmortgage loans, the demand for CMBS and the value of CMBS investments.
In recent years, the real estate and securitization markets, as well as global financial markets andthe economy generally, have experienced significant dislocations, illiquidity and volatility. While theUnited States economy may technically be out of the recession, any recovery could be fragile and maynot be sustainable for any specific period of time. In particular, the pace of progress, or the lack ofprogress, of federal deficit reduction talks in the United States may cause continued volatility.Furthermore, many state and local governments in the United States are experiencing, and areexpected to continue to experience, severe budgetary constraints. Recently enacted financial reformlegislation in the United States could also adversely affect the availability of credit for commercial realestate. Further, the global financial markets have recently experienced increased volatility due touncertainty surrounding the level and sustainability of the sovereign debt of various countries. Wecannot assure you that dislocations in the commercial mortgage loan market will not continue to occuror become more severe.
The downturn in the general economy has affected the financial strength of many commercial,multi-family and other tenants and has resulted in increased rent delinquencies and decreasedoccupancy. Any continued downturn may lead to decreased occupancy, decreased rents or other
50

declines in income from, or the value of, commercial, multi-family and manufactured housingcommunity real estate.
Declining commercial real estate values caused by the economic downturn, coupled withdiminished availability of leverage and/or refinancing opportunities for commercial mortgage loans andthe tightening by commercial real estate lenders of underwriting standards, have prevented manycommercial borrowers from refinancing their mortgages, which has resulted in increased delinquenciesand defaults on commercial, multi-family and other mortgage loans. Declines in commercial real estatevalues have also resulted in reduced borrower equity, further hindering borrowers’ ability to refinancein an environment of increasingly restrictive lending standards and giving them less incentive to curedelinquencies and avoid foreclosure. The lack of refinancing opportunities has impacted and isexpected to continue to impact, in particular, mortgage loans that do not fully amortize and on whichthere is a substantial balloon payment due at maturity, because borrowers generally expect to refinancethese types of loans on or prior to their maturity date. There is a substantial amount of U.S. mortgageloans with balloon payment obligations in excess of their respective current property values that arematuring over the coming three years. Finally, declining commercial real estate values and theassociated increases in loan-to-value ratios result in lower recoveries on foreclosure and an increase inlosses above those that would have been realized had commercial property values remained the sameor continued to increase. Continuing defaults, delinquencies and losses will further decrease propertyvalues, thereby resulting in additional defaults by commercial mortgage borrowers, further creditconstraints and further declines in property values.
In addition to credit factors directly affecting CMBS, the continuing fallout from a downturn in theRMBS market and markets for other asset-backed and structured products has also affected the CMBSmarket by contributing to a decline in the market value and liquidity of securitized investments such asCMBS, even if such CMBS are performing as expected. All of these factors may impact the demandfor CMBS and the value of CMBS investments, especially subordinated classes of CMBS.
LNR’s business includes investment in subordinated CMBS. The risks of investment in CMBS are magnifiedin LNR’s case, where the principal payments received by the CMBS trust are made in priority to the higherrated securities.
CMBS are subject to the various risks which relate to the pool of underlying commercial mortgageloans and any other assets in which the CMBS represents an interest. In addition, CMBS are subject toadditional risks arising from the geographic, property type and other types of concentrations in the poolof underlying commercial mortgage loans which magnify the risks associated with a particulargeographic region, property type or other loan characteristic. In the event of defaults on the mortgagesin the CMBS trusts, LNR will bear a risk of loss on its related CMBS to the extent of deficienciesbetween the value of the collateral and the principal, accrued interest and unpaid fees and expenses onthe mortgage loans, which may be offset to some extent by the special servicing fees received by LNRon those mortgage loans. The yield to maturity on the CMBS will depend largely upon the price paidfor the CMBS, which are generally sold at a discount at issuance and trade at even steeper discounts inthe secondary markets. Further, the yield to maturity on CMBS will depend, in significant part, uponthe rate and timing of principal payments on the underlying mortgage loans, including both voluntaryprepayments, if permitted, and involuntary prepayments, such as prepayments resulting from casualty orcondemnation, defaults and liquidations or repurchases upon breaches of representations andwarranties or document defects. Any changes in the weighted average lives of CMBS may adverselyaffect yield on the CMBS. Prepayments resulting in a shortening of weighted average lives of CMBSmay be made at a time of low interest rates when we may be unable to reinvest the resulting paymentof principal on the CMBS at a rate comparable to that being earned on the CMBS, while delays andextensions resulting in a lengthening of those weighted average lives may occur at a time of highinterest rates when we may have been able to reinvest scheduled principal payments at higher rates.
51

The exercise of remedies and successful realization of liquidation proceeds relating to commercialmortgage loans underlying CMBS may be highly dependent on the performance of LNR as specialservicer. LNR attempts to underwrite investments on a ‘‘loss-adjusted’’ basis, which projects a certainlevel of performance. However, there can be no assurance that this underwriting will accurately predictthe timing or magnitude of such losses. To the extent that this underwriting has incorrectly anticipatedthe timing or magnitude of losses, our business may be adversely affected. Some of the mortgage loansunderlying the CMBS are already in default and additional loans may default in the future. In the caseof such defaults, cash flows of CMBS investments held by LNR may be adversely affected as anyreduction in the mortgage payments or principal losses on liquidation of any mortgage loan may beapplied to the class of CMBS securities relating to such defaulted loans that LNR holds.
The market value of CMBS could fluctuate materially as a result of various risks that are out of our controland may result in significant losses.
The market value of CMBS investments could fluctuate materially over time as the result ofchanges in mortgage spreads, treasury bond interest rates, capital market supply and demand factors,and many other factors that affect high-yield fixed income products. These factors are out of ourcontrol and could impair LNR’s ability to obtain short-term financing on the CMBS. CMBSinvestments, especially subordinated classes of CMBS, may have no, or only a limited, trading market.The financial markets in the past have experienced and could in the future experience a period ofvolatility and reduced liquidity which may reoccur or continue and reduce the market value of CMBS.Some or all of the CMBS, especially subordinated classes of CMBS, may be subject to restrictions ontransfer and may be considered illiquid.
Item 1B. Unresolved Staff Comments.
None.
Item 2. Properties.
The Company’s headquarters are located in Greenwich, Connecticut at 591 West Putnam Avenuein office space leased by our Manager.
Item 3. Legal Proceedings.
Currently, no legal proceedings are pending, threatened or, to our knowledge, contemplatedagainst us.
Item 4. Mine Safety Disclosures.
Not applicable.
52

PART II
Item 5. Market for Registrant’s Common Equity, Related Stockholder Matters and Issuer Purchasesof Equity Securities.
Market Information and Dividends
The Company’s common stock has been listed on the New York Stock Exchange (the ‘‘NYSE’’)and is traded under the symbol ‘‘STWD’’ since its initial public offering in August 2009. The followingtable below sets forth the quarterly high and low prices for our common stock as reported by theNYSE, and dividends made by the Company to holders of the Company’s common stock for eachquarter for the years ended December 31, 2012 and 2011.
2012 High Low Dividend
First quarter . . . . . . . . . . . . . . . . . . . . . . . . . . . . . . . . . $21.79 $18.46 $0.44(1)Second quarter . . . . . . . . . . . . . . . . . . . . . . . . . . . . . . . $21.42 $19.40 $0.44(2)Third quarter . . . . . . . . . . . . . . . . . . . . . . . . . . . . . . . . $24.56 $21.09 $0.44(3)Fourth quarter . . . . . . . . . . . . . . . . . . . . . . . . . . . . . . . $23.96 $21.09 $0.54(4)
2011 High Low Dividend
First quarter . . . . . . . . . . . . . . . . . . . . . . . . . . . . . . . . . $23.67 $21.12 $0.42(5)Second quarter . . . . . . . . . . . . . . . . . . . . . . . . . . . . . . . $22.95 $19.82 $0.44(6)Third quarter . . . . . . . . . . . . . . . . . . . . . . . . . . . . . . . . $21.25 $16.58 $0.44(7)Fourth quarter . . . . . . . . . . . . . . . . . . . . . . . . . . . . . . . $19.32 $15.89 $0.44(8)
(1) Our board of directors declared a dividend to stockholders of record on March 30, 2012which was paid on April 13, 2012.
(2) Our board of directors declared a dividend to stockholders of record on June 29, 2012,which was paid on July 13, 2012.
(3) Our board of directors declared a dividend to stockholders of record on September 28,2012, which was paid on October 15, 2012.
(4) Our board of directors declared a dividend to stockholders of record on December 31,2012, which was paid on January 15, 2013. This includes the extraordinary dividend of$0.10 per share of common stock declared on December 13, 2012.
(5) Our board of directors declared a dividend to stockholders of record on March 31, 2011which was paid on April 15, 2011.
(6) Our board of directors declared a dividend to stockholders of record on June 30, 2011,which was paid on July 15, 2011.
(7) Our board of directors declared a dividend to stockholders of record on September 30,2011, which was paid on October 14, 2011.
(8) Our board of directors declared a dividend to stockholders of record on December 31,2011, which was paid on January 13, 2012.
On February 27, 2013, our board of directors declared a dividend of $0.44 per share for the periodended March 31, 2013, which dividend is payable on April 15, 2013 to common stockholders of recordas of March 29, 2013.
On February 25, 2013, the closing sale price of the common stock, as reported by the NYSE was$25.98 per share.
We intend to make regular quarterly distributions to holders of our common stock and distributionequivalents to holders of restricted stock units which are settled in shares of common stock. U.S.federal income tax law generally requires that a REIT distribute annually at least 90% of its REITtaxable income, without regard to the deduction for dividends paid and excluding net capital gains, andthat it pay tax at regular corporate rates to the extent that it annually distributes less than 100% of itsnet taxable income. We generally intend over time to pay quarterly distributions in an amount equal toour taxable income.
53

20FEB201305263531
Holders
As of February 26, 2013, there were eighteen holders of record of the Company’s 136,125,356shares of common stock issued and 135,499,506 shares of common stock outstanding. The fourteenholders of record include Cede & Co., which holds shares as nominee for The Depository TrustCompany which itself holds shares on behalf of the beneficial owners of our common stock.
Securities Authorized for Issuance Under Equity Compensation Plans
The information required by this item is set forth under Item 12 of this Annual Report onForm 10-K and is incorporated herein by reference.
Stock Performance Graph
CUMULATIVE TOTAL RETURNBased upon initial investment of $100 on August 11, 2009(1)
150.00
140.00
130.00
120.00
110.00
100.00
90.00
80.00
6/30
/200
9
9/30
/200
9
12/3
1/20
09
3/31
/201
0
6/30
/201
0
9/30
/201
0
12/3
1/20
10
3/31
/201
1
6/30
/201
1
9/30
/201
1
12/3
1/20
11
3/31
/201
2
6/30
/201
2
9/30
/201
2
12/3
1/20
12
Starwood Property Trust, Inc S&P © 500 Bloomberg REIT Mortgage Index
StarwoodProperty Bloomberg REIT
Trust S&P � 500 Mortgage Index
8/11/09 . . . . . . . . . . . . . . . . . . . . . . . . . . 100.00 100.00 100.009/30/09 . . . . . . . . . . . . . . . . . . . . . . . . . . 101.30 106.31 107.6012/31/09 . . . . . . . . . . . . . . . . . . . . . . . . . 95.00 112.14 101.073/31/10 . . . . . . . . . . . . . . . . . . . . . . . . . . 98.17 117.61 102.236/30/10 . . . . . . . . . . . . . . . . . . . . . . . . . . 87.49 103.66 99.949/31/10 . . . . . . . . . . . . . . . . . . . . . . . . . . 104.26 114.77 103.0912/31/10 . . . . . . . . . . . . . . . . . . . . . . . . . 114.80 126.48 110.273/31/11 . . . . . . . . . . . . . . . . . . . . . . . . . . 121.43 133.34 109.826/30/11 . . . . . . . . . . . . . . . . . . . . . . . . . . 114.07 132.81 108.589/30/11 . . . . . . . . . . . . . . . . . . . . . . . . . . 97.88 113.78 94.7512/31/11 . . . . . . . . . . . . . . . . . . . . . . . . . 108.80 126.47 94.393/31/12 . . . . . . . . . . . . . . . . . . . . . . . . . . 125.29 141.65 99.886/30/12 . . . . . . . . . . . . . . . . . . . . . . . . . . 129.64 136.99 104.369/30/12 . . . . . . . . . . . . . . . . . . . . . . . . . . 144.24 144.89 109.9112/31/12 . . . . . . . . . . . . . . . . . . . . . . . . . 145.66 143.43 98.52
(1) Dividend reinvestment is assumed at quarter end.
54

Issuer Purchases of Equity Securities
Total number ofshares purchased as
Total number part of publicly Expired portionof shares Average price announced plans of programpurchased paid per share or programs ($000’s omitted)
October 1, 2011 to October 31, 2011 . . . . . . . 283,850 $16.42 283,850 $89,358(1)November 1, 2011 to November 30, 2011 . . . . — — — 89,358(1)
December 1, 2011 to December 31, 2011 . . . . — — — 89,358(1)
Total . . . . . . . . . . . . . . . . . . . . . . . . . . . . . . 283,850 $16.42 283,850 $89,358(1)
(1) Pursuant to the $100 million stock repurchase program authorized and announced by our board ofdirectors in August 2011, the Company repurchased a total of 342,000 shares for a total of$6.0 million in August 2011. The share repurchase program expired in August 2012.
A $50 million stock repurchase program authorized and announced by our board of directors inJune 2010 for a period of one year expired in June 2011. No stock was repurchased under this programprior to expiration. There were no unregistered sales of securities during the year ended December 31,2012.
Item 6. Selected Financial Data.
The following selected financial data should be read in conjunction with Item 7—’’Management’sDiscussion and Analysis of Financial Condition and Results of Operations,’’ and our consolidatedfinancial statements, including the notes thereto, included elsewhere herein. All amounts are inthousands, except share and per share data.
For the PeriodFor the Year For the Year For the Year from Inception
Ended Ended Ended throughDecember 31, December 31, December 31, December 31,
2012 2011 2010 2009
Operating Data:Interest income . . . . . . . . . . . . . . . . . . . . . . . . $ 306,980 $ 204,973 $ 93,524 $ 6,927Interest expense . . . . . . . . . . . . . . . . . . . . . . . . (47,125) (28,782) (15,788) (1,904)Net interest margin . . . . . . . . . . . . . . . . . . . . . . 259,855 176,191 77,736 5,023Total operating expenses . . . . . . . . . . . . . . . . . . (75,393) (50,920) (30,052) (9,286)Net income . . . . . . . . . . . . . . . . . . . . . . . . . . . 203,682 120,608 58,842 (2,580)Net income attributable to Starwood Property
Trust, Inc. . . . . . . . . . . . . . . . . . . . . . . . . . . 201,195 119,377 57,046 (3,017)Net income per share of common stock:
Basic . . . . . . . . . . . . . . . . . . . . . . . . . . . . . . $ 1.76 $ 1.38 $ 1.16 (0.06)Diluted . . . . . . . . . . . . . . . . . . . . . . . . . . . . $ 1.76 $ 1.38 $ 1.14 (0.06)
Dividends declared per share of common stock . . $ 1.86 $ 1.74 $ 1.20 0.11Weighted-average shares of common stock
outstanding:Basic . . . . . . . . . . . . . . . . . . . . . . . . . . . . . . 113,721,070 84,974,604 49,138,720 47,575,634Diluted . . . . . . . . . . . . . . . . . . . . . . . . . . . . 114,663,183 86,409,327 50,021,824 47,575,634
Balance Sheet Data:Investments in securities . . . . . . . . . . . . . . . . . . $ 862,587 $ 341,734 $ 397,680 $ 245,896Investments in loans . . . . . . . . . . . . . . . . . . . . . 3,000,335 2,447,508 1,425,243 214,521Total assets . . . . . . . . . . . . . . . . . . . . . . . . . . . 4,324,373 2,997,447 2,101,405 1,108,786Total financing arrangements . . . . . . . . . . . . . . . 1,393,705 1,156,716 633,745 171,394Total liabilities . . . . . . . . . . . . . . . . . . . . . . . . . 1,527,168 1,232,300 764,176 212,751Total Starwood Property Trust, Inc. Stockholders’
Equity . . . . . . . . . . . . . . . . . . . . . . . . . . . . . 2,719,346 1,759,488 1,327,560 887,967Total Equity . . . . . . . . . . . . . . . . . . . . . . . . . . . 2,797,205 1,765,147 1,337,229 896,035
55

Item 7. Management’s Discussion and Analysis of Financial Condition and Results of Operations.
Overview
Starwood Property Trust, Inc. (together with its subsidiaries, ‘‘we’’ or the ‘‘Company’’) is aMaryland corporation that commenced operations on August 17, 2009 (‘‘Inception’’) upon thecompletion of its initial public offering (‘‘IPO’’). We are focused on originating, investing in, financingand managing commercial mortgage loans and other commercial real estate debt investments,commercial mortgage-backed securities (‘‘CMBS’’), and other commercial real estate-related debtinvestments. We collectively refer to commercial mortgage loans, other commercial real estate debtinvestments, CMBS, and other commercial real estate-related debt investments as our target assets. Wealso invest in residential mortgage-backed securities (‘‘RMBS’’) and residential REO, and may invest indistressed or non-performing loans, commercial properties subject to net leases and residentialmortgage loans. As market conditions change over time, we may adjust our strategy to take advantageof changes in interest rates and credit spreads as well as economic and credit conditions.
Our objective is to provide attractive risk-adjusted global returns to our investors over the longterm, primarily through dividends and secondarily through capital appreciation. We employ leverage, tothe extent available, to fund the acquisition of our target assets and to increase potential returns to ourstockholders. In order to achieve these objectives, we are focusing on asset selection and the relativevalue of various sectors within the debt market to construct a diversified investment portfolio designedto produce attractive returns across a variety of market conditions and economic cycles. We areorganized as a holding company that conducts its business primarily through its various subsidiaries.
Since the closing of our initial public offering in August 2009, we have focused primarily onopportunities that exist in the U.S. commercial mortgage loan, commercial real estate debt, CMBS andRMBS markets, and residential REO. As market conditions change over time, we may adjust ourstrategy to take advantage of changes in interest rates and credit spreads as well as economic andcredit conditions. We believe that the diversification of our portfolio of assets, our expertise among thetarget asset classes, and the flexibility of our strategy will position us to generate attractive risk-adjustedreturns for our stockholders in a variety of assets and market conditions.
On January 23, 2013, we entered into a Unit Purchase Agreement with LNR, AozoraInvestments LLC, CBR I LLC, iStar Marlin LLC, Opps VIIb LProp, L.P., and VNO LNRHoldco LLC, pursuant to which the Company agreed to acquire all the outstanding equity interests ofLNR. LNR is a diversified real estate investment, management, finance and development companywhose principal line of business is serving as a special servicer for CMBS transactions. The acquisitionof LNR has not yet closed, and accordingly this Annual Report on Form 10-K and the consolidatedfinancial statements included herein do not reflect the results of LNR’s business.
We have elected to be taxed as a REIT for U.S. federal income tax purposes, commencing withour initial taxable year ended December 31, 2009. We also operate our business in a manner that willpermit us to maintain our exemption from registration under the 1940 Act.
Recent Developments
Three months ended March 31, 2012
• Sold 50% of our Euro-denominated loan to a strategic partner, which resulted in proceeds of$28.8 million and a realized loss of $2.1 million. However, the transactions were earnings neutralafter considering the realized gains on currency hedges of $2.1 million that were terminated inconnection with the sale.
• Acquired $95.4 million of GBP-denominated B-Notes secured by four resorts in the UnitedKingdom. The newly issued B-Notes are part of an overall corporate refinancing in which wehad a $143.9 million pre-existing GBP-denominated investment. The pre-existing investment was
56

originally purchased at a discount and, due to the early prepayment; we recognized additionalincome of approximately $12.2 million during the first quarter of 2012, which is considered to bea non-recurring event.
• Acquired $222.8 million of CMBS at a discounted price of $206.4 million, where the obligors arecertain special purpose entities that were formed to hold substantially all of the assets of aworldwide operator of hotels, resorts and timeshare properties. The acquisition was financedusing a new $155.4 million facility provided by the seller.
• Originated a $40.0 million mezzanine loan secured by a 10-property portfolio of full-service andextended-stay hotels located in eight different states.
• Our subsidiary extended the maturity date of its $100 million master repurchase and securitiescontract with an affiliate of Wells Fargo Securities, LLC used to finance the acquisition andownership of RMBS, from March 16, 2012 to March 15, 2013. Advances under the facilityaccrue interest at a per annum interest rate equal to the sum of (i) 30-day LIBOR plus (ii) amargin of 2.10%. We have guaranteed the obligations of our subsidiary under the facility. Thefacility and related guarantee contain various affirmative and negative covenants applicable to usthat are similar in nature to covenants contained in our other financing agreements.
• Acquired a $125.0 million participation in a senior loan secured by all the material assets of aworldwide operator of hotels, resorts and timeshare properties for a discounted purchase priceof approximately $115.7 million. The acquisition was financed with an $81.0 million increase in afinancing facility previously provided by the seller.
• We, through certain of our subsidiaries, entered into a new $125.0 million financing facility withan affiliate of Citigroup Global Markets Inc., to finance commercial mortgage loans and seniorinterests in commercial mortgage loans originated or acquired by us and including loans andinterests intended to be included in commercial mortgage loan securitizations as well as thosenot intended to be securitized. Advances under the facility accrue interest at a per annuminterest rate equal to the sum of (i) 30-day LIBOR plus (ii) a margin of between 1.75% and3.75% depending on (A) asset type, (B) the amount advanced and (C) the debt yield andloan-to-value ratios of the purchased mortgage loan. The facility has an initial maturity date ofMarch 29, 2014, subject to three one-year extension options, which may be exercised by us uponthe satisfaction of certain conditions. We have guaranteed the obligations of our subsidiariesunder the facility up to a maximum liability of 25% of the then-currently outstanding repurchaseprice of assets financed there under. The facility and related guarantee contain variousaffirmative and negative covenants applicable to us that are similar in nature to covenantscontained in our other financing agreements.
• On February 29, 2012, our board of directors declared a dividend of $0.44 per share for the firstquarter of 2012, which was payable on April 13, 2012 to shareholders of record on March 30,2012.
• Funded a $59.0 million mortgage loan secured by an office campus located in NorthernCalifornia. The terms of the loan provide for up to $4.0 million of future advances upon thesatisfaction of specified conditions.
• Sold the remainder of our held-for-sale first mortgage loans targeted for securitization. As ofDecember 31, 2011, our net equity investment in these six loans was $36.5 million and the loanshad a carrying value of $128.6 million. We realized an aggregate profit of approximately$1.0 million on the held-for-sale loans and associated interest rate hedges.
57

Three months ended June 30, 2012
• Acquired $75.6 million of CMBS at a discounted price of $70.7 million, where the obligors arecertain special purpose entities that were formed to hold substantially all of the assets of aworldwide operator of hotels, resorts and timeshare properties. The acquisition was partiallyfinanced using a $49.3 million increase in a financing facility previously provided by the seller.
• Sold 20,000,000 shares of common stock at a net price of $19.88 per share, resulting in grossproceeds of $397.7 million. On April 30, 2012, the underwriters exercised their option topurchase 3,000,000 additional shares of common stock at $19.88 per share, resulting in additionalgross proceeds of $59.6 million.
• Originated a $73.0 million junior mezzanine loan, of which $45.0 million was initially funded,collateralized by a portfolio of six office buildings located in Rosslyn, Virginia. The loan providesfor up to $28.0 million in future funding for projected capital improvements and leasing costs.Our junior mezzanine loan was co-originated with a $125.0 million first mortgage loan and a$40.0 million senior mezzanine loan, which were separately funded by third party lenders atclosing.
• Originated a $170.0 million first mortgage loan on two Class B office buildings located in theSoHo district of Midtown Manhattan. Collectively known as One SoHo Square, the twoproperties located at 161 Avenue of the Americas and 233 Spring Street comprise over 600,000square feet of office and retail space, which is currently 96% occupied. The first mortgage loanhad an initial funding of $135.0 million, with $35.0 million available for future advances to payfor tenant improvements, leasing commissions and redevelopment costs.
• Originated an $11.6 million first mortgage loan collateralized by a collection of office, retail andparking properties in downtown San Diego, California.
• On May 8, 2012, our board of directors declared a dividend of $0.44 per share for the secondquarter of 2012, which was payable on July 13, 2012 to common stockholders of record as ofJune 30, 2012.
• On May 24 and June 28, 2012 we acquired 226 and 26 residential real estate owned (‘‘REO’’)properties from a major bank at a cost of $24.5 million and $2.8 million, respectively. Most ofthe properties were vacant at acquisition, and we are actively preparing the properties to beeither rented or sold, as applicable. From the date of acquisition through June 30, 2012, weincurred approximately $0.3 million in costs of getting the properties ready for their intendeduse, and such costs were added to our investment basis.
• Originated a $30.0 million mezzanine loan collateralized by an office building in Philadelphia,Pennsylvania.
• During the second quarter 2012 we acquired $173.0 million of RMBS (face value) at a$65.2 million discount.
Three months ended September 30, 2012:
• On July 3, 2012, we entered into a Purchase and Repurchase Agreement and Securities Contract(‘‘Onewest Repurchase Agreement’’) with Onewest Bank, FSB (‘‘Onewest’’). At closing, wetransferred loan investments to Onewest in exchange for a $78.3 million advance. Borrowingsunder the Onewest Repurchase Agreement accrue interest at a pricing rate of one-monthLIBOR plus a margin of 3.0%. The initial maturity date of the facility is July 3, 2015 with twoone-year extension options, subject to certain conditions.
58

• On July 6, 2012, we originated a $51.5 million first mortgage collateralized by three hotelslocated in North Carolina, New Jersey, and Virginia. The initial term for the loan is two years,with three one-year extension options.
• On July 20, 2012, we purchased a 50% undivided participation interest (the ‘‘Le MeridienParticipation Interest’’) in a EUR-denominated mezzanine loan for $68.4 million (‘‘Le MeridienLoan’’) from an independent third party. The borrower is Starman Luxembourg Holdings S.AR.L. (‘‘Holdings’’), an entity that indirectly owns and operates a portfolio of hotels in Franceand Germany. Holdings is owned 50% by an independent third party and 50% by several privateinvestment funds that were previously sponsored by Starwood Capital Group Global I, L.L.C., anaffiliate of our Manager. The Le Meridien Loan has an initial term of two years with an optionto extend for an additional year, subject to certain conditions, an interest rate of 12.5%, anupfront fee of 2.0% and a prepayment fee of 1.0%. We acquired the Le Meridien ParticipationInterest from an independent third party and own the Le Meridien Participation Interest subjectto a participation agreement between us and the independent third party (the ‘‘Le MeridienParticipation Agreement’’). The Le Meridien Participation Agreement provides for the paymentto us, on a pro rata basis with an independent third party, of customary payments in respect ofthe Le Meridien Participation Interest and affords us customary voting, approval and consentrights.
• On August 3, 2012, Starwood Property Mortgage Sub-10, LLC (‘‘SPM Sub-10’’) and StarwoodProperty Mortgage Sub-10A (‘‘SPM Sub 10-A’’), our indirect wholly-owned subsidiaries, jointlyentered into a $250.0 million Senior Secured Revolving Credit Facility arranged by MerrillLynch, Pierce, Fenner & Smith Incorporated (‘‘MLPFS’’). Lender participants in the facilityinclude Bank of America, Citibank, Barclays Bank PLC, Deutsche Bank Trust CompanyAmericas, Goldman Sachs Bank USA, and Stifel Bank & Trust. The facility matures 364 daysfrom closing, and may be extended from time to time, provided the aggregate tenure shall notexceed four years. Outstanding borrowings under the facility will be priced at LIBOR + 325 bps,with an unused fee of 30 to 35 bps per annum depending upon the usage of the facility. Thefacility will be used primarily to finance our purchase or origination of commercial mortgageloans for the time period between transaction closing and the time in which a financing of theloan can be closed with one of our existing secured warehouse facilities or the loan is sold/syndicated in whole or in part. The term of financing provided under the facility for anyindividual loan is limited in most instances to the lesser of six months or the maturity of thefacility. The facility will be secured by each loan for which financing has been provided as well atleast $500,000,000 in market value of additional preapproved unencumbered senior, subordinate,and mezzanine loan assets. The facility is full recourse to us.
• On August 2, 2012, our board of directors declared a dividend of $0.44 per share for the thirdquarter of 2012, which was payable on October 15, 2012 to common stockholders of record onSeptember 28, 2012.
• On August 17, 2012, we originated a $46.0 million first mortgage collateralized by a 315-roomHilton hotel in Rockville, Maryland. The term of the loan is three years, with two one-yearextension options.
• On August 21, 2012, we acquired a $250.0 million participation in a mezzanine loan that issecured primarily by indirect equity interests in subsidiaries that own substantially all of theassets of a worldwide operator of hotels, resorts, and timeshare properties. We acquired thisinvestment at a discounted price of $233.75 million, with $158.75 million being financed by theseller. The maturity date of the mezzanine loan is November 12, 2012, with three one-yearextensions remaining, subject to a 0.5% fee for the second and third remaining extensions.Coincident with this purchase, we sold $165 million in face value of the securitized first
59

mortgage loan component of the same financing transaction, which resulted in a gain of$8.2 million. This sale was undertaken to manage our overall credit exposure to the borrower.
• On September 18, 2012, we originated a $61.0 million first mortgage collateralized by twoClass B+/A- office buildings located in Glendale, California. The term of the loan is three years,with two one-year extension options.
Three months ended December 31, 2012:
• On October 3, 2012, we sold the $94.5 million A-Note component of a $135.0 million firstmortgage loan on two Class B office buildings located in the SoHo district of MidtownManhattan. We retained the $40.5 million B-Note. We originated the first mortgage loan duringthe second quarter of 2012.
• On October 10, 2012, we completed an underwritten public offering of 18,400,000 shares of ourcommon stock at a price of $22.74 for total estimated gross proceeds of approximately$418.4 million. In addition, on October 10, 2012 we granted 875,000 restricted stock units with afair value of approximately $19.9 million at the grant date to our Manager under the ManagerEquity Plan. This award will vest ratably in quarterly installments over a three-year periodbeginning on December 31, 2012, subject to the Manager’s continued service as our manager.
• On October 9, 2012, we purchased a $25.0 million participation in a mezzanine loan secured by517 owned and ground leased hotel properties comprising approximately 59,423 keys.
• On October 16, 2012, through a newly-formed venture with Starwood Distressed OpportunityFund IX (‘‘Fund IX’’), an affiliate of our Manager, we co-originated a $475 million firstmortgage and mezzanine financing for the acquisition and redevelopment of a 10-story retailbuilding located at 701 Seventh Avenue in the Times Square area of Manhattan. Of the totalloan amount, $375 million was funded at closing, $281.2 million of which was funded by us and$93.8 million that was funded by Fund IX. In addition, $100 million will be funded uponreaching certain milestones during the transformation of the property. On October 22, 2012, theventure sold a 25 percent participation in both the first mortgage and mezzanine loan toVornado Realty Trust (‘‘Vornado’’). Upon settling this sale, the Company, Starwood DistressedOpportunity Fund IX, and Vornado had funded $210.9 million, $70.3 million and $93.8 million,respectively, and each party will fund their pro rata share of any future fundings. Following thesale to Vornado, the Starwood entities retained the controlling position in both the firstmortgage and mezzanine loans.
• On October 26, 2012, we originated a $126 million first mortgage secured by a 25 story Class Aoffice tower located at 100 Montgomery Street, San Francisco, CA. The loan has an initialfunding of $115.5 million with a future funding obligation of $10.5 million for tenantimprovements and leasing commissions. The loan bears interest at one-month LIBOR plus3.95%, subject to a 0.25% LIBOR floor. The loan has a three-year term with two one-yearextensions, subject to certain conditions.
• On November 5, 2012, we purchased the senior participation in a whole loan secured by anoffice building located in Washington DC for $45.6 million. The loan has a three-year term withtwo one-year extensions.
• On November 6, 2012 our board of directors declared a dividend of $0.44 per share for thefourth quarter of 2012, which is payable on January 15, 2013 to common stockholders of recordon December 31, 2012.
• On December 13th, 2012, our board of directors declared an extraordinary dividend of $0.10 pershare, which is payable on January 15, 2013 to common stockholders of record on December 31,2012.
60

• On November 8, 2012, we purchased $67.0 million worth of non-performing residential loans.
• On November 13, 2012, we originated a $51.0 million floating rate first mortgage collateralizedby an office complex located in Dallas, TX. The loan has a three-year term with two one-yearextensions.
• On December 5, 2012, we originated a $25.5 first mortgage secured by the fee interests in anoffice building located in Austin, Texas. The loan has a three-year term with two one-yearextensions.
• On December 6, 2012, we originated a $40.3 million first mortgage loan on a partial fee simpleinterest and leasehold interest in a Class B+ office building in San Diego, CA. The loan has athree-year term with two one-year extensions.
• On December 7, 2012, we originated a $34.5 first mortgage on a life style retail center on 83acres in Albuquerque, NM. The loan has a three-year term with two one-year extensions.
• On December 10, 2012, originated a $20.0 first mortgage on a 22-story mixed-use hotel andcondo project in downtown Charlotte, NC. The loan has a three-year term with two one-yearextensions.
• On December 14, 2012, we purchased a $25.0 million participation in a mezzanine loan securedby a portfolio of 680 lodging facilities.
• On December 28, 2012, we originated a $36.6 million floating rate first mortgage for therefinancing of a data center located in Orlando, FL. The loan has a three-year term with twoone-year extensions.
• On December 28, 2012, we co-originated a $48.4 million junior mezzanine loan secured by aportfolio of luxury hotels in Europe.
Refer to Note 16 to the consolidated financial statements for disclosure regarding significanttransactions that occurred subsequent to December 31, 2012.
Business Objectives and Outlook
Our objective is to provide attractive risk adjusted returns to our investors over the long-term,primarily through dividends and secondarily through capital appreciation. We intend to achieve thisobjective by originating and acquiring target assets to create a diversified investment portfolio that isfinanced in a manner that is designed to deliver attractive returns across a variety of market conditionsand economic cycles. We are focused on our three core competencies: transaction access, asset analysisand selection, and identification of attractive relative values within the real estate debt and equitymarkets.
In the initial 18 months following our initial public offering in August 2009, we capitalized on thedislocation in the credit markets and depressed levels of available capital by acquiring real estate debtassets from distressed sellers at historically high risk-adjusted returns, and to a lesser extent byoriginating new loans in a marketplace with lower levels of competition. As the real estate and capitalmarkets have recovered over the past two years, we have evolved from a company focused onopportunistic acquisitions to that of a full-service commercial real estate finance platform that isprimarily focused on the origination of real estate debt investments across the capital structure, in boththe U.S. and Europe. With the STWD brand, market presence, and lending/asset management platformthat we have developed, along with the capabilities, business lines, and additional infrastructure thatwill be provided through consummation of our pending acquisition of LNR, we intend to focusprimarily on the following opportunities:
1) Expand our investment activities in subordinate CMBS and revenues from special servicingthrough our LNR acquisition;
61

2) Expand our presence in the medium-sized commercial real estate lending market (loans in the$10 million to $40 million range) by leveraging LNR’s sourcing and credit underwritingcapabilities. This will significantly expand our overall footprint in the commercial real estatedebt markets;
3) Continue to expand our market presence as a leading provider of acquisition, refinance,development and expansion capital to large real estate projects (greater than $75 million) ininfill locations, and other attractive market niches where our size and scale give us anadvantage to provide a ‘‘one-stop’’ lending solution for real estate developers, owners andoperators;
4) Continue to expand our opportunistic acquisition of residential real estate and non-performingresidential loans, with the objective of providing attractive risk- adjusted returns from netrental operating income, short-term gains from select loan and property sales, and long-termasset appreciation; and
5) Continue to expand our capabilities in syndication and securitization, which serve as a sourceof attractively priced, matched-term financing.
There can be no assurance that the recovery will continue or that we will be able to find appropriateinvestment opportunities.
Critical Accounting Policies and Use of Estimates
Our financial statements are prepared in accordance with GAAP, which requires the use ofestimates and assumptions that affect the reported amounts of assets and liabilities as of the date ofthe financial statements and the reported amounts of revenues and expenses during the reportingperiod. We believe that all of the decisions and assessments upon which our financial statements arebased were reasonable at the time made, based upon information available to us at that time. Inaccordance with SEC guidance, the following discussion describes the accounting policies that apply toour operations that we believe to be most critical to an investor’s understanding of our financial resultsand condition and require complex management judgment and the use of estimates. This summaryshould be read in conjunction with a more complete discussion of our accounting policies included inNote 2 to the consolidated financial statements in this report.
Classification and Impairment Evaluation of Investment Securities
Our MBS investments consist primarily of commercial real estate debt instruments, CMBS, andRMBS that we classify as available-for-sale. Investments classified as available-for-sale are carried attheir fair value, with changes in fair value recorded through accumulated other comprehensive income,a component of stockholders’ equity, rather than through earnings. We do not hold any of ourinvestment securities for trading purposes.
When the estimated fair value of a security is less than amortized cost, we consider whether thereis an other-than-temporary impairment (‘‘OTTI’’) in the value of the security. An impairment isdeemed an OTTI if (i) we intend to sell the security, (ii) it is more likely than not that we will berequired to sell the security before recovering our cost basis, or (iii) we do not expect to recover ourcost basis even if we do not intend to sell the security or believe it is more likely than not that we willbe required to sell the security before recovering our cost basis. If the impairment is deemed to be anOTTI, the resulting accounting treatment depends on the factors causing the OTTI. If the OTTI hasresulted from (i) our intention to sell the security or (ii) our judgment that it is more likely than notthat we will be required to sell the security before recovering our cost basis, an impairment loss isrecognized in current earnings equal to the difference between our amortized cost basis and fair value.Whereas, if the OTTI has resulted from our conclusion that we will not recover our cost basis even ifwe do not intend to sell the security or believe it is more likely than not that we will be required to sell
62

the security before recovering our cost basis, the credit loss portion of the impairment is recorded incurrent earnings and the portion of the loss related to other factors, such as changes in interest rates,continues to be recognized in accumulated other comprehensive income. Determining whether there isan OTTI may require management to exercise significant judgment and make significant assumptions,including, but not limited to, estimated cash flows, estimated prepayments, loss assumptions, andassumptions regarding changes in interest rates. As a result, actual impairment losses could differ fromreported amounts. Such judgments and assumptions are based upon a number of factors, including(i) credit of the issuer or the borrower, (ii) credit rating of the security, (iii) key terms of the security,(iv) performance of the loan or underlying loans, including debt service coverage and loan-to-valueratios, (v) the value of the collateral for the loan or underlying loans, (vi) the effect of local, industry,and broader economic factors, and (vii) the historical and anticipated trends in defaults and lossseverities for similar securities.
Loan Impairment
We evaluate each loan classified as held-for-investment for impairment at least quarterly.Impairment occurs when it is deemed probable that we will not be able to collect all amounts dueaccording to the contractual terms of the loan. If a loan is considered to be impaired, we record anallowance to reduce the carrying value of the loan to the present value of expected future cash flowsdiscounted at the loan’s contractual effective rate or the fair value of the collateral, if repayment isexpected solely from the collateral.
Our loans are typically collateralized by real estate. As a result, we regularly evaluate the extentand impact of any credit deterioration associated with the performance and/or value of the underlyingcollateral property as well as the financial and operating capability of the borrower/sponsor on a loanby loan basis. Specifically, a property’s operating results and any cash reserves are analyzed and used toassess (i) whether cash from operations are sufficient to cover the debt service requirements currentlyand into the future, (ii) the ability of the borrower to refinance the loan, and/or (iii) the property’sliquidation value. The Company also evaluates the financial wherewithal of any loan guarantors as wellas the borrower’s competency in managing and operating the properties. In addition, the Companyconsiders the overall economic environment, real estate sector, and geographic sub-market in which theborrower operates. Such impairment analyses are completed and reviewed by asset management andfinance personnel, who utilize various data sources, including (i) periodic financial data such asproperty occupancy, tenant profile, rental rates, operating expenses, the borrower’s exit plan, andcapitalization and discount rates, (ii) site inspections, and (iii) current credit spreads and discussionswith market participants.
Significant judgment is required when evaluating loans for impairment, therefore, actual resultsover time could be materially different.
Valuation of Financial Instruments
GAAP establishes a hierarchy of valuation techniques based on the observability of inputs utilizedin measuring financial instruments at fair values. GAAP establishes market based or observable inputsas the preferred source of values, followed by valuation models using management assumptions in theabsence of market inputs. The three levels of the hierarchy under GAAP are described below:
Level I—Quoted prices in active markets for identical assets or liabilities.
63

Level II—Prices are determined using other significant observable inputs. Observable inputsare inputs that other market participants would use in pricing a security. These may include quotedprices for similar securities, interest rates, prepayment speeds, credit risk and others.
Level III—Prices are determined using significant unobservable inputs. In situations wherequoted prices or observable inputs are unavailable (for example, when there is little or no marketactivity for an investment at the end of the period) unobservable inputs may be used.
Unobservable inputs reflect our own assumptions about the factors that market participants woulduse in pricing an asset or liability, and would be based on the best information available.
Any changes to the valuation methodology are be reviewed by management to ensure the changesare appropriate. The methods we use may produce a fair value calculation that may not be indicative ofnet realizable value or reflective of future fair values. Furthermore, while we anticipate that ourvaluation methods are appropriate and consistent with other market participants, the use of differentmethodologies, or assumptions, to determine the fair value of certain financial instruments could resultin a different estimate of fair value at the reporting date. We use inputs that are current as of themeasurement date, which may include periods of market dislocation, during which price transparencymay be reduced.
Derivative Instruments and Hedging Activities
As required by GAAP, the Company records all derivatives on the balance sheet at fair value. Theaccounting for changes in the fair value of derivatives depends on the intended use of the derivative,whether the Company has elected to designate a derivative in a hedging relationship and apply hedgeaccounting and whether the hedging relationship has satisfied the criteria necessary to apply hedgeaccounting. Derivatives designated and qualifying as a hedge of the exposure to changes in the fairvalue of an asset, liability, or firm commitment attributable to a particular risk, such as interest raterisk, are considered fair value hedges. Derivatives designated and qualifying as a hedge of the exposureto variability in expected future cash flows, or other types of forecasted transactions, are consideredcash flow hedges. Derivatives may also be designated as hedges of the foreign currency exposure of anet investment in a foreign operation. Hedge accounting generally provides for the matching of thetiming of gain or loss recognition on the hedging instrument with the recognition of the changes in thefair value of the hedged asset or liability that are attributable to the hedged risk in a fair value hedgeor the earnings effect of the hedged forecasted transactions in a cash flow hedge. We may enter intoderivative contracts that are intended to economically hedge certain of our risks, even though hedgeaccounting does not apply or we do not elect to apply hedge accounting. The designation of derivativecontracts as hedges, the measurement of their effectiveness, and the estimate of the fair value of thecontracts all may involve significant judgments by our management, and changes to those judgmentscould significantly impact our reported results of operations.
Income Taxes
We have elected to be taxed as a REIT under the Code for federal income tax purposes. Wegenerally must distribute annually at least 90% of our taxable income, subject to certain adjustmentsand excluding any net capital gain, in order for federal corporate income tax not to apply to ourearnings that we distribute. To the extent that we satisfy this distribution requirement, but distributeless than 100% of our taxable income, we will be subject to federal corporate income tax on ourundistributed taxable income. Our qualification as a REIT also depends on our ability to meet variousother requirements imposed by the Code, which relate to organizational structure, diversity of stockownership and certain restrictions with regard to owned assets and categories of income. Many of theREIT requirements are highly technical and complex, and if we fail to qualify as a REIT we would besubject to United States federal corporate income tax on our taxable income.
64

The Company formed several TRSs since 2010 to reduce the impact of the prohibited transactiontax and to avoid penalty for the holding of assets not qualifying as real estate assets for purposes of theREIT asset tests. Any income associated with a TRS is fully taxable because a TRS is subject to federaland state income taxes as a domestic C corporation based upon its taxable income.
Recent Accounting Pronouncements
In December 2011, the FASB issued amended guidance which will enhance disclosures required byU.S. GAAP by requiring improved information about financial instruments and derivative instrumentsthat are either (1) offset or (2) subject to an enforceable master netting arrangement or similaragreement, irrespective of whether they are offset. This information will enable users of an entity’sfinancial statements to evaluate the effect or potential effect of netting arrangements on an entity’sfinancial position, including the effect or potential effect of rights of setoff associated with certainfinancial instruments and derivative instruments. An entity is required to apply the amendments forannual reporting periods beginning on or after January 1, 2013, and interim periods within thoseannual periods. An entity should provide the disclosures required by those amendments retrospectivelyfor all comparative periods presented. We are in the process of evaluating the impact that this guidancewill have on the consolidated financial statement disclosures.
Results of Operations
Net income attributable to Starwood Property Trust, Inc. for the year ended December 31, 2012was approximately $201.2 million or $1.76 per weighted-average share of basic common stock ($1.76diluted), compared to the year ended December 31, 2011 when net income was $119.4 million or $1.38per weighted-average share of basic common stock ($1.38 diluted). For the year ended December 31,2012, net interest margin increased $83.7 million from the prior year, resulting from increases ininterest income of $102.0 million and interest expense of $18.3 million. The increase in net interestmargin is primarily due to increased investment activity. From December 31, 2011 to December 31,2012, the carrying value of our investments in loans increased a net $552.8 million, other investmentsincreased a net $177.6 million and MBS securities increased by $520.9 million. The increase in interestexpense resulted primarily from the five new financing facilities entered into since December 31, 2011,with a resulting increase in the total secured financing balance outstanding of $202.3 million. As ofDecember 31, 2012, we expect our target portfolio of investments to generate a weighted-averagelevered return of between 11.7% and 12.2% (annually compounded). The weighted-average cost of thesecured financings was 3.6%, including the impact of interest rate hedges.
For the year ended December 31, 2012, non-investment expenses increased by $22.4 million fromthe prior year. The year over year increases were primarily due to increases in the base managementfee of $9.1 million, management incentive fee of $6.7 million, acquisition and investment pursuit costsof $1.7 million and general and administrative costs of $2.7 million. The increase in the basemanagement fee was primarily due to our supplemental equity raises in April 2012 and October 2012with net proceeds of $873.3 million. In connection with the October 2012 supplemental equity raise,our Manager was granted an additional 875,000 restricted stock units, resulting in higher stockcompensation expense in the subsequent periods. The increase in acquisition and investment pursuitcosts and general and administrative expenses are primarily attributed to the Company’s increased size,as well as the volume of transactions and the increase in professional fees such as legal, audit andconsulting, resulting from the growing investment portfolio.
For the year ended December 31, 2012, we had realized gains from the sale of investments of$25.5 million, of which $17.3 million related to the sale of MBS securities and other investments and$8.2 million related to the sale of loans. For the year ended December 31, 2011, we had realized gainsfrom the sale of investments of $21.0 million, of which $10.7 million related to the sale of MBS andother investments and $10.3 million related to the sale of loans. In 2012, we sold nine loans and in2011, sold seven loans into two separate securitization vehicles, and sold two loans in private sale,
65

respectively. We have historically used the securitization markets as a source of advantageously priced,non-recourse, matched term financing for many of the fixed rate first mortgage loans we originate. Ourbusiness model is to originate the whole loan and either securitize or sell a senior portion of the loan,leaving us with a higher yielding subordinated loan component. Refer to Note 7 to the consolidatedfinancial statements in this Annual Report for more information on loan securitization and saleactivities. For the year ended December 31, 2012, we had net losses on currency hedges of$15.2 million and unrealized foreign currency remeasurement gain of $6.5 million, compared to netgains on currency hedges of $4.5 million and unrealized foreign currency remeasurement loss of$6.5 million from the prior year. For the year ended December 31, 2012, we had net gains on interestrate hedges of $1.0 million. The losses on interest rate hedges stem from declines in the value of ourheld-for-sale conduit loans and related derivatives that resulted from the extreme disruptionexperienced by the CMBS market since late June 2011 and have suspended our conduit platform as aresult. As of December 31, 2012, we sold all remaining loans originated on the conduit platform. OTTIcharges related to our RMBS securities were $4.4 million for the year ended December 31, 2012 andother income was $3.6 million.
The diluted per share amounts of our interest margin and expenses for the years endedDecember 31, 2012, 2011 and 2010 were as follows (amounts in thousands except per share data):
For the Year Ended
Per Diluted Per Diluted Per Diluted2012 Share 2011 Share 2010 Share
Net interest margin:Cash coupon received from
loans . . . . . . . . . . . . . . . . . . $206,908 $ 1.80 $151,009 $ 1.75 $ 65,204 $ 1.30Constant yield adjustments on
loans(1) . . . . . . . . . . . . . . . . 44,653 0.40 28,346 0.33 6,339 0.13Cash coupon received from
mortgage-backed securities . . 21,455 0.19 8,955 0.10 14,725 0.29Constant yield adjustments on
mortgage-backed securities(2) . 33,964 0.30 16,663 0.19 7,256 0.15Cash interest expense . . . . . . . . (39,112) (0.34) (25,002) (0.29) (15,142) (0.30)Amortization of debt issuance
costs . . . . . . . . . . . . . . . . . . (8,013) (0.07) (3,780) (0.04) (646) (0.01)
Net interest margin . . . . . . . . 259,855 2.28 176,191 2.04 77,736 1.56
Expenses:Management fees . . . . . . . . . . . 56,906 0.50 38,899 0.45 22,775 0.46Acquisition and investment
pursuit costs . . . . . . . . . . . . . 4,310 0.04 2,571 0.03 378 0.01General and administrative . . . . 12,116 0.11 9,450 0.11 6,899 0.14Loan loss allowance . . . . . . . . . 2,061 0.02 — — — —
Total expenses . . . . . . . . . . . 75,393 0.67 50,920 0.59 30,052 0.61
Income before other income(expenses) and taxes . . . . . . . . $184,462 $ 1.61 $125,271 $ 1.45 $ 47,684 $ 0.95
(1) Represents the aggregate adjustments necessary to recognize income from loans on a constantyield basis, which is comprised primarily of discount accretion, but also includes the amortizationof loan fees and costs.
(2) Represents the aggregate adjustments necessary to recognize income from MBS on a constantyield basis, which is comprised primarily of discount accretion.
66

The overall increase in net interest margin for over the three year period is due to the morecomplete deployment of our capital during each year. Acquisition and investment pursuit costs perdiluted share have increased during the three periods due to the increased size/volume of transactionsbeing pursued. General and administrative expenses per diluted share have not increased over the threeyear period as a result of our efforts to control costs.
Liquidity and Capital Resources
Liquidity is a measure of our ability to meet our cash requirements, including ongoingcommitments to repay borrowings, fund and maintain our assets and operations, make new investmentswhere appropriate, make distributions to our stockholders, and other general business needs. We usecash to purchase or originate investments, repay principal and interest on our borrowings, makedistributions to our stockholders and fund our operations. We closely monitor our liquidity position andbelieve that we have sufficient liquidity to and access to liquidity to meet our financial obligations forat least the next 12 months. Our primary sources of liquidity are as follows:
Cash Generated from Operating the Business, Including Repayments
Cash from operations is generally comprised of interest income from our investments, net of anyassociated financing expense, principal repayments from our investments, net of associated financingrepayments, proceeds from the sale of investments, and changes in working capital balances.
Cash and Cash Equivalents
As of December 31, 2012, we had cash and cash equivalents of $177.7 million.
Cash Flows
For the year ended December 31, 2012
Cash and cash equivalents increased by $63.6 million during the year ended December 31, 2012.The increase resulted from cash used in investing activities of $1.2 billion, offset by cash provided fromoperating activities of $265.6 million and cash provided from financing activities of $986.7 million.
Net cash used in investing activities for the year ended December 31, 2012 totaled $1.2 billion andrelated primarily to the acquisition and origination of new loans held-for-investment of $1.8 billion, newMBS of $626.3 million, acquisition and improvement of real estate of $172.3 million, other investmentsof $14.8 million, offset by proceeds received from the sale of MBS of $261.3 million, principalrepayments on loans and MBS of $55.2 million and $89.1 million, respectively, loan maturities of$615.2 million, proceeds from the sale of loans held for investment of $344.4 million, and proceedsfrom the sale of other investments of $8.3 million.
Net cash provided from operating activities for the year ended December 31, 2012 ofapproximately $265.6 million, includes $132.0 million in proceeds from the sale of loans held for sale.The net income for the period was approximately $203.7 million. The adjustments for non-cash charges,including stock-based compensation, accretion of deferred loan fees and discounts, amortization ofdeferred financing costs, accretion of net discount on MBS and premium from collateralized debtobligations decreased cash by $54.2 million. The net change in operating assets and liabilities increasedcash flows from operating activities by approximately $5.6 million. This amount is comprised of a$6.5 million decrease in cash attributable to related party payable, and an increase of nearly$12.2 million from accrued interest receivable, other assets, accounts payable and accrued expenses andother liabilities. The net change in unrealized losses on loans held-for-sale at fair value of $5.8 millionand unrealized losses on currency hedges of $17.5 million was offset by a net unrealized gain oninterest hedges of $10.2 million and unrealized foreign currency remeasurement gains of $6.6 million.Additionally, we recognized realized gains of $16.5 million from the sale of available-for-sale securities.
67

Lastly, for the year ended December 31, 2012, we had OTTI charges on our RMBS securities of$4.4 million.
Net cash provided by financing activities for the year ended December 31, 2012 related primarilyto $1.8 billion of borrowings from our secured financing facilities, gross proceeds from our commonstock offering of $875.7 million and contributions from non-controlling interests of $94.3 million, offsetby dividend payments to our stockholders of $186.1 million, repayments on borrowings of $1.6 billion,payment of underwriting costs of $2.0 million, distributions to non-controlling interests of $24.5 million,and the payment of deferred financing costs of $8.6 million.
For the year ended December 31, 2011
Cash and cash equivalents decreased by $112.8 million during the year ended December 31, 2011.The decrease resulted from cash used in investing activities of $1.0 billion, offset by cash provided fromoperating activities of $79.4 million and cash provided from financing activities of $809.8 million.
Net cash used in investing activities for the year ended December 31, 2011 totaled $1.0 billion andrelated primarily to the acquisition and origination of new loans held-for-investment of $1.6 billion, newMBS of $208.4 million, other investments of $37.1 million, purchase of derivative contracts of$7.6 million and purchased interest of approximately $2.1 million offset by proceeds received from thesale of MBS of $287.4 million, principal repayments on loans and MBS of $26.9 million and$113.9 million, respectively, MBS maturities of $27.1 million, loan maturities of $305.3 million, proceedsfrom the sale of loans held for investment of $47.5 million, proceeds from the sale of other investmentsof $2.8 million, proceeds from other investment repayments of $0.7 million and net proceeds from theexecution of treasury shorts of $0.1 million.
Net cash provided from operating activities for the year ended December 31, 2011 ofapproximately $79.4 million, includes $270.1 million used for the origination of loans held-for-sale and$294.1 million in proceeds from the sale of loans held for sale. The net income for the period wasapproximately $120.6 million. The adjustments for non-cash charges, including stock-basedcompensation, incentive fee stock compensation, accretion of deferred loan fees and discounts,amortization of deferred financing costs, accretion of net discount on MBS and accretion of premiumfrom collateralized debt obligations decreased cash by $27.2 million. The net change in operating assetsand liabilities decreased cash flows from operating activities by approximately $29.4 million. Thisamount is comprised of a $3.3 million increase in cash attributable to related party payable, and adecrease of nearly $32.7 million from accrued interest receivable, other assets, accounts payable andaccrued expenses and other liabilities. The net change in unrealized gains on loans held-for-sale at fairvalue of $5.8 million and unrealized gains on currency hedges of $5.8 million was offset by a netunrealized loss on interest hedges of $11.3 million and unrealized foreign currency remeasurementlosses of $6.5 million. Additionally, we recognized realized gains of $10.7 million from the sale ofavailable-for-sale securities and $10.3 million from the sale of loans held for sale. Lastly, for the yearended December 31, 2011, we had OTTI charges on our RMBS securities of $6.0 million.
Net cash provided by financing activities for the year ended December 31, 2011 related primarilyto $1.6 billion of borrowings from our secured financing facilities, gross proceeds from our commonstock offering of $476.7 million and contributions from non-controlling interests of $5.2 million, offsetby dividend payments to our stockholders of $142.9 million, repayments on borrowings of $1.1 billion,payment of underwriting costs of $28.3 million, distributions to non-controlling interests of $9.3 million,treasury stock purchases of $10.6 million and the payment of deferred financing costs of $4.9 million.
Potential Liquidation of Certain RMBS and CMBS Positions
We regularly make certain investments in RMBS. We have restricted these RMBS investments toan amount that at all times is no greater than 10% of our total assets. Expected durations are generally5 years or less and we have engaged a third party manager who specializes in RMBS to assist us in
68

managing this portfolio. As of December 31, 2012, our investments in RMBS and CMBS are classifiedas available-for-sale and had a fair value of $333.2 million and $529.4 million, respectively.
Borrowings under Various Financing Arrangements
We utilize a variety of financing arrangements to finance certain assets. We generally utilize threetypes of financing arrangements:
1) Repurchase Agreements: Repurchase agreements effectively allow us to borrow against loansand securities that we own. Under these agreements, we sell our loans and securities to acounterparty and agree to repurchase the same loans and securities from the counterparty at aprice equal to the original sales price plus an interest factor. The counterparty retains the solediscretion over both whether to purchase the loan and security from us and, subject to certainconditions, the market value of such loan or security for purposes of determining whether weare required to pay margin to the counterparty. Generally, if the lender determines (subject tocertain conditions) that the market value of the collateral in a repurchase transaction hasdecreased by more than a defined minimum amount, we would be required to repay anyamounts borrowed in excess of the product of (i) the revised market value multiplied by(ii) the applicable advance rate. During the term of a repurchase agreement, we receive theprincipal and interest on the related loans and securities and pay interest to the counterparty.As of December 31, 2012, we have various repurchase agreements, with details referenced inthe table provided below.
2) Bank Credit Facilities: We use bank credit facilities (including term loans and revolvingfacilities) to finance our assets. These financings may be collateralized or non-collateralizedand may involve one or more lenders. Credit facilities typically have maturities ranging fromtwo to five years and may accrue interest at either fixed or floating rates. The initial term ofour bank facility, as stated in the table below, is subject to further extension based upon thesatisfaction of certain conditions at or prior to the time of such extension. Bank of Americaretains the sole discretion, subject to certain conditions, over the market value of such notefor purposes of determining whether we are required to pay margin to the Bank of America.
3) Loan Sales/Syndications/Securitizations: We seek non-recourse long-term financing from loansales, syndications and/or securitizations of our investments in mortgage loans. The sales/syndications/securitizations generally involve a senior portion of our loan, but may involve theentire loan. Loan sales and syndications generally involve the sale of a senior note componentor participation interest to a third party lender. Securitization generally involves transferringnotes to a special purpose vehicle (or the issuing entity), which then issues one or moreclasses of non-recourse notes pursuant to the terms of an indenture. The notes are secured bythe pool of assets. In exchange for the transfer of assets to the issuing entity, we receive cashproceeds from the sale of non-recourse notes. Sales/syndications/securitizations of ourportfolio investments might magnify our exposure to losses on those portfolio investmentsbecause the retained subordinate interest in any particular overall loan would be subordinateto the loan components sold and we would, therefore, absorb all losses sustained with respectto the overall loan before the owners of the senior notes experience any losses with respect tothe loan in question.
On February 15, 2013, we issued $600.0 million of 4.55% Convertible Senior Notes due 2018. Thenotes were sold to the underwriters at a discount of 2.05%, resulting in net proceeds to us of$587.7 million.
69

70
Summary of Financing Facilities as of December 31, 2012 (dollar amounts in thousands):
Wells Wells Bank of Wells Wells Goldman Borrowing OnewestFargo I Fargo II America Fargo III Fargo IV Sachs II Citibank Base Goldman III Bank
Facility Type . . . . . . . . . . . . . . . . . . . . . . . Repurchase Repurchase Bank Credit Repurchase Repurchase Repurchase Repurchase Bank Credit Repurchase RepurchaseFacility Facility
Revolver . . . . . . . . . . . . . . . . . . . . . . . . . No Yes No Yes No No Yes Yes No NoEligible Assets . . . . . . . . . . . . . . . . . . . . . . Identified Identified Single Identified Identified Single Identified Identified Single Identified
Loans Loans Borrower RMBS Loans Borrower Loans Loans Borrower LoansSecured Note Secured Note Secured Note
Initial Maturity . . . . . . . . . . . . . . . . . . . . . May-13 Aug-13 Nov-14 Mar-13 Dec-14 Aug-15 Mar-14 Aug-13 Sep-15 Jul-15Extended Maturity(a) . . . . . . . . . . . . . . . . . . N/A Aug-15 Nov-15 N/A Dec-16 N/A Mar-17 Aug-16 N/A Jul-17Pricing . . . . . . . . . . . . . . . . . . . . . . . . . . LIBOR + 3% LIBOR + LIBOR + LIBOR + LIBOR + LIBOR + LIBOR + LIBOR + LIBOR + LIBOR +
1.75% to 6% 2.0% to 2.15% 2.10% 2.75% 2.90% 1.75% to 3.75% 3.25%(i) 3.70% 3.00%Minimum Loss to Trigger a Margin Call . . . . . . . (b) (b) $0 $250 (g) $2,000 (h) N/A $4,000 (j)Maximum Advance Rate on Collateral . . . . . . . . . (c) 75% (c) (d) (d) (c) 75% 100%(l) 67.9% 75%Pledged Asset Carrying Value . . . . . . . . . . . . . . $75,928 $692,827 $207,276 $293,956 $243,001 $213,899 $71,360 $697,428 $236,605 $94,802Maximum Facility Size . . . . . . . . . . . . . . . . . $49,225 $550,000 $141,559 $175,000 $181,243 $149,445 $125,000 $250,000 $158,750 $65,638Outstanding Balance . . . . . . . . . . . . . . . . . . $49,225 $347,785 $141,559 $163,122 $181,243 $149,445 $49,045 $0 $158,750 $65,638Approved but Undrawn Capacity(e) . . . . . . . . . . $0 $98,859 $0 $0 $0 $0 $0 $0 $0 $0Unallocated Financing Amount(f) . . . . . . . . . . . $0 $103,356 $0 $11,878 $0 $0 $75,955 $250,000 $0 $0
(a) Subject to certain conditions as defined in facility agreement.
(b) 35 bps of aggregate outstanding principal amount.
(c) Effectively not applicable as of December 31, 2012 as there was no longer any borrowing capacity available.
(d) There is no defined maximum advance rate under this facility. The advance rates are determined separately for each repurchase transaction.
(e) Approved but undrawn capacity represents the total draw amount that has been approved by the lender related to the assets that have been pledged as collateral, less the actual amount that has been drawn.
(f) Unallocated financing amount represents the maximum facility size less the total draw capacity that has been approved by the lender.
(g) Lesser of $1.0 million or 35 bps of aggregate outstanding principal amount.
(h) Margin may be called if the market value of all purchased assets is less than 99.5% of the sum of each asset’s initial purchase price divided by its approved advance rate.
(i) Subject to borrower’s option to choose alternative benchmark based rates pursuant to the terms of the credit agreement.
(j) 3% of the aggregate repurchase price
(k) Although 100% is the maximum advance rate, due to valuation mechanisms within the credit agreement most borrowings will be at a lower advance rate.

Summary of Total Financing Facility Ending Balances as of December 31, 2012 (amounts inthousands):
Aggregate Pledged Asset Carrying Value . . . . . . . . . . . . . . . . . . . . . . . $ 2,827,082
Aggregate Maximum Facility Size . . . . . . . . . . . . . . . . . . . . . . . . . . . . $ 1,845,860Less: Aggregate Outstanding Balance . . . . . . . . . . . . . . . . . . . . . . . . . $(1,305,812)
Aggregate Undrawn Capacity . . . . . . . . . . . . . . . . . . . . . . . . . . . . . . . $ 441,189
Aggregate Approved but Undrawn Capacity . . . . . . . . . . . . . . . . . . . . $ 98,859
Variance between Average and Quarter-End Credit Facility Borrowings Outstanding
The following table compares the average amount of repurchase transactions outstanding duringthe quarter and the amount of repurchase transactions outstanding as of the end of each quarter,together with an explanation of significant variances:
Weighted-AverageQuarter-End Balance Explanations
Balance During Quarter Variance for SignificantQuarter Ended (in 000’s) (in 000’s) (in 000’s) Variances
March 31, 2012 . . . . . . . . . . . . . . . . . . . . . . . . . $1,308,860 $1,270,300 $38,560 (a)June 30, 2012 . . . . . . . . . . . . . . . . . . . . . . . . . . $1,065,388 $1,074,612 $(9,224) (b)September 30, 2012 . . . . . . . . . . . . . . . . . . . . . . $1,309,450 $1,280,953 $28,497 (c)December 31, 2012 . . . . . . . . . . . . . . . . . . . . . . $1,305,812 $1,215,948 $89,863 (d)
(a) Variance is primarily due to the following transactions: (i) paydown of $92.1 million under theGoldman Repurchase Agreement on March 29, 2012 using proceeds from the sale of 6 conduitloans; (ii) $81.0 million draw under the BAML Credit Agreement in mid-March 2012 inconjunction with the closing of a $125.0 million participation in a senior loan; (iii) A draw of$112.0 million was made under the Second Deustche Repurchase Agreement was made onDecember 27, 2011 to provide liquidity for the acquisition of a separate portfolio of loans for$333.0 million, which closed on December 30, 2011. $70.0 million was repaid under the SecondDeutsche Repurchase Agreement in March 2012 after the loans were approved for financing underthe Fourth Wells Repurchase Agreement in Q1 2012; (iv) $88.0 million additional draw on theFourth Wells Repurchase Agreement to leverage a $333.0 million portfolio of loans that closed onDecember 30, 2011 where the majority of loans were approved for financing in Q1 2012; and(v) $155.4 million draw under the Second Goldman Repurchase Agreement in the beginning ofFebruary in conjunction with the acquisition of $222.8 million of CMBS.
(b) Variance is primarily due to the following transactions: (i) paydown of $38.5 million under theWells Repurchase Agreement in early June 2012 using proceeds from the prepayment of 4 loans inthe TIAA portfolio; (ii) various draws and repayments during the quarter under the Second WellsRepurchase Agreement in anticipation of multiple loan closings; (iii) additional draw of$55.1 million under the Third Wells Repurchase Agreement to lever the RMBS acquired duringthe quarter; (iv) paydown of $92.0 million in under the Second Deustche Repurchase Agreementusing proceeds from the equity offering in April 2012, subsequent draw of $45.0 million in earlyMay 2012 in anticipation of the REO pool acquisition, and repayment of $50.3 million inconjunction with the payoff of the loan pledged under the facility in early May 2012; and(v) paydown of $24.5 million under the Fourth Wells Repurchase Agreement in conjunction withthe prepayment of 3 loans during May and June of 2012.
(c) Variance is primarily due to the following transactions: (i) paydown of $98.7 million under theBank of America Merrill Lynch Hilton line in late August 2012 using the proceeds from the sale of
71

three securities; (ii) various draws and repayments during the quarter, including a draw of$132.3 million, under the Second Wells Repurchase Agreement in anticipation of multiple loanclosings; (iii) additional draw of $30 million under the Third Wells Repurchase Agreement to leverthe RMBS acquired during the quarter; (iv) a draw of $32.2 million under the Citi RepurchaseAgreement in late September 2012; and (v) an initial draw of $158.8 million on a newly createdfinancing line.
(d) Variance is primarily due to the following transactions: (i) paydown of $19.5 million on the WellsRepo I Line in early October using proceeds from the maturity of one loan, (ii) various draws inDecember totaling $148.0 million from additional assets pledged to the Wells Repo II Line, offsetby a prepayment of $51.6 million in mid-December, and (iii) draws totaling $158.9 million onvarious dates throughout the quarter on the Wells III RMBS Line.
Weighted-AverageQuarter-End Balance Explanations
Balance During Quarter Variance for SignificantQuarter Ended (in 000’s) (in 000’s) (in 000’s) Variances
March 31, 2011 . . . . . . . . . . . . . . . . . . . . . . . . $ 804,558 $679,616 $ 124,942 (e)June 30, 2011 . . . . . . . . . . . . . . . . . . . . . . . . . $ 697,668 $733,743 $ (36,075) (f)September 30, 2011 . . . . . . . . . . . . . . . . . . . . $ 604,308 $711,823 $(107,515) (g)December 31, 2011 . . . . . . . . . . . . . . . . . . . . . $1,103,517 $774,897 $ 328,620 (h)
(e) Variance is primarily due to the following transactions: (i) approximately $207.6 million drawnunder the Second Wells Repurchase Agreement in March 2011 related to five loans that werepledged, (ii) pay-down of $12.3 million in late March 2011 using proceeds from sales of TALFsecurities; and (iii) $78.4 million initially drawn under the Third Wells Repurchase Agreement inmid-March 2011, of which $40.0 million was repaid at the end of March 2011 using excessproceeds from third party asset sales.
(f) Variance is primarily due to the following transactions: (i) repayment of $158.9 million in debtconcurrent with CMBS sales under the TALF financing in late June 2011; (ii) repayment of$70 million on the facility upon maturity of 10 loans under the Wells Repurchase Agreement inearly April 2011; and (iii) draws of $83.9 million on the Goldman line related to six conduit loansin mid-late June of 2011.
(g) Variance is primarily due to the following transactions: (i) repayment of $62.1 million in debtconcurrent with the maturity of a loan under the Wells Repurchase Agreement in early September2011 and (ii) a pay-down of $68.2 million in debt concurrent with two loans sold into securitizationunder the Second Wells Repurchase Agreement in late August 2011.
(h) Variance is primarily due to the following transactions: (i) $117 million drawn on 4 newly pledgedloans under the Second Wells Repurchase Agreement with the majority drawn during the latterpart of the quarter, (ii) an additional $42 million drawn on existing assets under the Second WellsRepurchase Agreement in December 2011, and (iii) a draw under the Second DeutscheRepurchase Agreement in the amount of $112 million on December 27, 2011. These draws weremade to provide liquidity for the acquisition of a separate portfolio of loans in the amount of$333 million, which closed on December 30, 2011. Draws under the Second Deutsche RepurchaseAgreement were subsequently repaid in Q1 2012 when loans from the December 30, 2011 portfolioacquisition were approved for financing under the Fourth Wells Repurchase Agreement in Q12012.
72

Scheduled Principal Repayments on Investments and Overhang on Financing Facilities
The following scheduled and/or projected principal repayments on our investments were basedupon the amounts outstanding and contractual terms of the financing facilities in effect as ofDecember 31, 2012 (amounts in thousands):
Scheduled/Projected Projected Required Total ScheduledScheduled Principal Principal Repayments on Repayments Principal Repayments,
Repayments on Loans RMBS and CMBS of Financing net of financing
First Quarter 2013(1) . . . . . $165,520 $23,140 $(226,522) $ (37,862)Second Quarter 2013 . . . . . 21,892 20,784 (5,780) 36,896Third Quarter 2013(2) . . . . 7,744 19,023 (359,211) (332,444)Fourth Quarter 2013 . . . . . 41,344 5,012 (41,634) 4,722
Total . . . . . . . . . . . . . . . . . $236,500 $67,959 $(633,147) $(328,688)
(1) We expect to extend the Third Wells Repurchase Agreement, which is scheduled to mature inMarch 2013. This represents $163.1 million of the projected required repayments of financing inthe first quarter of 2013.
(2) We expect to extend the Second Wells Repurchase Agreement, which is scheduled to mature inAugust 2013. We have two one-year extension options, subject to certain conditions. Thisrepresents $347.0 million of the projected required repayments of financing in third quarter 2013.
Other Potential Sources of Financing
In the future, we may also use other sources of financing to fund the acquisition of our targetassets, including other secured as well as unsecured forms of borrowing. We may also seek to raisefurther equity capital or issue debt securities in order to fund our future investments.
Leverage Policies
We employ leverage, to the extent available, to fund the acquisition of our target assets, increasepotential returns to our stockholders, or provide temporary liquidity. Leverage can be either direct byutilizing private third party financing, or indirect through originating, acquiring, or retainingsubordinated mortgages, B-notes, subordinated loan participations or mezzanine loans. Although thetype of leverage we deploy is dependent on the underlying asset that is being financed, we intend, whenpossible, to utilize leverage whose maturity is equal to or greater than the maturity of the underlyingasset and minimize to the greatest extent possible exposure to the company of credit losses associatedwith any individual asset. In addition, we intend to mitigate the impact of potential future interest rateincreases on our borrowings through utilization of hedging instruments, primarily interest rate swapagreements.
The amount of leverage we deploy for particular investments in our target assets depends uponour Manager’s assessment of a variety of factors, which may include the anticipated liquidity and pricevolatility of the assets in our investment portfolio, the potential for losses and extension risk in ourportfolio, the gap between the duration of our assets and liabilities, including hedges, the availabilityand cost of financing the assets, our opinion of the creditworthiness of our financing counterparties, thehealth of the U.S. economy and commercial and residential mortgage markets, our outlook for thelevel, slope, and volatility of interest rates, the credit quality of our assets, the collateral underlying ourassets, and our outlook for asset spreads relative to the LIBOR curve. Under our current repurchaseagreements and bank credit facility, our total leverage may not exceed 75% of total assets (as defined),as adjusted to remove the impact of bona-fide loan sales that are accounted for as financings and the
73

consolidation of variable interest entities pursuant to GAAP. As of December 31, 2012, our total debtto loan and MBS investments was 34.6%.
Contractual Obligations and Commitments
Contractual obligations as of December 31, 2012 are as follows (amounts in thousands):
MoreLess than than
Total 1 year 1 to 3 years 3 to 5 years 5 years
Secured financings, including interestpayable(a) . . . . . . . . . . . . . . . . . . . . . . . . . $1,366,251 $664,976 $701,275 $ — $—
Liabilities of securitization trust . . . . . . . . . . . 98,660 4,699 58,061 35,900 —Loan funding obligations . . . . . . . . . . . . . . . . 218,345 63,136 145,126 10,083 —
Total . . . . . . . . . . . . . . . . . . . . . . . . . . . . . . . $1,683,256 $732,811 $904,462 $45,983 $—
(a) For borrowings with variable interest rates, we used the rates in effect as of December 31, 2012 todetermine the future interest payment obligations. Included in the less than 1 year category is$510.1 million in financing related to the Second Wells Repurchase Agreement and the ThirdWells Repurchase Agreement which are expected to be refinanced or extended.
The table above does not include amounts due under our management agreement or derivativeagreements as those contracts do not have fixed and determinable payments. In addition, the tableabove does not give effect to the subsequent events described in Note 16 to the consolidated financialstatements in this report.
Off-Balance Sheet Arrangements
As of December 31, 2012, we did not have any relationships with unconsolidated entities orfinancial partnerships, such as entities often referred to as structured investment vehicles, or specialpurpose or variable interest entities, established to facilitate off-balance sheet arrangements or othercontractually narrow or limited purposes. Further, as of December 31, 2012, we had not guaranteed anyobligations of unconsolidated entities or entered into any commitment or intent to provide additionalfunding to any such entities.
Dividends
We intend to continue to make regular quarterly distributions to holders of our common stock.U.S. federal income tax law generally requires that a REIT distribute annually at least 90% of its REITtaxable income, without regard to the deduction for dividends paid and excluding net capital gains, andthat it pay tax at regular corporate rates to the extent that it annually distributes less than 100% of itsnet taxable income. We intend to continue to pay regular quarterly dividends to our stockholders in anamount approximating our net taxable income, if and to the extent authorized by our board ofdirectors. Before we pay any dividend, whether for U.S. federal income tax purposes or otherwise, wemust first meet both our operating requirements and debt service on our debt. If our cash available fordistribution is less than our net taxable income, we could be required to sell assets or borrow funds tomake cash distributions or we may make a portion of the required distribution in the form of a taxablestock distribution or distribution of debt securities.
Our board of directors declared a dividend of $0.44 per share of common stock for the quarterended March 31, 2012 on February 29, 2012. The dividend was paid on April 13, 2012 to commonstockholders of record as of March 30, 2012. The board also declared a dividend of $0.44 per share ofcommon stock for the quarter ended June 30, 2012. The dividend was paid on July 13, 2012 to
74

common stockholders of record as of June 29, 2012. The board further declared a dividend of $0.44 pershare of common stock for the quarter ended September 30, 2012. The dividend was paid onOctober 15, 2012 to common stockholders of record as of September 28, 2012. On November 6, 2012,the board declared a dividend of $0.44 per share and on December 13th declared an additionalextraordinary dividend of $0.10 per share of common stock for the quarter ended December 31, 2012.The dividend was paid on January 15, 2013 to common stockholders of record as of December 31,2012.
The tax treatment for our aggregate distributions per share of common stock paid with respect to2012 is as follows:
Total 2012 Ordinary TaxableDistribution Taxable Qualified Capital Gain Unrecaptured Nondividend
Record Date Payment Date Per Share Dividends Dividends(1) Distribution 1250 Gain(2) Distributions(3)
12/31/2011 . . 1/17/2012 $0.4400 $0.3759 $— $0.0641 $— $—3/31/2012 . . . 4/15/2012 0.4400 0.3759 — 0.0641 — —6/30/2012 . . . 7/15/2012 0.4400 0.3759 — 0.0641 — —9/30/2012 . . . 10/15/2012 0.4400 0.3759 — 0.0641 — —12/31/2012 . . 1/15/2013 0.3298 0.2818 — 0.0480 — —
$2.0898 $1.7854 $— $0.3044 $— $—
(1) Amounts in 1b are included in 1a.
(2) Amounts in 2b are included in 2a.
(3) Amounts in 3 are also known as Return of Capital.
As the Company’s aggregate distributions exceeded its earnings and profits, the January 2013distribution declared in the fourth quarter of 2012 and payable to shareholders of record as ofDecember 31, 2012 will be treated as a 2013 distribution for federal tax purposes.
On February 27, 2013, our board of directors declared a dividend of $0.44 per share for the firstquarter of 2013, which is payable on April 15, 2013 to common stockholders of record as of March 29,2013.
Non-GAAP Financial Measures
Core Earnings is a non-GAAP financial measure. We calculate Core Earnings as GAAP netincome (loss) excluding non-cash equity compensation expense, the incentive fee due under ourmanagement agreement, depreciation and amortization of real estate (to the extent that we ownproperties), any unrealized gains, losses or other non-cash items recorded in net income for the period,regardless of whether such items are included in other comprehensive income or loss, or in net income.The amount is adjusted to exclude one-time events pursuant to changes in GAAP and certain othernon-cash charges as determined by our Manager and approved by a majority of our independentdirectors.
We believe that Core Earnings provides an additional measure of our core operating performanceby eliminating the impact of certain non-cash expenses and facilitating a comparison of our financialresults to those of other comparable REITs with fewer or no non-cash charges and comparison of ourown operating results from period to period. Our management uses Core Earnings in this way, and alsouses Core Earnings to compute the incentive fee due under our management agreement. The Companybelieves that its investors also use Core Earnings or a comparable supplemental performance measureto evaluate and compare the performance of the Company and its peers, and as such, the Companybelieves that the disclosure of Core Earnings is useful to (and expected by) its investors.
75

However, the Company cautions that Core Earnings does not represent cash generated fromoperating activities in accordance with GAAP and should not be considered as an alternative to netincome (determined in accordance with GAAP), or an indication of our cash flow from operatingactivities (determined in accordance with GAAP), a measure of our liquidity, or an indication of fundsavailable to fund our cash needs, including our ability to make cash distributions. In addition, ourmethodology for calculating Core Earnings may differ from the methodologies employed by otherREITs to calculate the same or similar supplemental performance measures, and accordingly, ourreported Core Earnings may not be comparable to the Core Earnings reported by other REITs.
Our Core Earnings for the years ended December 31, 2012, 2011 and, 2010 were approximately$228.3, $146.6 million and $67.2 million respectively, or $1.99, $1.70, and $1.34 per weighted-averageshare, diluted and per weighted-average share, basic. The table below provides a reconciliation of netincome to Core Earnings for these periods:
Reconciliation of Net Income to Core Earnings:
Year Ended Per Year Ended Per Period Ended Per(Amounts in thousands, December 31, Diluted December 31, Diluted December 31, Dilutedexcept per share data) 2012 Share 2011 Share 2010 Share
Net income attributable to StarwoodProperty Trust, Inc . . . . . . . . . . . . $201,195 $ 1.75 $119,377 $ 1.38 $57,046 $ 1.14
Unrealized loss (gain) on loans held-for-sale at fair value . . . . . . . . . . . 5,760 0.05 (5,760) (0.07) — 0.00
Unrealized (gain) loss on interestrate hedges . . . . . . . . . . . . . . . . . (10,243) (0.09) 11,287 0.13 55 0.00
Other-than-temporary impairment . . 4,402 0.04 6,001 0.08 — 0.00Unrealized foreign currency (gain)
loss . . . . . . . . . . . . . . . . . . . . . . . (6,549) (0.06) 6,518 0.08 (6,050) (0.12)Unrealized loss (gain) loss on
currency hedges . . . . . . . . . . . . . . 17,463 0.15 (5,755) (0.07) 7,383 0.15Unrealized gain on securities . . . . . . (295) (0.00) — 0.00 — 0.00Management incentive fee . . . . . . . . 7,870 0.07 1,178 0.01 1,235 0.02Non-cash stock-based compensation . 16,163 0.14 13,743 0.16 7,522 0.15Realized other-than-temporary
impairment for sold securities . . . . (137) 0.00 — 0.00 — 0.00Depreciation . . . . . . . . . . . . . . . . . . 213 0.00 — 0.00 — 0.00Loan loss allowance . . . . . . . . . . . . 2,061 0.02 — 0.00 — 0.00Loss from effective hedge
termination . . . . . . . . . . . . . . . . . (9,597) (0.08) — 0.00 — 0.00
Core Earnings . . . . . . . . . . . . . . . $228,306 $ 1.99 $146,589 $ 1.70 $67,191 $ 1.34
Effective for the first quarter 2012, we have slightly modified the definition of Core Earnings toallow for management to make adjustments, subject in each case to the approval of a majority of theindependent directors, to Core Earnings that should be made in non-standard situations if and whenthey arise in order for us to calculate such earnings in a manner consistent with the objective of themeasure. During the first quarter 2012, we had such a situation. In February 2012, ourGBP-denominated loan prepaid. At the time the loan was originally closed, we had hedged ourexposure to fluctuations in the GBP/USD exchange rate through a series of foreign exchange forwardcontracts. Under these derivative contracts, we sold GBP to our counterparty in exchange for USD (ata fixed exchange rate) on scheduled dates and at specified notional amounts that corresponded to thedates on which we expected to receive GBP-denominated interest and principal payments on our loaninvestment. As a result of the loan being prepaid in February 2012, the foreign exchange forward
76

contracts were no longer necessary hedges. At that time, the hedge contracts were in a loss position tous of approximately $10 million. In the process of negotiating the termination of the contracts,management was able to lock-in the amount of the loss by entering into new derivative contracts with aseparate counterparty that had the same maturity dates and notional amounts, but wherein we wouldsell USD in exchange for GBP (offsetting positions). We executed this structure as opposed toliquidating the original contracts as it was more cost effective. However, because the original contractsremained in place, the loss had not been ‘‘realized’’ as that term is defined in GAAP. As a result, whilewe had effectively locked-in the loss, it would not have been deducted in Core Earnings as previouslydefined. Therefore, we modified the definition of Core Earnings to allow for adjustments innon-standard situations such as this, provided that we obtain the approval for any such adjustmentsfrom the majority of our independent directors. Adjustments subsequent to the first quarter 2012 arebeing made such that the appropriate amount of Core Earnings is reported as these offsetting contractsmature.
Item 7A. Quantitative and Qualitative Disclosures About Market Risk.
We seek to manage our risks related to the credit quality of our assets, interest rates, liquidity,prepayment speeds and market value while, at the same time, seeking to provide an opportunity tostockholders to realize attractive risk-adjusted returns through ownership of our capital stock. While wedo not seek to avoid risk completely, we believe the risk can be quantified from historical experienceand seek to actively manage that risk, to earn sufficient compensation to justify taking those risks andto maintain capital levels consistent with the risks we undertake.
Credit Risk
We are subject to varying degrees of credit risk in connection with our investments. While we donot expect to encounter significant credit risk in our Agency RMBS assets, we have exposure to creditrisk on the mortgage assets and underlying mortgage loans in our non-Agency RMBS and CMBSportfolios as well as other assets. Our Manager seeks to manage credit risk by performing deep creditfundamental analysis of potential assets. Credit risk is also addressed through our Manager’s on-goingsurveillance, and investments are monitored for variance from expected prepayments, defaults,severities, losses and cash flow on a monthly basis.
Our investment guidelines do not limit the amount of our equity that may be invested in any typeof our target assets; however, not more than 25% of our equity may be invested in any individual asset,without the consent of a majority of our independent directors. Our investment decisions depend onprevailing market conditions and may change over time in response to opportunities available indifferent interest rate, economic and credit environments. As a result, we cannot predict the percentageof our equity that will be invested in any of our target assets at any given time.
As of December 31, 2012, 20.4% of the CMBS securities are rated BB+. The remaining 79.6% aresecurities where the obligors are certain special purpose entities that were formed to hold substantiallyall of the assets of a worldwide operator of hotels, resorts and timeshare properties; the securities arenot rated but the loan-to-value ratio was estimated to be in the range of 39%–44% at December 31,2012.
77

At December 31, 2012, the S&P ratings of our RMBS portfolio were as follows (amounts inthousands):
CarryingS&P Rating Value Percentage
A+ . . . . . . . . . . . . . . . . . . . . . . . . . . . . . . . . . . . . . . . . . . $ 28 0.0%BBB+ . . . . . . . . . . . . . . . . . . . . . . . . . . . . . . . . . . . . . . . 103 0.0%BB+ . . . . . . . . . . . . . . . . . . . . . . . . . . . . . . . . . . . . . . . . . 16,071 4.8%BB . . . . . . . . . . . . . . . . . . . . . . . . . . . . . . . . . . . . . . . . . . 1,549 0.5%BB� . . . . . . . . . . . . . . . . . . . . . . . . . . . . . . . . . . . . . . . . 5,862 1.8%B+ . . . . . . . . . . . . . . . . . . . . . . . . . . . . . . . . . . . . . . . . . . 9,338 2.8%B . . . . . . . . . . . . . . . . . . . . . . . . . . . . . . . . . . . . . . . . . . . 3 0.0%B� . . . . . . . . . . . . . . . . . . . . . . . . . . . . . . . . . . . . . . . . . . 29,597 8.9%CCC . . . . . . . . . . . . . . . . . . . . . . . . . . . . . . . . . . . . . . . . . 234,429 70.4%CC . . . . . . . . . . . . . . . . . . . . . . . . . . . . . . . . . . . . . . . . . . 5,235 1.6%D . . . . . . . . . . . . . . . . . . . . . . . . . . . . . . . . . . . . . . . . . . . 23,280 6.9%NR . . . . . . . . . . . . . . . . . . . . . . . . . . . . . . . . . . . . . . . . . . 7,658 2.3%
Total MBS . . . . . . . . . . . . . . . . . . . . . . . . . . . . . . . . . . . . . . $333,153 100.0%
At December 31, 2011, the S&P ratings of our MBS portfolio were as follows (amounts in thousands):
CarryingS&P Rating Value Percentage
AA+ . . . . . . . . . . . . . . . . . . . . . . . . . . . . . . . . . . . . . . . . $ 86 0.0%AA . . . . . . . . . . . . . . . . . . . . . . . . . . . . . . . . . . . . . . . . . . 1,223 0.4%AA� . . . . . . . . . . . . . . . . . . . . . . . . . . . . . . . . . . . . . . . . 5,396 1.6%A . . . . . . . . . . . . . . . . . . . . . . . . . . . . . . . . . . . . . . . . . . . 4,835 1.4%A� . . . . . . . . . . . . . . . . . . . . . . . . . . . . . . . . . . . . . . . . . 3,376 1.0%BBB+ . . . . . . . . . . . . . . . . . . . . . . . . . . . . . . . . . . . . . . . 5,558 1.6%BBB . . . . . . . . . . . . . . . . . . . . . . . . . . . . . . . . . . . . . . . . . 121 0.0%BB+ . . . . . . . . . . . . . . . . . . . . . . . . . . . . . . . . . . . . . . . . . 4,513 1.3%BB . . . . . . . . . . . . . . . . . . . . . . . . . . . . . . . . . . . . . . . . . . 3,987 1.2%BB� . . . . . . . . . . . . . . . . . . . . . . . . . . . . . . . . . . . . . . . . 4,400 1.3%B+ . . . . . . . . . . . . . . . . . . . . . . . . . . . . . . . . . . . . . . . . . . 5,293 1.5%B . . . . . . . . . . . . . . . . . . . . . . . . . . . . . . . . . . . . . . . . . . . 5,405 1.6%B� . . . . . . . . . . . . . . . . . . . . . . . . . . . . . . . . . . . . . . . . . . 9,110 2.7%CCC . . . . . . . . . . . . . . . . . . . . . . . . . . . . . . . . . . . . . . . . . 99,446 29.1%CC . . . . . . . . . . . . . . . . . . . . . . . . . . . . . . . . . . . . . . . . . . 6,344 1.9%D . . . . . . . . . . . . . . . . . . . . . . . . . . . . . . . . . . . . . . . . . . . 3,583 1.0%NR . . . . . . . . . . . . . . . . . . . . . . . . . . . . . . . . . . . . . . . . . . 179,058 52.4%
Total MBS . . . . . . . . . . . . . . . . . . . . . . . . . . . . . . . . . . . . . . $341,734 100.0%
Interest Rate Risk
Interest rates are highly sensitive to many factors, including fiscal and monetary policies anddomestic and international economic and political considerations, as well as other factors beyond ourcontrol. We are subject to interest rate risk in connection with our investments and the relatedfinancing obligations. In general, we finance the acquisition and/or origination of our target assetsthrough financings in the form of warehouse facilities, bank credit facilities (including term loans andrevolving facilities), securitizations and repurchase agreements. We mitigate interest rate risk through
78

utilization of hedging instruments, primarily interest rate swap agreements. Interest rate swapagreements are utilized to hedge against future interest rate increases on our borrowings and potentialadverse changes in the value of certain assets that result from interest rate changes.
Interest Rate Effect on Net Interest Margin
Our operating results depend in large part on differences between the income earned on ourinvestments and our cost of borrowing and hedging activities. The cost of our borrowings is generallybased on prevailing market interest rates. During a period of rising interest rates, our borrowing costsgenerally may increase (1) while the yields earned on our leveraged fixed-rate mortgage assets remainstatic and (2) at a faster pace than the yields earned on our leveraged floating rate mortgage assets,which could result in a decline in our net interest margin. The severity of any such decline woulddepend on our asset/liability composition at the time as well as the magnitude and duration of theinterest rate increase. Further, an increase in short-term interest rates could also have a negativeimpact on the market value of our target assets. If any of these events was to occur, we couldexperience a decrease in net income or incur a net loss during these periods, which could adverselyaffect our liquidity and results of operations. Hedging techniques are partly based on assumed levels ofprepayments of our investments. If prepayments are slower or faster than assumed, the life of theinvestment would be longer or shorter, which would reduce the effectiveness of any hedging strategieswe may use and may cause losses on such transactions.
Interest Rate Mismatch Risk
We have funded a portion of our acquisition of mortgage loans and MBS with borrowings that arebased on LIBOR, while the interest rates on these assets may be indexed to LIBOR or another indexrate, such as the one-year Constant Maturity Treasury (‘‘CMT’’) index, the Monthly Treasury Average(‘‘MTA’’) index or the 11th District Cost of Funds Index (‘‘COFI’’). Accordingly, any increase inLIBOR relative to one-year CMT rates, MTA or COFI may result in an increase in our borrowingcosts that may not be matched by a corresponding increase in the interest earnings on these assets. Anysuch interest rate index mismatch could adversely affect our profitability, which may negatively impactdistributions to our stockholders. To mitigate interest rate mismatches, we may utilize the hedgingstrategies discussed above.
Our analysis of risks is based on our Manager’s experience, estimates, models and assumptions.These analyses rely on models which utilize estimates of fair value and interest rate sensitivity. Actualeconomic conditions or implementation of decisions by the Manager may produce results that differsignificantly from the estimates and assumptions used in our models and the projected results.
Prepayment Risk
Prepayment risk is the risk that principal will be repaid at a different rate than anticipated, causingthe return on certain investments to be less than expected. As we receive prepayments of principal onour assets, any premiums paid on such assets are amortized against interest income. In general, anincrease in prepayment rates accelerates the amortization of purchase premiums, thereby reducing theinterest income earned on the assets. Conversely, discounts on such assets are accreted into interestincome. In general, an increase in prepayment rates accelerates the accretion of purchase discounts,thereby increasing the interest income earned on the assets.
Extension Risk
Our Manager computes the projected weighted-average life of our assets based on assumptionsregarding the rate at which the borrowers will prepay the mortgages or extend. If prepayment ratesdecrease in a rising interest rate environment or extension options are exercised, the life of the
79

fixed-rate assets could extend beyond the term of the secured debt agreements. This could have anegative impact on our results of operations. In some situations, we may be forced to sell assets tomaintain adequate liquidity, which could cause us to incur losses.
Fair Value Risk
The estimated fair value of our investments fluctuates primarily due to changes in interest ratesand other factors. Generally, in a rising interest rate environment, the estimated fair value of thefixed-rate investments would be expected to decrease; conversely, in a decreasing interest rateenvironment, the estimated fair value of the fixed-rate investments would be expected to increase. Asmarket volatility increases or liquidity decreases, the fair value of our assets may be adversely impacted.If we are unable to readily obtain independent pricing to validate our estimated fair value of thesecurities in our portfolio, the fair value gains or losses recorded and/or disclosed may be adverselyaffected.
Foreign Currency Risk
We intend to hedge our currency exposures in a prudent manner. However, our currency hedgingstrategies may not eliminate all of our currency risk due to, among other things, uncertainties in thetiming and/or amount of payments received on the related investments, and/or unequal, inaccurate, orunavailability of hedges to perfectly offset changes in future exchange rates. Additionally, we may berequired under certain circumstances to collateralize our currency hedges for the benefit of the hedgecounterparty, which could adversely affect our liquidity.
During 2010, we entered into a series of forward contracts whereby we agreed to sell an amount ofGBP for an agreed-upon amount of USD at various dates through October 2013. These forwardcontracts were executed to fix the USD amount of GBP denominated cash flows we expect to receivefrom our GBP-denominated loan. During the first quarter of 2012, the GBP-denominated loan wasprepaid. As a result of the loan being prepaid in February 2012, the foreign exchange forward contractswere no longer necessary hedges. At that time, the hedge contracts were in a loss position to us ofapproximately $10.0 million. In the process of negotiating the termination of the contracts, managementwas able to lock-in the amount of the loss by entering into new derivative contracts with a separatecounterparty that had the same maturity dates and notional amounts, but wherein we would sell USDin exchange for GBP (offsetting positions). We executed this structure as opposed to liquidating theoriginal contracts as it was more cost effective. As of December 31, 2012, the GBP hedging strategiesabove resulted in 4 foreign exchange forward sales contracts with a total notional value of$106.8 million and 4 such foreign exchange forward purchase contracts with a total notional value of$106.8 million (using the December 31, 2012 spot rate of 1.6255).
As of December 31, 2012, we had a $108.3 million GBP-denominated CMBS investment (using theDecember 31, 2012 spot rate of 1.6255). During the first three months of 2012, we entered into a seriesof forward contracts whereby we agreed to sell an amount of GBP for an agreed-upon amount of USDat various dates through March 2016. These forward contracts were executed to fix the USD amount ofGBP-denominated cash flows we expect to receive from our GBP-denominated CMBS investment. Asof December 31, 2012, the GBP hedging strategies above resulted in 7 foreign exchange forward salescontracts with a total notional value of $137.2 million (using the December 31, 2012 spot rate of1.6255).
As of December 31, 2012, we had a $48.4 million GBP-denominated loan investment (using theDecember 31, 2012 spot rate of 1.6255). Our historical cost related to this investment was at a spot rateof approximately 1.613. During 2012, we entered into a series of forward contracts whereby we agree tosell an amount of GBP for an agreed-upon amount of USD at various dates through January 2016.These forward contracts were executed to fix the USD amount of GBP-denominated cash flows
80
expected to be received by the Company related to the Company’s GBP-denominated loan. As ofDecember 31, 2012, we had 12 such foreign exchange forward sales contracts with a total notional valueof $67.0 million (using December 31, 2012 spot rate of 1.6255).
As of December 31, 2012, we had a $29.5 million of EUR-denominated loan investment (using theDecember 31, 2012 spot rate of 1.3193). Our historical cost related to this investment was at a spot rateof approximately 1.426. During 2012, we entered into a series of forward contracts whereby we agreedto sell an amount of EUR for an agreed upon amount of USD at various dates through January 2014.These forward contracts were executed to economically fix the USD amount of EUR-denominated cashflows expected to be received by us related to our mezzanine loan in Germany. As of December 31,2012, we had 7 such foreign exchange forward contracts with a total notional value of $35.7 million(using the December 31, 2012 spot rate of 1.3193).
As of December 31, 2012, we had a $73.0 million EUR-denominated loan investment (using theDecember 31, 2012 spot rate of 1.3193). Our historical cost related to this investment was at a spot rateof approximately 1.222. During 2012, we entered into a series of forward contracts whereby we agree tosell an amount of EUR for an agreed upon amount of USD at various dates through June 2014. Theseforward contracts were executed to economically fix the USD amount of EUR-denominated cash flowsexpected to be received by us related to our loan in Luxembourg. As of December 31, 2012, we had 5such foreign exchange spot rate contracts with a total notional value of $86.0 million (using theDecember 31, 2012 spot rate of 1.3193).
Real Estate
Commercial and residential mortgage assets are subject to volatility and may be affected adverselyby a number of factors, including, but not limited to, national, regional and local economic conditions(which may be adversely affected by industry slowdowns and other factors); local real estate conditions;changes or continued weakness in specific industry segments; construction quality, age and design;demographic factors; and retroactive changes to building or similar codes. In addition, decreases inproperty values reduce the value of the collateral and the potential proceeds available to a borrower torepay the underlying loans, which could also cause us to suffer losses.
Inflation Risk
Virtually all of our assets and liabilities are interest rate sensitive in nature. As a result, interestrates and other factors influence our performance significantly more than inflation does. Changes ininterest rates may correlate with inflation rates and/or changes in inflation rates. Our financialstatements are prepared in accordance with GAAP and our distributions are determined by our boardof directors consistent with our obligation to distribute to our stockholders at least 90% of our REITtaxable income on an annual basis in order to maintain our REIT qualification; in each case, ouractivities and balance sheet are measured with reference to historical cost and/or fair value withoutconsidering inflation.
Risk Management
To the extent consistent with maintaining our REIT qualification, we seek to manage risk exposureto protect our portfolio of financial assets against the effects of major interest rate changes. Wegenerally seek to manage this risk by:
• attempting to structure our financing agreements to have a range of different maturities, terms,amortizations and interest rate adjustment periods;
81

• using hedging instruments, primarily interest rate swap agreements but also financial futures,options, interest rate cap agreements, floors and forward sales to adjust the interest ratesensitivity of our investment portfolio and our borrowings; and
• using loan sales, syndications, and securitization financing to better match the maturity of ourfinancing with the duration of our assets.
The following table summarizes the net loan investment income for a 12 month period and thechange in fair value of our investments and indebtedness assuming an increase or decrease of 100 basispoints in the LIBOR interest rate, both adjusted for the effects of our interest rate hedging activities(amounts in thousands):
Variable-rateIncome (Expense) investments and 100 Basis Point 100 Basis PointSubject to Interest Rate Sensitivity indebtedness Increase Decrease
Investment income from variable-rateinvestments(1) . . . . . . . . . . . . . . . . . $ 1,918,182 $ 11,717 $(1,009)
Investment expense from variable-rateindebtedness(1) . . . . . . . . . . . . . . . . (1,393,600) (19,250) 6,148
Net investment income from variablerate instruments . . . . . . . . . . . . . . . $ 524,582 $ (7,533) $ 5,139
Assets (Liabilities) Fixed-RateSubject to Interest Rate Sensitivity (Par investments and 100 Basis Point 100 Basis PointAmount) indebtedness Increase Decrease
Fair value of fixed-rate investments . . . $1,142,644 $(24,612) $39,120
Net fair value of fixed-rate instruments $1,142,644 $(24,612) $39,120
(1) Assumes LIBOR rate decrease does not go below 0%.
82

Item 8. Financial Statements and Supplementary Data.
Index to Financial Statements and Schedule
Financial StatementsReport of Independent Registered Public Accounting Firm . . . . . . . . . . . . . . . . . . . . . . . . . . . 84Consolidated Balance Sheets as of December 31, 2012 and 2011 . . . . . . . . . . . . . . . . . . . . . . . 86Consolidated Statements of Operations for the Years Ended December 31, 2012, 2011, and
2010 . . . . . . . . . . . . . . . . . . . . . . . . . . . . . . . . . . . . . . . . . . . . . . . . . . . . . . . . . . . . . . . . . 87Consolidated Statements of Comprehensive Income for the Years Ended December 31, 2012,
2011, and 2010 . . . . . . . . . . . . . . . . . . . . . . . . . . . . . . . . . . . . . . . . . . . . . . . . . . . . . . . . . 88Consolidated Statements of Equity for the Years Ended December 31, 2012, 2011, and 2010 . . 89Consolidated Statements of Cash Flows for the Years Ended December 31, 2012, 2011, and
2010 . . . . . . . . . . . . . . . . . . . . . . . . . . . . . . . . . . . . . . . . . . . . . . . . . . . . . . . . . . . . . . . . . 90Notes to Consolidated Financial Statements . . . . . . . . . . . . . . . . . . . . . . . . . . . . . . . . . . . . . . 92Schedule III—Residential Real Estate as of December 31, 2012 . . . . . . . . . . . . . . . . . . . . . . . 141Schedule IV—Mortgage Loans on Real Estate as of December 31, 2012 . . . . . . . . . . . . . . . . . 142
All other schedules are omitted because they are not required or the required information isshown in the financial statements or the notes thereto.
83

REPORT OF INDEPENDENT REGISTERED PUBLIC ACCOUNTING FIRM
To the Board of Directors and Stockholders ofStarwood Property Trust, Inc.Greenwich, CT
We have audited the accompanying consolidated balance sheets of Starwood Property Trust, Inc.and subsidiaries (the ‘‘Company’’) as of December 31, 2012 and 2011, and the related consolidatedstatements of operations, comprehensive income, equity, and cash flows for each of the three years inthe period ended December 31, 2012. Our audits also included the financial statement schedules listedin the Index at Item 8. We also have audited the Company’s internal control over financial reporting asof December 31, 2012, based on criteria established in Internal Control—Integrated Framework issued bythe Committee of Sponsoring Organizations of the Treadway Commission. The Company’s managementis responsible for these financial statements and the financial statement schedules, for maintainingeffective internal control over financial reporting, and for its assessment of the effectiveness of internalcontrol over financial reporting, included in the accompanying Management Report on Internal Controlover Financial Reporting. Our responsibility is to express an opinion on these financial statements andfinancial statement schedules and an opinion on the Company’s internal control over financial reportingbased on our audits.
We conducted our audits in accordance with the standards of the Public Company AccountingOversight Board (United States). Those standards require that we plan and perform the audit to obtainreasonable assurance about whether the financial statements are free of material misstatement andwhether effective internal control over financial reporting was maintained in all material respects. Ouraudits of the financial statements included examining, on a test basis, evidence supporting the amountsand disclosures in the financial statements, assessing the accounting principles used and significantestimates made by management, and evaluating the overall financial statement presentation. Our auditof internal control over financial reporting included obtaining an understanding of internal control overfinancial reporting, assessing the risk that a material weakness exists, testing and evaluating the designand operating effectiveness of internal control based on the assessed risk. Our audits also includedperforming such other procedures as we considered necessary in the circumstances. We believe that ouraudits provide a reasonable basis for our opinions.
A company’s internal control over financial reporting is a process designed by, or under thesupervision of, the company’s principal executive and principal financial officers, or persons performingsimilar functions, and effected by the company’s board of directors, management, and other personnelto provide reasonable assurance regarding the reliability of financial reporting and the preparation offinancial statements for external purposes in accordance with generally accepted accounting principles.A company’s internal control over financial reporting includes those policies and procedures that(1) pertain to the maintenance of records that, in reasonable detail, accurately and fairly reflect thetransactions and dispositions of the assets of the company; (2) provide reasonable assurance thattransactions are recorded as necessary to permit preparation of financial statements in accordance withgenerally accepted accounting principles and that receipts and expenditures of the company are beingmade only in accordance with authorizations of management and directors of the company; and(3) provide reasonable assurance regarding prevention or timely detection of unauthorized acquisition,use, or disposition of the company’s assets that could have a material effect on the financial statements.
Because of the inherent limitations of internal control over financial reporting, including thepossibility of collusion or improper management override of controls, material misstatements due toerror or fraud may not be prevented or detected on a timely basis. Also, projections of any evaluationof the effectiveness of the internal control over financial reporting to future periods are subject to therisk that the controls may become inadequate because of changes in conditions, or that the degree ofcompliance with the policies or procedures may deteriorate.
84

In our opinion, the consolidated financial statements referred to above present fairly, in allmaterial respects, the financial position of Starwood Property Trust, Inc. and subsidiaries as ofDecember 31, 2012 and 2011, and the results of their operations and their cash flows for each of thethree years in the period ended December 31, 2012, in conformity with accounting principles generallyaccepted in the United States of America. Also, in our opinion, such financial statement schedules,when considered in relation to the basic consolidated financial statements taken as a whole, presentsfairly, in all material respects, the information set forth therein. Also, in our opinion, the Companymaintained, in all material respects, effective internal control over financial reporting as ofDecember 31, 2012, based on the criteria established in Internal Control—Integrated Framework issuedby the Committee of Sponsoring Organizations of the Treadway Commission.
/s/ DELOITTE & TOUCHE LLP
New York, NYFebruary 27, 2013
85

Starwood Property Trust, Inc. and Subsidiaries
Consolidated Balance Sheets
(Amounts in thousands, except share data)
As of As ofDecember 31, December 31,
2012 2011
Assets:Cash and cash equivalents . . . . . . . . . . . . . . . . . . . . . . . . . . . . . . . . . . $ 177,671 $ 114,027Restricted cash . . . . . . . . . . . . . . . . . . . . . . . . . . . . . . . . . . . . . . . . . . 3,429 —Loans held for investment, net . . . . . . . . . . . . . . . . . . . . . . . . . . . . . . 2,914,434 2,268,599Loans held for sale at fair value . . . . . . . . . . . . . . . . . . . . . . . . . . . . . — 128,593Loans transferred as secured borrowings . . . . . . . . . . . . . . . . . . . . . . . 85,901 50,316Mortgage backed securities, available-for-sale, at fair value . . . . . . . . . . 862,587 341,734Other investments . . . . . . . . . . . . . . . . . . . . . . . . . . . . . . . . . . . . . . . 221,983 44,379Accrued interest receivable . . . . . . . . . . . . . . . . . . . . . . . . . . . . . . . . . 24,120 15,176Derivative assets . . . . . . . . . . . . . . . . . . . . . . . . . . . . . . . . . . . . . . . . . 9,227 12,816Other assets . . . . . . . . . . . . . . . . . . . . . . . . . . . . . . . . . . . . . . . . . . . . 25,021 21,807
Total Assets . . . . . . . . . . . . . . . . . . . . . . . . . . . . . . . . . . . . . . . . . . . . . . . $4,324,373 $2,997,447
Liabilities and EquityLiabilities:
Accounts payable and accrued expenses . . . . . . . . . . . . . . . . . . . . . . . . $ 8,890 $ 5,051Related-party payable . . . . . . . . . . . . . . . . . . . . . . . . . . . . . . . . . . . . . 1,803 8,348Dividends payable . . . . . . . . . . . . . . . . . . . . . . . . . . . . . . . . . . . . . . . 73,796 41,431Derivative liabilities . . . . . . . . . . . . . . . . . . . . . . . . . . . . . . . . . . . . . . 27,770 19,652Secured financing agreements, net . . . . . . . . . . . . . . . . . . . . . . . . . . . . 1,305,812 1,103,517Loan transfer secured borrowings . . . . . . . . . . . . . . . . . . . . . . . . . . . . 87,893 53,199Other liabilities . . . . . . . . . . . . . . . . . . . . . . . . . . . . . . . . . . . . . . . . . 21,204 1,102
Total Liabilities . . . . . . . . . . . . . . . . . . . . . . . . . . . . . . . . . . . . . . . . . . . 1,527,168 1,232,300
Commitments and contingencies (Note 14)Equity:Starwood Property Trust, Inc. Stockholders’ Equity:Preferred stock, $0.01 per share, 100,000,000 shares authorized, no shares
issued and outstanding . . . . . . . . . . . . . . . . . . . . . . . . . . . . . . . . . . . . — —Common stock, $0.01 per share, 500,000,000 shares authorized,
136,125,356 issued and 135,499,506 outstanding as of December 31,2012, and 93,811,351 issued and 93,185,501 outstanding as ofDecember 31, 2011 . . . . . . . . . . . . . . . . . . . . . . . . . . . . . . . . . . . . . . . 1,361 938
Additional paid-in capital . . . . . . . . . . . . . . . . . . . . . . . . . . . . . . . . . . . . 2,721,353 1,828,319Treasury stock (625,850 shares as of December 31, 2012 and
December 31, 2011) . . . . . . . . . . . . . . . . . . . . . . . . . . . . . . . . . . . . . . (10,642) (10,642)Accumulated other comprehensive income (loss) . . . . . . . . . . . . . . . . . . . 79,675 (3,998)Accumulated deficit . . . . . . . . . . . . . . . . . . . . . . . . . . . . . . . . . . . . . . . . (72,401) (55,129)
Total Starwood Property Trust, Inc. Stockholders’ Equity . . . . . . . . . . . . 2,719,346 1,759,488Non-controlling interests in consolidated subsidiaries . . . . . . . . . . . . . . . . 77,859 5,659
Total Equity . . . . . . . . . . . . . . . . . . . . . . . . . . . . . . . . . . . . . . . . . . . . . 2,797,205 1,765,147
Total Liabilities and Equity . . . . . . . . . . . . . . . . . . . . . . . . . . . . . . . . . . . . $4,324,373 $2,997,447
See notes to consolidated financial statements.
86

Starwood Property Trust, Inc. and Subsidiaries
Consolidated Statements of Operations
(Amounts in thousands, except per share data)
For the For the For theYear Ended Year Ended Year Ended
December 31, December 31, December 31,2012 2011 2010
Net interest margin:Interest income from mortgage-backed securities . . . . . . . . . $ 55,419 $ 25,618 $ 21,981Interest income from loans . . . . . . . . . . . . . . . . . . . . . . . . . 251,561 179,355 71,543Interest expense . . . . . . . . . . . . . . . . . . . . . . . . . . . . . . . . . (47,125) (28,782) (15,788)
Net interest margin . . . . . . . . . . . . . . . . . . . . . . . . . . . . 259,855 176,191 77,736
Expenses:Management fees (including $15,714, $13,493 and $7,420 for
the years ended December 31, 2012, 2011, and 2010 ofnon-cash stock-based compensation, respectively) . . . . . . . 56,906 38,899 22,775
Acquisition and investment pursuit costs . . . . . . . . . . . . . . . 4,310 2,571 378General and administrative (including $448, $250 and $102
for the years ending December 31, 2012, 2011, and 2010of non-cash stock-based compensation, respectively) . . . . . 12,116 9,450 6,899
Loan loss allowance . . . . . . . . . . . . . . . . . . . . . . . . . . . . . . 2,061 — —
Total operating expenses . . . . . . . . . . . . . . . . . . . . . . . . . 75,393 50,920 30,052
Income before other income (expense) and income taxes . . . . . 184,462 125,271 47,684Other income . . . . . . . . . . . . . . . . . . . . . . . . . . . . . . . . . . 3,615 3,075 1,403Other-than temporary impairment (‘‘OTTI’’), net of $2,854
and $1,310, recognized in other comprehensive income in2012 and 2011 . . . . . . . . . . . . . . . . . . . . . . . . . . . . . . . . (4,402) (6,001) —
Net gains on sales of investments . . . . . . . . . . . . . . . . . . . . 25,532 20,994 11,629Net realized foreign currency gains (losses) . . . . . . . . . . . . . 8,571 (902) 57Net gains (losses) on currency hedges . . . . . . . . . . . . . . . . . (15,180) 4,491 (7,500)Net gains (losses) on interest rate hedges . . . . . . . . . . . . . . 1,023 (27,130) (55)Net gains on credit spread hedges . . . . . . . . . . . . . . . . . . . . — 2,358 —Unrealized gains (losses) on loans held-for-sale at fair value . (5,760) 5,760 —Unrealized gains on securities . . . . . . . . . . . . . . . . . . . . . . . 295 — —Unrealized foreign currency remeasurement gains (losses) . . 6,549 (6,518) 6,050
Income before income taxes . . . . . . . . . . . . . . . . . . . . . . . . . . 204,705 121,398 59,268Income tax provision . . . . . . . . . . . . . . . . . . . . . . . . . . . . . (1,023) (790) (426)
Net Income . . . . . . . . . . . . . . . . . . . . . . . . . . . . . . . . . . . . . . 203,682 120,608 58,842Net income attributable to non-controlling interests . . . . . . . . . (2,487) (1,231) (1,796)
Net income attributable to Starwood Property Trust, Inc. . . . . $201,195 $119,377 $ 57,046
Net income per share of common stock:Basic . . . . . . . . . . . . . . . . . . . . . . . . . . . . . . . . . . . . . . . $ 1.76 $ 1.38 $ 1.16
Diluted . . . . . . . . . . . . . . . . . . . . . . . . . . . . . . . . . . . . . $ 1.76 $ 1.38 $ 1.14
See notes to consolidated financial statements.
87

Starwood Property Trust, Inc. and Subsidiaries
Consolidated Statements of Comprehensive Income
(Amounts in thousands)
For the For the For theYear Ended Year Ended Year Ended
December 31, December 31, December 31,2012 2011 2010
Net income . . . . . . . . . . . . . . . . . . . . . . . . . . . . . . . . . . . . . . $203,682 $120,608 $58,842Other comprehensive income:
Change in fair value of cash flow hedges . . . . . . . . . . . . . . . (1,152) 205 (1,625)Unrealized gain (loss) in fair value of available-for-sale
securities . . . . . . . . . . . . . . . . . . . . . . . . . . . . . . . . . . . . 83,377 (11,248) 13,342Reclassification adjustment for net realized gains on sale of
securities . . . . . . . . . . . . . . . . . . . . . . . . . . . . . . . . . . . . (2,954) (8,298) (2,375)Reclassification for OTTI . . . . . . . . . . . . . . . . . . . . . . . . . . 4,402 6,001 —
Comprehensive income . . . . . . . . . . . . . . . . . . . . . . . . . . . . . 287,355 107,268 68,184Less: Comprehensive income attributable to
non-controlling interests . . . . . . . . . . . . . . . . . . . . . . . . (2,487) (92) (2,935)
Comprehensive income attributable to Starwood PropertyTrust, Inc. . . . . . . . . . . . . . . . . . . . . . . . . . . . . . . . . . . . . . $284,868 $107,176 $65,249
See notes to consolidated financial statements.
88

89
Starwood Property Trust, Inc. and Subsidiaries
Consolidated Statements of Equity
(Amounts in thousands, except share data)Total
Accumulated StarwoodAdditional Treasury Other Property Non-Common Stock Paid-In Stock Accumulated Comprehensive Trust, Inc. controlling Total
Shares Par Capital Shares Amount Deficit Income Equity Interests Equity
Balance at January 1, 2010 . . . . . . . . . . . . . 47,583,800 $ 476 $ 895,857 — $ — $ (8,366) $ — $ 887,967 $ 8,068 $ 896,035Proceeds from public offering of common stock 23,000,000 230 453,560 453,790 453,790Underwriting and offering costs . . . . . . . . . . (18,986) (18,986) (18,986)Stock-based compensation . . . . . . . . . . . . . . 437,542 7,522 7,522 7,522Net income . . . . . . . . . . . . . . . . . . . . . . . . 57,046 57,046 1,796 58,842Dividends declared . . . . . . . . . . . . . . . . . . . (67,982) (67,982) (67,982)Other comprehensive income, net . . . . . . . . . 8,203 8,203 1,139 9,342Contribution from non-controlling interests . . . 3,002 3,002Distribution to non-controlling interests . . . . . (4,336) (4,336)
Balance at December 31, 2010 . . . . . . . . . . . 71,021,342 706 1,337,953 — — (19,302) 8,203 1,327,560 9,669 1,337,229Proceeds from public offering of common stock 22,000,000 220 476,508 476,728 476,728Underwriting and offering costs . . . . . . . . . . (1,091) (1,091) (1,091)Stock-based compensation . . . . . . . . . . . . . . 726,754 11 13,743 13,754 13,754Manager incentive fee paid in stock . . . . . . . . 63,255 1 1,206 1,207 1,207Treasury stock purchased . . . . . . . . . . . . . . . 625,850 (10,642) (10,642) (10,642)Net income . . . . . . . . . . . . . . . . . . . . . . . . 119,377 119,377 1,231 120,608Dividends declared . . . . . . . . . . . . . . . . . . . (155,204) (155,204) (155,204)Other comprehensive loss, net . . . . . . . . . . . (12,201) (12,201) (1,139) (13,340)Contribution from non-controlling interests . . . 5,239 5,239Distribution to non-controlling interests . . . . . (9,341) (9,341)
Balance at December 31, 2011 . . . . . . . . . . . 93,811,351 938 1,828,319 625,850 (10,642) (55,129) (3,998) 1,759,488 5,659 1,765,147Proceeds from public offering of common stock 41,400,000 414 875,323 875,737 875,737Underwriting and offering costs . . . . . . . . . . (2,034) (2,034) (2,034)Stock-based compensation . . . . . . . . . . . . . . 746,929 7 16,156 16,163 16,163Manager incentive fee paid in stock . . . . . . . . 167,076 2 3,589 3,591 3,591Net income . . . . . . . . . . . . . . . . . . . . . . . . 201,195 201,195 2,487 203,682Dividends declared . . . . . . . . . . . . . . . . . . . (218,467) (218,467) (218,467)Other comprehensive loss, net . . . . . . . . . . . 83,673 83,673 83,673Contribution from non-controlling interests . . . 94,250 94,250Distribution to non-controlling interests . . . . . (24,537) (24,537)
Balance at December 31, 2012 . . . . . . . . . . . 136,125,356 $1,361 $2,721,353 625,850 $(10,642) $ (72,401) $79,675 $2,719,346 $ 77,859 $2,797,205
See notes to consolidated financial statements.

Starwood Property Trust, Inc. and Subsidiaries
Consolidated Statements of Cash Flows
(Amounts in thousands)
For the Year Ended For the Year Ended For the Year EndedDecember 31, 2012 December 31, 2011 December 31, 2010
Cash Flows from Operating Activities:Net income . . . . . . . . . . . . . . . . . . . . . . . . . . $ 203,682 $ 120,608 $ 58,842Adjustments to reconcile net income to net cash
provided by (used in) operating activities:Amortization of deferred financing costs . . . . . 5,669 3,780 646Accretion of net discount on mortgage backed
securities (MBS) . . . . . . . . . . . . . . . . . . . . (33,964) (18,071) (7,256)Accretion of net deferred loan fees and
discounts . . . . . . . . . . . . . . . . . . . . . . . . . (44,653) (26,966) (6,339)Accretion of premium from loan transfer
secured borrowings . . . . . . . . . . . . . . . . . . (1,044) (887) —Stock-based compensation . . . . . . . . . . . . . . . 16,163 13,743 7,522Incentive-fee compensation . . . . . . . . . . . . . . 3,592 1,206 —Gain on sale of available-for-sale securities . . . (16,532) (10,653) (2,118)Gain on sale of loans . . . . . . . . . . . . . . . . . . (8,154) (10,314) (9,253)Gain on foreign currency remeasurement . . . . (8,809) — —Gain on sale of real estate . . . . . . . . . . . . . . (586) — —Gain on sale of other investments . . . . . . . . . — (27) (257)Unrealized gains on securities . . . . . . . . . . . . (295) — —Unrealized gains (losses) on loans held for sale
at fair value, net . . . . . . . . . . . . . . . . . . . . 5,760 (5,760) —Unrealized gains (losses) on interest rate
hedges . . . . . . . . . . . . . . . . . . . . . . . . . . . (10,244) 11,287 55Unrealized gains (losses) on currency hedges . . 17,463 (5,755) 7,383Unrealized foreign currency remeasurement
gains (losses) . . . . . . . . . . . . . . . . . . . . . . (6,550) 6,518 (6,050)OTTI . . . . . . . . . . . . . . . . . . . . . . . . . . . . . 4,402 6,001 —Loan loss allowance . . . . . . . . . . . . . . . . . . . 2,061 — —
Changes in operating assets and liabilities:Related-party payable . . . . . . . . . . . . . . . . . . (6,545) 3,298 1,504Accrued interest receivable, less purchased
interest . . . . . . . . . . . . . . . . . . . . . . . . . . (11,393) (10,982) (7,712)Other assets . . . . . . . . . . . . . . . . . . . . . . . . (394) (15,308) (459)Accounts payable and accrued expenses . . . . . . 3,839 (476) 4,493Other liabilities . . . . . . . . . . . . . . . . . . . . . . 20,102 (5,898) 2,767Origination of held for sale loans . . . . . . . . . . — (270,066) (143,439)Proceeds from sale of held for sale loans . . . . . 132,012 294,126 —
Net cash provided by (used in) operating activities . 265,582 79,404 (99,671)
Cash Flows from Investing Activities:Purchase of mortgage-backed securities . . . . . . . (626,287) (208,382) (204,508)Proceeds from sale of mortgage-backed securities 261,291 287,356 58,313Proceeds from mortgage-backed securities
maturities . . . . . . . . . . . . . . . . . . . . . . . . . . — 27,126 —Mortgage-backed securities principal paydowns . . 89,134 113,915 38,838Origination and purchase of loans held for
investment . . . . . . . . . . . . . . . . . . . . . . . . . (1,753,363) (1,558,690) (1,208,814)Loan maturities . . . . . . . . . . . . . . . . . . . . . . . 615,227 305,316 114,717
90
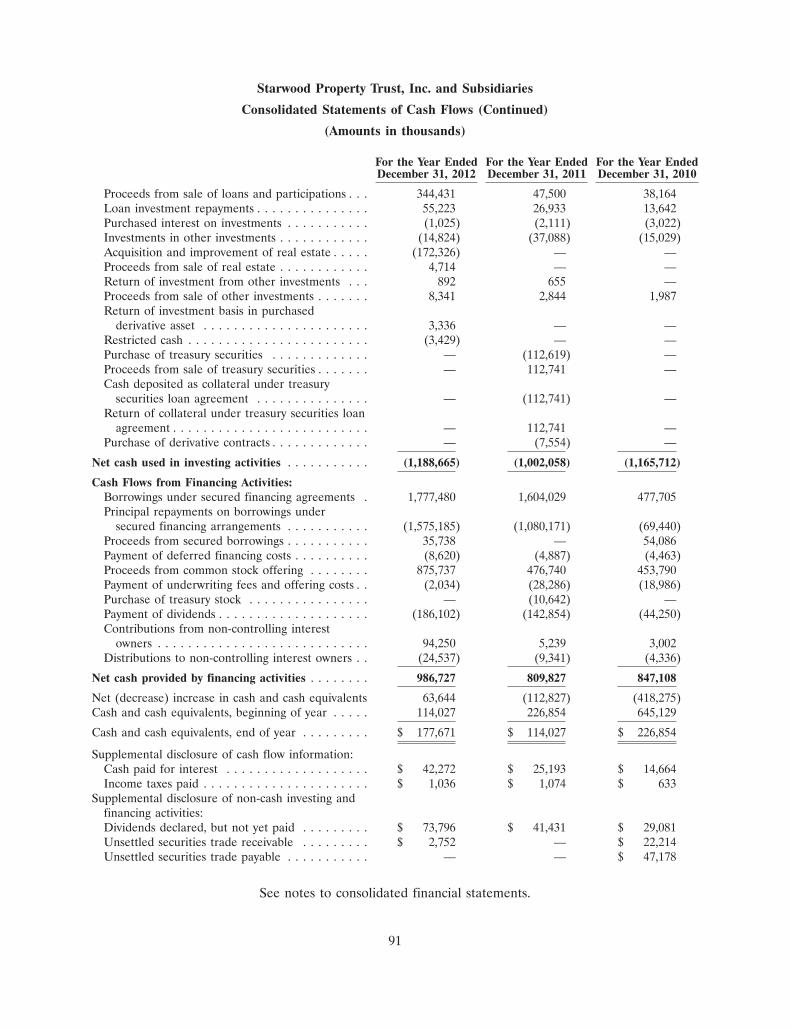
Starwood Property Trust, Inc. and Subsidiaries
Consolidated Statements of Cash Flows (Continued)
(Amounts in thousands)
For the Year Ended For the Year Ended For the Year EndedDecember 31, 2012 December 31, 2011 December 31, 2010
Proceeds from sale of loans and participations . . . 344,431 47,500 38,164Loan investment repayments . . . . . . . . . . . . . . . 55,223 26,933 13,642Purchased interest on investments . . . . . . . . . . . (1,025) (2,111) (3,022)Investments in other investments . . . . . . . . . . . . (14,824) (37,088) (15,029)Acquisition and improvement of real estate . . . . . (172,326) — —Proceeds from sale of real estate . . . . . . . . . . . . 4,714 — —Return of investment from other investments . . . 892 655 —Proceeds from sale of other investments . . . . . . . 8,341 2,844 1,987Return of investment basis in purchased
derivative asset . . . . . . . . . . . . . . . . . . . . . . 3,336 — —Restricted cash . . . . . . . . . . . . . . . . . . . . . . . . (3,429) — —Purchase of treasury securities . . . . . . . . . . . . . — (112,619) —Proceeds from sale of treasury securities . . . . . . . — 112,741 —Cash deposited as collateral under treasury
securities loan agreement . . . . . . . . . . . . . . . — (112,741) —Return of collateral under treasury securities loan
agreement . . . . . . . . . . . . . . . . . . . . . . . . . . — 112,741 —Purchase of derivative contracts . . . . . . . . . . . . . — (7,554) —
Net cash used in investing activities . . . . . . . . . . . (1,188,665) (1,002,058) (1,165,712)
Cash Flows from Financing Activities:Borrowings under secured financing agreements . 1,777,480 1,604,029 477,705Principal repayments on borrowings under
secured financing arrangements . . . . . . . . . . . (1,575,185) (1,080,171) (69,440)Proceeds from secured borrowings . . . . . . . . . . . 35,738 — 54,086Payment of deferred financing costs . . . . . . . . . . (8,620) (4,887) (4,463)Proceeds from common stock offering . . . . . . . . 875,737 476,740 453,790Payment of underwriting fees and offering costs . . (2,034) (28,286) (18,986)Purchase of treasury stock . . . . . . . . . . . . . . . . — (10,642) —Payment of dividends . . . . . . . . . . . . . . . . . . . . (186,102) (142,854) (44,250)Contributions from non-controlling interest
owners . . . . . . . . . . . . . . . . . . . . . . . . . . . . 94,250 5,239 3,002Distributions to non-controlling interest owners . . (24,537) (9,341) (4,336)
Net cash provided by financing activities . . . . . . . . 986,727 809,827 847,108
Net (decrease) increase in cash and cash equivalents 63,644 (112,827) (418,275)Cash and cash equivalents, beginning of year . . . . . 114,027 226,854 645,129
Cash and cash equivalents, end of year . . . . . . . . . $ 177,671 $ 114,027 $ 226,854
Supplemental disclosure of cash flow information:Cash paid for interest . . . . . . . . . . . . . . . . . . . $ 42,272 $ 25,193 $ 14,664Income taxes paid . . . . . . . . . . . . . . . . . . . . . . $ 1,036 $ 1,074 $ 633
Supplemental disclosure of non-cash investing andfinancing activities:Dividends declared, but not yet paid . . . . . . . . . $ 73,796 $ 41,431 $ 29,081Unsettled securities trade receivable . . . . . . . . . $ 2,752 — $ 22,214Unsettled securities trade payable . . . . . . . . . . . — — $ 47,178
See notes to consolidated financial statements.
91

Starwood Property Trust, Inc. and Subsidiaries
Notes to Consolidated Financial Statements
As of December 31, 2012
1. Business and Organization
Starwood Property Trust, Inc. (‘‘the Trust’’ together with its subsidiaries, ‘‘we’’ or the ‘‘Company’’)is a Maryland corporation that commenced operations on August 17, 2009 (‘‘Inception’’) upon thecompletion of its initial public offering (‘‘IPO’’). We are focused on originating, investing in, financingand managing commercial mortgage loans and other commercial real estate debt investments,commercial mortgage-backed securities (‘‘CMBS’’), and other commercial real estate-related debtinvestments. We collectively refer to commercial mortgage loans, other commercial real estate debtinvestments, CMBS, and other commercial real estate-related debt investments as our target assets. Wealso invest in residential mortgage-backed securities (‘‘RMBS’’) and residential real estate owned(‘‘REO’’), and may invest in distressed or non-performing loans, commercial properties subject to netleases and residential mortgage loans. As market conditions change over time, we may adjust ourstrategy to take advantage of changes in interest rates and credit spreads as well as economic andcredit conditions.
We are organized and conduct our operations to qualify as a real estate investment trust (‘‘REIT’’)under the Internal Revenue Code of 1986, as amended (the ‘‘Code’’). As such, we will generally not besubject to U.S. federal corporate income tax on that portion of our net income that is distributed tostockholders if we distribute at least 90% of our taxable income to our stockholders by prescribed datesand comply with various other requirements.
We are organized as a holding company and conduct our business primarily through our variouswholly-owned subsidiaries. We are externally managed and advised by SPT Management, LLC (our‘‘Manager’’) pursuant to the terms of a management agreement. Our Manager is controlled by BarrySternlicht, our Chairman and Chief Executive Officer. Our Manager is an affiliate of Starwood CapitalGroup, a privately-held private equity firm founded and controlled by Mr. Sternlicht.
As of December 31, 2012, investments with collateral in the hospitality, office, and retail propertysectors represented 45.3%, 17.6%, and 15.7% of our investment portfolio, respectively. Such allocationscould materially change in the future.
2. Summary of Significant Accounting Policies
Basis of Accounting and Principles of Consolidation
The accompanying consolidated financial statements include our accounts and those of ourconsolidated subsidiaries. Intercompany amounts have been eliminated. The preparation of financialstatements in conformity with accounting principles generally accepted in the United States of America(‘‘GAAP’’) requires us to make estimates and assumptions that affect the reported amounts of assetsand liabilities and disclosure of contingent assets and liabilities at the date of the financial statements,as well as the reported amounts of revenues and expenses during the reporting periods. Actual resultscould differ from those estimates. The most significant and subjective estimate that we make isprojecting the cash flows to be received on our investments, which has a significant impact on theamounts of interest income, credit losses (if any), and fair values that we record and/or disclose. Inaddition, the fair value of financial instruments that are estimated using a discounted cash flowsmethod are significantly impacted by the rates at which we estimate market participants would discountthe expected cash flows.
A non-controlling interest in a consolidated subsidiary is defined as ‘‘the portion of the equity (netassets) in a subsidiary not attributable, directly or indirectly, to a parent’’. Non-controlling interests are
92

Starwood Property Trust, Inc. and Subsidiaries
Notes to Consolidated Financial Statements (Continued)
As of December 31, 2012
2. Summary of Significant Accounting Policies (Continued)
presented as a separate component of equity in the consolidated balance sheets. In addition, thepresentation of net income attributes earnings to controlling and non-controlling interests.
Segment Reporting
We are focused on originating and acquiring real estate related investments and currently operatein one reportable segment.
Cash and Cash Equivalents
Cash and cash equivalents include cash in banks and short-term investments. Short-terminvestments are comprised of highly liquid instruments with original maturities of three months or less.The Company maintains its cash and cash equivalents in multiple financial institutions and at timesthese balances exceed federally insurable limits.
Debt Securities
GAAP requires that at the time of purchase, we designate debt securities as held-to-maturity,available-for-sale, or trading depending on our investment strategy and ability to hold such securities tomaturity. Held-to-maturity securities are stated at cost plus any premiums or discounts, which areamortized or accreted through the consolidated statements of operations using the effective interestmethod. Securities we (i) do not hold for the purpose of selling in the near-term, or (ii) may dispose ofprior to maturity, are classified as available-for-sale and are carried at fair value in the accompanyingfinancial statements. Unrealized gains or losses on available-for-sale securities are reported as acomponent of accumulated other comprehensive income (loss) in stockholders’ equity. As ofDecember 31, 2012 and 2011, our CMBS and RMBS securities were classified as available-for-sale. Theclassification of each investment involves management’s judgment, which is subject to change.
When the estimated fair value of a security is less than its amortized cost, we consider whetherthere is an other-than-temporary impairment (‘‘OTTI’’) in the value of the security. An impairment isdeemed an OTTI if (i) we intend to sell the security, (ii) it is more likely than not that we will berequired to sell the security before recovering our cost basis, or (iii) we do not expect to recover theentire amortized cost basis of the security even if we do not intend to sell the security or believe it ismore likely than not that we will be required to sell the security before recovering our cost basis. If theimpairment is deemed to be an OTTI, the resulting accounting treatment depends on the factorscausing the OTTI. If the OTTI has resulted from (i) our intention to sell the security, or (ii) ourjudgment that it is more likely than not that we will be required to sell the security before recoveringour cost basis, an impairment loss is recognized in current earnings equal to the entire differencebetween our amortized cost basis and fair value. Whereas, if the OTTI has resulted from ourconclusion that we will not recover our cost basis even if we do not intend to sell the security orbelieve it is more likely than not that we will be required to sell the security before recovering our costbasis, only the credit loss portion of the impairment is recorded in current earnings, and the portion ofthe loss related to other factors, such as changes in interest rates, continues to be recognized inaccumulated other comprehensive income (loss). Following the recognition of an OTTI throughearnings, a new cost basis is established for the security. Determining whether there is an OTTI mayrequire us to exercise significant judgment and make significant assumptions, including, but not limitedto, estimated cash flows, estimated prepayments, loss assumptions, and assumptions regarding changes
93

Starwood Property Trust, Inc. and Subsidiaries
Notes to Consolidated Financial Statements (Continued)
As of December 31, 2012
2. Summary of Significant Accounting Policies (Continued)
in interest rates. As a result, actual OTTI losses could differ from reported amounts. Such judgmentsand assumptions are based upon a number of factors, including (i) credit of the issuer or theunderlying borrowers, (ii) credit rating of the security, (iii) key terms of the security, (iv) performanceof the underlying loans, including debt service coverage and loan-to-value ratios, (v) the value of thecollateral for the underlying loans, (vi) the effect of local, industry, and broader economic factors, and(vii) the historical and anticipated trends in defaults and loss severities for similar securities.
Loans Held for Investment
Loans that are held for investment are carried at cost, net of unamortized acquisition premiums ordiscounts, loan fees, and origination and acquisition costs as applicable, unless the loans are deemedimpaired. We evaluate each loan classified as held for investment for impairment at least quarterly.Impairment occurs when it is deemed probable that we will not be able to collect all amounts dueaccording to the contractual terms of the loan. If a loan is considered to be impaired, we record anallowance to reduce the carrying value of the loan to the present value of expected future cash flowsdiscounted at the loan’s contractual effective rate or the fair value of the collateral, if repayment isexpected solely from the collateral.
Our loans are typically collateralized by real estate. As a result, we regularly evaluate the extentand impact of any credit deterioration associated with the performance and/or value of the underlyingcollateral property, as well as the financial and operating capability of the borrower. Specifically, aproperty’s operating results and any cash reserves are analyzed and used to assess (i) whether cashfrom operations are sufficient to cover the debt service requirements currently and into the future,(ii) the ability of the borrower to refinance the loan, and/or (iii) the property’s liquidation value. Wealso evaluate the financial wherewithal of any loan guarantors as well as the borrower’s competency inmanaging and operating the properties. In addition, we consider the overall economic environment,real estate sector, and geographic sub-market in which the borrower operates. Such impairmentanalyses are completed and reviewed by asset management and finance personnel, who utilize variousdata sources, including (i) periodic financial data such as property occupancy, tenant profile, rentalrates, operating expenses, the borrower’s exit plan, and capitalization and discount rates, (ii) siteinspections, and (iii) current credit spreads and discussions with market participants.
Loans Held for Sale
Loans that we intend to sell or liquidate in the short-term are classified as held-for-sale and arecarried at the lower of amortized cost or fair value, unless we have elected to record the loans at fairvalue at the time they were acquired under Financial Accounting Standards Board (‘‘FASB’’) ASC 825,Financial Instruments. Refer to Note 13 to the consolidated financial statements for further disclosureregarding loans held-for-sale.
Residential Real Estate
We account for real estate at cost less accumulated depreciation and amortization. We computedepreciation using the straight-line method over the estimated useful lives of the assets. We depreciaterental real estate over periods up to 30 years. Real estate in development is related to the developmentof property (including land) and assets that have not yet been placed in service for our intended use.Depreciation for furniture and fixtures commences once it is placed in service and depreciation for
94

Starwood Property Trust, Inc. and Subsidiaries
Notes to Consolidated Financial Statements (Continued)
As of December 31, 2012
2. Summary of Significant Accounting Policies (Continued)
buildings and leasehold improvements commences once they are ready for our intended use. Wedepreciate furniture and fixtures over periods up to 5 years. We depreciate lease hold improvementsover the greater of 15 year or the remaining depreciable life of the asset it improved. Land is notdepreciated.
U.S. Treasury Securities Sold Short
In February 2011, in order to hedge the impact of interest rate increases on the fair value of ourRMBS portfolio, we took short positions on U.S. Treasury securities with durations similar to thoseexpected within our RMBS portfolio. To execute our hedging strategy, we sold to a third party$112.7 million in U.S. Treasury securities that were simultaneously borrowed from our prime broker.The entire cash sale proceeds from the third party were then immediately deposited with our primebroker as collateral for the U.S. Treasury securities borrowing. On March 31, 2011, we purchased froma third party the same series of U.S. Treasury securities that had been borrowed. The securities werethen immediately delivered to the prime broker in repayment of the securities borrowing, therebysettling the short position. We realized a gain from this strategy of approximately $122 thousand, whichis comprised of the $194 thousand favorable movement in the prices of U.S. Treasury securities (fromour short position), offset by $72 thousand of interest that accrued on the securities during the term ofthe borrowing and transaction costs. For the year ended December 31, 2012 we had no short positionson U.S. Treasury securities.
Revenue Recognition
Interest income is accrued based on the outstanding principal amount and contractual terms of ourloans and securities. Discounts or premiums associated with the purchase of loans and investmentsecurities are amortized or accreted into interest income as a yield adjustment on the effective interestmethod, based on expected cash flows through the expected maturity date of the investment. On atleast a quarterly basis, we review and, if appropriate, make adjustments to our cash flow projections.We have historically collected, and expect to continue to collect, all contractual amounts due on ourloans and CMBS, and non-credit deteriorated RMBS. As a result, we do not adjust the projected cashflows to reflect anticipated credit losses for these types of investments. Conversely, the majority of ourRMBS have been purchased at a discount to par value, and we did not expect to collect all amountscontractually due at the time we acquired the securities. Accordingly, we expect that a portion of thepurchase discount will not be recognized as interest income, and is instead viewed as a non-accretableyield. The amount considered as non-accretable yield may change over time based on the actualperformance of these securities, their underlying collateral, actual and projected cash flow from suchcollateral, economic conditions and other factors. If the performance of a credit deteriorated security ismore favorable than forecasted, we will generally accrete more credit discount into interest incomethan initially or previously expected. These adjustments are made prospectively beginning in the periodsubsequent to the determination that a favorable change in performance is projected. Conversely, if theperformance of a credit deteriorated security is less favorable than forecasted, an other-than-temporaryimpairment may be taken, and the amount of discount accreted into income will generally be less thanpreviously expected.
For loans that we have not elected to record at fair value under FASB ASC 825, origination feesand direct loan origination costs are also recognized in interest income over the loan term as a yield
95

Starwood Property Trust, Inc. and Subsidiaries
Notes to Consolidated Financial Statements (Continued)
As of December 31, 2012
2. Summary of Significant Accounting Policies (Continued)
adjustment using the effective interest method. When we elect to record a loan at fair value,origination fees and direct loan costs are recorded directly in income and are not deferred.
Upon the sale of loans or securities, the excess (or deficiency) of net proceeds over the netcarrying value of such loans or securities is recognized as a realized gain (or loss).
Rental income attributable to residential leases is recorded when due from tenants, whichapproximates the amount that would result from straight-lining rents over the lease term. The initialterm of our residential leases is generally one year, with renewals upon consent of both parties on anannual or monthly basis.
Investments in Unconsolidated Entities
We own non-controlling equity interests in various privately-held partnerships and limited liabilitycompanies. We use the cost method to account for investments when we (i) own five percent or less ofand (ii) do not have significant influence over the underlying investees. We use the equity method toaccount for all other non-controlling interests in partnerships and limited liability companies. Costmethod investments are initially recorded at cost and income is generally recorded when distributionsare received. Equity method investments are initially recorded at cost and subsequently adjusted for ourshare of income or loss, as well as contributions made or distributions received.
Investments in unconsolidated entities are reviewed for impairment whenever events or changes incircumstances indicate that the carrying amount may not be recoverable. An impairment loss ismeasured based on the excess of the carrying amount of an investment over its estimated fair value.Impairment analyses are based on current plans, intended holding periods and available information atthe time the analyses are prepared.
We also own publicly-traded equity securities of certain companies in the real estate industry. Forpublicly-traded companies where we have virtually no influence over the activities of these companiesand minimal ownership percentages the investments are classified as available-for-sale and reported atfair value in the balance sheet, with unrealized gains and losses reported as a component of othercomprehensive income (loss). For publicly-traded securities where we have the ability to exercisesignificant influence, but not control, over underlying investees, we have elected the fair value reportingoption and assets are reported at fair value on the balance sheet with unrealized gains and lossesreported in earnings. Dividends on our available-for-sale equity securities are recorded in the statementof operations on the record date.
Securitization/Sale and Financing Arrangements
We periodically sell our financial assets, such as commercial mortgage loans, CMBS and otherassets. In connection with these transactions, we may retain or acquire senior or subordinated interestsin the related assets. Gains and losses on such transactions are recognized using the guidance in ASC860-Transfers and Servicing, which is based on a financial components approach that focuses on control.Under this approach, after a transfer of financial assets that meets the criteria for treatment as a sale—legal isolation, ability of transferee to pledge or exchange the transferred assets without constraint, andtransferred control—an entity recognizes the financial assets it retains and any liabilities it has incurred,derecognizes the financial assets it has sold, and derecognizes liabilities when extinguished. Wedetermine the gain or loss on sale of mortgage loans by allocating the carrying value of the underlying
96

Starwood Property Trust, Inc. and Subsidiaries
Notes to Consolidated Financial Statements (Continued)
As of December 31, 2012
2. Summary of Significant Accounting Policies (Continued)
mortgage between securities or loans sold and the interests retained based on their fair values, asapplicable. The gain or loss on sale is the difference between the cash proceeds from the sale and theamount allocated to the securities or loans sold.
Acquisition and Investment Pursuit Costs
Net costs incurred in connection with acquiring investments, as well as in pursuing unsuccessfulinvestment acquisitions and loan originations, are charged to current earnings and not deferred.
Foreign Currency Transactions
Our assets and liabilities denominated in foreign currencies are translated into U.S. dollars usingforeign currency exchange rates at the end of the reporting period. Income and expenses are translatedat the weighted-average exchange rates for each reporting period. As of December 31, 2012 andDecember 31, 2011, the U.S. dollar was the functional currency of all investments denominated inforeign currencies. The effects of translating the assets and any liabilities of our foreign investments areincluded in unrealized foreign currency remeasurement gain (loss) in the statements of operations.
Concentration of Credit Risk
Financial instruments that potentially subject us to concentrations of credit risk consist primarily ofcash investments, CMBS, RMBS, loan investments and interest receivable. We may place cashinvestments in excess of insured amounts with high quality financial institutions. We perform anongoing analysis of credit risk concentrations in its investment portfolio by evaluating exposure tovarious counterparties markets, underlying property types, contract terms, tenant mix and other creditmetrics.
Derivative Instruments and Hedging Activities
GAAP provides the disclosure requirements for derivatives and hedging activities with the intent toprovide users of financial statements with an enhanced understanding of (a) how and why an entityuses derivative instruments, (b) how the entity accounts for derivative instruments and related hedgeditems, and (c) how derivative instruments and related hedged items affect an entity’s financial position,financial performance, and cash flows. Further, we must provide qualitative disclosures that explain ourobjectives and strategies for using derivatives, as well as quantitative disclosures about the fair value ofand gains and losses on derivative instruments, and disclosures about credit-risk-related contingentfeatures in derivative instruments.
We record all derivatives in the balance sheet at fair value. The accounting for changes in the fairvalue of derivatives depends on the intended use of the derivative, whether we have elected todesignate a derivative in a hedging relationship and have satisfied the criteria necessary to apply hedgeaccounting under GAAP. Derivatives designated and qualifying as a hedge of the exposure to changesin the fair value of an asset, liability, or firm commitment attributable to a particular risk, such asinterest rate risk, are considered fair value hedges. Derivatives designated and qualifying as a hedge ofthe exposure to variability in expected future cash flows, or other types of forecasted transactions, areconsidered cash flow hedges. Hedge accounting generally provides for the matching of the timing ofgain or loss recognition on the hedging instrument with the recognition of the changes in the fair value
97

Starwood Property Trust, Inc. and Subsidiaries
Notes to Consolidated Financial Statements (Continued)
As of December 31, 2012
2. Summary of Significant Accounting Policies (Continued)
of the hedged asset or liability that are attributable to the hedged risk in a fair value hedge or theearnings effect of the hedged forecasted transactions in a cash flow hedge. We regularly enter intoderivative contracts that are intended to economically hedge certain of our risks, even though thetransactions may not qualify for, or we may not elect to pursue, hedge accounting. In such cases,changes in the fair value of the derivatives are recorded in earnings.
Deferred Financing Costs
Costs incurred in connection with obtaining secured financing arrangements are capitalized andamortized over the respective loan terms of the respective facilities as a component of interest expense.As of December 31, 2012, 2011, and 2010, we had approximately $7.8 million, $5.0 million, and$4.1 million, respectively, of capitalized financing costs, net of amortization. For the years endedDecember 31, 2012, 2011, and 2010, approximately $5.7 million, $3.8 million, and $0.6 million,respectively, of amortization was included in interest expense on the consolidated statements ofoperations.
Earnings Per Share
We calculate basic earnings per share by dividing net income attributable to the Company for theperiod by the weighted-average of shares of common stock outstanding for that period afterconsideration of the earnings allocated to our restricted stock and restricted stock units, which areparticipating securities as defined in GAAP. Diluted earnings per share takes into effect any dilutiveinstruments, such as restricted stock and restricted stock units, except when doing so would beanti-dilutive.
Share-based Payments
We recognize the cost of share-based compensation and payment transactions using the sameexpense category as would be charged for payments in cash. The fair value of the restricted stock orrestricted stock units granted is recorded to expense on a straight-line basis over the vesting period forthe award, with an offsetting increase in stockholders’ equity. For grants to employees and directors,the fair value is determined based upon the stock price on the grant date. For non-employee grants,the fair value is based on the stock price when the shares vest, which requires the amount to beadjusted in each subsequent reporting period based on the fair value of the award at the end of thereporting period until the award has vested.
Income Taxes
We have elected to be taxed as a REIT and intend to comply with the Code with respect thereto.Accordingly, we will not be subject to federal income tax as long as certain asset, income, dividenddistribution and stock ownership tests are met. Many of these requirements are technical and complexand if we fail to meet these requirements we may be subject to federal, state, and local income tax andpenalties. A REIT’s net income from prohibited transactions is subject to a 100% penalty tax. We haveseven taxable REIT subsidiaries (‘‘the TRSs’’) where certain investments may be made and activitiesconducted that (i) may have otherwise been subject to the prohibited transactions tax and (ii) may notbe favorably treated for purposes of complying with the various requirements for REIT qualification.The income, if any, within the TRSs is subject to federal and state income taxes as a domestic C
98

Starwood Property Trust, Inc. and Subsidiaries
Notes to Consolidated Financial Statements (Continued)
As of December 31, 2012
2. Summary of Significant Accounting Policies (Continued)
corporation based upon the TRSs’ net income. During 2012, we recorded a provision for income taxesof $1.0 million related to the activities in our TRSs. These provisions were determined using a Federalincome tax rate of 34% and state income tax rate of 7.5%. During 2011, we recorded a provision forincome taxes of $0.8 million related to the activities in our TRSs. These provisions were determinedusing a Federal income tax rate of 34% and state income tax rate of 7.5%. During 2010, we recorded aprovision for income taxes of $0.4 million related to the activities in our TRSs, based on a Federalincome tax rate of 33% and state income tax rate of 7.5%.
Underwriting Commissions and Offering Costs
Underwriting and offering costs related to our equity offering activities, which consist primarily ofour equity offerings in April and early October 2012 as well as our at-the-market offering program(refer to disclosure in Note 10), aggregated $2.0 million for 2012, totaled approximately $1.1 million inconnection with our supplemental equity offering in May 2011, and approximately $19.0 million inconnection with the supplemental equity offering in December 2010. Underwriting and offering costsare reflected as a reduction in additional paid-in capital in the Consolidated Statements of Equity.
Recent Accounting Pronouncements
In December 2011, the FASB issued amended guidance which will enhance disclosures required byU.S. GAAP by requiring improved information about financial instruments and derivative instrumentsthat are either (1) offset or (2) subject to an enforceable master netting arrangement or similaragreement, irrespective of whether they are offset. This information will enable users of an entity’sfinancial statements to evaluate the effect or potential effect of netting arrangements on an entity’sfinancial position, including the effect or potential effect of rights of setoff associated with certainfinancial instruments and derivative instruments. The company will be required to apply theamendments beginning on January 1, 2013. We are in the process of evaluating the impact that thisguidance will have on the consolidated financial statement disclosures.
3. Debt Securities
We classified all CMBS and RMBS investments as available-for-sale as of December 31, 2012 andDecember 31, 2011. The CMBS and RMBS classified as available-for-sale are reported at fair value inthe balance sheets with changes in fair value recorded in accumulated other comprehensive (loss)income. The tables below summarize various attributes of our investments in mortgage backedsecurities (‘‘MBS’’) available-for-sale as of December 31, 2012 and December 31, 2011 (amounts inthousands):
Unrealized Gains or (Losses) Recognized inAccumulated Other Comprehensive (Loss) Income
Purchase Recorded NetAmortized Credit Amortized Non-Credit Unrealized Unrealized Fair Value
December 31, 2012 Cost OTTI Cost OTTI Gains Losses Adjustment Fair Value
CMBS . . . . . . . . . . . $498,064 $ — $498,064 $— $31,370 $ — $31,370 $529,434RMBS . . . . . . . . . . . 293,321 (10,194) 283,127 — 50,717 (691) 50,026 333,153
Total . . . . . . . . . . . $791,385 $(10,194) $781,191 $— $82,087 $(691) $81,396 $862,587
99

Starwood Property Trust, Inc. and Subsidiaries
Notes to Consolidated Financial Statements (Continued)
As of December 31, 2012
3. Debt Securities (Continued)
WeightedAverage
Weighted Weighted LifeAverage Average (‘‘WAL’’)
December 31, 2012 Coupon(1) Rating (Years)(3)
CMBS . . . . . . . . . . . . . . . . . . . . . . . . . . . . . . . . . 4.3% BB�(2) 3.3RMBS . . . . . . . . . . . . . . . . . . . . . . . . . . . . . . . . . 1.1% CCC� 5.4
(1) Calculated using the December 31, 2012 one-month LIBOR rate of 0.2087% for floatingrate securities.
(2) Approximately 20.4% of the CMBS securities are rated BB+. The remaining 79.6% aresecurities where the obligors are certain special purpose entities that were formed to holdsubstantially all of the assets of a worldwide operator of hotels, resorts and timeshareproperties; the securities are not rated but the loan-to-value ratio was estimated to be inthe range of 39%-44% at December 31, 2012.
(3) Represents the WAL of each respective group of MBS. The WAL of each individualsecurity or loan is calculated as a fraction, the numerator of which is the sum of thetiming (in years) of each expected future principal payment multiplied by the balance ofthe respective payment, and with a denominator equal to the sum of the expectedprincipal payments. This calculation was made as of December 31, 2012. Assumptions forthe calculation of the WAL are adjusted as necessary for changes in projected principalrepayments and/or maturity dates of the security.
Unrealized Gains or (Losses) Recognized inAccumulated Other Comprehensive (Loss) Income
Purchase Recorded NetAmortized Credit Amortized Non-Credit Unrealized Unrealized Fair Value
December 31, 2011 Cost OTTI Cost OTTI Gains Losses Adjustment Fair Value
CMBS . . . . . . . . . . . $177,353 $ — $177,353 $ — $ — $ (567) $ (567) $176,786RMBS . . . . . . . . . . . 170,424 (6,001) 164,423 (1,310) 3,367 (1,532) 525 164,948
Total . . . . . . . . . . . $347,777 $ (6,001) $341,776 $(1,310) $ 3,367 $(2,099) $ (42) $341,734
WeightedAverage
Weighted Weighted LifeAverage Average (‘‘WAL’’)
December 31, 2011 Coupon(1) Rating (Years)(3)
CMBS . . . . . . . . . . . . . . . . . . . . . . . . . . . . . . . . . . 2.1% NR(2) 3.5RMBS . . . . . . . . . . . . . . . . . . . . . . . . . . . . . . . . . . 1.0% B� 4.8
(1) Calculated using the December 31, 2011 one-month LIBOR rate of 0.2953% for floatingrate securities.
(2) Represents securities where the obligors are certain special purpose entities that wereformed to hold substantially all of the assets of a worldwide operator of hotels, resortsand timeshare properties; the securities are not rated but the loan-to-value ratio wasestimated to be in the range of 39%-44% at December 31, 2011.
100

Starwood Property Trust, Inc. and Subsidiaries
Notes to Consolidated Financial Statements (Continued)
As of December 31, 2012
3. Debt Securities (Continued)
(3) Represents the WAL of each respective group of MBS. The WAL of each individualsecurity or loan is calculated as a fraction, the numerator of which is the sum of thetiming (in years) of each expected future principal payment multiplied by the balance ofthe respective payment, and with a denominator equal to the sum of the expectedprincipal payments. This calculation was made as of December 31, 2011. Assumptions forthe calculation of the WAL are adjusted as necessary for changes in projected principalrepayments and/or maturity dates of the security.
The following table contains a reconciliation of aggregate principal balance to amortized cost forour CMBS and RMBS as of December 31, 2012 and 2011 (amounts in thousands):
December 31, 2012 December 31, 2011
CMBS RMBS CMBS RMBS
Principal balance . . . . . . . . . . . . . . . . . . . . . . . . . . . . . . $519,575 $ 489,218 $195,842 $263,923
Accretable yield . . . . . . . . . . . . . . . . . . . . . . . . . . . . . . (21,511) (108,486) (18,489) (44,604)Non-accretable difference . . . . . . . . . . . . . . . . . . . . . . . — (97,605) — (54,896)
Total discount . . . . . . . . . . . . . . . . . . . . . . . . . . . . . . . . (21,511) (206,091) (18,489) (99,500)
Amortized cost . . . . . . . . . . . . . . . . . . . . . . . . . . . . . . . $498,064 $ 283,127 $177,353 $164,423
The principal balance of credit deteriorated RMBS was $438.0 million and $213.3 million as ofDecember 31, 2012 and 2011, respectively. Accretable yield related to these securities totaled$93.6 million and $32.8 million, as of December 31, 2012 and 2011, respectively.
The following table discloses the changes to accretable yield and non-accretable difference for ourCMBS and RMBS during the year ended December 31, 2012:
For the Year Ended December 31, 2012
Non-AccretableAccretable Yield Difference
CMBS RMBS CMBS RMBS
Balance as of December 31, 2011 . . . . . . . . . . . . . . . . . . . . $ 18,489 $ 44,604 $— $ 54,896Accretion of discount . . . . . . . . . . . . . . . . . . . . . . . . . . . . (15,884) (18,080) — —Principal write-downs . . . . . . . . . . . . . . . . . . . . . . . . . . . . — — — (2,040)Purchases and transfers . . . . . . . . . . . . . . . . . . . . . . . . . . . 30,374 75,918 — 80,926Sales . . . . . . . . . . . . . . . . . . . . . . . . . . . . . . . . . . . . . . . . (11,468) (27,048) — (7,487)Net OTTI . . . . . . . . . . . . . . . . . . . . . . . . . . . . . . . . . . . . . — 4,402 — —Transfer to/from non-accretable difference . . . . . . . . . . . . . — 28,690 — (28,690)
Balance as of December 31, 2012 . . . . . . . . . . . . . . . . . . . . $ 21,511 $108,486 $— 97,605
101

Starwood Property Trust, Inc. and Subsidiaries
Notes to Consolidated Financial Statements (Continued)
As of December 31, 2012
3. Debt Securities (Continued)
During the year ended December 31, 2012, the purchases and sales trades executed, as well as theprincipal payments received, were as follows (amounts in thousands):
RMBS CMBS
Purchases . . . . . . . . . . . . . . . . . . . . . . . . . . . . . . . . . . . . . . . $254,035 $372,252Sales/Maturities . . . . . . . . . . . . . . . . . . . . . . . . . . . . . . . . . . 87,957 173,334Principal payments received . . . . . . . . . . . . . . . . . . . . . . . . . 69,298 19,836
During the year ended December 31, 2011, the purchases and sales trades executed, as well as theprincipal payments received, were as follows (amounts in thousands):
RMBS CMBS
Purchases . . . . . . . . . . . . . . . . . . . . . . . . . . . . . . . . . . . . . . . $161,204 $ —Sales/Maturities . . . . . . . . . . . . . . . . . . . . . . . . . . . . . . . . . . 53,529 238,739Principal payments received . . . . . . . . . . . . . . . . . . . . . . . . . 69,466 44,449
During the year ended December 31, 2010, the purchases and sales trades executed, as well as theprincipal payments received, were as follows (amounts in thousands):
RMBS CMBS
Purchases . . . . . . . . . . . . . . . . . . . . . . . . . . . . . . . . . . . . . . . $185,962 $18,547Sales/Maturities . . . . . . . . . . . . . . . . . . . . . . . . . . . . . . . . . . . 41,690 —Principal payments received . . . . . . . . . . . . . . . . . . . . . . . . . . 38,472 366
During the year ended December 31, 2012, we sold a CMBS position with aggregate grossproceeds of $173.3 million ($74.6 million after repaying related financing), which generated gains ofapproximately $8.3 million.
During the year ended December 31, 2011, we sold various CMBS positions with aggregate grossproceeds of $211.6 million ($74.0 million after repaying related financing), which generated gains ofapproximately $10.0 million. Additionally, $27.1 million of our CMBS portfolio matured and was paidoff during the year ended December 31, 2011.
During the year ended December 31, 2010, we sold various MBS positions with aggregate grossproceeds of $41.7 million, which generated gains of approximately $2.1 million.
Within the hospitality sector, as of December 31, 2012 we had an aggregate investment of$421.2 million in senior debt secured by substantially all of the assets of a worldwide operator of hotels,resorts and timeshare properties. As of March 31, 2012, the debt investment was comprised of$115.1 million in loans and $387.6 million in securities. On April 16, 2012 the remaining $115.1 millionof loans were converted to securities. On August 23, 2012 we sold $165.0 million of these CMBSresulting in a gain of $8.2 million. As of December 31, 2012, the aggregate face value of $421.8 millionrepresented 5.8% of the total face value of this operator’s senior debt outstanding, and the aggregatecarrying value of our investment represented 9.7% of our total assets.
In June 2011, we exercised a pre-existing right to convert one of our loans into a CMBS in orderto maximize the investment’s liquidity. As a result, we reclassified the loan, which had a carrying
102
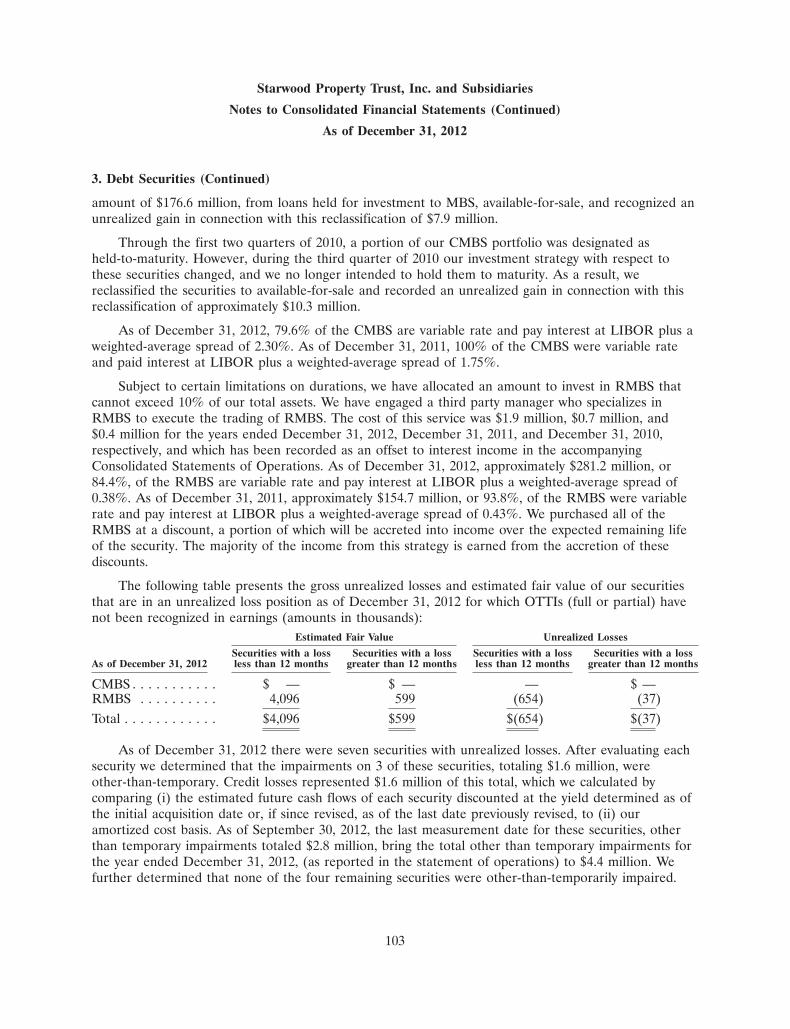
Starwood Property Trust, Inc. and Subsidiaries
Notes to Consolidated Financial Statements (Continued)
As of December 31, 2012
3. Debt Securities (Continued)
amount of $176.6 million, from loans held for investment to MBS, available-for-sale, and recognized anunrealized gain in connection with this reclassification of $7.9 million.
Through the first two quarters of 2010, a portion of our CMBS portfolio was designated asheld-to-maturity. However, during the third quarter of 2010 our investment strategy with respect tothese securities changed, and we no longer intended to hold them to maturity. As a result, wereclassified the securities to available-for-sale and recorded an unrealized gain in connection with thisreclassification of approximately $10.3 million.
As of December 31, 2012, 79.6% of the CMBS are variable rate and pay interest at LIBOR plus aweighted-average spread of 2.30%. As of December 31, 2011, 100% of the CMBS were variable rateand paid interest at LIBOR plus a weighted-average spread of 1.75%.
Subject to certain limitations on durations, we have allocated an amount to invest in RMBS thatcannot exceed 10% of our total assets. We have engaged a third party manager who specializes inRMBS to execute the trading of RMBS. The cost of this service was $1.9 million, $0.7 million, and$0.4 million for the years ended December 31, 2012, December 31, 2011, and December 31, 2010,respectively, and which has been recorded as an offset to interest income in the accompanyingConsolidated Statements of Operations. As of December 31, 2012, approximately $281.2 million, or84.4%, of the RMBS are variable rate and pay interest at LIBOR plus a weighted-average spread of0.38%. As of December 31, 2011, approximately $154.7 million, or 93.8%, of the RMBS were variablerate and pay interest at LIBOR plus a weighted-average spread of 0.43%. We purchased all of theRMBS at a discount, a portion of which will be accreted into income over the expected remaining lifeof the security. The majority of the income from this strategy is earned from the accretion of thesediscounts.
The following table presents the gross unrealized losses and estimated fair value of our securitiesthat are in an unrealized loss position as of December 31, 2012 for which OTTIs (full or partial) havenot been recognized in earnings (amounts in thousands):
Estimated Fair Value Unrealized Losses
Securities with a loss Securities with a loss Securities with a loss Securities with a lossAs of December 31, 2012 less than 12 months greater than 12 months less than 12 months greater than 12 months
CMBS . . . . . . . . . . . $ — $ — — $ —RMBS . . . . . . . . . . 4,096 599 (654) (37)Total . . . . . . . . . . . . $4,096 $599 $(654) $(37)
As of December 31, 2012 there were seven securities with unrealized losses. After evaluating eachsecurity we determined that the impairments on 3 of these securities, totaling $1.6 million, wereother-than-temporary. Credit losses represented $1.6 million of this total, which we calculated bycomparing (i) the estimated future cash flows of each security discounted at the yield determined as ofthe initial acquisition date or, if since revised, as of the last date previously revised, to (ii) ouramortized cost basis. As of September 30, 2012, the last measurement date for these securities, otherthan temporary impairments totaled $2.8 million, bring the total other than temporary impairments forthe year ended December 31, 2012, (as reported in the statement of operations) to $4.4 million. Wefurther determined that none of the four remaining securities were other-than-temporarily impaired.
103

Starwood Property Trust, Inc. and Subsidiaries
Notes to Consolidated Financial Statements (Continued)
As of December 31, 2012
3. Debt Securities (Continued)
We considered a number of factors in reaching this conclusion, including that we did not intend to sellany individual security, it was not considered more likely than not that we would be forced to sell anyindividual security prior to recovering our amortized cost, and there were no material credit events thatwould have caused us to otherwise conclude that we would not recover our cost. Significant judgment isrequired is used in projecting cash flows for our non-agency RMBS. As a result, actual income and/orimpairments could be materially different from what is currently projected and/or reported.
The following table presents the gross unrealized losses and estimated fair value of our securitiesthat were in an unrealized loss position as of December 31, 2011 for which OTTIs (full or partial) havenot been recognized in earnings (amounts in thousands):
Estimated Fair Value Unrealized Losses
Securities with a loss Securities with a loss Securities with a loss Securities with a lossAs of December 31, 2011 less than 12 months greater than 12 months less than 12 months greater than 12 months
CMBS . . . . . . . . . . . $176,786 $ — $ (567) $ —RMBS . . . . . . . . . . 70,103 2,684 (2,444) (399)Total . . . . . . . . . . . . $246,889 $2,684 $(3,011) $(399)
As of December 31, 2011 there were 42 securities with unrealized losses. After evaluating eachsecurity we determined that the impairments on 25 of these securities, all of which are non-agency andwhose impairments totaled $4.7 million, were other-than-temporary. Credit losses represented$3.4 million of this total, which we calculated by comparing (i) the estimated future cash flows of eachsecurity discounted at the yield determined as of the initial acquisition date or, if since revised, as ofthe last date previously revised, to (ii) our amortized cost basis. For the year ended December 31, 2011,our aggregate MBS credit losses (as reported in the statement of operations) were $6.0 million. Wefurther determined that none of the 17 remaining securities were other-than-temporarily impaired. Weconsidered a number of factors in reaching this conclusion, including that we did not intend to sell anyindividual security, it was not considered more likely than not that we would be forced to sell anyindividual security prior to recovering our amortized cost, and there were no material credit events thatwould have caused us to otherwise conclude that we would not recover our cost. Significant judgment isrequired is used in projecting cash flows for our non-agency RMBS. As a result, actual income and/orimpairments could be materially different from what is currently projected and/or reported.
4. Loans
Our loans held-for-investment are accounted for at amortized cost and the loans held-for-sale areaccounted for at the lower of cost or fair value, unless we elect to record such loans at fair value. The
104

Starwood Property Trust, Inc. and Subsidiaries
Notes to Consolidated Financial Statements (Continued)
As of December 31, 2012
4. Loans (Continued)
following table summarizes our investments in loans by subordination class as of December 31, 2012and December 31, 2011 (amounts in thousands):
WeightedCarrying Face Average WAL
December 31, 2012 Value Amount Coupon (years)(2)
First mortgages . . . . . . . . . . . . . . . . . $1,461,666 $1,502,382 6.2% 3.8Subordinated mortgages(1) . . . . . . . . . 397,159 430,444 9.8% 4.0Mezzanine loans . . . . . . . . . . . . . . . . 1,057,670 1,079,897 10.3% 3.6Total loans held for investment . . . . . . 2,916,495 3,012,723Loans held in securitization trust . . . . 85,901 86,337 4.7% 3.2
Total gross loans . . . . . . . . . . . . . . . 3,002,396 3,099,060Loan loss allowance . . . . . . . . . . . . . . (2,061) —
Total net loans . . . . . . . . . . . . . . . . $3,000,335 $3,099,060
WeightedCarrying Face Average WAL
December 31, 2011 Value Amount Coupon (years)(2)
First mortgages . . . . . . . . . . . . . . . . . $1,202,611 $1,248,549 6.6% 3.2Subordinated mortgages(1) . . . . . . . . . 437,163 487,175 7.4% 4.1Mezzanine loans . . . . . . . . . . . . . . . . 628,825 642,831 8.4% 3.0Total loans held for investment . . . . . . 2,268,599 2,378,555First mortgages held for sale at fair
value . . . . . . . . . . . . . . . . . . . . . . . 128,593 122,833 5.9% 8.9Loans held in securitization trust . . . . 50,316 50,632 5.0% 3.7
Total gross loans . . . . . . . . . . . . . . . $2,447,508 $2,552,020
Loan loss allowance . . . . . . . . . . . . . . — —
Total net loans . . . . . . . . . . . . . . . . $2,447,508 $2,552,020
(1) Subordinated mortgages include (i) subordinated mortgages that we retain after havingsold first mortgage positions related to the same collateral, (ii) B-Notes, and(iii) subordinated loan participations.
(2) Represents the WAL of each respective group of loans. The WAL of each individual loanis calculated as a fraction, the numerator of which is the sum of the timing (in years) ofeach expected future principal payment multiplied by the balance of the respectivepayment, and with a denominator equal to the sum of the expected principal payments.This calculation was made as of December 31, 2012 and December 31, 2011. Assumptionsfor the calculation of the WAL are adjusted as necessary for changes in projectedprincipal repayments and/or maturity dates of the loan.
As of December 31, 2012, approximately $1.9 billion, or 63.9% of the loans were variable rate andpay interest at LIBOR plus a weighted-average spread of 6.06%. Of the floating rate loans,$674.3 million pay interest using one-month LIBOR (0.2087%), $93.2 million pay interest usingone-month Citibank LIBOR (0.1900%), $7.2 million pay interest using three-month Citibank LIBOR
105

Starwood Property Trust, Inc. and Subsidiaries
Notes to Consolidated Financial Statements (Continued)
As of December 31, 2012
4. Loans (Continued)
(0.3000%) and $1.1 billion pay interest using a LIBOR floor (0.5%-2.0%). As of December 31, 2011,approximately $1.1 billion, or 45.2% of the loans were variable rate and pay interest at LIBOR plus aweighted-average spread of 4.33%. Of the floating rate loans, $264.0 million pay interest usingone-month LIBOR (0.2953%) and $143.4 million pay interest using three-month LIBOR (0.5810%).
As described in Note 2, we evaluate each of our loans for impairment at least quarterly. Our loansare typically collateralized by real estate. As a result, we regularly evaluate the extent and impact ofany credit deterioration associated with the performance and/or value of the underlying collateralproperty, as well as the financial and operating capability of the borrower. Specifically, a property’soperating results and any cash reserves are analyzed and used to assess (i) whether cash flow fromoperations is sufficient to cover the debt service requirements currently and into the future, (ii) theability of the borrower to refinance the loan at maturity, and/or (iii) the property’s liquidation value.We also evaluate the financial wherewithal of any loan guarantors as well as the borrower’s competencyin managing and operating the properties. In addition, we consider the overall economic environment,real estate sector, and geographic sub-market in which the borrower operates. Such impairmentanalyses are completed and reviewed by asset management and finance personnel who utilize variousdata sources, including (i) periodic financial data such as property operating statements, occupancy,tenant profile, rental rates, operating expenses, the borrower’s exit plan, and capitalization and discountrates, (ii) site inspections, and (iii) current credit spreads and discussions with market participants.
Our evaluation process as described above produces an internal risk rating between 1 and 5, whichis a weighted-average of the numerical ratings in the following categories: (i) sponsor capability andfinancial condition, (ii) loan and collateral performance relative to underwriting, (iii) quality andstability of collateral cash flows, and (iv) loan structure. We utilize the overall risk ratings as a concisemeans to monitor any credit migration on a loan as well as on the whole portfolio. While the overallrisk rating is generally not the sole factor we use in determining whether a loan is impaired, a loanwith a higher overall risk rating would tend to have more adverse indicators of impairment, andtherefore would be more likely to experience a credit loss.
The rating categories generally include the characteristics described below, but these are utilized asguidelines and therefore not every loan will have all of the characteristics described in each category:
Rating Characteristics
1 • Sponsor capability and financial condition—Sponsor is highly rated or investment grade or, ifprivate, the equivalent thereof with significant management experience.
• Loan collateral and performance relative to underwriting—The collateral has surpassedunderwritten expectations.
• Quality and stability of collateral cash flows—Occupancy is stabilized, the property has had ahistory of consistently high occupancy, and the property has a diverse and high quality tenantmix.
• Loan structure—Loan-to-collateral value ratio (‘‘LTV’’) does not exceed 65%. The loan hasstructural features that enhance the credit profile.
2 • Sponsor capability and financial condition—Strong sponsorship with experiencedmanagement team and a responsibly leveraged portfolio.
106

Starwood Property Trust, Inc. and Subsidiaries
Notes to Consolidated Financial Statements (Continued)
As of December 31, 2012
4. Loans (Continued)
Rating Characteristics
• Loan collateral and performance relative to underwriting—Collateral performance equals orexceeds underwritten expectations and covenants and performance criteria are being met orexceeded.
• Quality and stability of collateral cash flows—Occupancy is stabilized with a diverse tenantmix.
• Loan structure—LTV does not exceed 70% and unique property risks are mitigated bystructural features.
3 • Sponsor capability and financial condition—Sponsor has historically met its credit obligations,routinely pays off loans at maturity, and has a capable management team.
• Loan collateral and performance relative to underwriting—Property performance isconsistent with underwritten expectations.
• Quality and stability of collateral cash flows—Occupancy is stabilized, near stabilized, or ison track with underwriting.
• Loan structure—LTV does not exceed 80%.
4 • Sponsor capability and financial condition—Sponsor credit history includes missed payments,past due payment, and maturity extensions. Management team is capable but thin.
• Loan collateral and performance relative to underwriting—Property performance lags behindunderwritten expectations. Performance criteria and loan covenants have required occasionalwaivers. A sale of the property may be necessary in order for the borrower to pay off theloan at maturity.
• Quality and stability of collateral cash flows—Occupancy is not stabilized and the propertyhas a large amount of rollover.
• Loan structure—LTV is 80% to 90%.
5 • Sponsor capability and financial condition—Credit history includes defaults, deeds-in-lieu,foreclosures, and/or bankruptcies.
• Loan collateral and performance relative to underwriting—Property performance issignificantly worse than underwritten expectations. The loan is not in compliance with loancovenants and performance criteria and may be in default. Sale proceeds would not besufficient to pay off the loan at maturity.
• Quality and stability of collateral cash flows—The property has material vacancy andsignificant rollover of remaining tenants.
• Loan structure—LTV exceeds 90%.
107

Starwood Property Trust, Inc. and Subsidiaries
Notes to Consolidated Financial Statements (Continued)
As of December 31, 2012
4. Loans (Continued)
As of December 31, 2012, the risk ratings by class of loan were as follows (amounts in thousands):
Balance Sheet Classification
Loans Held LoansLoans Held for Investment for SaleRisk held inRating First Subordinated Mezzanine First SecuritizationCategory Mortgages Mortgages Loans Mortgages Trust Total
1 . . . . . $ — $ — $ — $— $ — $ —2 . . . . . 39,734 2,434 370,671 — 13,113 425,9523 . . . . . 1,350,455 363,275 679,371 — 72,788 2,465,8894 . . . . . 59,970 31,450 7,628 — — 99,0485 . . . . . 11,507 — — — — 11,507
$1,461,666 $397,159 $1,057,670 $— $85,901 $3,002,396
After completing the evaluation of each loan as described above, we concluded that no loans wereindividually impaired as of December 31, 2012. In addition, we considered whether any loans sharedspecific characteristics with other loans such that it was probable, as a group, such loans had incurredan impairment loss as of December 31, 2012 as a result of their common characteristics. Aftercompleting this analysis, we recorded an allowance for loan losses equal to (i) 1.5% of the aggregatecarrying amount of loans rated as a ‘‘4,’’ plus (ii) 5% of the aggregate carrying amount of loans ratedas a ‘‘5.’’ These groups accounted for 3.7% and 4.5% of our loan portfolio as of December 31, 2012and 2011, respectively.
For theYear Ended
December 31,2012
Reserve for loan losses at beginning of year . . . . . . . . . . . . . . . . . . . . . $ —Provision for loan losses . . . . . . . . . . . . . . . . . . . . . . . . . . . . . . . . . . . 2,061Charge-offs . . . . . . . . . . . . . . . . . . . . . . . . . . . . . . . . . . . . . . . . . . . . —Recoveries . . . . . . . . . . . . . . . . . . . . . . . . . . . . . . . . . . . . . . . . . . . . . —Reserve for loan losses at end of year . . . . . . . . . . . . . . . . . . . . . . . . . $ 2,061
Recorded investment in loans related to the allowance for loan loss . . . $110,555
As of December 31, 2011, the risk ratings by class of loan were as follows (amounts in thousands):
Balance Sheet Classification
Loans Held LoansLoans Held for Investment for SaleRisk held inRating First Subordinated Mezzanine First SecuritizationCategory Mortgages Mortgages Loans Mortgages Trust Total
1 . . . . . . $ — $ — $ — $ — $ — $ —2 . . . . . . 108,900 131,281 139,167 89,760 13,193 482,3013 . . . . . . 1,054,717 251,788 481,982 38,833 37,123 1,864,4434 . . . . . . 38,994 54,094 7,676 — — 100,7645 . . . . . . — — — — — —
$1,202,611 $437,163 $628,825 $128,593 $50,316 $2,447,508
108

Starwood Property Trust, Inc. and Subsidiaries
Notes to Consolidated Financial Statements (Continued)
As of December 31, 2012
4. Loans (Continued)
After completing the evaluation of each loan as described above, we concluded that no loans wereindividually impaired as of December 31, 2011. In addition, we considered whether any loans sharedspecific characteristics with other loans such that it was probable, as a group, such loans had incurred animpairment loss as of December 31, 2011 as a result of their common characteristic. After completingthis analysis, we determined that no allowance for loan losses was necessary as of December 31, 2011.
For the year ended December 31, 2012, the activity in our loan portfolio (including loanstransferred as secured borrowings) was as follows (amounts in thousands):
Balance January 1, 2012 . . . . . . . . . . . . . . . . . . . . . . . . . . . . . . . . . . . $2,447,508Acquisitions/originations . . . . . . . . . . . . . . . . . . . . . . . . . . . . . . . . . . . 1,739,944Additional funding . . . . . . . . . . . . . . . . . . . . . . . . . . . . . . . . . . . . . . . 13,419Capitalized interest(1) . . . . . . . . . . . . . . . . . . . . . . . . . . . . . . . . . . . . . 3,594Basis of loans sold . . . . . . . . . . . . . . . . . . . . . . . . . . . . . . . . . . . . . . . (468,079)Loan maturities . . . . . . . . . . . . . . . . . . . . . . . . . . . . . . . . . . . . . . . . . (615,227)Transfer out—loan converted to a security . . . . . . . . . . . . . . . . . . . . . . (115,100)Principal repayments . . . . . . . . . . . . . . . . . . . . . . . . . . . . . . . . . . . . . . (55,223)Discount accretion/premium amortization . . . . . . . . . . . . . . . . . . . . . . . 44,653Unrealized foreign currency remeasurement gain . . . . . . . . . . . . . . . . . 12,667Unrealized losses on loans held for sale at fair value . . . . . . . . . . . . . . . (5,760)Loan loss allowance . . . . . . . . . . . . . . . . . . . . . . . . . . . . . . . . . . . . . . (2,061)
Balance December 31, 2012 . . . . . . . . . . . . . . . . . . . . . . . . . . . . . . . . . $3,000,335
(1) Represents accrued interest income on loans whose terms do not require current paymentof interest.
As disclosed above, we acquired or originated $1.7 billion in loans for the year endedDecember 31, 2012, which included: (i) a $125.0 million participation in a senior loan, converted to aCMBS in the second quarter, secured by all the material assets of a worldwide operator of hotels,resorts, and timeshare properties for a discounted purchase price of $115.7 million; (ii) an originationof a $63.0 million first mortgage, of which $59.0 million was funded at closing, collateralized by 10office buildings located in California; (iii) an origination of a $40.0 million mezzanine loan secured by a10-property portfolio of full-service and extended-stay hotels located in eight different states; (iv) anorigination of a $73.0 million junior mezzanine loan, of which $45.0 million was initially funded,collateralized by six office buildings in Virginia; (v) an origination of a $170.0 million first mortgageloan, of which $135.0 million was initially funded, collateralized by two office buildings in midtownManhattan; (vi) an origination of a $30.0 million mezzanine loan collateralized by an office building inPennsylvania; (vii) an origination of a $51.5 million first mortgage collateralized by three hotels inNorth Carolina, New Jersey, and Virginia; (viii) a purchase of a 50% undivided participation interest ina EUR-denominated mezzanine loan for $68.4 million, collateralized by three hotels in France andGermany; (ix) an acquisition of a $250.0 million participation in a mezzanine loan at a discounted priceof $233.75 million, secured by indirect equity interests in subsidiaries that own substantially all theassets of a worldwide operator of hotels, resorts and timeshare properties; (x) an origination of a$46.0 million first mortgage collateralized by a 351 key hotel in Maryland; (xi) an origination of a
109

Starwood Property Trust, Inc. and Subsidiaries
Notes to Consolidated Financial Statements (Continued)
As of December 31, 2012
4. Loans (Continued)
$61.0 million first mortgage, of which $48.5 million was funded at closing, collateralized by two officebuildings in California; (xii) an origination of a $475.0 million first mortgage and mezzanine loan, ofwhich $375.0 million was initially funded, for the acquisition and redevelopment of a ten story retailbuilding in Manhattan (refer to Note 9 to the consolidated financial statements for disclosure regardingrelated-party nature and accounting treatment); and (xiii) an origination of a $115.5 million firstmortgage secured by the fee interests in a 25 story Class A office tower located in San Francisco, CA.
For the year ended December 31, 2011, the activity in our loan portfolio (including loansheld-for-sale) was as follows (amounts in thousands):
Balance January 1, 2011 . . . . . . . . . . . . . . . . . . . . . . . . . . . . . . . . . . . $1,425,243Acquisitions/originations . . . . . . . . . . . . . . . . . . . . . . . . . . . . . . . . . . . 1,782,964Additional funding . . . . . . . . . . . . . . . . . . . . . . . . . . . . . . . . . . . . . . . 45,792Capitalized interest(1) . . . . . . . . . . . . . . . . . . . . . . . . . . . . . . . . . . . . . 7,485Basis of loans sold . . . . . . . . . . . . . . . . . . . . . . . . . . . . . . . . . . . . . . . (331,312)Loan maturities . . . . . . . . . . . . . . . . . . . . . . . . . . . . . . . . . . . . . . . . . (305,316)Transfer out—loan converted to a security . . . . . . . . . . . . . . . . . . . . . . (176,635)Principal repayments . . . . . . . . . . . . . . . . . . . . . . . . . . . . . . . . . . . . . . (26,933)Discount accretion/premium amortization . . . . . . . . . . . . . . . . . . . . . . . 26,966Unrealized foreign currency remeasurement loss . . . . . . . . . . . . . . . . . . (6,506)Unrealized gains on loans held for sale at fair value . . . . . . . . . . . . . . . 5,760
Balance December 31, 2011 . . . . . . . . . . . . . . . . . . . . . . . . . . . . . . . . . $2,447,508
(1) Represents accrued interest income on loans whose terms do not require current paymentof interest.
For the year ended December 31, 2010, the activity in our loan portfolio was as follows (amountsin thousands):
Balance January 1, 2010 . . . . . . . . . . . . . . . . . . . . . . . . . . . . . . . . . . . $ 214,521Acquisitions/originations . . . . . . . . . . . . . . . . . . . . . . . . . . . . . . . . . . . 1,352,253Capitalized interest(1) . . . . . . . . . . . . . . . . . . . . . . . . . . . . . . . . . . . . . 3,323Basis of loans sold . . . . . . . . . . . . . . . . . . . . . . . . . . . . . . . . . . . . . . . (28,911)Loan maturities . . . . . . . . . . . . . . . . . . . . . . . . . . . . . . . . . . . . . . . . . (114,717)Principal repayments . . . . . . . . . . . . . . . . . . . . . . . . . . . . . . . . . . . . . . (13,642)Discount accretion/premium amortization . . . . . . . . . . . . . . . . . . . . . . . 6,339Unrealized foreign currency remeasurement loss . . . . . . . . . . . . . . . . . . 6,077
Balance December 31, 2010, . . . . . . . . . . . . . . . . . . . . . . . . . . . . . . . . $1,425,243
(1) Represents accrued interest income on loans whose terms do not require current paymentof interest.
110

Starwood Property Trust, Inc. and Subsidiaries
Notes to Consolidated Financial Statements (Continued)
As of December 31, 2012
5. Other Investments
Other investments are comprised of the following assets (amounts in thousands):December 31, December 31,
2012 2011
Residential real estate . . . . . . . . . . . . . . . . . . . . . . . . . . . $ 99,115 $ —Non-performing residential loans . . . . . . . . . . . . . . . . . . . 68,883 —Investment in marketable securities . . . . . . . . . . . . . . . . . 21,667 11,269Investment in LLC . . . . . . . . . . . . . . . . . . . . . . . . . . . . . 32,318 33,110
Total other investments . . . . . . . . . . . . . . . . . . . . . . . . . . $221,983 $44,379
Residential real estate
During 2012, we began to purchase single family residential homes and non-performing residentialloans. At acquisition, a significant portion of the properties were either vacant or had occupants thatwere not subject to a lease and/or were not paying rent to the previous owner. Upon acquisition, webegan actively preparing the properties to be either rented or sold, as applicable. From the date ofacquisition through December 31, 2012, we incurred approximately $5.4 million in costs of preparingthese properties for their intended use, and such costs were added to our investment basis.
Depreciable Original Capitalized Accumulated Net BookType Life Cost Cost Depreciation Value
Building . . . . . . . . . . . . . . . . . . . . . . . . . . . . 30 years $20,955 $3,036 $(203) $23,788Land . . . . . . . . . . . . . . . . . . . . . . . . . . . . . . — 20,457 — — 20,457Furniture & Fixtures . . . . . . . . . . . . . . . . . . . 5 years 191 72 (10) 253Development Assets . . . . . . . . . . . . . . . . . . . — 52,275 2,342 — 54,617
$93,878 $5,450 $(213) $99,115
For the year ended December 31, 2012, the operating results of the properties and the location ofthe item in the consolidated statements of operations were as follows (amounts in thousands):
Rental income . . . . . . . . . . . . . . . $ 443 Other income (expense)Operating expenses . . . . . . . . . . . . 933 Other income (expense)
Net operating income . . . . . . . . . . (490)
Depreciation . . . . . . . . . . . . . . . . (213) Other income (expense)Acquisition & startup costs . . . . . . (758) Various(1)Gain on real estate sales . . . . . . . . 586 Realized gain on sale of investmentsOther expense . . . . . . . . . . . . . . . (84) VariousIncome tax expense . . . . . . . . . . . (152) Income tax provision
$(1,111)
(1) Acquisition and start-up costs includes $198 thousand reflected in acquisition andinvestment pursuit costs and $560 thousand reflected in other income (expense) on theDecember 31, 2012 income statement.
111

Starwood Property Trust, Inc. and Subsidiaries
Notes to Consolidated Financial Statements (Continued)
As of December 31, 2012
5. Other Investments (Continued)
Non-performing loan pool
In November 2012, we acquired 485 non-performing residential loans at an aggregate cost of$69.0 million. For the year ended December 31, 2012 the operating results and the location of the itemin the consolidated statements of operations were as follows (amounts in thousands):
Interest income . . . . . . . . . . . . . . . . $ — Other income (expense)Operating expenses . . . . . . . . . . . . . 246 VariousNet operating income . . . . . . . . . . . (246)Acquisition & startup costs . . . . . . . (758) Various(1)Gain on loan sales . . . . . . . . . . . . . 110 Realized gain on sale of investments
$(894)
(1) Acquisition and start-up costs include $690 thousand reflected in acquisition andinvestment pursuit costs and $68 thousand reflected in other income (expense) on theDecember 31, 2012 income statement.
Investment in marketable securities
In December 2012, we acquired 9,140,000 ordinary shares in Starwood European Real EstateFinance Limited (‘‘SEREF’’), a debt fund that is externally managed by an affiliate of our Managerand is listed on the London Stock Exchange, for approximately $14.7 million. As a result, we ownapproximately 4% of SEREF. We have elected to report this investment at fair value because theshares are listed on an exchange, which allows us to determine the fair value using a quoted price froman active market, and also due to potential in lags in reporting resulting from differences in therespective regulatory requirements. We have not received any distributions from SEREF, and the fairvalue of the investment remeasured into USD was $15.2 million at December 31, 2012.
As of December 31, 2012 and December 31, 2011, we had an aggregate cost basis of $5.7 millionand $13.8 million invested in the publicly traded equity securities of certain REITs that were classifiedas available-for-sale and carried at fair value with changes in fair value recorded in othercomprehensive income (loss). As of December 31, 2012 and December 31, 2011, the aggregate fairvalue of such securities was $6.5 million and $11.3 million, respectively, resulting in a net unrealizedgain of $850 thousand and a net unrealized loss of $2.5 million, respectively. The aggregate fair valueof marketable securities including the SEREF investment, totaled $21.7 million at December 31, 2012.For the year ended December 31, 2012 we recognized dividend income related to these investments of$0.8 million that is included as a component of other income in the consolidated statement ofoperations and we sold securities with an aggregate cost basis of $8.1 million resulting in a realizedgain of $0.2 million. For the year ended December 31, 2011, we purchased securities with an aggregatecost basis of $9.3 million.
Investments in LLC
In June 2011, we acquired a non-controlling 49% interest in a privately-held limited liabilitycompany (‘‘LLC’’) for $25.5 million, which is accounted for under the equity method. In December2011 we sold 20% of this investment for an amount that approximated our carrying amount. The LLCowns a mezzanine loan participation, and our share of earnings for the years ended December 31, 2012
112

Starwood Property Trust, Inc. and Subsidiaries
Notes to Consolidated Financial Statements (Continued)
As of December 31, 2012
5. Other Investments (Continued)
and December 31, 2011 was $2.1 million and $1.1 million, which is included in other income on theconsolidated statements of operations. For the year ended December 31, 2012 and December 31, 2011,the cost basis was $24.3 million and $25.1 million, respectively.
Prior to 2011, we had committed $9.7 million to acquire at least a 5% interest in a privately-heldlimited liability company formed to acquire assets of a commercial real estate debt management andservicing business primarily for the opportunity to participate in debt opportunities arising from theventure’s special servicing business (the ‘‘Participation Right’’). As of December 31, 2012, we hadfunded $8.0 million of our commitment. For the years ended December 31, 2012 and December 31,2011 we recognized a gain of $1.7 million and $1.1 million, respectively, related to this investment,which is included in other income on the consolidated statements of operations and the cost basis was$8.0 million and $8.0 million, respectively.
6. Secured Financing Agreements
On March 31, 2010, Starwood Property Mortgage Sub-1, L.L.C. (‘‘SPM Sub-1’’), our indirectwholly-owned subsidiary, entered into a Master Repurchase and Securities Contract (the ‘‘WellsRepurchase Agreement’’) with Wells Fargo Bank, National Association (‘‘Wells Fargo’’). The WellsRepurchase Agreement is secured by approximately $75.9 million of the diversified loan portfoliopurchased from Teachers Insurance and Annuity Association of America on February 26, 2010 (‘‘theTIAA Portfolio’’). Advances under the Wells Repurchase Agreement accrue interest at a per annumpricing rate equal to the sum of one-month LIBOR plus the pricing margin of 3.0%. If an event ofdefault (as such term is defined in the Wells Repurchase Agreement) occurs and is continuing, amountsborrowed may become due and payable and interest accrues at the default rate, which is equal to thepricing rate plus 4.0%. The maturity date of the Wells Repurchase Agreement is May 31, 2013. TheWells Repurchase Agreement allowed for advances through May 31, 2010. As of December 31, 2012,$49.2 million was outstanding under the Wells Repurchase Agreement and the carrying value of thepledged collateral was $75.9 million. The Company guarantees certain of the obligations of SPM Sub-1under the Wells Repurchase Agreement up to maximum liability of 25% of the then currentlyoutstanding repurchase price of all purchased assets.
On August 6, 2010, Starwood Property Mortgage Sub-2, L.L.C. (‘‘SPM Sub-2’’), our indirectwholly-owned subsidiary, entered into a second Master Repurchase and Securities Contract with WellsFargo, which second repurchase facility was amended and restated by SPM Sub-2 and StarwoodProperty Mortgage Sub-2-A, L.L.C. (‘‘SPM Sub-2-A’’), our indirect wholly-owned subsidiary, onFebruary 28, 2011, pursuant to an Amended and Restated Master Repurchase and Securities Contract(the ‘‘Second Wells Repurchase Agreement’’). The Second Wells Repurchase Agreement was amendedon May 24, 2011 and November 3, 2011 (‘‘Amendment No. 2’’), and is being used by SPM Sub-2 andSPM Sub-2-A to finance the acquisition or origination of commercial mortgage loans (andparticipations therein) and mezzanine loans. In connection with Amendment No. 2, availableborrowings under the facility increased by $200 million to $550 million. Advances under the SecondWells Repurchase Agreement accrue interest at a per annum pricing rate equal to the sum ofone-month LIBOR plus a margin of between 1.75% and 6.0% depending on the type of asset beingfinanced. If an event of default (as such term is defined in the Second Wells Repurchase Agreement)occurs and is continuing, amounts borrowed may become due and payable immediately and interestaccrues at the default rate, which is equal to the pricing rate plus 4.0%. The initial maturity date of theSecond Wells Repurchase Agreement is August 5, 2013, subject to two one-year extension options, each
113
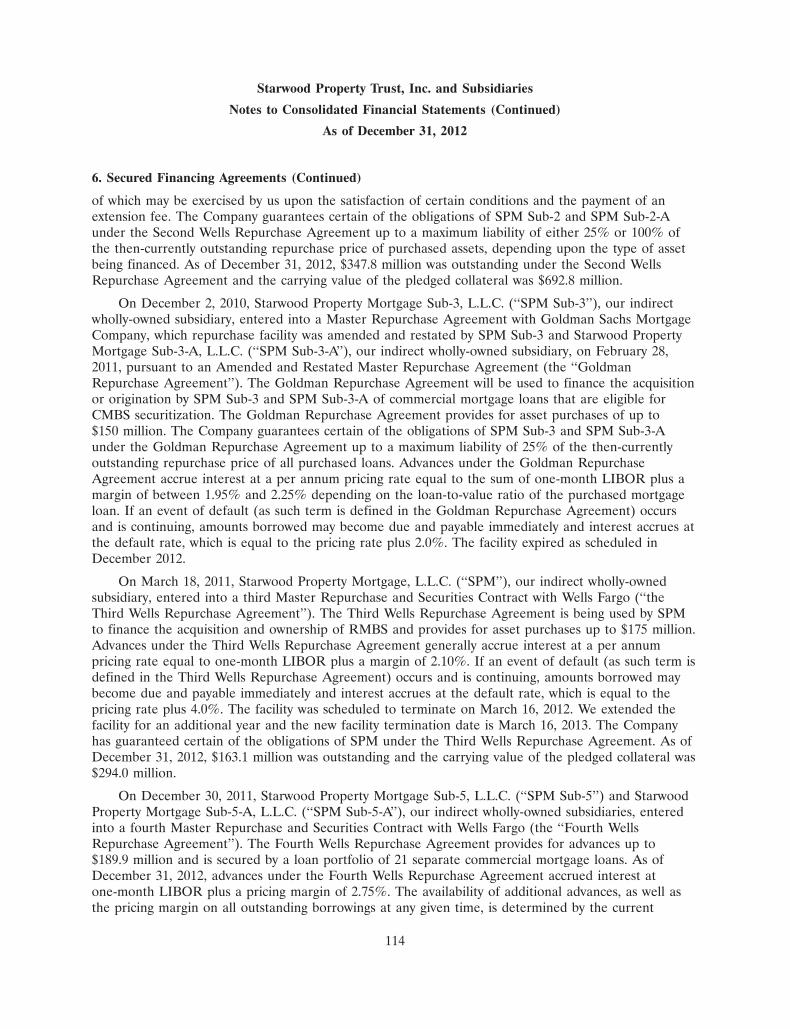
Starwood Property Trust, Inc. and Subsidiaries
Notes to Consolidated Financial Statements (Continued)
As of December 31, 2012
6. Secured Financing Agreements (Continued)
of which may be exercised by us upon the satisfaction of certain conditions and the payment of anextension fee. The Company guarantees certain of the obligations of SPM Sub-2 and SPM Sub-2-Aunder the Second Wells Repurchase Agreement up to a maximum liability of either 25% or 100% ofthe then-currently outstanding repurchase price of purchased assets, depending upon the type of assetbeing financed. As of December 31, 2012, $347.8 million was outstanding under the Second WellsRepurchase Agreement and the carrying value of the pledged collateral was $692.8 million.
On December 2, 2010, Starwood Property Mortgage Sub-3, L.L.C. (‘‘SPM Sub-3’’), our indirectwholly-owned subsidiary, entered into a Master Repurchase Agreement with Goldman Sachs MortgageCompany, which repurchase facility was amended and restated by SPM Sub-3 and Starwood PropertyMortgage Sub-3-A, L.L.C. (‘‘SPM Sub-3-A’’), our indirect wholly-owned subsidiary, on February 28,2011, pursuant to an Amended and Restated Master Repurchase Agreement (the ‘‘GoldmanRepurchase Agreement’’). The Goldman Repurchase Agreement will be used to finance the acquisitionor origination by SPM Sub-3 and SPM Sub-3-A of commercial mortgage loans that are eligible forCMBS securitization. The Goldman Repurchase Agreement provides for asset purchases of up to$150 million. The Company guarantees certain of the obligations of SPM Sub-3 and SPM Sub-3-Aunder the Goldman Repurchase Agreement up to a maximum liability of 25% of the then-currentlyoutstanding repurchase price of all purchased loans. Advances under the Goldman RepurchaseAgreement accrue interest at a per annum pricing rate equal to the sum of one-month LIBOR plus amargin of between 1.95% and 2.25% depending on the loan-to-value ratio of the purchased mortgageloan. If an event of default (as such term is defined in the Goldman Repurchase Agreement) occursand is continuing, amounts borrowed may become due and payable immediately and interest accrues atthe default rate, which is equal to the pricing rate plus 2.0%. The facility expired as scheduled inDecember 2012.
On March 18, 2011, Starwood Property Mortgage, L.L.C. (‘‘SPM’’), our indirect wholly-ownedsubsidiary, entered into a third Master Repurchase and Securities Contract with Wells Fargo (‘‘theThird Wells Repurchase Agreement’’). The Third Wells Repurchase Agreement is being used by SPMto finance the acquisition and ownership of RMBS and provides for asset purchases up to $175 million.Advances under the Third Wells Repurchase Agreement generally accrue interest at a per annumpricing rate equal to one-month LIBOR plus a margin of 2.10%. If an event of default (as such term isdefined in the Third Wells Repurchase Agreement) occurs and is continuing, amounts borrowed maybecome due and payable immediately and interest accrues at the default rate, which is equal to thepricing rate plus 4.0%. The facility was scheduled to terminate on March 16, 2012. We extended thefacility for an additional year and the new facility termination date is March 16, 2013. The Companyhas guaranteed certain of the obligations of SPM under the Third Wells Repurchase Agreement. As ofDecember 31, 2012, $163.1 million was outstanding and the carrying value of the pledged collateral was$294.0 million.
On December 30, 2011, Starwood Property Mortgage Sub-5, L.L.C. (‘‘SPM Sub-5’’) and StarwoodProperty Mortgage Sub-5-A, L.L.C. (‘‘SPM Sub-5-A’’), our indirect wholly-owned subsidiaries, enteredinto a fourth Master Repurchase and Securities Contract with Wells Fargo (the ‘‘Fourth WellsRepurchase Agreement’’). The Fourth Wells Repurchase Agreement provides for advances up to$189.9 million and is secured by a loan portfolio of 21 separate commercial mortgage loans. As ofDecember 31, 2012, advances under the Fourth Wells Repurchase Agreement accrued interest atone-month LIBOR plus a pricing margin of 2.75%. The availability of additional advances, as well asthe pricing margin on all outstanding borrowings at any given time, is determined by the current
114

Starwood Property Trust, Inc. and Subsidiaries
Notes to Consolidated Financial Statements (Continued)
As of December 31, 2012
6. Secured Financing Agreements (Continued)
operating cash flows and fair values of the underlying collateral, both in relation to the existingcollateral loan receivable balances outstanding, and all as approved by Wells Fargo. The overall term ofthe Fourth Wells Repurchase Agreement is three years, with two one-year conditional extensions. As ofDecember 31, 2012, SPM Sub-5-A had borrowed $181.2 million under this facility and the carryingvalue of the pledged collateral was $243.0 million. At closing, we paid a 0.50% commitment fee basedupon the total committed proceeds. If the overall facility is extended beginning in December 2014, wewould pay a 0.25% extension fee for each year. The Company guarantees 60% of the currentlyoutstanding repurchase price for all purchased assets; however, the Company guarantees 100% of theoutstanding balance of any individual repurchase transaction involving a collateral property withoperating cash flows that at any time is less than 15% of the related collateral loan receivable balance.
On March 6, 2012, Starwood Property Mortgage Sub-7, LLC (‘‘SPM Sub-7’’), our indirect wholly-owned subsidiary, entered into a Master Repurchase Agreement with Goldman Sachs International (the‘‘Second Goldman Repurchase Agreement’’). At closing, we borrowed $155.4 million under the SecondGoldman Repurchase Agreement to finance the acquisition of $222.8 million in senior debt securitiesthat are expected to mature on November 15, 2015. The senior debt securities were issued by certainspecial purpose entities that were formed to hold substantially all of the assets of a worldwide operatorof hotels, resorts and timeshare properties. Advances under the Second Goldman RepurchaseAgreement accrue interest at a per annum rate of one-month LIBOR plus a spread of 2.90%. Thematurity date of the Second Goldman Repurchase Agreement is August 15, 2015. The carrying value ofthe collateral senior debt securities was $213.9 million and the amount outstanding under the facilitywas $149.4 million at December 31, 2012.
On March 26, 2012, Starwood Property Mortgage Sub-6, LLC (‘‘SPM Sub-6’’) and StarwoodProperty Mortgage Sub-6-A (‘‘SPM Sub-6-A’’), our indirect wholly-owned subsidiaries, entered into aMaster Repurchase Agreement with Citibank, N.A. (the ‘‘Citi Repurchase Agreement). The CitiRepurchase Agreement provides for asset purchases of up to $125.0 million to finance commercialmortgage loans and senior interests in commercial mortgage loans originated or acquired by us andincluding loans and interests intended to be included in commercial mortgage loan securitizations aswell as those not intended to be securitized. Advances under the Citi Repurchase Agreement accrueinterest at a per annum interest rate equal to the sum of (i) 30-day LIBOR plus (ii) a margin ofbetween 1.75% and 3.75% depending on (A) asset type, (B) the amount advanced and (C) the debtyield and loan-to-value ratios of the purchased mortgage loan, provided that the aggregate weightedaverage interest rate shall not at any time be less than the sum of one-month LIBOR plus 2.25%. Thefacility has an initial maturity date of March 29, 2014, subject to three one-year extension options,which may be exercised by us upon the satisfaction of certain conditions. We have guaranteed theobligations of our subsidiaries under the facility up to a maximum liability of 25% of the then-currentlyoutstanding repurchase price of assets financed. As of December 31, 2012, SPM Sub-6-A had borrowed$49.0 million under this facility and the carrying value of the pledged collateral was $71.4 million.
Under the Wells Repurchase Agreement, the Second Wells Repurchase Agreement, the GoldmanRepurchase Agreement, the Third Wells Repurchase Agreement, the Fourth Wells RepurchaseAgreement, the Second Goldman Repurchase Agreement, and the Citi Repurchase Agreement, thecounterparty retains the sole discretion over both whether to purchase the loan or security from us and,subject to certain conditions, the market value of such loan or security for purposes of determiningwhether we are required to pay margin to the counterparty.
115

Starwood Property Trust, Inc. and Subsidiaries
Notes to Consolidated Financial Statements (Continued)
As of December 31, 2012
6. Secured Financing Agreements (Continued)
On December 3, 2010, SPT Real Estate Sub II, LLC (‘‘SPT II’’), our wholly-owned subsidiary,entered into a term loan credit agreement (the ‘‘BAML Credit Agreement’’) with Bank of America,N.A. (‘‘Bank of America’’) as administrative agent and as lender, and us and certain of our subsidiariesas guarantors. The BAML Credit Agreement, amended and restated on March 9, 2012 (‘‘AmendedBAML Credit Agreement’’), provides for loans of up to $141.6 million as of December 31, 2012. Theinitial draw under the BAML Credit Agreement in December 2010 was used, in part, to finance theacquisition of a $205.0 million participation (the ‘‘Participation’’) in a senior secured loan dueNovember 15, 2015 from Bank of America. The Participation was converted into a security in June2011 and is due from certain special purpose entities that were formed to hold substantially all of theassets of a worldwide operator of hotels, resorts and timeshare properties. In connection with theMarch 9, 2012 amendment, we borrowed an additional $81.0 million to partially finance the$125.0 million acquisition of additional participation interest in the senior secured loan.
Advances under the Amended BAML Credit Agreement accrue interest at a per annum rate basedon LIBOR or a base rate, at the election of SPT II. The margin can vary between 2.35% and 2.50%over LIBOR, and between 1.35% and 1.50% over base rate, based on the performance of theunderlying hospitality collateral. The initial maturity date of the Amended BAML Credit Agreement isNovember 30, 2014, subject to a 12 month extension option, exercisable by SPT II upon satisfaction ofcertain conditions set forth in the Amended BAML Credit Agreement. Bank of America retains thesole discretion, subject to certain conditions, over the market value of collateral assets for purposes ofdetermining whether we are required to pay margin to Bank of America. As of December 31, 2012,$141.6 million was outstanding under the BAML Credit Agreement. The carrying value of the CMBSpledged as collateral under the Credit agreement was $207.3 million as of December 31, 2012. If anevent of default (as such term is defined in the Amended BAML Credit Agreement) occurs and iscontinuing, amounts borrowed may become due and payable immediately and interest would accrue atan additional 2% per annum over the applicable rate.
On July 3, 2012, Starwood Property Mortgage Sub-9, L.L.C. (‘‘SPM Sub-9’’) and StarwoodProperty Mortgage Sub-9-A, L.L.C. (‘‘SPM Sub-9-A’’), our indirect wholly-owned subsidiaries, enteredinto a Purchase and Repurchase Agreement and Securities Contract (‘‘OneWest RepurchaseAgreement’’) with OneWest Bank, FSB (‘‘OneWest’’). At closing, SPM Sub-9 transferred loaninvestments to OneWest in exchange for a $78.3 million advance. Borrowings under the OneWestRepurchase Agreement accrue interest at a pricing rate of one-month LIBOR plus a margin of 3.0%. Ifan event of default (as such term is defined in the OneWest Repurchase Agreement) occurs and iscontinuing, amounts borrowed may become due and payable immediately and interest accrues at thedefault rate, which is equal to the pricing rate plus 5.0%. The initial maturity date of the facility isJuly 3, 2015 with two one-year extension options, subject to certain conditions. As of December 31,2012, $65.6 million was outstanding under the OneWest Bank Repurchase Agreement and the carryingvalue of the pledged collateral was $94.8 million.
On August 3, 2012, Starwood Property Mortgage Sub-10, LLC (‘‘SPM Sub-10’’) and StarwoodProperty Mortgage Sub-10A (‘‘SPM Sub 10-A’’), our indirect wholly-owned subsidiaries, jointly enteredinto a $250.0 million Senior Secured Revolving Credit Facility (‘‘Borrowing Base’’) arranged by MerrillLynch, Pierce, Fenner & Smith Incorporated (‘‘MLPFS’’). Lender participants in the facility includeBank of America, Citibank, Barclays Bank PLC, Deutsche Bank Trust Company Americas, GoldmanSachs Bank USA, and Stifel Bank & Trust. The facility matures 364 days from closing, may be extendedfrom time to time, provided the aggregate tenor shall not exceed four years. Outstanding borrowings
116

Starwood Property Trust, Inc. and Subsidiaries
Notes to Consolidated Financial Statements (Continued)
As of December 31, 2012
6. Secured Financing Agreements (Continued)
under the facility will be priced at LIBOR + 325 bps, with an unused fee of 30 to 35 bps per annumdepending upon the usage of the facility. The facility will be used primarily to finance our purchase ororigination of commercial mortgage loans for the time period between transaction closing and the timein which a financing of the loan can be closed with one of our existing secured warehouse facilities orthe loan is sold/syndicated in whole or in part. The term of financing provided under the facility forany individual loan is limited in most instances to the lesser of six months or the maturity of thefacility. The facility will be secured by each loan for which financing has been provided as well as a noless than $500.0 million in market value of additional preapproved unencumbered senior, subordinate,and mezzanine loan assets. The facility is full recourse to us. As of December 31, 2012, there were noborrowings under the Borrowing Base and the carrying value of the pledged collateral but not drawnupon is $697.4 million.
On August 17, 2012, Starwood Property Trust, Inc. (‘‘SPT’’), entered into a Master RepurchaseAgreement with Goldman Sachs Lending Partners, LLC (the ‘‘Third Goldman RepurchaseAgreement’’). At closing, we borrowed $158.8 million under the Third Goldman RepurchaseAgreement to finance the acquisition of $250.0 million participation interest in a mezzanine note that isexpected to mature on November 15, 2015. The mezzanine note was issued by certain special purposeentities that were formed to hold substantially all of the assets of a worldwide operator of hotels,resorts and timeshare properties. Advances under the Third Goldman Repurchase Agreement accrueinterest at a per annum rate of one-month LIBOR plus a spread of 3.70%. The maturity date of theThird Goldman Repurchase Agreement is September 15, 2015. The carrying value of the mezzaninenote was $236.6 million and the amount outstanding under the facility was $158.8 million atDecember 31, 2012.
The following table sets forth our five-year principal repayments schedule for the securedfinancings, assuming no defaults or expected extensions and excluding the loan transfer securedborrowings (amounts in thousands). Our credit facilities generally require principal to be paid downprior to the facilities’ respective maturities if and when we receive principal payments on, or sell, theinvestment collateral that we have pledged. The amount for 2013 generally represents the principalrepayments that are scheduled or otherwise expected to be received on our loan and MBS investments:
2013 . . . . . . . . . . . . . . . . . . . . . . . . . . . . . . . . . . . . . . . . . . . . . . . . . . $ 633,1482014 . . . . . . . . . . . . . . . . . . . . . . . . . . . . . . . . . . . . . . . . . . . . . . . . . . 301,8282015 . . . . . . . . . . . . . . . . . . . . . . . . . . . . . . . . . . . . . . . . . . . . . . . . . . 370,8362016 . . . . . . . . . . . . . . . . . . . . . . . . . . . . . . . . . . . . . . . . . . . . . . . . . . —2017 and thereafter . . . . . . . . . . . . . . . . . . . . . . . . . . . . . . . . . . . . . . . —
Total . . . . . . . . . . . . . . . . . . . . . . . . . . . . . . . . . . . . . . . . . . . . . . . . . $1,305,812
Secured financing maturities for 2013 primarily relate to $347.8 million of financings on theSecond Wells Repurchase Agreement, $163.1 million on the Third Wells Repurchase Agreement, $49.2on the Wells Repurchase Agreement, $35.3 million on the One West Bank Repurchase Agreement, and$23.0 million on the Fourth Wells Repurchase Agreement. We expect to extend the Second WellsRepurchase Agreement beyond initial maturity. Since we have extension options available to us bymeeting certain criteria. Additionally, we expect to extend the Third Wells Repurchase Agreement withthe lender.
117

Starwood Property Trust, Inc. and Subsidiaries
Notes to Consolidated Financial Statements (Continued)
As of December 31, 2012
7. Loan Securitization/Sale Activities
During 2010, the Company participated in a commercial mortgage securitization which generatednon-recourse match funded financing with an effective cost of funds of approximately 3.5%. TheCompany separated five mortgage loans with an aggregate face value of $178 million into senior andjunior loans. It contributed the five senior loans, or A Notes (the ‘‘Contributed Loans’’), with a facevalue of approximately $84 million to the securitization trust and received approximately $92 million inproceeds, while retaining $94 million of junior interests. The Contributed Loans are secured by office,retail and industrial properties and have remaining maturities between four and seven years.
Each of the five Contributed Loans was either originated or acquired by the Company as part of afirst mortgage loan. In connection with the securitization, two of the first mortgage loans were eachsplit by the Company into an A Note and a B Note and three of the first mortgage loans had eachbeen previously split into A Notes, B Notes and C Notes.
The secured financing liability relates to two of the Contributed Loans that we securitized but didnot qualify for sale treatment under GAAP. As of December 31, 2012, the balance of the loans pledgedto the securitization trust was $50.3 million and the related liability of the securitization trust was$52.3 million. As of December 31, 2011, the balance of the loans pledged to the securitization trust was$50.3 million and the related liability of the securitization trust was $53.2 million.
During the first quarter of 2011, we contributed three loans to a securitization trust forapproximately $56 million in gross proceeds. Control of the loans was surrendered in the loan transferand it was therefore treated as a sale under GAAP, resulting in a gain of $1.9 million. We effectivelyrealized a net gain of $1.8 million on this transaction after considering the realized losses on theinterest rate hedges of $0.1 million that was terminated in connection with the sale.
During the second quarter of 2011, we sold a loan to an independent third party for grossproceeds of $78.4 million. Control of the loan was surrendered in the transaction and it was thereforetreated as sale under GAAP, resulting in a gain of $3.4 million. We effectively realized a net gain of$2.9 million on this transaction after considering the realized loss on the interest rate hedge of$0.5 million that was terminated in connection with the sale.
During the third quarter of 2011, we sold loans with a carrying value of $154.4 million into asecuritization resulting in proceeds, net of financing repayments, of $69.7 million. Control of the loanswas surrendered in the loan transfer and it was therefore treated as a sale under GAAP, resulting in arealized gain of $5.1 million. However, we effectively broke even on this transaction after consideringthe realized gains on the credit hedges of $2.2 million and realized losses on the interest rate hedges of$7.4 million that were terminated in connection with the sale.
During the fourth quarter of 2011, we sold a loan with a carrying value of $42.5 million at par.Control of the loan was surrendered in the loan transfer and it was therefore treated as a sale underGAAP, resulting in no realized gain or loss.
During the first quarter of 2012, we sold six loans with a carrying value of $122.7 million to anindependent third party resulting in proceeds, net of financing repayments, of $40.6 million. Control ofthe loans was surrendered in the loan transfer and it was therefore treated as a sale under GAAP,resulting in a realized gain of $9.4 million. The net economic gain of this transaction, including arealized loss of $8.4 million on the termination of the corresponding interest rate hedge, was$1.0 million. Additionally, we sold 50% of our Euro denominated loan to a strategic partner resultingin proceeds of $28.8 million and a realized loss of $2.1 million; however, this transaction was earnings
118

Starwood Property Trust, Inc. and Subsidiaries
Notes to Consolidated Financial Statements (Continued)
As of December 31, 2012
7. Loan Securitization/Sale Activities (Continued)
neutral after considering the realized gains on the related currency hedges of $2.1 million that wereterminated in connection with the sale. We have no continuing involvement in the loans.
During the third quarter of 2012, we sold the $36.1 million A-Note of a $51.5 million firstmortgage loan that we had closed in July 2012, and retained the $15.4 million B-Note. The loan iscollateralized by a portfolio of three hotels. The cash proceeds received from the sale approximatedour carrying value in the A-Note. We retained the $15.4 million B-Note. The A-Note and B-Note bearinterest at one-month LIBOR plus 3.5% and 11.83%, respectively. The buyer has an option to requireus to repurchase the A-Note unless and until a default condition is cured with respect to one of thecollateral properties, at which time the guarantee would terminate. In exchange for providing thisguarantee, we receive 0.5% of the interest otherwise due to the buyer under the A-Note unless anduntil the guarantee terminates. The buyer has not exercised its option to date. While we fully expectthe default condition will be cured as it was caused by a short-term construction project at the propertythat has since been completed, our participation in the interest accruing under the A-Note representsan element of continuing involvement that requires us to account for the sale as a secured borrowing.The carrying amount of the A-Note and secured borrowing were $35.6 million at December 31, 2012,and are classified in loans transferred as secured borrowings and loan transfer secured borrowings,respectively.
During the fourth quarter of 2012, we sold five loans with an aggregate carrying value of$314.5 million to independent third parties in five separate transactions resulting in proceeds of$315.7 million. Control of the loans was surrendered in the loan transfers and they were thereforetreated as sales under GAAP.
8. Derivatives and Hedging Activity
Risk Management Objective of Using Derivatives
We are exposed to certain risks arising from both our business operations and economicconditions. We principally manage our exposures to a wide variety of business and operational risksthrough management of our core business activities. We manage economic risks, including interest rate,foreign exchange, liquidity, and credit risk primarily by managing the amount, sources, and duration ofour debt funding and the use of derivative financial instruments. Specifically, we enter into derivativefinancial instruments to manage exposures that arise from business activities that result in the receiptor payment of future known and uncertain cash amounts, the value of which are determined by interestrates, credit spreads, and foreign exchange rates. Our derivative financial instruments are used tomanage differences in the amount, timing, and duration of the known or expected cash receipts andknown or expected cash payments principally related to our investments, anticipated level of loan sales,and borrowings.
Cash Flow Hedges of Forecasted Interest Payments
Our objectives in using interest rate derivatives are to add stability to interest expense and tomanage our exposure to interest rate movements. To accomplish this objective, we primarily useinterest rate swaps as part of our interest rate risk management strategy. Interest rate swaps designatedas cash flow hedges involve the receipt of variable amounts from a counterparty in exchange for usmaking fixed-rate payments over the life of the agreements without exchange of the underlying notionalamount.
119

Starwood Property Trust, Inc. and Subsidiaries
Notes to Consolidated Financial Statements (Continued)
As of December 31, 2012
8. Derivatives and Hedging Activity (Continued)
In connection with our repurchase agreements, we have entered into nine interest rate swaps thathave been designated as cash flow hedges of the interest rate risk associated with forecasted variableinterest payments. As of December 31, 2012, the aggregate notional amount of our interest rate swapsdesignated as cash flow hedges of forecasted variable interest payments totaled $254.8 million. Underthese agreements, we will pay fixed monthly coupons at fixed rates ranging from 0.557% to 2.228% ofthe notional amount to the counterparty and receive floating rate LIBOR. Our interest rate swapsdesignated as cash flow hedges of interest rate risk have maturities ranging from February 2013 to May2021.
The effective portion of changes in the fair value of derivatives designated and that qualify as cashflow hedges is recorded in accumulated other comprehensive income (loss) and is subsequentlyreclassified into earnings in the period that the hedged forecasted transaction affects earnings. Theineffective portion of the change in fair value of the derivatives is recognized directly in earnings.During the year ended December 31, 2012, we recorded no hedge ineffectiveness in earnings. Duringthe years ended December 31, 2011, and December 31, 2010, we recorded $45 thousand and$46 thousand, respectively as hedge ineffectiveness in earnings, which is included in interest expense onthe consolidated statements of operations.
Amounts reported in accumulated other comprehensive income (loss) related to derivatives will bereclassified to interest expense as interest payments are made on the associated variable-rate debt. Overthe next twelve months, we estimate that an additional $1.5 million will be reclassified as an increase tointerest expense. We are hedging our exposure to the variability in future cash flows for forecastedtransactions over a maximum period of 102 months.
Non-designated Hedges
Derivatives not designated as hedges are derivatives that do not meet the criteria for hedgeaccounting under GAAP or for which we have not elected to designate as hedges. We do not use thesederivatives for speculative purposes but instead they are used to manage our exposure to foreignexchange rates, interest rate changes, and certain credit spreads. Changes in the fair value ofderivatives not designated in hedging relationships are recorded directly in net (losses) gains on interestrate, currency or credit hedges in the consolidated statements of operations.
During 2010, we entered into a series of forward contracts whereby we agree to sell an amount ofGBP for agreed upon amounts of USD at various dates through October 2013. These forward contractswere executed to economically fix the USD amounts of GBP-denominated cash flows expected to bereceived by us related to a GBP-denominated loan investment.
During 2011, we entered into a series of forward contracts whereby we agreed to sell an amount ofEUR for an agreed upon amount of USD at various dates through June of 2014. These forwardcontracts were executed to economically fix the USD amount of EUR-denominated cash flows expectedto be received by us related to a mezzanine loan investment in Germany. During 2012, we terminated aportion of our contracts to sell EUR. The purpose of the terminations was to reduce the amount ofEUR we were to sell at future dates as a result of the refinancing of our EUR-denominated loaninvestment.
During 2012, we entered into positions to buy GBP for an agreed upon amount of USD at variousdates through October 2013 to fix the future value of our losses on pre-existing GBP forward positions.
120
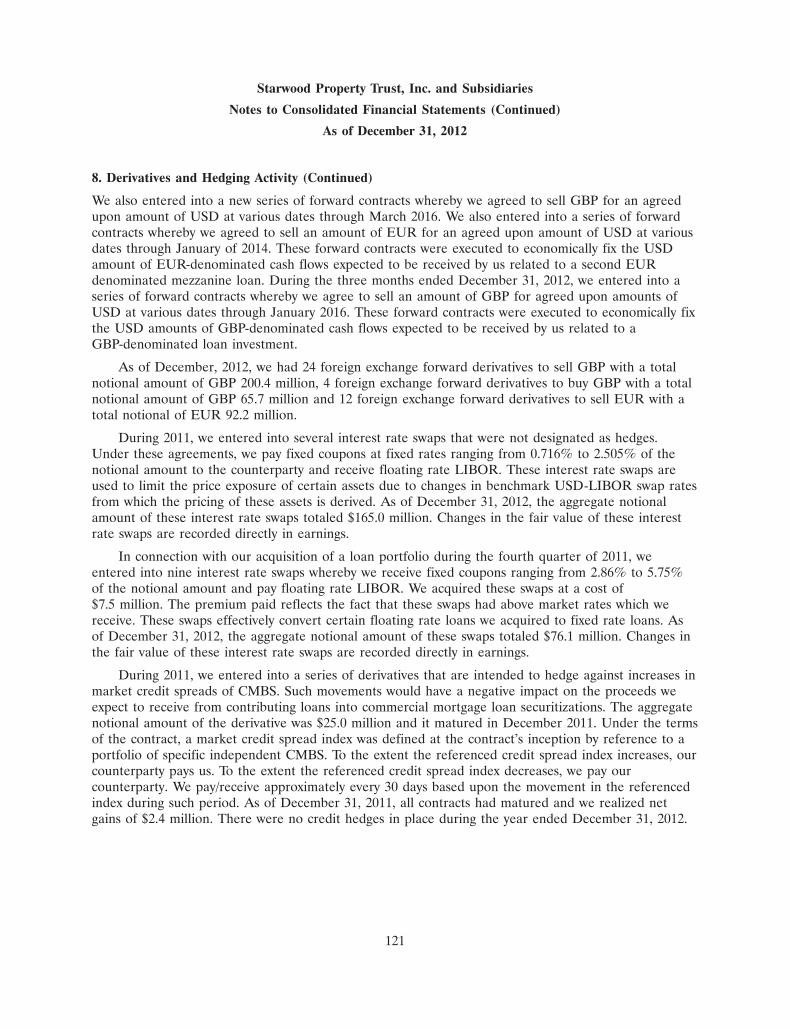
Starwood Property Trust, Inc. and Subsidiaries
Notes to Consolidated Financial Statements (Continued)
As of December 31, 2012
8. Derivatives and Hedging Activity (Continued)
We also entered into a new series of forward contracts whereby we agreed to sell GBP for an agreedupon amount of USD at various dates through March 2016. We also entered into a series of forwardcontracts whereby we agreed to sell an amount of EUR for an agreed upon amount of USD at variousdates through January of 2014. These forward contracts were executed to economically fix the USDamount of EUR-denominated cash flows expected to be received by us related to a second EURdenominated mezzanine loan. During the three months ended December 31, 2012, we entered into aseries of forward contracts whereby we agree to sell an amount of GBP for agreed upon amounts ofUSD at various dates through January 2016. These forward contracts were executed to economically fixthe USD amounts of GBP-denominated cash flows expected to be received by us related to aGBP-denominated loan investment.
As of December, 2012, we had 24 foreign exchange forward derivatives to sell GBP with a totalnotional amount of GBP 200.4 million, 4 foreign exchange forward derivatives to buy GBP with a totalnotional amount of GBP 65.7 million and 12 foreign exchange forward derivatives to sell EUR with atotal notional of EUR 92.2 million.
During 2011, we entered into several interest rate swaps that were not designated as hedges.Under these agreements, we pay fixed coupons at fixed rates ranging from 0.716% to 2.505% of thenotional amount to the counterparty and receive floating rate LIBOR. These interest rate swaps areused to limit the price exposure of certain assets due to changes in benchmark USD-LIBOR swap ratesfrom which the pricing of these assets is derived. As of December 31, 2012, the aggregate notionalamount of these interest rate swaps totaled $165.0 million. Changes in the fair value of these interestrate swaps are recorded directly in earnings.
In connection with our acquisition of a loan portfolio during the fourth quarter of 2011, weentered into nine interest rate swaps whereby we receive fixed coupons ranging from 2.86% to 5.75%of the notional amount and pay floating rate LIBOR. We acquired these swaps at a cost of$7.5 million. The premium paid reflects the fact that these swaps had above market rates which wereceive. These swaps effectively convert certain floating rate loans we acquired to fixed rate loans. Asof December 31, 2012, the aggregate notional amount of these swaps totaled $76.1 million. Changes inthe fair value of these interest rate swaps are recorded directly in earnings.
During 2011, we entered into a series of derivatives that are intended to hedge against increases inmarket credit spreads of CMBS. Such movements would have a negative impact on the proceeds weexpect to receive from contributing loans into commercial mortgage loan securitizations. The aggregatenotional amount of the derivative was $25.0 million and it matured in December 2011. Under the termsof the contract, a market credit spread index was defined at the contract’s inception by reference to aportfolio of specific independent CMBS. To the extent the referenced credit spread index increases, ourcounterparty pays us. To the extent the referenced credit spread index decreases, we pay ourcounterparty. We pay/receive approximately every 30 days based upon the movement in the referencedindex during such period. As of December 31, 2011, all contracts had matured and we realized netgains of $2.4 million. There were no credit hedges in place during the year ended December 31, 2012.
121

Starwood Property Trust, Inc. and Subsidiaries
Notes to Consolidated Financial Statements (Continued)
As of December 31, 2012
8. Derivatives and Hedging Activity (Continued)
The table below presents the fair value of the Company’s derivative financial instruments as well astheir classification on the balance sheet as of December 31, 2012 and December 31, 2011 (amountsin thousands).
Tabular Disclosure of Fair Values of Derivative Instruments
Derivatives in an Asset Position Derivatives in a Liability Position
As of December 31, 2012 As of December 31, 2011 As of December 31, 2012 As of December 31, 2011
Balance Balance Balance BalanceSheet Fair Sheet Fair Sheet Fair Sheet Fair
Location Value Location Value Location Value Location Value
Derivatives designated as hedginginstruments
Interest rate swaps . . . . . . . . . N/A $ — N/A $ — Derivative Liabilities $ 2,571 Derivative Liabilities $ 1,420
Total derivatives designated ashedging instruments . . . . . . . $ — $ — $ 2,571 $ 1,420
Derivatives not designated ashedging instruments
Interest rate swaps . . . . . . . . . Derivative Assets $4,892 Derivative Assets $ 7,555 Derivative Liabilities $ 1,772 Derivative Liabilities $11,342Foreign exchange contracts . . . . Derivative Assets 4,335 Derivative Assets 5,261 Derivative Liabilities 23,427 Derivative Liabilities 6,890
Total derivatives not designated ashedging instruments . . . . . . . $9,227 $12,816 $25,199 $18,232
The tables below present the effect of the Company’s derivative financial instruments on thestatements of operations and of comprehensive income (loss) for the years ended December 31, 2012and December 31, 2011.
Cash flow hedges’ impact for the year ended December 31, 2012 (amounts in thousands):
Amount of loss Location of loss Amount of loss Location of gain Amount of gainrecognized in reclassified from reclassified from recognized in recognized in
OCI on accumulated OCI accumulated OCI income on income onDerivative type for derivative into income into income derivative derivativecash flow hedge (effective portion) (effective portion) (effective portion) (ineffective portion) (ineffective portion)
Interest Rate Swaps . . . $3,609 Interest Expense $2,458 Interest Expense $ —
Cash flow hedges’ impact for the year ended December 31, 2011 (amounts in thousands):
Amount of loss Location of loss Amount of loss Location of gain Amount of gainrecognized in reclassified from reclassified from recognized in recognized in
OCI on accumulated OCI accumulated OCI income on income onDerivative type for derivative into income into income derivative derivativecash flow hedge (effective portion) (effective portion) (effective portion) (ineffective portion) (ineffective portion)
Interest Rate Swaps . . . $1,951 Interest Expense $2,113 Interest Expense $45
Cash flow hedges’ impact for the year ended December 31, 2010 (amounts in thousands):
Amount of loss Location of loss Amount of loss Location of gain Amount of gainrecognized in reclassified from reclassified from recognized in recognized in
OCI on accumulated OCI accumulated OCI income on income onDerivative type for derivative into income into income derivative derivativecash flow hedge (effective portion) (effective portion) (effective portion) (ineffective portion) (ineffective portion)
Interest Rate Swaps . . . $3,367 Interest Expense $1,742 Interest Expense $46
122

Starwood Property Trust, Inc. and Subsidiaries
Notes to Consolidated Financial Statements (Continued)
As of December 31, 2012
8. Derivatives and Hedging Activity (Continued)
Non-designated derivatives’ impact for the years ended December 31, 2012, 2011 and 2010(amounts in thousands):
Amount of Gain/(Loss)Recognized in Income
on DerivativeDerivatives Not Designated Location of Gain/(Loss) Recognizedas Hedging Instruments in Income on Derivative 2012 2011 2010
Interest Rate Swaps—Realized gains (losses) . . Gains (losses) on interest rate hedges $ (9,220) $(15,843) $(1,630)Interest Rate Swaps—Net change in unrealized
losses . . . . . . . . . . . . . . . . . . . . . . . . . . . . Gains (losses) on interest rate hedges $ 10,243 $(11,287) $ (55)Foreign Exchange—Realized losses . . . . . . . . . Gains (losses) on currency hedges $ 2,283 $ (1,264) $ (117)Foreign Exchange—Net change in unrealized
gains . . . . . . . . . . . . . . . . . . . . . . . . . . . . Gains (losses) on currency hedges $(17,463) $ 5,755 $(7,383)Credit Spread Derivative—Realized gains . . . . Gains (losses) on credit spread hedges $ — $ 2,358 $ —
Credit-risk-related Contingent Features
We have entered into agreements with certain of our derivative counterparties that containprovisions where if we were to default on any of our indebtedness, including default where repaymentof the indebtedness has not been accelerated by the lender, we may also be declared in default on ourderivative obligations. We also have certain agreements that contain provisions where if our ratio ofprincipal amount of indebtedness to total assets at any time exceeds 75%, then we could be declared indefault of our derivative obligations.
As of December 31, 2012, for those counterparties where of our derivatives are in a net liabilityposition, which includes accrued interest but excludes any adjustment for nonperformance risk relatedto these agreements, the fair value was $25.3 million. As of December 31, 2012, we had received postedcollateral of $3.3 million related to the agreements in an asset postion. If we had breached any of theseprovisions at December 31, 2012, we could have been required to settle our obligations under theagreements at their termination liability value of $25.3 million.
9. Related-Party Transactions
We entered into a management agreement with our Manager upon closing of our initial publicoffering (‘‘IPO’’), which provides for an initial term of three years with automatic one-year extensionsthereafter unless terminated as described below. Under the management agreement, our Manager,subject to the oversight of our board of directors, is required to manage our day-to-day activities, forwhich our Manager receives a base management fee and is eligible for an incentive fee and stockawards. Our Manager is also entitled to charge us for certain expenses incurred on our behalf, asdescribed below.
Base Management Fee. The base management fee is 1.5% of our stockholders’ equity per annumand calculated and payable quarterly in arrears in cash. For purposes of calculating the managementfee, our stockholders’ equity means: (a) the sum of (1) the net proceeds from all issuances of ourequity securities since inception (allocated on a pro rata daily basis for such issuances during the fiscalquarter of any such issuance), plus (2) our retained earnings at the end of the most recently completedcalendar quarter (without taking into account any non-cash equity compensation expense incurred incurrent or prior periods), less (b) any amount that we pay to repurchase our common stock since
123

Starwood Property Trust, Inc. and Subsidiaries
Notes to Consolidated Financial Statements (Continued)
As of December 31, 2012
9. Related-Party Transactions (Continued)
inception. It also excludes (1) any unrealized gains and losses and other non-cash items that haveimpacted stockholders’ equity as reported in our financial statements prepared in accordance withGAAP, and (2) one-time events pursuant to changes in GAAP, and certain non-cash items nototherwise described above, in each case after discussions between our Manager and our independentdirectors and approval by a majority of our independent directors. As a result, our stockholders’ equity,for purposes of calculating the management fee, could be greater or less than the amount ofstockholders’ equity shown in our consolidated financial statements.
For the years ended December 31, 2012, 2011, and 2010, approximately $33.3 million, $24.2 millionand $14.1 million, respectively, was incurred for base management fees, of which $0 and $6.7 millionwas payable as of December 31, 2012 and December 31, 2011, respectively.
Incentive Fee. From August 17, 2009 (the effective date of the Management Agreement), ourManager is entitled to be paid the incentive fee described below with respect to each calendar quarter(or part thereof that the management agreement is in effect) if (1) our Core Earnings for the previous12-month period (or part thereof that the management agreement is in effect) exceeds an 8%threshold, and (2) our Core Earnings for the 12 most recently completed calendar quarters (or partthereof that the management agreement is in effect) is greater than zero.
The incentive fee will be an amount, not less than zero, equal to the difference between (1) theproduct of (x) 20% and (y) the difference between (i) our Core Earnings (as defined below) for theprevious 12-month period (or part thereof that the management agreement is in effect), and (ii) theproduct of (A) the weighted-average of the issue price per share of our common stock of all of ourpublic offerings multiplied by the weighted-average number of all shares of common stock outstanding(including any restricted stock units, any restricted shares of common stock and other shares ofcommon stock underlying awards granted under our equity incentive plans) in such previous 12-monthperiod (or part thereof that the management agreement is in effect), and (B) 8%, and (2) the sum ofany incentive fee paid to our Manager with respect to the first three calendar quarters of such previous12-month period (or part thereof that the management agreement is in effect). One half of eachquarterly installment of the incentive fee is payable in shares of our common stock so long as theownership of such additional number of shares by our Manager would not violate the 9.8% stockownership limit set forth in our articles of incorporation, after giving effect to any waiver from suchlimit that our board of directors may grant in the future. The remainder of the incentive fee is payablein cash. The number of shares to be issued to our Manager is equal to the dollar amount of theportion of the quarterly installment of the incentive fee payable in shares divided by the average of theclosing prices of our common stock on the New York Stock Exchange for the five trading days prior tothe date on which such quarterly installment is paid.
Core Earnings is a non-GAAP financial measure. We calculate Core Earnings as GAAP netincome (loss) excluding non-cash equity compensation expense, the incentive fee, depreciation andamortization of real estate (to the extent that we own properties), any unrealized gains, losses or othernon-cash items recorded in net income for the period, regardless of whether such items are included inother comprehensive income (loss), or in net income. The amount is adjusted to exclude one-timeevents pursuant to changes in GAAP and certain other non-cash charges as determined by ourManager and approved by a majority of our independent directors.
124

Starwood Property Trust, Inc. and Subsidiaries
Notes to Consolidated Financial Statements (Continued)
As of December 31, 2012
9. Related-Party Transactions (Continued)
For the years ended December 31, 2012, 2011, and 2010, approximately $7.9 million, $1.2 million,and $1.2 million, respectively, was incurred for the incentive fee, of which $0.7 million and $0 waspayable as of December 31, 2012 and December 31, 2011, respectively.
Expense Reimbursement. We are required to reimburse our Manager for operating expensesincurred by our Manager on our behalf. In addition, pursuant to the terms of the managementagreement, we are required to reimburse our Manager for the cost of legal, tax, consulting, auditingand other similar services rendered for us by our Manager’s personnel provided that such costs are nogreater than those that would be payable if the services were provided by an independent third party.The expense reimbursement is not subject to any dollar limitations but is subject to review by ourindependent directors. For the years ended December 31, 2012, 2011, and 2010, approximately$5.8 million, $4.0 million and $1.6 million was incurred, respectively, for executive compensation andother reimbursable expenses of which approximately $1.1 million and $1.7 million was payable as ofDecember 31, 2012 and 2011, respectively. In addition, see disclosure in Note 10 regarding a contingentreimbursement to our Manager in connection with our IPO that was extinguished during 2011.
Termination Fee. After the initial three-year term, we can terminate the management agreementwithout cause, as defined in the management agreement, with an affirmative two-thirds vote by ourindependent directors and 180 days written notice to our Manager. Upon termination without cause,our Manager is due a termination fee equal to three times the sum of the average annual basemanagement fee and incentive fee earned by our Manager over the preceding eight calendar quarters.No termination fee is payable if our Manager is terminated for cause, as defined in the managementagreement, which can be done at any time with 30 days written notice from our board of directors.
Loan Investments
In April 2011, we purchased a $35 million pari passu participation interest (the ‘‘MammothParticipation Interest’’) in a $75 million subordinate loan (the ‘‘Mammoth Loan’’) from an independentthird party and a syndicate of financial institutions and other entities acting as subordinate lenders toMammoth Mountain Ski Area, LLC (‘‘Mammoth’’). Mammoth is a single-purpose, bankruptcy remoteentity that is owned and controlled by Starwood Global Opportunity Fund VII-A, L.P., Starwood GlobalOpportunity Fund VII-B, L.P., Starwood U.S. Opportunity Fund VII-D, L.P. and Starwood U.S.Opportunity Fund VII-D-2, L.P. (collectively, the ‘‘Sponsors’’). Each of the Sponsors is indirectlywholly-owned by Starwood Capital Group Global I, L.L.C., and an affiliate of our Chief ExecutiveOfficer. The Mammoth Loan was approved by our independent directors in accordance with ourrelated party transaction policy. The Mammoth Loan has a term of up to six years and an interest rateof 14.0% through April 2014 and 13.25% thereafter. We acquired the Mammoth Participation Interestin the Mammoth Loan from an independent third party and own such Mammoth Participation Interestsubject to a participation agreement between us and the independent third party (the ‘‘MammothParticipation Agreement’’). The Mammoth Participation Agreement provides for the payment to us, ona pro rata basis with an independent third party, of customary payments in respect of the MammothParticipation Interest and affords us customary voting, approval and consent rights so long as no eventof default is continuing under the Mammoth Loan.
On July 20, 2012, we purchased a 50% undivided participation interest (the ‘‘Le MeridienParticipation Interest’’) in a EUR-denominated mezzanine loan for $68.4 million (‘‘Le Meridien Loan’’)
125

Starwood Property Trust, Inc. and Subsidiaries
Notes to Consolidated Financial Statements (Continued)
As of December 31, 2012
9. Related-Party Transactions (Continued)
from an independent third party. The borrower is Starman Luxembourg Holdings S.A R.L.(‘‘Holdings’’), an entity that indirectly owns and operates a portfolio of hotels in France and Germany.Holdings is owned 50% by an independent third party and 50% by several private investment fundspreviously sponsored by Starwood Capital Group Global I, L.L.C., an affiliate of our Manager. The LeMeridien Loan has an initial term of two years with an option to extend for an additional year, subjectto certain conditions, an interest rate of 12.5%, an upfront fee of 2.0% and a prepayment fee of 1.0%.We acquired the Le Meridien Participation Interest from an independent third party and own the LeMeridien Participation Interest subject to a participation agreement between us and the independentthird party (the ‘‘Le Meridien Participation Agreement’’). The Le Meridien Participation Agreementprovides for the payment to us, on a pro rata basis with an independent third party, of customarypayments in respect of our Le Meridien Participation Interest and affords us customary voting,approval and consent rights.
On October 16, 2012, through a newly-formed venture with Starwood Distressed Opportunity FundIX (‘‘Fund IX’’), an affiliate of our Manager, we co-originated a $475.0 million first mortgage andmezzanine financing for the acquisition and redevelopment of a 10-story retail building located at 701Seventh Avenue in the Times Square area of Manhattan. Of the total loan amount, $375.0 million wasfunded at closing, $281.2 million of which was funded by the Company and $93.8 million was funded byFund IX. The remaining $100.0 million will be funded upon reaching certain milestones during thetransformation of the property. On October 22, 2012, the venture sold a 25 percent participation inboth the first mortgage and mezzanine loan to Vornado Realty Trust (‘‘Vornado’’). Upon settling thissale, the Company, Fund IX, and Vornado had funded $210.9 million, $70.3 million and $93.8 million,respectively, and each party will fund their pro rata share of any future fundings. Following the sale toVornado, the Starwood entities retained the controlling position in both the first mortgage andmezzanine loans. Fund IX’s interest is recorded under non-controlling interest on the consolidatedbalance sheet.
On December 14, 2012, we acquired 9,140,000 ordinary shares in SEREF, a debt fund that isexternally managed by an affiliate of our Manager and is listed on the London Stock Exchange, forapproximately $14.7 million. As a result, we own approximately 4% of SEREF. Refer to Note 5 foradditional details.
On December 22, 2012, we co-originated a junior mezzanine loan with SEREF, which is securedprimarily by the ownership interest in entities that own a portfolio of three luxury hotels located inLondon, England. The total loan amount was GBP 98 million, of which we and SEREF own a 50% paripassu interest. The loan bears interest at one-month LIBOR plus a margin of 11.65%. The loan maturesin January 2018.
10. Stockholders’ Equity
The Company’s authorized capital stock consists of 100,000,000 shares of preferred stock, $0.01 parvalue per share, and 500,000,000 shares of common stock, $0.01 par value per share.
On August 17, 2009, we sold 47,575,000 shares of our common stock (including 1,000,000 sharessold to an entity controlled by Starwood Capital Group pursuant to a simultaneous private placement)in our IPO at an offering price of $20 per share.
126

Starwood Property Trust, Inc. and Subsidiaries
Notes to Consolidated Financial Statements (Continued)
As of December 31, 2012
10. Stockholders’ Equity (Continued)
In December 2010, we completed a follow-on offering of 23,000,000 shares of our common stockat a price of $19.73 per share.
In May 2011, we completed another follow-on offering of 22,000,000 shares of our common stockat a price of $21.67 per share.
In April 2012, we completed another follow-on offering of 23,000,000 shares of our common stockat a price of $19.88 per share.
In June 2012, we entered into an ATM Equity Offering Sales Agreement with Merrill Lynch,Pierce, Fenner & Smith Incorporated, (the ‘‘Agent’’), relating to our shares of common stock. Inaccordance with the terms of the agreement, we may offer and sell shares of our common stock havingan aggregate gross sales price of up to $250 million from time to time through the agent, as our salesAgent. Sales of the shares, if any, will be made by means of ordinary brokers’ transactions or otherwiseat market prices prevailing at the time of sale, at prices related to prevailing market prices or atnegotiated prices.
In October 2012, we completed another follow-on offering of 18,400,000 shares of our commonstock at a price of $22.74 per share.
At the time of our IPO in 2009, the underwriters for the IPO agreed to defer and condition thereceipt of a portion of their underwriting fees on our future achievement of certain minimuminvestment returns. Similarly, at the time of the IPO our Manager agreed to pay to the underwriters aseparate portion of the underwriting fees on our behalf, with our reimbursement of our Manager ofthose amounts conditioned upon our achievement of the same investment returns. In the absence ofthe achievement of such investment returns, we would not pay the underwriters the deferred portion ofthe underwriting fees nor would our Manager be reimbursed for the portion of the underwriting feesthat it paid on our behalf. Specifically, pursuant to the IPO underwriting agreement among theunderwriters, our Manager and us, we were required to pay to the underwriters $18.1 million ofunderwriting fees if during any full four calendar quarter period during the 24 full calendar quartersafter the consummation of the IPO our Core Earnings for any such four-quarter period exceeded theproduct of (x) the weighted-average of the issue price per share of all public offerings of our commonstock, multiplied by the weighted-average number of shares outstanding (including any restricted stockunits, any restricted shares of common stock and any other shares of common stock underlying awardsgranted under our equity incentive plans) in such four-quarter period and (y) 8%. Additionally, becauseat the time of our IPO our Manager paid $9.1 million of underwriting fees on our behalf, pursuant toour management agreement with our Manager, we agreed to reimburse our Manager for suchpayments to the extent the same 8% performance threshold was exceeded. For the four calendarquarter periods ended March 31, 2011 we exceeded the threshold and therefore paid $27.2 millionrelated to these contingent arrangements during the second quarter of 2011. Prior to 2012, we hadrecorded a deferred liability and an offsetting reduction to additional paid-in-capital for the full$27.2 million based upon actual and forecasted operating results at the time. Refer to Note 9 fordisclosure of the expenses incurred for the year ended December 31, 2012.
In August 2011, our board of directors authorized us to repurchase up to $100.0 million of ouroutstanding common stock over a one-year period. Purchases made pursuant to the program are to bemade in either the open market or in privately negotiated transactions from time to time as permittedby federal securities laws and other legal requirements. The timing, manner, price and amount of any
127

Starwood Property Trust, Inc. and Subsidiaries
Notes to Consolidated Financial Statements (Continued)
As of December 31, 2012
10. Stockholders’ Equity (Continued)
repurchases are determined by us and are subject to economic and market conditions, stock price,applicable legal requirements and other factors. The program may be suspended or discontinued at anytime. Through December 31, 2011, we purchased 625,850 shares of common stock on the open marketat an aggregate cost of approximately $10.6 million, resulting in a weighted-average share cost of$17.00.
The Company’s board of directors declared a dividend of $0.44 per share of common stock for thequarter ended March 31, 2012. The dividend was paid on April 13, 2012 to common stockholders ofrecord as of March 30, 2012. The board also declared a dividend of $0.44 per share of common stockfor the quarter ended June 30, 2012. The dividend was paid on July 13, 2012 to common stockholdersof record as of June 29, 2012. The board further declared a dividend of $0.44 per share of commonstock for the quarter ended September 30, 2012. The dividend was paid on October 15, 2012 tocommon stockholders of record as of September 28, 2012. On November 6, 2012, the board declared aquarterly dividend of $0.44 per share of common stock as well as declaring a special dividend of $0.10per share of common stock on December 13th for the quarter ended December 31, 2012. The dividendwas paid on January 15, 2013 to common stockholders of record as of December 31, 2012.
Equity Incentive Plans
We have reserved an aggregate of 3,112,500 shares of common stock for issuance under theStarwood Property Trust, Inc. Equity Plan and Starwood Property Trust, Inc. Manager Equity Plan andan additional 100,000 shares of common stock for issuance under the Starwood Property Trust, Inc.Non-Executive Director Stock Plan. The Equity Plan and Manager Equity Plan provide for the issuanceof stock options, stock appreciation rights, restricted stock, restricted stock units, and other equity-based awards. The Non-Executive Director Stock Plan provide for the issuance of restricted stock,restricted stock units and other equity-based awards. To date, we have only granted restricted stock andrestricted stock units. The holders of awards of restricted stock or restricted stock units are entitled toreceive dividends or ‘‘distribution equivalents,’’ which will be payable at such time dividends are paidon our outstanding shares of common stock.
We granted each of our four independent directors 2,200 shares of restricted stock concurrentlywith our IPO, with a total fair value of approximately $175,000. The grants vest ratably in three annualinstallments on each of the first, second, and third anniversaries of the grant date, respectively, subjectto the director’s continued service. Effective August 19, 2010, we granted each of our four independentdirectors an additional 1,000 shares of restricted stock, with a total fair value of approximately $75,000.The grants vested in one annual installment on the first anniversary of the grant. Effective August 19,2011, we granted each of our four independent directors an additional 2,877 shares of restricted stock,with a total fair value of approximately $200,000. The grant will vest in one annual installment on thefirst anniversary of the grant, subject to the director’s continued service. Effective August 19, 2012, wegranted each of our four independent directors an additional 2,201 shares of restricted stock, with atotal fair value of approximately $200,000. The grant will vest in one annual installment on the firstanniversary of the grant, subject to the director’s continued service. For the years ended December 31,2012, 2011, and 2010, approximately $242 thousand, $179 thousand, and $86 thousand were included ingeneral and administrative expense, respectively, related to the grants.
128

Starwood Property Trust, Inc. and Subsidiaries
Notes to Consolidated Financial Statements (Continued)
As of December 31, 2012
10. Stockholders’ Equity (Continued)
In August 2009, we granted 1,037,500 restricted stock units with a fair value of approximately$20.8 million at the grant date to our Manager under the Manager Equity Plan. The grants vest ratablyin quarterly installments over three years beginning on October 1, 2009, with 86,458 shares vesting eachquarter, respectively. In connection with the supplemental equity offering in December 2010, wegranted 1,075,000 restricted stock units with a fair value of approximately $21.8 million at the grantdate to our Manager under the Manager Equity Plan. The grants vest ratably in quarterly installmentsover three years beginning on March 31, 2011, with 89,583 shares vesting each quarter. In May 2012,we granted 30,000 restricted common shares to the Manager under the Manager Equity Plan. Inconnection with the supplemental equity offering in October 2012, we granted 875,000 restricted stockunits with a fair value of approximately $19.9 million at the grant date to our Manager under theManager Equity Plan. The grants vest ratably in quarterly installments over three years beginning onDecember 31, 2012, with 72,917 shares vesting each quarter. For the years ended December 31, 2012,2011, and 2010, approximately 720,625, 704,164, and 432,292 shares have vested, respectively, andapproximately $15.7 million, $13.5 million, and $7.4 million have been included in management feesrelated to these grants, respectively.
In May 2011, we issued 9,021 shares of common stock to our Manager at a price of $22.08 pershare. The shares were issued to our Manager as part of the incentive compensation due to ourManager under the management agreement.
In August 2011, we issued 54,234 shares of common stock to our Manager at a price of $18.58 pershare. The shares were issued to our Manager as part of the incentive compensation due to ourManager under the management agreement.
In May 2012, we issued 70,220 shares of common stock to our Manger at a price of $19.76 pershare. The shares were issued to our Manager as a part of the incentive compensation due to ourManager under the management agreement.
In August 2012, we issued 50,203 shares of common stock to our Manger at a price of $22.61 pershare. The shares were issued to our Manager as a part of the incentive compensation due to ourManager under the management agreement.
In November 2012, we issued 46,653 shares of common stock to our Manger at a price of $22.91per share. The shares were issued to our Manager as a part of the incentive compensation due to ourManager under the management agreement.
We granted 5,000 restricted stock units with a fair value of $100 thousand to an employee underthe Starwood Property Trust, Inc. Equity Plan in August 2009. The award was scheduled to vest ratablyin quarterly installments over three years beginning on October 1, 2009. Upon the departure of thisemployee in July 2010, we issued 1,250 shares of our common stock relating to the vested portion ofthe award, while the remaining 3,750 unvested units were forfeited. In February 2011, we granted11,082 restricted stock units with a fair value of $250 thousand to an employee under the StarwoodProperty Trust, Inc. Equity Plan. The award vests ratably in quarterly installments over three yearsbeginning on March 31, 2011. In March 2012, we granted 17,500 restricted common shares with a fairvalue of $368 thousand to employees under the Starwood Property Trust, Inc. Equity Plan. Of the totalaward, 12,500 restricted shares vest in quarterly installments over three years beginning on March 31,2012 and 5,000 shares vest in annual installments over three years beginning on December 31, 2012.For the years ended December 31, 2012, December 31, 2011, and December 31, 2010, 9,527, 3,694, and
129
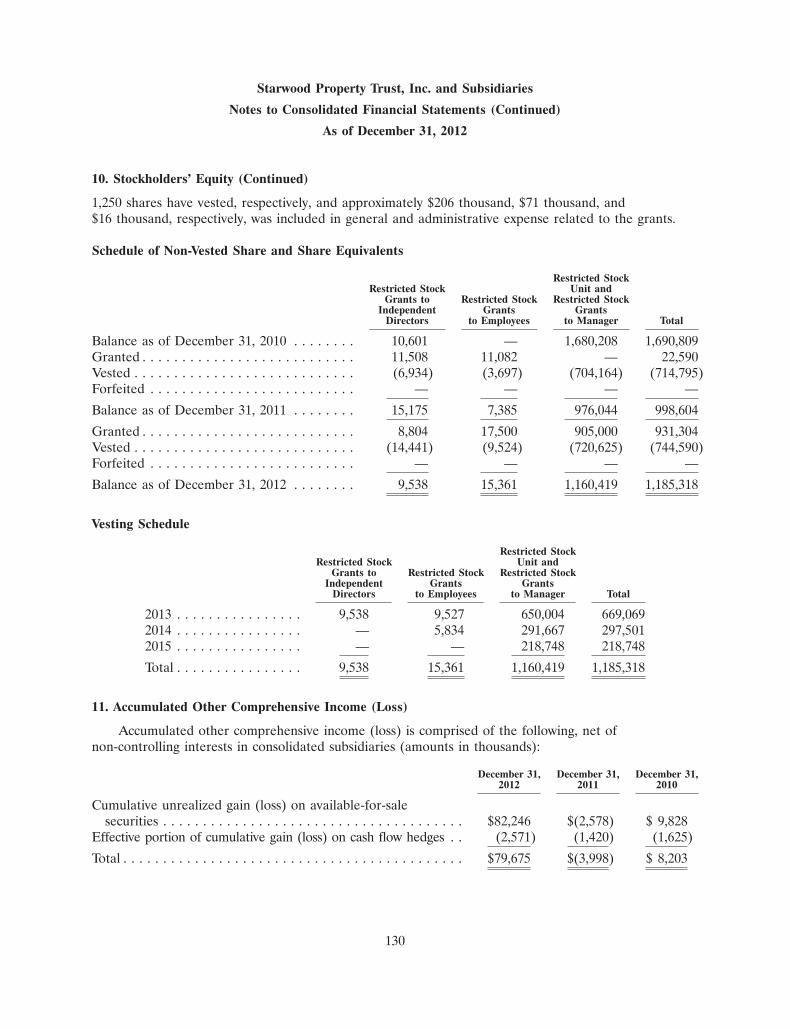
Starwood Property Trust, Inc. and Subsidiaries
Notes to Consolidated Financial Statements (Continued)
As of December 31, 2012
10. Stockholders’ Equity (Continued)
1,250 shares have vested, respectively, and approximately $206 thousand, $71 thousand, and$16 thousand, respectively, was included in general and administrative expense related to the grants.
Schedule of Non-Vested Share and Share Equivalents
Restricted StockRestricted Stock Unit and
Grants to Restricted Stock Restricted StockIndependent Grants Grants
Directors to Employees to Manager Total
Balance as of December 31, 2010 . . . . . . . . 10,601 — 1,680,208 1,690,809Granted . . . . . . . . . . . . . . . . . . . . . . . . . . . 11,508 11,082 — 22,590Vested . . . . . . . . . . . . . . . . . . . . . . . . . . . . (6,934) (3,697) (704,164) (714,795)Forfeited . . . . . . . . . . . . . . . . . . . . . . . . . . — — — —
Balance as of December 31, 2011 . . . . . . . . 15,175 7,385 976,044 998,604
Granted . . . . . . . . . . . . . . . . . . . . . . . . . . . 8,804 17,500 905,000 931,304Vested . . . . . . . . . . . . . . . . . . . . . . . . . . . . (14,441) (9,524) (720,625) (744,590)Forfeited . . . . . . . . . . . . . . . . . . . . . . . . . . — — — —
Balance as of December 31, 2012 . . . . . . . . 9,538 15,361 1,160,419 1,185,318
Vesting Schedule
Restricted StockRestricted Stock Unit and
Grants to Restricted Stock Restricted StockIndependent Grants Grants
Directors to Employees to Manager Total
2013 . . . . . . . . . . . . . . . . 9,538 9,527 650,004 669,0692014 . . . . . . . . . . . . . . . . — 5,834 291,667 297,5012015 . . . . . . . . . . . . . . . . — — 218,748 218,748
Total . . . . . . . . . . . . . . . . 9,538 15,361 1,160,419 1,185,318
11. Accumulated Other Comprehensive Income (Loss)
Accumulated other comprehensive income (loss) is comprised of the following, net ofnon-controlling interests in consolidated subsidiaries (amounts in thousands):
December 31, December 31, December 31,2012 2011 2010
Cumulative unrealized gain (loss) on available-for-salesecurities . . . . . . . . . . . . . . . . . . . . . . . . . . . . . . . . . . . . . . $82,246 $(2,578) $ 9,828
Effective portion of cumulative gain (loss) on cash flow hedges . . (2,571) (1,420) (1,625)
Total . . . . . . . . . . . . . . . . . . . . . . . . . . . . . . . . . . . . . . . . . . . $79,675 $(3,998) $ 8,203
130

Starwood Property Trust, Inc. and Subsidiaries
Notes to Consolidated Financial Statements (Continued)
As of December 31, 2012
12. Net Income per Share
The following table provides a reconciliation of both net income and the number of commonshares used in the computation of basic and diluted income per share. We use the two-class method incalculating both basic and diluted earnings per share as our unvested restricted stock units (refer toNote 10) are participating securities as defined in GAAP (amounts in thousands except share and pershare amounts):
Year ended Year ended Year endedDecember 31, 2012 December 31, 2011 December 31, 2010
Net income attributable to Starwood PropertyTrust, Inc. . . . . . . . . . . . . . . . . . . . . . . . . . . . $ 201,195 $ 119,377 $ 57,046
Net income allocated to participating securities . . (1,605) (2,226) (1,388)Numerator for basic and diluted net income per
share . . . . . . . . . . . . . . . . . . . . . . . . . . . . . . . $ 199,590 $ 117,151 $ 55,658
Basic weighted average shares outstanding . . . . . . 113,721,070 84,974,604 49,138,720
Weighted average number of diluted sharesoutstanding(1) . . . . . . . . . . . . . . . . . . . . . . . . . 114,633,183 86,409,327 50,021,824
Basic income per share . . . . . . . . . . . . . . . . . . . . $ 1.76 $ 1.38 $ 1.16
Diluted income per share . . . . . . . . . . . . . . . . . . $ 1.76 $ 1.38 $ 1.14
(1) The weighted average number of diluted shares outstanding includes the impact of unvestedrestricted stock units totaling 1,185,318, 998,604, and 1,690,810 as of December 31, 2012,December 31, 2011, and December 31 2010, respectively.
Since distributions were greater than earnings during the years ended December 31, 2012,December 31, 2011, and December 31, 2010, the diluted earnings per share calculation would result inanti-dilution and therefore diluted EPS has been computed in the same manner as basic earnings pershare.
13. Fair Value of Financial Instruments
GAAP establishes a hierarchy of valuation techniques based on the observability of inputs utilizedin measuring financial instruments at fair values. GAAP establishes market-based or observable inputsas the preferred source of values, followed by valuation models using management assumptions in theabsence of market inputs. The three levels of the hierarchy are described below:
Level I—Quoted prices in active markets for identical assets or liabilities.
Level II—Prices are determined using other significant observable inputs. Observable inputsare inputs that other market participants would use in pricing a security. These may include quotedprices for similar securities, interest rates, prepayment speeds, credit risk and others.
Level III—Prices are determined using significant unobservable inputs. In situations wherequoted prices or observable inputs are unavailable (for example, when there is little or no marketactivity for an investment) unobservable inputs may be used. Unobservable inputs reflect our ownassumptions about the factors that market participants would use in pricing an asset or liability,and would be based on the best information available.
131

Starwood Property Trust, Inc. and Subsidiaries
Notes to Consolidated Financial Statements (Continued)
As of December 31, 2012
13. Fair Value of Financial Instruments (Continued)
Financial Instruments and Fair Value—Valuation Process.
Our Asset Management Group (‘‘AMG’’) is responsible for the Company’s fair value valuationpolicies, processes and procedures. Asset management reports to the Chief Financial Officer (‘‘CFO’’),who has final authority over the valuation of the Company’s financial instruments. AMG implementsvaluation control processes to validate the fair value of the Company’s financial instruments measuredat fair value including those derived from pricing models. These control processes are designed toassure that the values used for financial reporting are based on observable inputs wherever possible. Inthe event that observable inputs are not available, the control processes are designed to assure that thevaluation approach utilized is appropriate and consistently applied and the assumptions are reasonable.
Pricing Verification—AMG uses recently executed transactions, other observable market data suchas exchange data, broker/dealer quotes, third-party pricing vendors and aggregation services forvalidating the fair values of financial instruments generated using valuation models. Pricing dataprovided by approved external sources is evaluated using a number of approaches; for example, bycorroborating the external sources’ prices to executed trades, analyzing the methodology andassumptions used by the external source to generate a price and/or by evaluating how active the third-party pricing source (or originating sources used by the third-party pricing source) is in the market.
Unobservable Inputs—Where inputs are not observable, AMG reviews the appropriateness of theproposed valuation methodology to ensure it is consistent with how a market participant would arriveat the unobservable input. The valuation methodologies utilized in the absence of observable inputsmay include extrapolation techniques and the use of comparable observable inputs.
We determine the fair value of our financial instruments as follows:
Available-for-sale debt securities
Available-for-sale debt securities valued utilizing observable and unobservable market inputs. Theobservable market inputs for RMBS include recent transactions, broker quotes and vendor prices(‘‘market data’’). However, given the implied price dispersion amongst the market data, the fair valuedetermination for RMBS has also significantly utilized unobservable inputs in discounted cash flowmodels including prepayments, default and severity estimates based on the recent performance of thecollateral, the underlying collateral characteristics, industry trends, as well as expectations of macro-economic events (e.g. housing price curves, interest rate curves, etc.). At each measurement date, weconsider both the observable and unobservable valuation inputs in the determination of fair value.However, given the significance of the unobservable inputs these securities have been classified withinLevel III.
The observable market inputs for CMBS include market data. Due to an increase in theobservable, relevant market activity for the CMBS investment position that we owned as of January 1,2012, we transferred this investment from Level III to Level II in the first quarter of 2012.
Available-for-sale equity securities
The available-for-sale equity securities are publicly registered and traded in the United States andtheir prices are listed on the New York Stock Exchange. These securities have been classified withinLevel I.
132

Starwood Property Trust, Inc. and Subsidiaries
Notes to Consolidated Financial Statements (Continued)
As of December 31, 2012
13. Fair Value of Financial Instruments (Continued)
Derivatives
The valuation of derivative contracts are determined using widely accepted valuation techniquesincluding discounted cash flow analysis on the expected cash flows of each derivative. This analysisreflects the contractual terms of the derivatives, including the period to maturity, and uses observablemarket-based inputs, including interest rate curves, spot and market forward points. The fair values ofinterest rate swaps are determined using the market standard methodology of netting the discountedfuture fixed cash payments and the discounted expected variable cash receipts. The variable cashreceipts are based on an expectation of future interest rates (forward curves) derived from observablemarket interest rate curves. The fair value of the foreign currency forward contracts is based on interestdifferentials between the currencies being traded, spot and market forward points.
We incorporate credit valuation adjustments to appropriately reflect both our own nonperformancerisk and the respective counterparty’s nonperformance risk in the fair value measurements. In adjustingthe fair value of its derivative contracts for the effect of nonperformance risk, we have considered theimpact of netting and any applicable credit enhancements, such as collateral postings, thresholds,mutual puts, and guarantees.
Although we have determined that the majority of the inputs used to value our derivatives fallwithin Level II of the fair value hierarchy, the credit valuation adjustments associated with ourderivatives utilize Level III inputs, such as estimates of current credit spreads to evaluate the likelihoodof default by itself and its counterparties. However, as of December 31, 2012, we have assessed thesignificance of the impact of the credit valuation adjustments on the overall valuation of our derivativepositions and have determined that the credit valuation adjustments are not significant to the overallvaluation of our derivatives. As a result, we have determined that our derivative valuations in theirentirety are classified in Level II of the fair value hierarchy.
Loans
We estimate the fair values of our loans by discounting their expected cash flows at a rate weestimate would be demanded by the market participants that are most likely to buy our loans. Theexpected cash flows used are generally the same as those used to calculate our level yield income in thefinancial statements.
Any changes to the valuation methodology will be reviewed by our management to ensure thechanges are appropriate. The methods used may produce a fair value calculation that is not indicativeof net realizable value or reflective of future fair values. Furthermore, while we anticipate that ourvaluation methods are appropriate and consistent with other market participants, the use of differentmethodologies, or assumptions, to determine the fair value of certain financial instruments could resultin a different estimate of fair value at the reporting date. We use inputs that are current as of themeasurement date, which may fall within periods of market dislocation, during which price transparencymay be reduced.
133

Starwood Property Trust, Inc. and Subsidiaries
Notes to Consolidated Financial Statements (Continued)
As of December 31, 2012
13. Fair Value of Financial Instruments (Continued)
The following table presents our financial instruments carried at fair value on a recurring basis inthe consolidated balance sheet as of December 31, 2012 (amounts in thousands):
Fair Value at Reporting Date Using Inputs:December 31, 2012
Total Level I Level II Level III
Available-for-sale debt securities:RMBS . . . . . . . . . . . . . . . . . . . . . . . . . . . . . . . . . . . . . $333,153 $ — $ — $333,153CMBS . . . . . . . . . . . . . . . . . . . . . . . . . . . . . . . . . . . . . 529,434 529,434 —
Total available-for-sale debt securities . . . . . . . . . . . . . 862,587 — 529,434 333,153Available-for-sale equity securities:
Real estate industry . . . . . . . . . . . . . . . . . . . . . . . . . . . . 21,667 21,667 — —Total available-for-sale equity securities: . . . . . . . . . . . 21,667 21,667 — —
Total investments: . . . . . . . . . . . . . . . . . . . . . . . . . . 884,254 21,667 529,434 333,153Derivative assets:
Foreign exchange contracts . . . . . . . . . . . . . . . . . . . . . . 4,335 4,335Interest rate contracts . . . . . . . . . . . . . . . . . . . . . . . . . . 4,892 4,892
Derivative liabilities:Interest rate contracts . . . . . . . . . . . . . . . . . . . . . . . . (4,343) (4,343)Foreign exchange contracts . . . . . . . . . . . . . . . . . . . . . (23,427) (23,427)Total Derivatives: . . . . . . . . . . . . . . . . . . . . . . . . . . . . (18,543) — (18,543) —
Total: . . . . . . . . . . . . . . . . . . . . . . . . . . . . . . . . . . . $865,711 $21,667 $510,891 $333,153
The changes in investments classified as Level III are as follows for the year ended December 31,2012 (amounts in thousands):
Fair Value Measurements Using Significant Unobservable Inputs(Level III)
Loans held-for-sale, at MBS available-fair value for-sale, at fair value Total
Beginning balance, January 1, 2012 . . . . . . . . . . . $ 128,593 $ 341,734 $ 470,327Purchases . . . . . . . . . . . . . . . . . . . . . . . . . . . — 254,034 254,034Originations . . . . . . . . . . . . . . . . . . . . . . . . . — — —Transfer out . . . . . . . . . . . . . . . . . . . . . . . . . — (176,786) (176,786)Sales . . . . . . . . . . . . . . . . . . . . . . . . . . . . . . (132,128) (87,956) (220,084)Maturities . . . . . . . . . . . . . . . . . . . . . . . . . . . — — —Principal repayments . . . . . . . . . . . . . . . . . . . (122) (69,298) (69,420)Net increase (decrease) in assets . . . . . . . . . . (132,250) (80,006) (212,256)
Gain (loss) amounts from Level III investments:Unrealized (loss) gain on assets . . . . . . . . . . . (5,760) 49,502 43,742Realized gain on assets . . . . . . . . . . . . . . . . . 9,417 8,245 17,662Accretion of discount . . . . . . . . . . . . . . . . . . — 18,079 18,079OTTI . . . . . . . . . . . . . . . . . . . . . . . . . . . . . . — (4,401) (4,401)Net gain on assets . . . . . . . . . . . . . . . . . . . . . 3,657 71,425 75,082
Ending balance, as of December 31, 2012 . . . . . . . $ — $ 333,153 $ 333,153
134

Starwood Property Trust, Inc. and Subsidiaries
Notes to Consolidated Financial Statements (Continued)
As of December 31, 2012
13. Fair Value of Financial Instruments (Continued)
Due to an increase in the observable, relevant market activity for the CMBS investment positionthat we owned as of January 1, 2012, we transferred a $176,786 MBS investment from Level III toLevel II during the three months ended March 31, 2012.
The following table presents our financial instruments carried at fair value on a recurring basis inthe consolidated balance sheet as of December 31, 2011 (amounts in thousands):
Fair Value at Reporting Date Using Inputs:December 31, 2011
Total Level I Level II Level III
Loans held-for-sale at fair value . . . . . . . . . . . . . . . . . . . $128,593 $128,593
Available-for-sale debt securities:RMBS . . . . . . . . . . . . . . . . . . . . . . . . . . . . . . . . . . . . . 164,948 164,948CMBS . . . . . . . . . . . . . . . . . . . . . . . . . . . . . . . . . . . . . 176,786 176,786
Total available-for-sale debt securities . . . . . . . . . . . . . 341,734 — — 341,734
Available-for-sale equity securities:Real estate industry . . . . . . . . . . . . . . . . . . . . . . . . . . . . 11,269 $11,269 — —
Total available-for-sale equity securities: . . . . . . . . . . . 11,269 11,269 — —
Total investments: . . . . . . . . . . . . . . . . . . . . . . . . . . 481,596 11,269 — 470,327
Derivative assets:Foreign exchange contracts . . . . . . . . . . . . . . . . . . . . . . 5,261 $ 5,261Interest rate contracts . . . . . . . . . . . . . . . . . . . . . . . . . . 7,555 7,555
Derivative liabilities:Interest rate contracts . . . . . . . . . . . . . . . . . . . . . . . . (12,762) (12,762)Foreign exchange contracts . . . . . . . . . . . . . . . . . . . . . (6,890) (6,890)
Total Derivatives: . . . . . . . . . . . . . . . . . . . . . . . . . . . . (6,836) (6,836) —
Total: . . . . . . . . . . . . . . . . . . . . . . . . . . . . . . . . . . . $474,760 $11,269 $ (6,836) $470,327
135

Starwood Property Trust, Inc. and Subsidiaries
Notes to Consolidated Financial Statements (Continued)
As of December 31, 2012
13. Fair Value of Financial Instruments (Continued)
The changes in investments classified as Level III are as follows for the year ended December 31,2011 (amounts in thousands):
Fair Value Measurements Using Significant Unobservable Inputs(Level III)
Loans held-for-sale, at MBS available-fair value for-sale, at fair value Total
Beginning balance, January 1, 2011 . . . . . . . . . . . $ 144,163 $ — $ 144,163
Purchases . . . . . . . . . . . . . . . . . . . . . . . . . . . — 115,795 115,795Originations . . . . . . . . . . . . . . . . . . . . . . . . . 270,066 — 270,066Transfer out/in . . . . . . . . . . . . . . . . . . . . . . . (7,000) 282,763 275,763Sales . . . . . . . . . . . . . . . . . . . . . . . . . . . . . . (294,126) (3,600) (297,726)Maturities . . . . . . . . . . . . . . . . . . . . . . . . . . . — (15,408) (15,408)Principal repayments . . . . . . . . . . . . . . . . . . . (252) (36,562) (36,814)
Net increase on assets . . . . . . . . . . . . . . . . . . (31,312) 342,988 311,676
Gain (loss) on loans held-for-sale, at fair value:Unrealized gain on assets . . . . . . . . . . . . . . . 5,760 (7,961) (2,201)Realized gain on assets . . . . . . . . . . . . . . . . . 10,314 249 10,563Accretion of discount . . . . . . . . . . . . . . . . . . — 10,730 10,730OTTI . . . . . . . . . . . . . . . . . . . . . . . . . . . . . . — (4,272) (4,272)Other . . . . . . . . . . . . . . . . . . . . . . . . . . . . . . (332) — (332)
Net gain on assets . . . . . . . . . . . . . . . . . . . . . 15,742 (1,254) 14,488
Ending balance, as of December 31, 2011 . . . . . . . $ 128,593 $341,734 $ 470,327
During the year ended December 31, 2011, we originated various loans that we intend to sell inthe short-term. At the time of the origination, we elected to account for these loans at fair value. Theassociated interest rate and credit spread derivatives were not designated as hedging instruments foraccounting purposes. As a result, changes in the fair value of these derivatives are reported in currentearnings. It is expected that changes in the fair value of the held-for-sale loans, which will also berecorded through earnings as a result of our fair value election, will materially offset the changes in thefair value of the interest rate and credit spread derivatives. There was no unpaid principal balance onthe loans as of December 31, 2012.
GAAP requires disclosure of fair value information about financial instruments, whether or notrecognized in the financial statements, for which it is practical to estimate the value. In cases wherequoted market prices are not available, fair values are based upon the estimation of discount rates toestimated future cash flows using market yields or other valuation methodologies. Considerablejudgment is necessary to interpret market data and develop estimated fair value. Accordingly, fairvalues are not necessarily indicative of the amount we could realize on disposition of the financialinstruments. The use of different market assumptions or estimation methodologies could have amaterial effect on the estimated fair value amounts.
136

Starwood Property Trust, Inc. and Subsidiaries
Notes to Consolidated Financial Statements (Continued)
As of December 31, 2012
13. Fair Value of Financial Instruments (Continued)
The fair value of cash and cash equivalents, and cash collateral under treasury securities loanagreement accrued interest and accounts payable approximate to their carrying values due to theirshort-term nature.
The following table presents the fair value of our financial instruments, including loans transferredas secured borrowings, not carried at fair value on the consolidated balance sheet (amounts inthousands):
Carrying Fair Value Carrying Value Fair ValueValue as of as of as of as of
December 31, 2012 December 31, 2012 December 31, 2011 December 31, 2011
Financial Instruments notcarried at Fair Value:Loans, net . . . . . . . . . . . . . . $3,000,335 $3,097,089 $2,318,915 $2,359,258Other Investments . . . . . . . . . $ 101,201 $ 101,201 $ 33,110 $ 33,110
Financial Liabilities:Secured financing agreements
and loan transfer securedborrowings . . . . . . . . . . . . $1,393,705 $1,397,128 $1,156,716 $1,157,811
137

Starwood Property Trust, Inc. and Subsidiaries
Notes to Consolidated Financial Statements (Continued)
As of December 31, 2012
13. Fair Value of Financial Instruments (Continued)
The following is quantitative information about significant unobservable inputs in our Level IIIMeasurements (dollar amounts in thousands):
Quantitative Information about Level III Fair Value Measurements
Significant UnobservableInputs/ Sensitivity of the Fair
Fair Value at Value to Changes in theDecember 31, 2012 Valuation Technique(s) Unobservable Inputs Range(1)
RMBS . . . . . . . . . . . . . . . . . $ 333,153 Discounted cash flow Constant prepayment rate(a) (0.6)%–11.5%Constant default rate(b) 2.0%–16.0%Loss severity(b) 18%–102%(f)Delinquency Rate(c) 5%–60%Servicer Advances(a) 10%–100%Annual Coupon Deterioration(b) 0%–1.4%Putback Amount per Projected 0%–9%Total Collateral Loss(a)Putback Recovery Date(d) 11/2013–12/2015
Loans held for investment . . . . . $3,011,757 Discounted cash flow Projected cash flows(a) (e) 3.9%–14.8%Discount rates(b)
Loans transferred as secured $ 85,332 Discounted cash flow Projected cash flows(a) (e) 4.6%–5.2%borrowings . . . . . . . . . . . . . Discount rates(b)
Other investments(2) . . . . . . . . $ 101,201(3) (g) (g) (g)
Secured financing agreements . . $1,308,194 Discounted cash flow Projected cash flows(b) 2.0%–5.4%Discount rates(a)
Loan transfer secured borrowings $ 88,934 Discounted cash flow Projected cash flows(b) 3.5%–3.8%Discount rates(a)
(1) The ranges of significant unobservable inputs are represented in percentages and dates.
(2) Includes investments in LLC and non-performing loan pools.
(3) Principally represents our investments in non-performing loan pool holdings.
Sensitivity of the Fair Value to Changes in the Unobservable Inputs
(a) Significant increase (decrease) in the unobservable input in isolation would result in a significantly higher (lower) fair valuemeasurement.
(b) Significant increase (decrease) in the unobservable input in isolation would result in a significantly lower (higher) fair valuemeasurement.
(c) Significant increase (decrease) in the unobservable input in isolation would result in either a significantly lower or higher(lower or higher) fair value measurement depending on the structural features of the security in question.
(d) Any delay in the Putback Recovery Date leads to a decrease in fair value, for the majority of securities in our RMBSportfolio.
(e) As of December 31, 2012, management expects to collect all amounts contractually due.
(f) 90% of the portfolio falls within a range of 35-82%.
(g) The non-performing loan pool was acquired in November 2012, as such, fair value approximates cost basis.
138
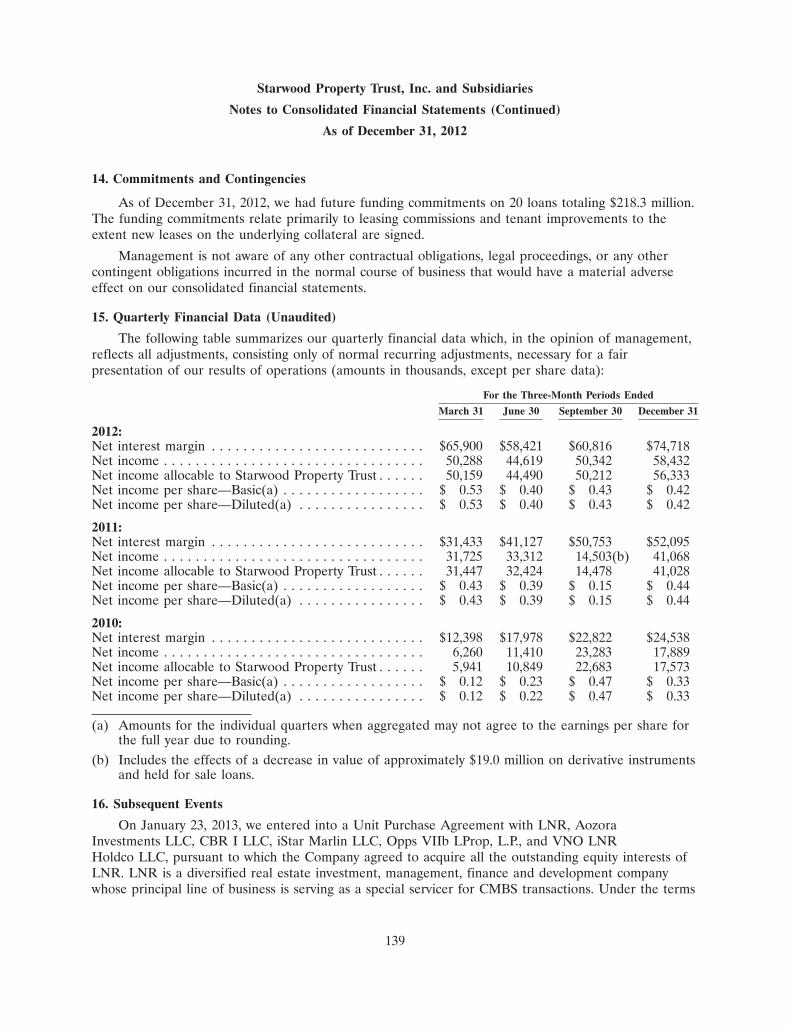
Starwood Property Trust, Inc. and Subsidiaries
Notes to Consolidated Financial Statements (Continued)
As of December 31, 2012
14. Commitments and Contingencies
As of December 31, 2012, we had future funding commitments on 20 loans totaling $218.3 million.The funding commitments relate primarily to leasing commissions and tenant improvements to theextent new leases on the underlying collateral are signed.
Management is not aware of any other contractual obligations, legal proceedings, or any othercontingent obligations incurred in the normal course of business that would have a material adverseeffect on our consolidated financial statements.
15. Quarterly Financial Data (Unaudited)
The following table summarizes our quarterly financial data which, in the opinion of management,reflects all adjustments, consisting only of normal recurring adjustments, necessary for a fairpresentation of our results of operations (amounts in thousands, except per share data):
For the Three-Month Periods Ended
March 31 June 30 September 30 December 31
2012:Net interest margin . . . . . . . . . . . . . . . . . . . . . . . . . . . $65,900 $58,421 $60,816 $74,718Net income . . . . . . . . . . . . . . . . . . . . . . . . . . . . . . . . . 50,288 44,619 50,342 58,432Net income allocable to Starwood Property Trust . . . . . . 50,159 44,490 50,212 56,333Net income per share—Basic(a) . . . . . . . . . . . . . . . . . . $ 0.53 $ 0.40 $ 0.43 $ 0.42Net income per share—Diluted(a) . . . . . . . . . . . . . . . . $ 0.53 $ 0.40 $ 0.43 $ 0.42
2011:Net interest margin . . . . . . . . . . . . . . . . . . . . . . . . . . . $31,433 $41,127 $50,753 $52,095Net income . . . . . . . . . . . . . . . . . . . . . . . . . . . . . . . . . 31,725 33,312 14,503(b) 41,068Net income allocable to Starwood Property Trust . . . . . . 31,447 32,424 14,478 41,028Net income per share—Basic(a) . . . . . . . . . . . . . . . . . . $ 0.43 $ 0.39 $ 0.15 $ 0.44Net income per share—Diluted(a) . . . . . . . . . . . . . . . . $ 0.43 $ 0.39 $ 0.15 $ 0.44
2010:Net interest margin . . . . . . . . . . . . . . . . . . . . . . . . . . . $12,398 $17,978 $22,822 $24,538Net income . . . . . . . . . . . . . . . . . . . . . . . . . . . . . . . . . 6,260 11,410 23,283 17,889Net income allocable to Starwood Property Trust . . . . . . 5,941 10,849 22,683 17,573Net income per share—Basic(a) . . . . . . . . . . . . . . . . . . $ 0.12 $ 0.23 $ 0.47 $ 0.33Net income per share—Diluted(a) . . . . . . . . . . . . . . . . $ 0.12 $ 0.22 $ 0.47 $ 0.33
(a) Amounts for the individual quarters when aggregated may not agree to the earnings per share forthe full year due to rounding.
(b) Includes the effects of a decrease in value of approximately $19.0 million on derivative instrumentsand held for sale loans.
16. Subsequent Events
On January 23, 2013, we entered into a Unit Purchase Agreement with LNR, AozoraInvestments LLC, CBR I LLC, iStar Marlin LLC, Opps VIIb LProp, L.P., and VNO LNRHoldco LLC, pursuant to which the Company agreed to acquire all the outstanding equity interests ofLNR. LNR is a diversified real estate investment, management, finance and development companywhose principal line of business is serving as a special servicer for CMBS transactions. Under the terms
139

Starwood Property Trust, Inc. and Subsidiaries
Notes to Consolidated Financial Statements (Continued)
As of December 31, 2012
16. Subsequent Events (Continued)
of the transaction, we will acquire the following LNR business segments for a total cash purchase priceof $843 million. The remainder of the LNR businesses, totaling approximately $206 million, will beacquired by an investment fund controlled by an affiliate of STWD’s external manager:
• U.S. Special Servicer—A U.S. special servicer of commercial loans with approximately$133.6 billion in loans under management and real estate owned as of December 31, 2012;
• U.S. Investment Securities Portfolio—a portfolio of whole loans, CMBS and collateralized debtobligation (‘‘CDO’’) investments;
• Archetype Mortgage Capital—a commercial real estate conduit loan origination platform;
• Archetype Financial Institution Services—an acquirer, manager, and servicer of portfolios ofsmall balance commercial loans;
• LNR Europe—consists of Hatfield Philips, a wholly-owned subsidiary that is an independentprimary and special servicer in Europe, and a non-controlling interest in LNR EuropeanInvestment Fund, a European CRE debt fund; and
• Auction.com—50 percent of LNR’s interest in a real estate exchange selling residential andcommercial real estate via auction.
If the acquisition of LNR is not completed, we may be adversely affected and we will be subject toseveral risks and consequences, including the following:
• following the execution of the purchase agreement, we paid a $50 million deposit and, if theclosing has not occurred by April 1, 2013, we will be required to pay an additional $25 milliondeposit and an interest charge will accrue on the amount of the purchase price that we pay forthe acquisition. To the extent the transaction is not completed due to an uncured breach of thepurchase agreement by us, we will not recover any deposits or interest paid with respect to thetransaction;
• we will be required to pay certain costs relating to the acquisition, whether or not the acquisitionis completed, such as legal, accounting and financial advisor fees; and
• matters relating to the acquisition may require substantial commitments of time and resources byour management team, which could otherwise have been devoted to other opportunities thatmay have been beneficial to us.
The acquisition of LNR has not yet been completed, and accordingly this Annual Report onForm 10-K and the consolidated financial statements included herein do not reflect the results ofLNR’s business.
On January 17, 2013, we originated an $86.0 million first mortgage construction financing for thedevelopment of a proposed 31-story tower containing 30 luxury condominium residences and a groundfloor retail space.
On February 15, 2013, we issued $600.0 million of 4.55% Convertible Senior Notes due 2018. Thenotes were sold to the underwriters at a discount of 2.05%, resulting in net proceeds to us of$587.7 million.
On February 27, 2013, our board of directors declared a dividend of $0.44 per share for thequarter ending March 31, 2013.
140

Starwood Property Trust, Inc. and Subsidiaries
Schedule III—Residential Real Estate
December 31, 2012
(Amounts in thousands)
Costs Capitalized Gross AmountsInitial Cost Subsequent to Carried at Close
Location to Company Acquisition of Period 12/31/12
Number of Depreciable Depreciable Depreciable AccumulatedMSA Properties Land Property Land Property Land Property Total Depreciation
Miami-Fort Lauderdale-Pompano Beach, FL . . . . 288 $ 8,882 $20,924 $— $1,185 $ 8,882 $22,109 $30,991 $ 13
Houston-SugarLand-Baytown, TX . . . . . 167 3,030 17,493 — 810 3,030 18,303 21,333 37
Dallas-Fort Worth-Arlington,TX . . . . . . . . . . . . . . . . 146 2,971 12,815 — 717 2,971 13,532 16,503 34
Vallejo-Fairfield, CA . . . . . . 40 1,497 4,493 — 576 1,497 5,069 6,566 12
Atlanta-Sandy Springs-Marietta, GA . . . . . . . . . 25 865 3,084 — 333 865 3,417 4,282 24
Tampa-St. Petersburg-Clearwater, FL . . . . . . . . 21 250 2,187 — 104 250 2,291 2,541 2
Chicago-Naperville-Joliet,IL-IN-WI . . . . . . . . . . . 19 320 1,638 — 263 320 1,901 2,221 13
San Francisco-Oakland-Fremont, CA . . . . . . . . . 11 545 1,375 — 206 545 1,581 2,126 5
Cape Coral-Fort Myers, FL . 21 70 1,837 — 13 70 1,850 1,920 1
Austin-Round Rock-SanMarcos, TX . . . . . . . . . . 9 232 926 — 93 232 1,019 1,251 10
Riverside-San Bernardino-Ontario, CA . . . . . . . . . . 8 298 762 — 47 298 809 1,107 4
Orlando-Kissimmee-Sanford,FL . . . . . . . . . . . . . . . . 11 98 888 — 100 98 988 1,086 5
Oxnard-ThousandOaks-Ventura, CA . . . . . . 3 425 377 — 37 425 414 839 5
Phoenix-Mesa-Glendale, AZ 4 139 555 — 37 139 592 731 7
El Paso, TX . . . . . . . . . . . 8 104 517 — 69 104 586 690 8
All Other . . . . . . . . . . . . . 43 731 3,371 — 826 731 4,197 4,928 33
Total . . . . . . . . . . . . . . . . 824 $20,457 $73,242 — $5,416 $20,457 $78,658 $99,115 $213
As most of the properties were recently acquired, the carrying amount above approximates theincome tax basis. In addition, the operating information for 2012 is not meaningful.
141

Starwood Property Trust, Inc. and Subsidiaries
Schedule IV—Mortgage Loans on Real Estate
December 31, 2012
(Amounts in thousands)
Prior Face Carrying Interest Payment MaturityDescription/ Location Liens(1) Amount Amount Rate(3) Terms(3) Date(7)
First Mortgages:
Retail, Chandler, AZ . . . . . . . . . . $ — $ 1,000 $ 801 CL + 1.25% I/O 10/31/2015Multi-family, Anaheim, CA . . . . . . — 25,600 21,853 CL + 1.00% I/O 10/12/2017Retail, Escondido, CA . . . . . . . . . . — 8,828 8,101 CL + 1.30% P&I 5/12/2015Hospitality, Laguna Beach, CA . . . — 18,000 18,083 9.00% I/O 12/1/2013Industrial, Orange, CA . . . . . . . . . — 1,103 1,106 9.75% P&I 6/20/2017Multi-family, Redding, CA . . . . . . . — 4,400 4,219 3.85% I/O 8/16/2015Office, Sacramento, CA—1 . . . . . . — 44,750 43,014 CL + 3.50% P&I 9/24/2014Office, Sacramento, CA—2 . . . . . . — 3,480 3,480 CL + 3.50% I/O 9/24/2014Retail, San Bernardino, CA . . . . . . — 1,171 1,177 10.13% P&I 5/1/2021Office, San Diego, CA . . . . . . . . . — 32,750 32,328 L + 5.05%(5) I/O 12/8/2015Mixed Use, San Diego, CA . . . . . . — 11,600 11,507 L + 7.00% I/O 6/9/2015Office, Sunnyvale, CA . . . . . . . . . . — 59,000 58,475 L + 5.50%(6) I/O* 4/9/2016Mixed Use, Aspen, CO . . . . . . . . . — 8,000 6,038 CL + 1.00% I/O 7/19/2017Multi-family, Washington DC, DC . — 34,520 34,316 L + 5.50%(6) I/O 11/10/2014Office, Washington, D.C., DC . . . . — 46,000 45,378 L + 5.50% I/O 10/9/2015Retail, Fort Meyers, FL . . . . . . . . . — 5,553 5,607 5.93% P&I 10/16/2016Industrial, Jacksonville, FL—1 . . . . — 4,168 3,724 7.80% P&I 8/31/2017Industrial, Jacksonville, FL—2 . . . . — 9,905 7,438 8.18% I/O* 8/31/2024Industrial, Jacksonville, FL—3 . . . . — 5,420 3,047 8.18% I/O 8/31/2024Industrial, Ocala, FL . . . . . . . . . . . — 10,173 10,171 9.83% P&I 2/5/2017Office, Orlando, FL—1 . . . . . . . . . — 14,700 14,510 L + 8.50%(8) P&I 1/11/2016Office, Orlando, FL—2 . . . . . . . . . — 14,700 14,510 L + 8.50%(8) P&I 1/11/2016Industrial, Orlando, FL—1 . . . . . . — 4,224 3,774 7.80% P&I 8/31/2017Industrial, Orlando, FL—2 . . . . . . — 10,039 7,539 8.18% I/O* 8/31/2024Industrial, Orlando, FL—3 . . . . . . — 5,494 3,088 8.18% I/O 8/31/2024Retail, Spring Hill, FL . . . . . . . . . . — 3,355 3,351 9.75% P&I 9/1/2019Hospitality, Tallahassee, FL—1 . . . . — 7,841 7,774 4.14% P&I 8/9/2017Hospitality, Tallahassee, FL—2 . . . . — 3,361 3,331 12.69% P&I 8/9/2017Office, Tampa, FL . . . . . . . . . . . . — 17,000 16,976 L + 5.00%(9) I/O 7/6/2014Hospitality, New Orleans, LA—1 . . — 846 860 11.00% P&I 2/11/2013Hospitality, New Orleans, LA—2 . . — 66,912 63,665 11.00% I/O 7/10/2016Mixed Use, Baltimore, MD . . . . . . — 53,396 52,110 5.25% P&I 11/29/2017Multi-family, Bethesda, MD . . . . . . — 15,000 15,241 L + 4.75%(5) I/O 10/11/2015Hospitality, Rockville, MD—1 . . . . — 32,200 31,906 L + 3.25%(5) I/O 9/6/2015Hospitality, Rockville, MD—2 . . . . — 13,800 13,668 L + 9.42%(5) I/O 9/6/2015Retail, Greenville, MI . . . . . . . . . . — 1,283 1,281 10.25% P&I 4/1/2017Retail, Ionia, MI . . . . . . . . . . . . . . — 1,635 1,633 10.00% P&I 10/1/2017Multi-family, Robbinsdale, MN . . . — 1,466 1,468 9.50% P&I 10/10/2014Office, St. Louis Park, MN . . . . . . — 1,262 1,265 10.50% P&I 5/1/2014Mixed Use, Charlotte, NC . . . . . . . — 11,000 10,780 L + 9.75%(5) I/O 1/9/2016Showroom, High Point, NC . . . . . . — 172,550 171,504 L + 6.00%(8) P&I 7/6/2016Retail, Devils Lake, ND . . . . . . . . — 1,348 1,347 10.00% P&I 1/1/2017Retail, Chester, NJ . . . . . . . . . . . . — 15,300 15,237 7.75% I/O* 10/5/2015Hospitality, Newark, NJ . . . . . . . . . — 10,851 10,856 7.13% P&I 7/6/2014
142

Starwood Property Trust, Inc. and Subsidiaries
Schedule IV—Mortgage Loans on Real Estate (Continued)
December 31, 2012
(Amounts in thousands)
Prior Face Carrying Interest Payment MaturityDescription/ Location Liens(1) Amount Amount Rate(3) Terms(3) Date(7)
Retail, Albuquerque, NM . . . . . . . — 25,110 24,746 L + 5.75%(5) I/O* 12/9/2015Multi-family, Reno, NV . . . . . . . . . — 4,500 3,882 CL + 1.15% I/O 12/31/2016Retail, East Hampton, NY—1 . . . . — 4,652 4,656 6.37% P&I 3/1/2016Retail, East Hampton, NY—2 . . . . 4,652 8,520 8,508 4.91% P&I 3/1/2013Retail, Garden City, NY . . . . . . . . — 2,798 2,777 5.74% P&I 11/30/2017Retail, New York City, NY . . . . . . — 178,126 176,536 L + 3.00%(8) I/O 10/9/2015Office, New York City, NY—1 . . . . — 30,236 26,319 5.24% P&I 12/31/2014Office, New York City, NY—2 . . . . — 25,986 22,642 5.10% P&I 12/31/2014Hospitality, New York City, NY . . . — 23,000 22,967 L + 5.75%(5) I/O 7/6/2015Mixed Use, New York City, NY—1 — 7,485 7,217 3CL + 1.55% P&I 9/16/2013Mixed Use, New York City, NY—2 — 5,200 5,161 6.40% I/O 11/21/2013Hospitality, New York City, NY . . . — 26,500 26,422 8.15% I/O 11/1/2013Retail, Baden, PA . . . . . . . . . . . . . — 4,000 3,956 10.00% I/O 7/6/2013Retail, Pleasant Hills, PA . . . . . . . . — 56,500 56,898 L + 4.50%(5) I/O 7/9/2014Retail, Mitchell, SD . . . . . . . . . . . — 1,384 1,383 10.00% P&I 1/1/2017Retail, Oak Ridge, TN—1 . . . . . . . — 1,385 1,387 10.00% P&I 4/15/2017Retail, Oak Ridge, TN—2 . . . . . . . — 268 268 9.25% P&I 10/15/2013Office, Austin, TX . . . . . . . . . . . . — 25,501 25,246 L + 5.40%(5) I/O* 12/8/2015Office, Dallas, TX—1 . . . . . . . . . . — 33,750 33,348 L + 5.50% I/O* 12/9/2015Office, Dallas, TX—2 . . . . . . . . . . — 11,250 11,137 L + 5.50% I/O* 12/9/2015Retail, Grapevine, TX . . . . . . . . . . — 6,070 6,026 CL + 1.25% P&I 2/28/2013Retail, Various, USA—1 . . . . . . . . — 1,344 1,253 6.64% P&I 10/21/2018Retail, Various, USA—2 . . . . . . . . — 5,908 5,511 6.03% P&I 10/21/2018Retail, Various, USA—3 . . . . . . . . — 1,748 1,631 5.82% P&I 10/21/2018Hospitality, Various, USA . . . . . . . — 173,320 171,730 L + 5.38%(8) I/O* 9/1/2013Hospitality, Roanoke, VA . . . . . . . — 4,744 4,495 5.63% P&I 5/5/2015Retail, Poulsbo, WA . . . . . . . . . . . — 3,310 3,362 6.10% I/O 9/13/2017Office, Brookfield, WI . . . . . . . . . . — 14,804 14,672 L + 5.50%(6) I/O* 10/6/2015
Subordinated Debt and Mezzanine:
Assisted Living, Mobile, AL . . . . . . 15,500 4,750 4,771 12.02% I/O* 7/6/2021Industrial, Montgomery, AL—1 . . . 7,596 18,050 14,253 8.18% I/O* 8/31/2024Industrial, Montgomery, AL—2 . . . — 4,939 3,079 8.18% I/O 8/31/2024Office, Century City, CA . . . . . . . . 109,342 75,874 75,928 7.30% P&I 2/11/2013Office, Glendale, CA . . . . . . . . . . 33,950 14,550 14,373 L + 10.42%(5) I/O 10/11/2015Resort, Mammoth Lakes, CA . . . . 69,528 35,000 34,855 14.00% I/O 4/13/2017Hospitality, San Diego, CA . . . . . . 17,332 6,437 6,437 12.66% I/O* 3/6/2016Office, San Francisco, CA . . . . . . . 80,850 34,650 34,257 L + 8.50%(5) I/O 11/11/2015Mixed Use, San Francisco, CA—1 . 42,500 6,500 6,430 L + 2.75% I/O 7/9/2014Mixed Use, San Francisco, CA—2 . — 13,500 13,341 L + 16.64% I/O 7/9/2014Mixed Use, San Francisco, CA—3 . 81,009 27,191 26,909 L + 10.96%(5) P&I 8/9/2015Hospitality, Estes Park, CO—1 . . . . — 7,643 7,628 14.00% I/O* 1/6/2016Hospitality, Estes Park, CO—2 . . . . 10,838 4,237 4,227 17.45% P&I 1/6/2016Industrial, Opa Locka, FL—1 . . . . — 5,324 3,285 8.18% I/O 8/31/2024Industrial, Opa Locka, FL—2 . . . . 7,303 17,354 13,703 8.18% I/O* 8/31/2024
143

Starwood Property Trust, Inc. and Subsidiaries
Schedule IV—Mortgage Loans on Real Estate (Continued)
December 31, 2012
(Amounts in thousands)
Prior Face Carrying Interest Payment MaturityDescription/ Location Liens(1) Amount Amount Rate(3) Terms(3) Date(7)
Industrial, Fitzgerald, GA . . . . . . . — 1,685 947 8.18% I/O 8/31/2024Office, Chicago, IL—1 . . . . . . . . . 51,226 16,727 16,696 L + 9.00%(8) I/O 6/9/2014Office, Chicago, IL—2 . . . . . . . . . — 37,340 37,205 5.00% I/O* 6/1/2015Office, Chicago, IL—3 . . . . . . . . . 37,340 26,660 26,564 14.59% I/O* 6/1/2015Retail, Orland Park, IL—1 . . . . . . . — 13,181 13,113 5.00% P&I 12/31/2014Retail, Orland Park, IL—2 . . . . . . . 13,181 2,447 2,434 17.02% P&I 12/31/2014Hospitality, Europe, International . . 223,423 48,765 48,403 L + 11.65% I/O 1/23/2018Retail, Europe, International . . . . . 300,361 29,679 29,450 12.00% I/O 6/21/2017Hospitality, Europe, International . . 81,632 73,881 72,956 12.50% I/O 7/20/2014Industrial, West Hammond, LA—1 . 9,164 21,778 17,196 8.18% I/O* 8/31/2024Industrial, West Hammond, LA—2 . — 5,959 3,715 8.18% I/O 8/31/2024Retail, New York City, NY . . . . . . — 103,125 102,205 L + 22.64%(8) I/O 10/9/2015Office, New York City, NY—1 . . . . 118,350 11,146 9,992 7.19% P&I 7/11/2016Office, New York City, NY—2 . . . . 94,500 40,500 40,164 L + 10.15%(6) I/O 5/11/2015Retail, Columbus, OH . . . . . . . . . . 320,000 85,000 72,954 6.97% I/O 8/8/2017Office, Philadelphia, PA . . . . . . . . 80,000 15,000 15,025 L + 10.75% I/O 6/9/2014Office, Nashville, TN . . . . . . . . . . 14,689 2,733 2,733 12.00% P&I 5/6/2016Hospitality, Various, USA—1 . . . . . 98,393 90,754 92,265 11.26% I/O* 1/6/2016Hospitality, Various, USA—2 . . . . . 335,000 25,000 25,000 11.50% I/O 12/1/2019Hospitality, Various, USA—3 . . . . . 889,811 126,311 119,040 L + 7.00%(8) I/O 3/9/2014Hospitality, Various, USA—4 . . . . . 90,000 40,000 39,592 L + 11.50% I/O 3/9/2015Hospitality, Various, USA—5 . . . . . 146,000 25,000 25,000 10.00% I/O 10/1/2017Hospitality, Various, USA—6 . . . . . 75,000 70,000 70,870 11.87% I/O 5/6/2016Retail, Various, USA . . . . . . . . . . . 25,901 8,083 8,056 11.81% I/O* 1/6/2016Hospitality, Various, USA—1 . . . . . 1,432,136 250,000 236,605 L + 2.20% I/O 11/12/2013Hospitality, Various, USA—2 . . . . . — 35,816 35,583 L + 3.50%(6) P&I 7/9/2014Hospitality, Various, USA—3 . . . . . 35,816 15,350 15,135 L + 11.83%(6) P&I 7/8/2014Retail, Various, USA . . . . . . . . . . . 100,000 42,200 42,129 14.28% I/O* 11/1/2015Office, Rosslyn, VA—1 . . . . . . . . . — 1,258 1,258 L + 10.50%(7) I/O 5/8/2017Office, Rosslyn, VA—2 . . . . . . . . . 165,000 45,000 44,548 L + 10.21%(7) I/O 5/8/2017Hospitality, Seattle, WA . . . . . . . . 31,208 10,300 10,414 11.00% I/O 7/6/2016Loan Loss Allowance . . . . . . . . . . — — (2,061)
$5,248,531 $3,099,060 $3,000,335
Notes to Schedule IV:
(1) Represents third-party priority liens. Third party portions of pari-passu participations are not consideredprior liens. Additionally, excludes the outstanding debt on third party joint ventures of underlyingborrowers.
(2) L = one month LIBOR rate, 3L = three month LIBOR rate, CL = one month Citibank LIBOR rate,3CL = three month Citibank LIBOR rate, 6CL = six month Citibank LIBOR rate.
(3) P&I = principal and interest; I/O = interest only, I/O* = principal payments begin later in loan period
(4) Based on management’s judgment of extension options being exercised.
144

Starwood Property Trust, Inc. and Subsidiaries
Schedule IV—Mortgage Loans on Real Estate (Continued)
December 31, 2012
(Amounts in thousands)
(5) Subject to a 0.25% LIBOR floor.
(6) Subject to a 0.5% LIBOR floor.
(7) Subject to a 0.75% LIBOR floor.
(8) Subject to a 1.0% LIBOR floor.
(9) Subject to a 2.0% LIBOR floor.
For the year ended December 31, 2012, activity related to our loan portfolio was as follows:
Balance December 31, 2011 . . . . . . . . . . . . . . . . . . . . . . . . . . . . . . . . . $2,447,508Acquisitions/Origination . . . . . . . . . . . . . . . . . . . . . . . . . . . . . . . . . . . 1,739,944Additional funding . . . . . . . . . . . . . . . . . . . . . . . . . . . . . . . . . . . . . . . 13,419Capitalized Interest(1) . . . . . . . . . . . . . . . . . . . . . . . . . . . . . . . . . . . . . 3,594Loans sold . . . . . . . . . . . . . . . . . . . . . . . . . . . . . . . . . . . . . . . . . . . . . (468,079)Loan maturities . . . . . . . . . . . . . . . . . . . . . . . . . . . . . . . . . . . . . . . . . (615,227)Transfer out—loan converted to a security . . . . . . . . . . . . . . . . . . . . . . (115,100)Principal repayments . . . . . . . . . . . . . . . . . . . . . . . . . . . . . . . . . . . . . . (55,223)Discount/premium amortization . . . . . . . . . . . . . . . . . . . . . . . . . . . . . . 44,653Unrealized foreign currency remeasurement loss . . . . . . . . . . . . . . . . . . 12,667Unrealized gains on loans held for sale at fair value . . . . . . . . . . . . . . . (5,760)Loan loss allowance . . . . . . . . . . . . . . . . . . . . . . . . . . . . . . . . . . . . . . (2,061)
Balance December 31, 2012 . . . . . . . . . . . . . . . . . . . . . . . . . . . . . . . . . $3,000,335
(1) Represents accrued interest income on loans whose terms do not require current paymentof interest.
For the year ended December 31, 2011, activity related to our loan portfolio was as follows:
Balance December 31, 2010 . . . . . . . . . . . . . . . . . . . . . . . . . . . . . . . . . $1,425,243Acquisitions/Origination . . . . . . . . . . . . . . . . . . . . . . . . . . . . . . . . . . . 1,782,964Additional funding . . . . . . . . . . . . . . . . . . . . . . . . . . . . . . . . . . . . . . . 45,792Capitalized Interest(1) . . . . . . . . . . . . . . . . . . . . . . . . . . . . . . . . . . . . . 7,485Loans sold . . . . . . . . . . . . . . . . . . . . . . . . . . . . . . . . . . . . . . . . . . . . . (331,312)Loan maturities . . . . . . . . . . . . . . . . . . . . . . . . . . . . . . . . . . . . . . . . . (305,316)Transfer out—loan converted to a security . . . . . . . . . . . . . . . . . . . . . . (176,635)Principal repayments . . . . . . . . . . . . . . . . . . . . . . . . . . . . . . . . . . . . . . (26,933)Discount/premium amortization . . . . . . . . . . . . . . . . . . . . . . . . . . . . . . 26,966Unrealized foreign currency remeasurement loss . . . . . . . . . . . . . . . . . . (6,506)Unrealized gains on loans held for sale at fair value . . . . . . . . . . . . . . . 5,760
Balance December 31, 2011 . . . . . . . . . . . . . . . . . . . . . . . . . . . . . . . . . $2,447,508
(1) Represents accrued interest income on loans whose terms do not require current paymentof interest.
145

Item 9. Changes in and Disagreements with Accountants on Accounting and Financial Disclosure.
None.
Item 9A. Controls and Procedures.
Disclosure Controls and Procedures.—We maintain disclosure controls and procedures that aredesigned to ensure that information required to be disclosed in our reports filed pursuant to theSecurities Exchange Act of 1934, as amended (the ‘‘Exchange Act’’), is recorded, processed,summarized and reported within the time periods specified in the SEC’s rules and forms and that suchinformation is accumulated and communicated to our management, including the Chief ExecutiveOfficer, as appropriate, to allow timely decisions regarding required disclosures.
As of the end of the period covered by this report, we conducted an evaluation, under thesupervision and with the participation of our management, including the Chief Executive Officer andChief Financial Officer, of the effectiveness of the design and operation of our disclosure controls andprocedures. Based on that evaluation, our Chief Executive Officer and Chief Financial Officerconcluded that our disclosure controls and procedures were effective as of the end of the periodcovered by this report.
Management Report on Internal Control Over Financial Reporting. Our management is responsiblefor establishing and maintaining adequate internal control over financial reporting. Our internal controlover financial reporting is a process designed under the supervision of our principal executive andprincipal financial officers to provide reasonable assurance regarding the reliability of financialreporting and the preparation of our financial statements for external reporting purposes in accordancewith accounting principles generally accepted in the United States of America.
As of December 31, 2012, our management conducted an assessment of the effectiveness of ourinternal control over financial reporting based on the framework established in Internal Control—Integrated Framework, issued by the Committee of Sponsoring Organizations of the TreadwayCommission. Based on this assessment, our management has concluded that our internal control overfinancial reporting as of December 31, 2012 is effective.
Our internal control over financial reporting includes policies and procedures that pertain to themaintenance of records that, in reasonable detail, accurately and fairly reflect transactions anddispositions of assets; provide reasonable assurances that transactions are recorded as necessary topermit preparation of financial statements in accordance with accounting principles generally acceptedin the United States of America, and that receipts and expenditures are being made only in accordancewith authorizations of our management and directors; and provide reasonable assurance regardingprevention or timely detection of unauthorized acquisition, use, or disposition of our assets that couldhave a material effect on our financial statements.
The effectiveness of our internal control over financial reporting as of December 31, 2012 hasbeen audited by Deloitte & Touche LLP, an independent registered public accounting firm, as stated intheir report appearing on pages 53 of this Annual Report on Form 10-K, which expresses anunqualified opinion on the effectiveness of our internal control over financial reporting as ofDecember 31, 2012.
Changes to Internal Control Over Financial Reporting. No change in internal control over financialreporting (as defined in Rule 13a-15(f) under the Exchange Act) occurred during the quarter endedDecember 31, 2012 that has materially affected, or is reasonably likely to materially affect, our internalcontrol over financial reporting.
146
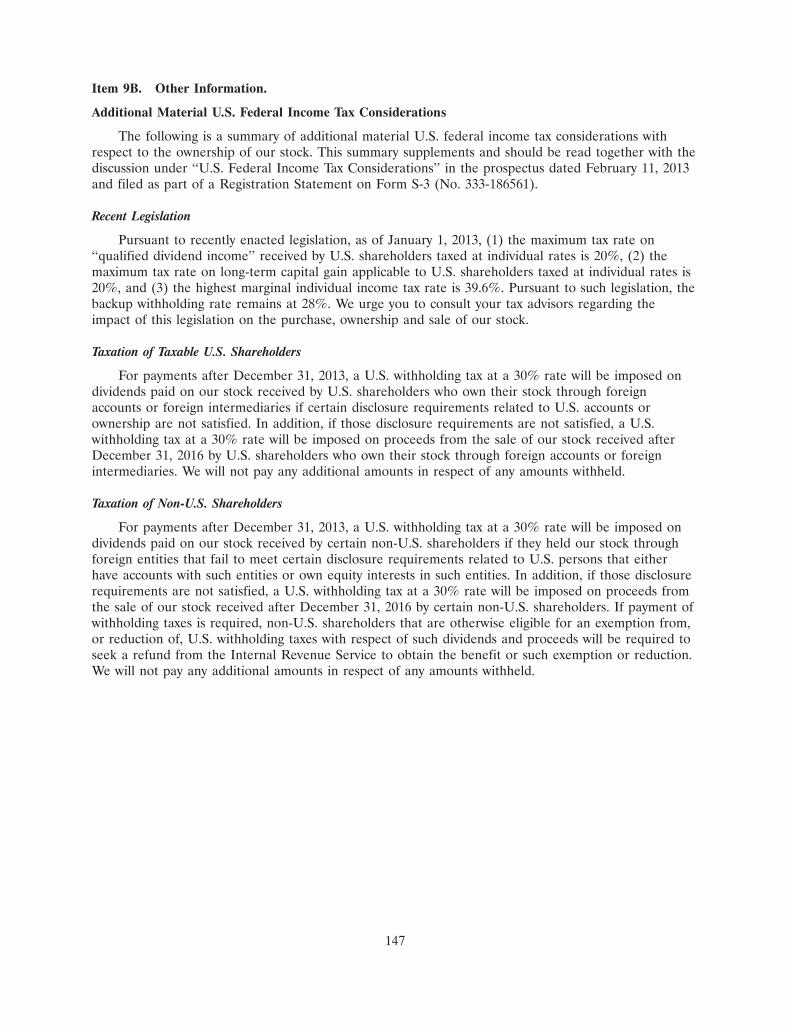
Item 9B. Other Information.
Additional Material U.S. Federal Income Tax Considerations
The following is a summary of additional material U.S. federal income tax considerations withrespect to the ownership of our stock. This summary supplements and should be read together with thediscussion under ‘‘U.S. Federal Income Tax Considerations’’ in the prospectus dated February 11, 2013and filed as part of a Registration Statement on Form S-3 (No. 333-186561).
Recent Legislation
Pursuant to recently enacted legislation, as of January 1, 2013, (1) the maximum tax rate on‘‘qualified dividend income’’ received by U.S. shareholders taxed at individual rates is 20%, (2) themaximum tax rate on long-term capital gain applicable to U.S. shareholders taxed at individual rates is20%, and (3) the highest marginal individual income tax rate is 39.6%. Pursuant to such legislation, thebackup withholding rate remains at 28%. We urge you to consult your tax advisors regarding theimpact of this legislation on the purchase, ownership and sale of our stock.
Taxation of Taxable U.S. Shareholders
For payments after December 31, 2013, a U.S. withholding tax at a 30% rate will be imposed ondividends paid on our stock received by U.S. shareholders who own their stock through foreignaccounts or foreign intermediaries if certain disclosure requirements related to U.S. accounts orownership are not satisfied. In addition, if those disclosure requirements are not satisfied, a U.S.withholding tax at a 30% rate will be imposed on proceeds from the sale of our stock received afterDecember 31, 2016 by U.S. shareholders who own their stock through foreign accounts or foreignintermediaries. We will not pay any additional amounts in respect of any amounts withheld.
Taxation of Non-U.S. Shareholders
For payments after December 31, 2013, a U.S. withholding tax at a 30% rate will be imposed ondividends paid on our stock received by certain non-U.S. shareholders if they held our stock throughforeign entities that fail to meet certain disclosure requirements related to U.S. persons that eitherhave accounts with such entities or own equity interests in such entities. In addition, if those disclosurerequirements are not satisfied, a U.S. withholding tax at a 30% rate will be imposed on proceeds fromthe sale of our stock received after December 31, 2016 by certain non-U.S. shareholders. If payment ofwithholding taxes is required, non-U.S. shareholders that are otherwise eligible for an exemption from,or reduction of, U.S. withholding taxes with respect of such dividends and proceeds will be required toseek a refund from the Internal Revenue Service to obtain the benefit or such exemption or reduction.We will not pay any additional amounts in respect of any amounts withheld.
147
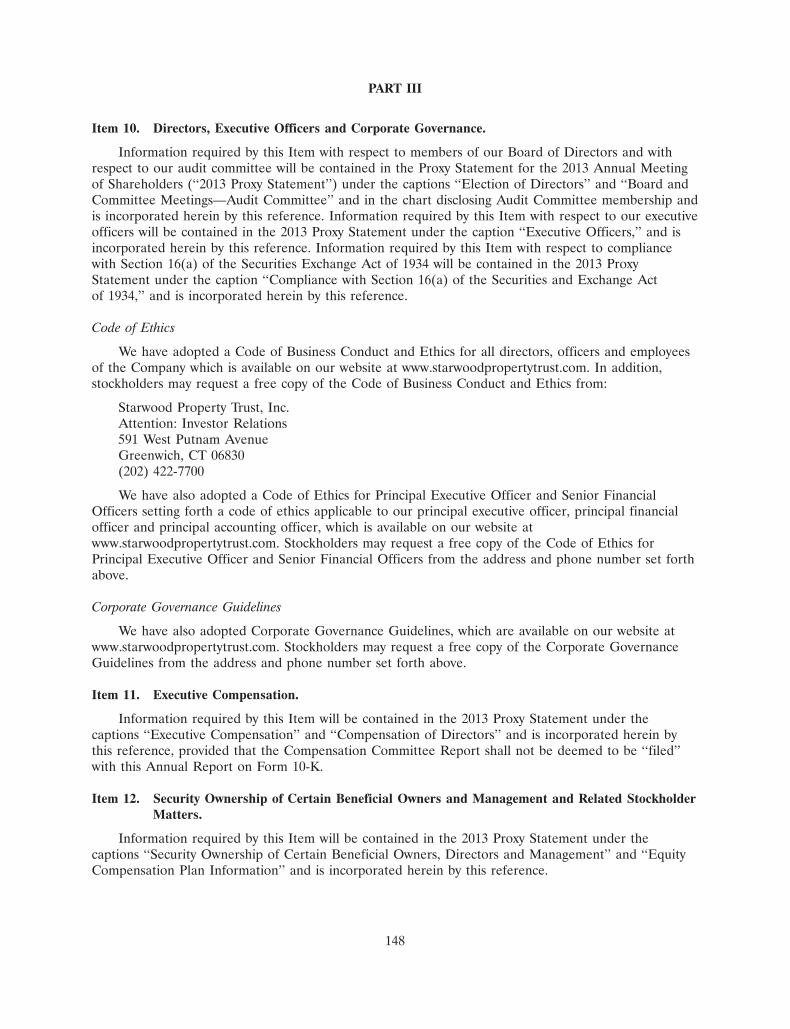
PART III
Item 10. Directors, Executive Officers and Corporate Governance.
Information required by this Item with respect to members of our Board of Directors and withrespect to our audit committee will be contained in the Proxy Statement for the 2013 Annual Meetingof Shareholders (‘‘2013 Proxy Statement’’) under the captions ‘‘Election of Directors’’ and ‘‘Board andCommittee Meetings—Audit Committee’’ and in the chart disclosing Audit Committee membership andis incorporated herein by this reference. Information required by this Item with respect to our executiveofficers will be contained in the 2013 Proxy Statement under the caption ‘‘Executive Officers,’’ and isincorporated herein by this reference. Information required by this Item with respect to compliancewith Section 16(a) of the Securities Exchange Act of 1934 will be contained in the 2013 ProxyStatement under the caption ‘‘Compliance with Section 16(a) of the Securities and Exchange Actof 1934,’’ and is incorporated herein by this reference.
Code of Ethics
We have adopted a Code of Business Conduct and Ethics for all directors, officers and employeesof the Company which is available on our website at www.starwoodpropertytrust.com. In addition,stockholders may request a free copy of the Code of Business Conduct and Ethics from:
Starwood Property Trust, Inc.Attention: Investor Relations591 West Putnam AvenueGreenwich, CT 06830(202) 422-7700
We have also adopted a Code of Ethics for Principal Executive Officer and Senior FinancialOfficers setting forth a code of ethics applicable to our principal executive officer, principal financialofficer and principal accounting officer, which is available on our website atwww.starwoodpropertytrust.com. Stockholders may request a free copy of the Code of Ethics forPrincipal Executive Officer and Senior Financial Officers from the address and phone number set forthabove.
Corporate Governance Guidelines
We have also adopted Corporate Governance Guidelines, which are available on our website atwww.starwoodpropertytrust.com. Stockholders may request a free copy of the Corporate GovernanceGuidelines from the address and phone number set forth above.
Item 11. Executive Compensation.
Information required by this Item will be contained in the 2013 Proxy Statement under thecaptions ‘‘Executive Compensation’’ and ‘‘Compensation of Directors’’ and is incorporated herein bythis reference, provided that the Compensation Committee Report shall not be deemed to be ‘‘filed’’with this Annual Report on Form 10-K.
Item 12. Security Ownership of Certain Beneficial Owners and Management and Related StockholderMatters.
Information required by this Item will be contained in the 2013 Proxy Statement under thecaptions ‘‘Security Ownership of Certain Beneficial Owners, Directors and Management’’ and ‘‘EquityCompensation Plan Information’’ and is incorporated herein by this reference.
148

Item 13. Certain Relationship and Related Transactions, and Director Independence.
Information required by this Item will be contained in the 2013 Proxy Statement under thecaptions ‘‘Certain Relationships and Related Transactions’’ and ‘‘Corporate Governance—Determination of Director Independence’’ and is incorporated herein by this reference.
Item 14. Principal Accountant Fees and Services.
Information required by this Item will be contained in the 2013 Proxy Statement under thecaptions ‘‘Independent Registered Public Accounting Firm’’ and ‘‘Pre-Approval Policies for Services ofIndependent Registered Public Accounting Firm’’ and is incorporated herein by reference.
149

PART IV
Item 15. Exhibits and Financial Statement Schedules.
(a) Documents filed as part of this report:
(1) Financial Statements:
See Item 8—‘‘Financial Statements and Supplementary Data’’, filed herewith, for a list offinancial statements.
(2) Financial Statement Schedules:
Schedule IV—Mortgage Loans on Real Estate.
(3) Exhibits Files:
ExhibitNo. Description
3.1 Articles of Amendment and Restatement of Starwood Property Trust, Inc. (Incorporated byreference to Exhibit 3.1 of the Company’s Quarterly Report on Form 10-Q filedNovember 16, 2009)
3.2 Bylaws of Starwood Property Trust, Inc. (Incorporated by reference to Exhibit 3.2 of theCompany’s Quarterly Report on Form 10-Q filed November 16, 2009)
10.1 Private Placement Purchase Agreement, dated August 11, 2009, between Starwood PropertyTrust, Inc. and SPT Investment, LLC (Incorporated by reference to Exhibit 10.1 of theCompany’s Quarterly Report on Form 10-Q filed November 16, 2009)
10.2 Registration Rights Agreement, dated August 17, 2009, among Starwood PropertyTrust, Inc., SPT Investment, LLC and SPT Management, LLC (Incorporated by reference toExhibit 10.2 of the Company’s Quarterly Report on Form 10-Q filed November 16, 2009)
10.3 Management Agreement, dated August 17, 2009, among SPT Management, LLC andStarwood Property Trust, Inc. (Incorporated by reference to Exhibit 10.3 of the Company’sQuarterly Report on Form 10-Q filed November 16, 2009)
10.4 Co-Investment and Allocation Agreement, dated August 17, 2009, among StarwoodProperty Trust, Inc., SPT Management, LLC and Starwood Capital Group Global, L.P.(Incorporated by reference to Exhibit 10.4 of the Company’s Quarterly Report onForm 10-Q filed November 16, 2009)
10.5 Starwood Property Trust, Inc. Non-Executive Director Stock Plan (Incorporated byreference to Exhibit 10.5 of the Company’s Quarterly Report on Form 10-Q filedNovember 16, 2009)
10.6 Form of Restricted Stock Award Agreement for Independent Directors (Incorporated byreference to Exhibit 10.6 of the Company’s Quarterly Report on Form 10-Q filedNovember 16, 2009)
10.7 Starwood Property Trust, Inc. Manager Equity Plan (Incorporated by reference toExhibit 10.7 of the Company’s Quarterly Report on Form 10-Q filed November 16, 2009)
10.8 Restricted Stock Unit Award Agreement, dated August 17, 2009, between StarwoodProperty Trust, Inc. and SPT Management, LLC (Incorporated by reference to Exhibit 10.8of the Company’s Quarterly Report on Form 10-Q filed November 16, 2009)
10.9 Starwood Property Trust, Inc. Equity Plan (Incorporated by reference to Exhibit 10.9 of theCompany’s Quarterly Report on Form 10-Q filed November 16, 2009)
150

ExhibitNo. Description
10.10 Restricted Stock Unit Award Agreement, dated August 17, 2009, between StarwoodProperty Trust, Inc. and Barbara J. Anderson (Incorporated by reference to Exhibit 10.10 ofthe Company’s Quarterly Report on Form 10-Q filed November 16, 2009)
10.11 Underwriting Agreement, dated as of August 11, 2009, among Starwood PropertyTrust, Inc., SPT Management, LLC and the underwriters named therein (Incorporated byreference to Exhibit 10.11 of the Company’s Quarterly Report on Form 10-Q filedNovember 16, 2009)
10.12 Loan Purchase and Sale Agreement, dated February 16, 2010, among Starwood PropertyMortgage Sub-1, L.L.C., Teachers Insurance and Annuity Association of America andChicago Title Insurance Company, as escrow agent (Incorporated by reference toExhibit 10.1 of the Company’s Quarterly Report on Form 10-Q filed May 10, 2010)
10.13 Master Repurchase and Securities Contract, dated March 31, 2010, between StarwoodProperty Mortgage Sub-1, L.L.C. and Wells Fargo Bank, National Association (Incorporatedby reference to Exhibit 10.2 of the Company’s Quarterly Report on Form 10-Q filedMay 10, 2010)
10.14 Master Repurchase and Securities Contract, dated August 6, 2010, between StarwoodProperty Mortgage Sub-2, L.L.C. and Wells Fargo Bank, National Association (Incorporatedby reference to Exhibit 10.1 of the Company’s Current Report on Form 8-K filedAugust 12, 2010)
10.15 Master Repurchase Agreement, dated December 2, 2010, between Starwood PropertyMortgage Sub-3, L.L.C. and Goldman Sachs Mortgage Company (Incorporated by referenceto Exhibit 10.1 of the Company’s Current Report on Form 8-K filed December 6, 2010)
10.16 Credit Agreement, dated December 3, 2010, among SPT Real Estate Sub II, LLC,Starwood Property Trust, Inc. and certain subsidiaries of Starwood Property Trust, Inc., asguarantors, and Bank of America, N.A., as administrative agent (Incorporated by referenceto Exhibit 10.2 of the Company’s Current Report on Form 8-K filed December 6, 2010)
10.17 Amendment No. 2, dated November 3, 2011, to Amended and Restated Master Repurchaseand Securities Contract, Amended and Restated Guarantee and Security Agreement andAmended and Restated Fee and Pricing Letter between and among Starwood PropertyMortgage Sub-2, L.L.C., Starwood Property Mortgage Sub-2A, L.L.C., Starwood PropertyTrust, Inc. and Wells Fargo Bank, National Association (Incorporated by reference toExhibit 10.17 of the Company’s Annual Report on Form 10-K filed February 29, 2011)
21.1 Subsidiaries of the Company23.1 Consent of Deloitte & Touche, LLP31.1 Certification pursuant to Section 302(a) of the Sarbanes-Oxley Act of 200231.2 Certification pursuant to Section 302(a) of the Sarbanes-Oxley Act of 200232.1 Certification pursuant to Section 906 of the Sarbanes-Oxley Act of 200232.2 Certification pursuant to Section 906 of the Sarbanes-Oxley Act of 2002
101.INS XBRL Instance Document101.SCH XBRL Taxonomy Extension Schema Document101.CAL XBRL Taxonomy Extension Calculation Linkbase Document101.DEF XBRL Taxonomy Extension Definition Linkbase Document101.LAB XBRL Taxonomy Extension Label Linkbase Document101.PRE XBRL Taxonomy Extension Presentation Linkbase Document
151

SIGNATURES
Pursuant to the requirements of Section 13 or 15(d) of the Securities Exchange Act of 1934, theregistrant has duly caused this report to be signed on its behalf by the undersigned, thereunto dulyauthorized.
Starwood Property Trust, Inc.Date: February 27, 2013
By: /s/ BARRY S. STERNLICHT
Barry S. SternlichtChief Executive Officer and Chairman of the
Board of Directors
Pursuant to the requirements of the Securities Exchange Act of 1934, this report has been signedbelow by the following persons on behalf of the registrant and in the capacities and on the datesindicated.
Date: February 27, 2013 By: /s/ BARRY S. STERNLICHT
Barry S. SternlichtChief Executive Officer and Chairman of the
Board of Directors (Principal Executive Officer)
Date: February 27, 2013 By: /s/ PERRY STEWART WARD
Perry Stewart WardChief Financial Officer
Date: February 27, 2013 By: /s/ JEFFREY G. DISHNER
Jeffrey G. DishnerDirector
Date: February 27, 2013 By: /s/ BOYD W. FELLOWS
Boyd W. FellowsPresident and Director
Date: February 27, 2013 By: /s/ RICHARD D. BRONSON
Richard D. BronsonDirector
Date: February 27, 2013 By: /s/ JEFFREY F. DIMODICA
Jeffrey F. DiModicaDirector
152

Date: February 27, 2013 By: /s/ CAMILLE J. DOUGLAS
Camille J. DouglasDirector
Date: February 27, 2013 By: /s/ STRAUSS ZELNICK
Strauss ZelnickDirector
153

(This page has been left blank intentionally.)

(This page has been left blank intentionally.)

(This page has been left blank intentionally.)