Embed Size (px)
Citation preview

2.4 THE GREENSBURG, KANSAS TORNADIC STORM: A STORM OF EXTREMES
Leslie R. Lemon CIMMS/University of Oklahoma, Norman, Oklahoma
Mike Umscheid
NOAA/National Weather Service, Dodge City, Kansas
1. Introduction On the late afternoon and evening of 4-5 May 2007 the atmosphere over southwest Kansas was not only favorable for severe convection but it manifested those conditions with explosive force. Many superlatives can be applied to this remarkable storm. We examine in some detail a few of the characteristics of one storm, the Greensburg, KS storm that was extreme in many ways. The storm produced more than 22 tornadoes over an 8-hour period. Four of these tornadoes, the “big four”, were long track and especially wide and destructive (Fig. 1, Table 1). We have obtained and used videos made by storm chasers in the abundant light provided by very frequent lightning, that has revealed some of these many tornadoes. In fact, both radar and these videos have revealed frequent multiple and coexisting tornadoes. Radar data reveals that the entire complex of storms of which Greensburg was a part, is rotating about a common center. The storm is called the “Greensburg storm” because at about 9:50 pm on that evening the city of Greensburg, KS was very literally destroyed by the first of the “big four” tornadoes. As a result of multiple damage surveys this storm was rated as an EF5 tornado. “Only” 11 fatalities occurred, however, due largely in part by excellent, timely warnings from a small team of meteorologists at the National Weather Service (NWS) in Dodge City, Kansas, including one of the authors of this paper (MU). Efficient dissemination of warnings by local television and radio media outlets as well as alert action by city and county emergency management/services played a large live-saving role as well. We analyze several aspects of this storm. First, though, we explain some of the advantages of a new tool and algorithms provided by some of the Gibson Ridge Software, i.e., GR2Analyst in section 2. Then in section 3 we briefly set the stage by examining the storm environment. In section 4 we analyze a somewhat unique and particularly intense radar vortex
signature that develops, strengthens, weakens, and dissipates repeatedly with the storm. We relate this to the “tornado cyclone” or TC. Section 5 examines storm history and the more noteworthy radar and other observations associated with the Greensburg and Trousdale tornadoes. In this section we also examine in greater depth a unique radar reflectivity feature associated with both these tornadoes called the “vortex hole” (VH). This VH is uniquely associated with the tornado and tornado cyclone vortex signatures. Further, we show how the VH and tornado cyclone associate with a growing updraft that actually becomes the major storm updraft. We also incorporate unusual eyewitness accounts and correlate these with the radar observations. In section 6 we summarize our findings.
Greensburg
(GT) Trousdale
(TT) Hopewell
(HT)
Rating: EF-5 EF-3 EF-3
Duration: ~ 65 min. ~ 65 min. ~ 58 min.
Start time: ~ 0200 UTC ~ 0303 UTC ~ 0339 UTC
End time: ~ 0305 UTC ~ 0408 UTC ~ 0437 UTC
Path length (km): 53.3 43.5 33.7
Mean width (km): 2.0 2.8 1.7
Maximum width (km): 3.1 4.1 2.2
Fatalities: 11 0 1
Damage ($ million): 250 1.5 N/A
Table 1. Statistical data of the Greensburg, Trousdale, and Hopewell tornadoes. 2. Use of GR2Analyst and the GR Normalized
Rotation (NROT) algorithm. We employ radar data display via use of the GR2Analyst software (http://www.grlevelx.com/) and via the NWS AWIPS D2D system. In velocity data analysis we also used both these data analysis and data display tools as well as the raw level II data prior to
*Corresponding author address: Leslie R. Lemon, CIMMS/WDTB, 120 David L. Boren Blvd, Suite 2640, Norman, OK 73072. E-mail: [email protected]

Figure 1. 4 May 2007 documented tornado tracks with “Greensburg” supercell. Tornado track #5 - Greensburg tornado (GT). Tornado track #6 through #10 - satellite tornadoes to GT. Tornado track #13 -Trousdale tornado (TT) and tornado track #14 - Hopewell tornado (HT).
velocity dealiasing. As part of the GR2Analyst software we employed the conventional radar base data display in the more typical display format of polar coordinates and elevation angle. Some of these products will be used in the figures of this paper. We also use the 3-dimensional radar volumetric data display algorithm. We use this in order to visualize and analyze volumetric radar reflectivity data in three dimensions with use of particular reflectivity isosurfaces (e.g., 45 dBZ or 50 dBZ) for various volume scans. GR2Analyst can search for rotational features in the volumetric velocity data and display these data using the 3-dimensional radar data display algorithm. This technique is based on the two-dimensional, local, linear least squares (LLSD) method to minimize the large variances in rotational and divergent shear calculations (Smith and Elmore 2004). There are several benefits of
using this method for identification of rotational features. The method is tolerant of the noisy data which are typical of radial velocity data. LLSD data are adaptable to various spatial scales (which is employed here). Two-dimensional LLSD techniques are more noise tolerant than one-dimensional LLSD techniques, but give lower values of shear as a result. The LLSD method also removes many of the radar dependencies involved in the detection of rotation and radial divergence (or radial convergence) signatures. Thus, these derivatives of the radial velocity field may be viewed in three-dimensional space; an advantage we use here. GR2Analyst finds the rotation in dealiased base velocity by taking the azimuthal derivative of a second-order surface fitted to a 5x5 or 3x3 area of bins (Gibson, 9/22/08 personal communication). This derived rotation value contains range-dependencies due to physical factors: beam width, increasing altitude, etc. To correct

for this, the rotation values are divided by an empirical user-selectable, range-dependent value to produce abstract Normalized Rotation (NROT) values from -5 to +5. The resulting NROT radials are sent to the GR-MDA. The GR-MDA works with pairs of NROT radials, looking for contiguous runs whose average NROT exceeds 1.0. The peak, average, NROT in those runs are nodes. Nodes are correlated vertically between tilts to find 3D stacks of rotation. If a stack meets the user-defined, range-dependent criteria, the GR-MDA searches for a VIL of at least 5 within 10 km of the rotation to remove detections not associated with thunderstorms (i.e. those due to radar noise). The strength of the detection as a whole is given by the average of the NROT peaks in the tilts, and interpreted with an empirical scale. The GR NROT is scaled such that what it detects appears to be closely associated with the tornado itself and what we believe is the tornado cyclone in this case. This is at variance to the scales emphasized by Smith and Elmore (2004) and others which were geared more to the mesocyclone detection. 3. Environmental conditions 3.1 Synoptic and mesoscale setting The 4 May synoptic scale setting was very supportive of significant severe local storm development across the west-central Great Plains (See Fig. 2). A substantial 250 mb jet was digging southeast down the western side of the mid level trough axis, and the left-exit region of this cyclonically curved jet streak was entering the central Rockies by late in the day on 4 May. Substantial deep tropospheric upward motion resulted across a large area given the strong ageostrophic upper level winds and the upper jet. This is suggested in water vapor imagery as an expansive area of cool cloud tops were seen across much of Utah, Colorado, New Mexico, and Wyoming. This setting was extremely favorable for deep lower tropospheric cyclogenesis across the leeside of the Rockies from southern Colorado into New Mexico and allowed a large warm, moist sector to develop and expand poleward in the lower troposphere to the east of the developing low across much of the central Great Plains. Even though the most substantial mid and upper level forcing for ascent was far to the west across the central Rockies by early evening 4 May, water vapor imagery did suggest a mesoscale jet streak embedded in the prevailing southwest flow by an enhanced plume of mid and upper level cloud cover from near El Paso, Texas to Amarillo, Texas. This played a very important role in the genesis of severe thunderstorms by early evening 4 May across
Figure 2. Water vapor satellite image at 0040. 250 mb isotachs in yellow. 500 mb low - hollow “L” and surface low - filled “L”. Arrows indicate jet streak associated cloud band. Developing Greensburg supercell is encircled.
Figure 3. Low-light visible image at 0110. Orange is mean sea level pressure contours and METAR observations in cyan. Arrow indicates developing Greensburg supercell. Dryline is in brown. Leading edge of ~ 20°C (upper 60s °F) dewpoint in green moving toward northwest and drier air. Greensburg indicated by star. the northeast Texas panhandle and adjacent northwest OK. At the surface during the early evening hours of 4 May, a dryline extended from extreme southwest Kansas through the eastern Texas panhandle to the southeast of a developing surface low (Fig. 3). By 0100 (all times hereafter are UTC) 5 May, the surface low had deepened to around 994 mb across southeast Colorado. A quasi-stationary frontal boundary extended from near the surface low eastward across far west-central Kansas

Figure 4. Skew-T log-P diagram of modified 0000 KDDC-RAOB representing Greensburg storm-inflow thermodynamic characteristics. Oklahoma mesonet observations at 0200 plotted in the upper-right inset and used to modify the 0000 sounding up to ~ 850 mb. KDDC WSR-88D 0.9° reflectivity including supercell south of Greensburg at 0205 also included. then northeastward into northern Kansas (Fig. 3). Surface-based convection first developed along the dryline around 2230 4 May between Canadian, TX and Arnett, OK. A tornadic supercell eventually formed from this initial convection as it moved northeast. Between 0000 and 0030, a cluster of thunderstorms developed from Harper County, Oklahoma to Clark County, Kansas which then moved northeast deeper into southwest Kansas. These storms struggled to attain supercell characteristics through almost 0100. By this time, the southernmost cell of this cluster rapidly took on supercell characteristics, with classic mid-level bounded weak-echo region (BWER) development, as it moved from Harper County, Oklahoma into southeastern Clark County, Kansas. A low-light enhanced visible satellite image reveals the impressive convective top associated with the newly developed “Greensburg” supercell (Fig. 3). The leading edge of ~ 20°C surface dewpoint (upper 60s °F) was being transported northwest into the immediate inflow region of the young supercell by backing southeasterly boundary layer winds due largely to deepening surface low across southeast Colorado. Oklahoma mesonet observations suggest that this very high theta-e air was likely in the immediate inflow region of the incipient supercell by as early as ~ 0115. 3.2 Thermodynamic and shear environment A modified 0000 Dodge City, KS rawindsonde (KDDC-RAOB) sounding revealed an extreme amount
of instability when lifting a near-surface parcel in the immediate inflow region of the Greensburg supercell. Total CAPE from a 30 mb mixed parcel from this sounding was ~ 5100 J kg-1
at 0200 (Fig. 4). The kinematic environment was also extremely supportive of supercell processes. The sounding had a total shear magnitude of 34 m s-1
(70 kt) from the surface to 6 km AGL with a classic veering wind profile from around 2-6 km AGL. The low level shear profile changed dramatically through the course of the evening as the boundary layer static stability increased due to loss of direct insolation as well as continued cyclogenesis across southeast Colorado. North American Mesoscale (NAM) BUFR near-term hourly forecast soundings for Dodge City, KS were used to estimate environmental 0-1 km AGL total shear vector magnitude and storm-relative helicity (0-1 km SRH) from 0000 to 0500 (Table 2). Prior to Greensburg supercell initiation, 0-1 km SRH was less than 100 m2
s-2. By 0200, which was when the Greensburg tornado developed, 0-1 km SRH increased to nearly 200 m2
s-2, and by the time this tornado finally dissipated after destroying Greensburg, the NAM BUFR sounding indicated 0-1 km SRH had continued to increase to around 272 m2
s-2. As the nocturnal low-level jet continued to strengthen, 0-1km SRH increased further through 0500 when it reached over 400 m2
s-2. It is worth noting that KDDC WSR-88D VAD Wind Profile data revealed stronger winds in the 0-1 km layer than the near-term hourly NAM BUFR soundings, especially after 0200, however it is believed this dataset may be contaminated by spring songbird migration and was not used in shear and helicity calculations.
0-1km AGL Layer
UTC Hour (5 May)
Actual Storm
Motion (kt)
Total Shear
Magnitude (kt)
Storm Relative Helicity (m2 s-2)
00 212° / 26 * 14.4 59 01 212° / 26 24.5 114 02 219° / 20 31.8 180 03 219° / 15 38.5 272 04 215° / 22 50.4 385 05 222° / 21 53.4 414
* 01 UTC motion used since storm had not developed by this time
1 knot (kt) ~ 0.514 m s-1
Table 2. Hourly 0-1 km AGL wind shear calculation between 0000 and 0500. It is estimated, based on surface observations and the 0000 sounding, that there still existed approximately 4700 J kg-1
CAPE by 0400. This would result in a 0-1km AGL Energy-Helicity Index (0-1 km EHI) of around 11. To put this 0-1 km SRH-CAPE combination

into perspective, this is an order of magnitude greater than what is considered to be a strong discriminator between tornadic supercells and non-tornadic supercells (Rasmussen 2003). A scatter diagram is shown in Fig. 5 to better illustrate the rarity of a severe local storm in the combined thermodynamic and low level shear environment that the Greensburg storm thrived in. It should be noted that the baseline climatology dataset that was used in the graph (Rasmussen and Blanchard 1998, hereafter RB98) only consisted of data from one year: 1992. There have likely been significant historic tornadoes in similar extreme 0-1 km SRH–CAPE combinations to that of Greensburg that are not accounted for by the RB98 dataset (i.e. 3 May 1999 Oklahoma tornado outbreak). Nevertheless, the Greensburg 4 May 2007 near-storm environment was exceptionally rare with extreme results.
Figure 5. CAPE vs. 0-1 km SRH (adapted after Rasmussen 2003); red dot denotes Greensburg environment. 4. WSR-88D rotational signatures associated with
supercell thunderstorms 4.1 A remarkable vortex feature Supercell convective storms are defined by the presence and persistence of the deep mesocyclone (vorticity of 1 x 10⁻²
s-1 or greater) within such a storm (Klemp, 1987,
and others). The term “mesocyclone” is widely used to describe a radar-observed signature of rotation approximating a solidly rotating core within a band of maximum winds and a potential vortex without and thus has the structure of the “Rankine combined vortex”, (Brown et al. 1978). The mesocyclone is rotation on the scale of the supercell storm itself, whether it can be cyclonic or anticyclonic, with core flow diameter typically ranging from ~ 2 km to 10 km (but has exceeded 20 km). Radar rotational velocities (defined as the sum of the absolute value of azimuthal velocity peak values divided by 2) of mesocyclones are typically observed in the range of ~ 13 m s-1 (25 kts) for weak or
minimal mesocyclones to ~ 28 m s-1 (54 kts) for strong mesocyclones. The traditional WSR-88D Tornadic Vortex Signature (TVS; Brown et al. 1978) is characterized by a strong, very localized difference in radial velocity of adjacent azimuths (gate-to-gate, or G2G shear). In examining strong tornadoes very close to WSR-88D, the vortex signature is better resolved with a shorter distance across azimuths. As a result of increased resolution closer to the radar, the maximum velocity difference (Delta-V) is sometimes separated by greater than two adjacent radials. In that rare case, the nomenclature of G2G shear does not apply. The 3 May 1999 Oklahoma City tornado event was one case that was thoroughly studied from a WSR-88D observation since a violent tornado tracked at close range to the Twin Lakes WSR-88D (KTLX). The 3 May 1999 tornado event occurred between 20 and 45 km from KTLX as it moved from Bridge Creek to Moore, Oklahoma. Burgess et al. 2002 (hereafter B2002) found that in a number of the volume scans, the signature related to the Oklahoma City tornado had maximum velocities with a Delta-V of 70 m s-1 – 85 m s-1 (mean tangential velocity of 35 m s-1 {68 kts} – 42.5 m s-1 {82 kts}) separated by three or rarely even more radials. They used the “tornado cyclone signature”, or TCS, to describe this signature observed by KTLX. The TCS or TC is an approximation of the Rankine combined vortex located intermediate in scale between the mesocyclone and the TVS. As will be shown in subsections of the Greensburg Tornado (GT) and the Trousdale Tornado (TT), the velocities and diameter of the core flow as resolved by Dodge City, KS WSR-88D (KDDC) on 4 May 2007 were indeed frequently observed to be gate-to-gate or that of the TVS, but were also often significantly larger (averaging ~1 to 2 nautical mi. {~2 to 4 km}) than the case of the 3 May 1999 Oklahoma City tornado at close-range to KTLX. The observations by KDDC on 4 May 2007 often resolved a circulation with a smooth potential vortex flow increasing up to a core flow with a peak mean velocity exceeding ~ 50 m s-1 or a Delta-V of > 100 m s-1. Within the resolved core, however, the flow was “chaotic”. (Note that the potential vortex flow encompassed the entire thunderstorm complex by the time Greensburg was struck.) By chaotic we mean that there was often little evidence of a solidly rotating core but almost random velocity values with very high velocity spectrum widths within. For example, adjacent gates along a radial through but within the core sometimes had apparently correctly dealiased values of nearly 0 m s-1
and then two adjacent gates of 50 m s-1, but with opposite sign! These observations raise the question as to what is exactly being resolved during the

GT and TT and what kind of nomenclature should be given to such a signature. These vortex signatures had the scale of the mesocyclone but had mean tangential velocity values of a true tornado. In other words, the diameter of the KDDC radar resolved vortex core is comparable to many small to even moderate mesocyclones, yet the rotational velocities resolved from KDDC in this case are as much as twice what is typically observed from a strong mesocyclone or even significantly stronger than the tornado cyclone as presented by B2002. These circulations were all that could be resolved, i.e., there was no true, larger “mesocyclone” or smaller gate-to-gate TVS to be found in the data. Thus, the signatures resolved by KDDC during the GT and TT seems to be unique. Are we resolving a larger and stronger tornado cyclone than previously reported? Are we actually resolving a very strong and large tornado by KDDC? (This may well be the case). Were there two (or more?) simultaneous scales of rotation going on during the GT and TT or was there just one dominant scale of rotation? Moreover, what do we call the inner chaotic core? There are times when even the conventional TVSs are resolved as seemingly part of this larger core circulation. During the life of the actual tornadoes, it is probable that multiple scales of rotation existed as in 3 May 1999, while in other instances; only one scale of rotation may have dominated. If in fact there are times when just one scale of rotation dominated, then KDDC was likely sampling the tornado circulation itself (or perhaps the TC) with a slightly exaggerated diameter due to sampling issues (as discussed in Wood and Brown 1997, hereafter WB97). Unfortunately, these complex morphologies and scale interactions are only slowly being uncovered and clarified. As we shall see later (section 5.2d) we have an eye-witness account of passage through this core circulation and at that time this core circulation was very closely related to the tornado. In fact, it appears that we are unable at that time to discriminate between the tornado itself and this core vortex. However, after weighing all the evidence we have concluded that what is being observed by KDDC during the lifetime of the GT and TT is a larger and stronger, in fact a significantly more intense version, of the tornado cyclone documented by B2002. 4.2 Angular separation of beam center to true vortex
center and peak tangential velocity WB97 (primarily related to mesocyclones) discussed the importance of angular separation between radar beam center and true vortex center. This angular separation, given a constant vortex size and strength, will result in different sampled peak tangential and rotational velocities from volume scan to volume scan. By random chance occasionally the true vortex
peak tangential velocity will lie in the middle of adjacent radials, thus resulting in the maximum possible radar resolved mean velocity, whereas if the same true peak tangential velocity lies at the boundary of two sampled radials, the resulting radar resolved velocity would be much less and would be spread across the two adjacent radials or more. (See Fig. 2 and 3 in WB97). WB97 showed that the interval over which rotational velocity varied randomly was more than 10 m s-1 when sampling a modeled violent tornado at close-range to their simulated WSR-88D-like radar. It is believed that sometimes this was an important facet in examining both the extreme velocities found and vortex sizes in the Greensburg TC and Trousdale TC. An along-radial base velocity profile will be presented for the times when KDDC appeared to resolve the greatest possible velocities associated with the Greensburg and Trousdale TCs. 5. 4 May 2007 WSR-88D observations and first-
hand personal accounts 5.1 Early storm history KDDC was ~ 76 km to the north of the developing storm at around 0050. The first mesocyclone associated with the incipient supercell was initially detected at about this time in the mid levels ~ 6 km above radar level (all subsequent heights are above radar level, ARL). By 0058, a weak echo region (WER) had developed on the left forward (or northern) storm flank. (Storm chasers Steve Bluford and Joel Genung [BG] stated “…at the time this storm first caught our attention, it appeared almost as if it were a “left-split” storm”). In association with this WER a large echo mass greater than 55 dBZ had also developed in a region of the troposphere where temperatures were between 0o
C and about -40o C. In fact, a reflectivity of
61 dBZ was detectable at ~ 9 km, or near the -45o C
height. Thus, in the region (warmer than -40o C) rapid,
wet hail growth was likely taking place. By 0106, an updraft and WER had also developed on the left rear (south) storm flank, and a BWER was already detectable with this rear flank updraft. As the storm continued to move northeast, a notable region of greatly enhanced storm relative inflow with radar velocities greater than ~ 25 m s-1 (50 kts) had developed by 0120 on the storm’s southern flank (In BG’s account, they noted: “As we neared…the storm…, we began to notice pronounced cyclonic inflow into the lower-levels of the storm…”). Additionally, the storm had slowed its forward motion to 213o
at 12 m s-1 (24 kts) owing to the strong rear-flank updraft and rearward updraft propagation. By this time a second and third
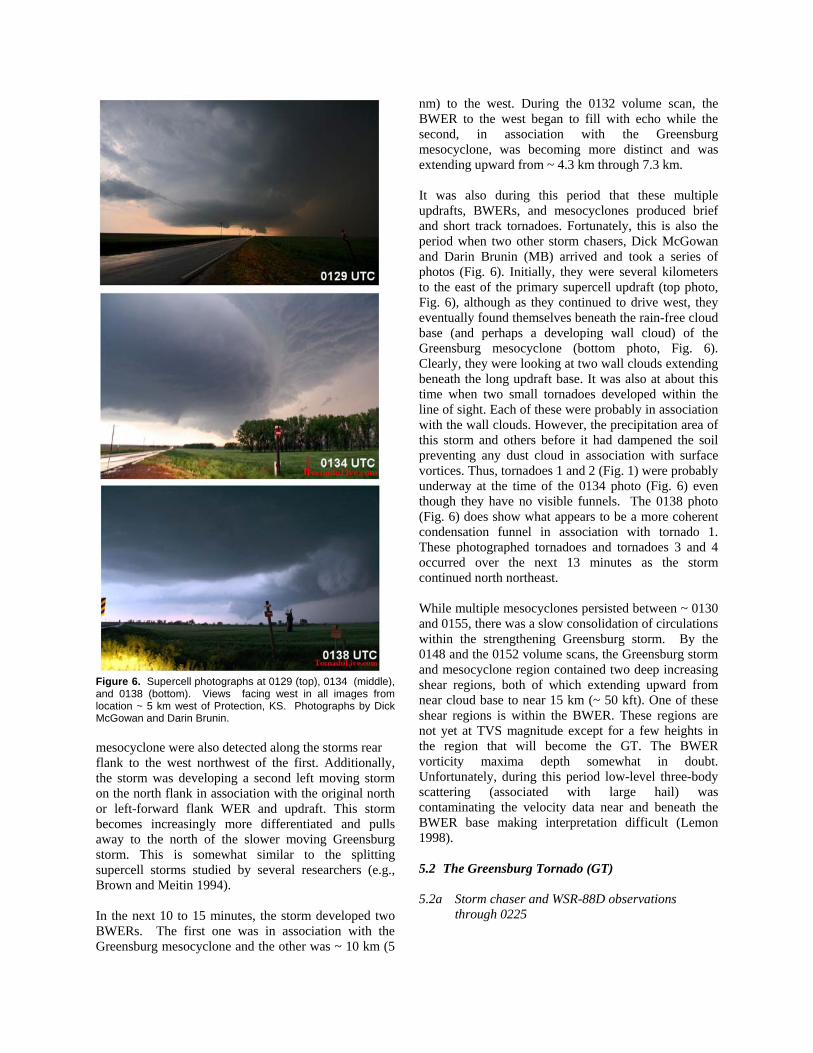
Figure 6. Supercell photographs at 0129 (top), 0134 (middle), and 0138 (bottom). Views facing west in all images from location ~ 5 km west of Protection, KS. Photographs by Dick McGowan and Darin Brunin. mesocyclone were also detected along the storms rear flank to the west northwest of the first. Additionally, the storm was developing a second left moving storm on the north flank in association with the original north or left-forward flank WER and updraft. This storm becomes increasingly more differentiated and pulls away to the north of the slower moving Greensburg storm. This is somewhat similar to the splitting supercell storms studied by several researchers (e.g., Brown and Meitin 1994). In the next 10 to 15 minutes, the storm developed two BWERs. The first one was in association with the Greensburg mesocyclone and the other was ~ 10 km (5
nm) to the west. During the 0132 volume scan, the BWER to the west began to fill with echo while the second, in association with the Greensburg mesocyclone, was becoming more distinct and was extending upward from ~ 4.3 km through 7.3 km. It was also during this period that these multiple updrafts, BWERs, and mesocyclones produced brief and short track tornadoes. Fortunately, this is also the period when two other storm chasers, Dick McGowan and Darin Brunin (MB) arrived and took a series of photos (Fig. 6). Initially, they were several kilometers to the east of the primary supercell updraft (top photo, Fig. 6), although as they continued to drive west, they eventually found themselves beneath the rain-free cloud base (and perhaps a developing wall cloud) of the Greensburg mesocyclone (bottom photo, Fig. 6). Clearly, they were looking at two wall clouds extending beneath the long updraft base. It was also at about this time when two small tornadoes developed within the line of sight. Each of these were probably in association with the wall clouds. However, the precipitation area of this storm and others before it had dampened the soil preventing any dust cloud in association with surface vortices. Thus, tornadoes 1 and 2 (Fig. 1) were probably underway at the time of the 0134 photo (Fig. 6) even though they have no visible funnels. The 0138 photo (Fig. 6) does show what appears to be a more coherent condensation funnel in association with tornado 1. These photographed tornadoes and tornadoes 3 and 4 occurred over the next 13 minutes as the storm continued north northeast. While multiple mesocyclones persisted between ~ 0130 and 0155, there was a slow consolidation of circulations within the strengthening Greensburg storm. By the 0148 and the 0152 volume scans, the Greensburg storm and mesocyclone region contained two deep increasing shear regions, both of which extending upward from near cloud base to near 15 km (~ 50 kft). One of these shear regions is within the BWER. These regions are not yet at TVS magnitude except for a few heights in the region that will become the GT. The BWER vorticity maxima depth somewhat in doubt. Unfortunately, during this period low-level three-body scattering (associated with large hail) was contaminating the velocity data near and beneath the BWER base making interpretation difficult (Lemon 1998). 5.2 The Greensburg Tornado (GT) 5.2a Storm chaser and WSR-88D observations
through 0225

The precise time that the GT developed at the surface is unknown, but combining all the observations, we believe the tornado itself began between the 0156 and 0200 volume scans. In the MB account, they state that shortly before 0200, the funnel aloft passed almost overhead while on a county road about 11 km north of Protection and touched down just a few hundred yards to their northeast. It was growing in size and “then seemed to maybe lift back up…but power flashes illuminated the sky even though the full condensation funnel wasn’t visible.” This is most likely a little after 0200. The tornado gradually (over the next ~ 30 minutes) grew in size to become first a “stove pipe” or cylinder from the surface to the low cloud base, then becoming a broad truncated cone or “wedge” shaped tornado. As the Greensburg mesocyclone and tornado moved north northeast the circulation was not “simple”. This was clear from the videos and the still frames from these videos taken by storm chasers traveling a few kilometers to the southeast of the tornado and south of the storm. Despite the fact that this was well after sunset the storm was very electrically active and the frequent lightning flashes revealed the tornado and surrounding clouds and precipitation. These videos not only reveal the changing structure of the large Greensburg tornado but also at least two periods of “satellite” vortices occurring anywhere from a few hundred meters to several kilometers from the large GT. Many of these smaller satellite tornadoes were associated with high shear regions (or TVSs) on the radar velocity products outside of the main Greensburg TC. For example, at 0209 at the radar horizon (~ 760 m) there are two high shear regions to the east and southeast of the TVS associated with the GT. The northern shear region is cyclonic and the southern one anticyclonic. While there was visual confirmation of a tornado coincident of an anticyclonic TVS (tornado), it was probably about 8 to 12 minutes after this volume scan. During the 0217 volume scan, the large Greensburg TC is revealed at ~ 760 m altitude trailed 5.2 km to the south southwest by (perhaps the same as earlier) anticyclonic TVS and very likely tornado. Both these TVSs have excellent vertical continuity through ~ 3 km altitude. This satellite vortex surface contact was probably over the same damage path created minutes before by the GT, but at this time we are not certain we have visual confirmation owing to uncertainty in time and video location. During the 0221 and 0225 volume scans, the main Greensburg TC is accompanied, in the near environment, once again, by two high shear signatures (one cyclonic and one anticyclonic). These
Figure 7. Video still image at ~ 0222, top, of (1) Greensburg tornado, (2) an anticyclonic satellite tornado, and (3) a cyclonic satellite tornado. videographers (Joel Genung and Steve Bluford). Below is a GR2Analyst 3-D volumetric representation of radar derived rotation. Anticyclonic rotation in green at surface and aloft. Surface cyclonic rotation seen in blue, green, and yellow. Deep cyclonic rotation (tornado) depicted in yellow. Red star denotes videographers’ location. two additional high shear regions are accompanied by good visual confirmation of small satellite tornadoes (see Fig. 7). The anticyclonic tornado, the largest of the two satellite tornadoes visually, was ~ 4 km south or south southeast of the GT, and the second (cyclonic) satellite tornado was ~ 3 km to the east southeast of the GT. Both of the radar associated shear signatures are outside the radar hook echo. The cyclonic shear signature has good vertical continuity up through ~ 5.2 km and is sloped ~ 30o from the vertical toward the north northeast as is the GT. (In fact, through most of its lifetime it and the GT are sloped in the direction of its motion. Despite the fact that the anticyclonic tornado looks visually to be the stronger and deeper of the two, the radar shear signature associated with it actually is only about 3 km deep and is sloped ~ 60o
from the vertical and more in the northeasterly direction. The presence and location of this persistent anticyclonic vortex or vorticity center is suggestive of the anticyclonic vorticity that has been observed to accompany the cyclonic vorticity maximum associated with the low-level mesocyclone (Markowski et al. 2008). They pointed out that this vorticity couplet straddles the hook echo of the supercell thunderstorm as

Figure 8. 4-panel 3-D volumes of KDDC WSR-88D at 0204. 45-dBZ isosurface looking down (top-left), and looking north, bottom left. Volume 1.2 NROT isosurface looking down (top-right) and looking north (bottom-right). Arrows indicate vortex hole.
Figure 9. Same as Fig. 8 but for 0237 volume scan. Left-panel 51-dBZ isosurface, right-panel 1.5 NROT isosurface.

in this case. They also state that this is strongly suggestive of baroclinic vorticity generation within the hook echo and associated rear-flank downdraft region of the supercell. 5.2b WSR-88D observations of a GT radar reflectivity
vortex hole Something even more unusual begins to take place between the 0148 volume scan and the 0152 scan. The western most vortex (soon to become the GT) is seen to be virtually coincident with a weak echo hole interior to the reflectivity echo from about 3.7 km to over 7 km altitude. The vortex markedly strengthens during this period as well. Thus. aloft, there is the storm BWER and another BWER-like echo hole encompassing the vortex. We will call this the “vortex hole” (VH). In all cases except at low-levels, there is a consistent diminishing in reflectivity in the VH, and the VH matches very well with the GR2Analyst rotational icon. The VH is typically a column of echo with reflectivity less than 55 dBZ (as it was during the 0152 scan) that extends through stronger echo and is coincident with the vortex. At times the reflectivity is even less than 30 dBZ within the VH. This feature is very similar to the Doppler-On-Wheels (DOW) weak echo “eye” detected during 3 May 1999 Oklahoma City tornado examined in B2002. However, that feature was only detectable by the DOW and not by the KTLX radar. As pointed out by B2002, centrifuging of the larger radar scatterers probably explains the minimum in reflectivity within the tornado core (Dowell et al. 2001). However, it is significant that when centripetal accelerations are large, the motion of radar targets such as precipitation and debris may differ significantly from the air motion. During the 0156 scan, the correlation of the VH and the TC through velocity data is even more apparent aloft. In mid-levels (~ 4.5 km) there exists a well defined BWER, but at one end of the elongated feature can be found the stronger vortex that is becoming the Greensburg TC. Further aloft, at about 8.2 km, the vortex is found in a “cleft” in the 50 dBZ isosurfaces. During the 0200 volume scan, low-level shears are below TVS magnitude, although above 1.3 km the Greensburg vortex strength is indeed that of a TVS (Delta-V over 50 m s-1 {100 kts} and 1.6 to 1.8 NROT at some heights), extending upward to over 13.5 km altitude. By the 0204 volume scan, the VH is extremely distinct being an inverted cone that is broad aloft and narrowing downward (Fig. 8). This and the volume scan at 0209 are when the VH is most pronounced in the 45 dBZ isosurface. In fact, the 45 dBZ isosurface is in the form of an open funnel extending downward from storm summit to within the WER (Fig. 8). From
the radar horizon upward to about 2.7 km, the Greensburg TC is coincident with the reflectivity maxima within the hook. The reflectivity maxima in the hook or “knob feature” has long been seen in association with tornadic hook echoes (Garrett and Rockney 1962) and Lemon et al. 1982 has related them to tornadic velocity signatures. This portion of the hook echo itself has also been related to a Descending Reflectivity Core (Kennedy et al. 2006). In fact, earlier in the storm lifetime (0111 volume scan) a short lived hook did originate from a DRC. The local reflectivity within the hook maximum in this case may be a combination of echo from lofted debris and precipitation developing within the tornadic updraft (Lemon et al. 2003). At about 4.5 km altitude, the tornadic vortex is transitioning from the reflectivity maxima beneath to the VH above. Further aloft, the VH extends upward to storm summit to the point where reflectivity is detected but is less that 0 dBZ. Here it is unclear if the echo is so weak because the beam has so little echo within it or if there is actually side lobe contamination. Two different perspectives of the VH and volumetric rotation from velocity data (NROT) are shown from the 0204 (Fig. 8) volume scan. One perspective is looking downward from above at the 45 dBZ isosurface as well as the TC column itself. The reflectivity VH and the deep TC are collocated. The second perspective uses the south edge of the GR2Analyst volume “box” by placing it such that a vertical cross section (with depth) is produced through the selected isosurface and VH. (The VH surrounding dark brown area in lower left panel of Fig. 8 is where the plain of the south edge of the volume “box” cuts through 45 dBZ and greater echo.) The actual reflectivity within the vortex column varies from 28 dBZ to 40 dBZ while surrounding reflectivity varies from 45 dBZ to 65 dBZ. Gate-to-gate Delta-V is generally between 57 m s-1 and 67 m s-1 (110 and 130 kts) through the column of the vortex and NROT values are very strong ranging from ~ 1.5 to 2.5. The vortex is very deep at this point extending from radar horizon (~ 760 m) to storm summit which is ~ 16 km altitude. These observations are intriguing. At storm top where the VH and vortex ends it is possible that the tornado vortex may be undergoing vortex breakdown with penetrative subsidence taking place from above. Most of the air arriving within the vortex core is probably descending from the “open” end of the vortex column aloft. Air parcels near the vortex center aloft would not be expected to have traveled into the interior of the vortex from its exterior. Thus, the air within the vortex column itself may be coming from just above the storm

summit, but detected reflectivity within the column is still moderate.
How far downward would the vortex breakdown extend? How far downward would air from above storm summit descend? We can’t answer the first question based on WSR-88D data, but relative to the second question, it is unlikely that air from storm summit can subside very far. But all this is simply speculation as to what happens at the upper end of the vortex and if vortex breakdown is taking place at all. Here, primarily we are presenting the observations and asking for continued research into the phenomena we report on here. By 0208 we know through video and photography that the visual tornado is a broad and sometimes a raged cylinder extending from the surface to a very low cloud base above. The funnel and damage path, however, are not yet the largest. That did not occur until the approximately 0230. Volume scans subsequent to 0208 through the demise of the GT have somewhat less pronounced VHs when investigating the 45 dBZ isosurface. In fact, where there had been an open cone in the 45 dBZ isosurface, we now see what ranges from a narrow column downward to only a small depression or “dimple” where the vortex is located. The VH still persists, however, and is extremely pronounced within other, higher reflectivity isosurfaces in the storm. A very obvious example is from the 0237 volume scan (Fig. 9) and from 4 km through 8 km altitude (Fig. 10). Here we see two BWER or BWER-like features but both with very different origins it would seem. The fact that the WSR-88D did not detect the VH on 3 May, 1999 but that the weak echo “eye” was detected only by the DOW in that case is notable. We suggest that the 4 May 2007 KDDC VH and the 3 May 1999 DOW weak echo “eye” are in fact essentially the same feature. Detection of the VH here by KDDC suggests a difference in vortex size and perhaps intensity. As explained above we attribute the VH to centrifuging of the larger radar scatterers by the intense TC/tornado within the Greensburg storm. Thus, this suggests that the TC of the 2007 KDDC storm is actually larger and more intense than that of the 3 May 1999 Oklahoma City tornado cyclone and is consistent with our other findings presented herein. Moreover, this may even suggest that operational recognition of such a feature implies extreme vortex (tornado) intensity.
Figure 10. 0237 KDDC base reflectivity for elevation angles 3.1° trough 15.6°. 0225 to about 0250 time frame. The Delta-V is over ~ 100 m s-1 (~200 kts) at the radar horizon or about 760 m at 0238. This is near the beginning of maximum tornado damage path width, estimated to be near 2.7 km (1.7 statute mi.). The Doppler TC had a core diameter sampled between 2.4 and 3.0 km between ~ 0230 and 0250. It was about 0230 when the tornado, visually, transitioned into an extremely large “wedge” shape (Fig. 11), which is also around the time that the TC core diameter increased significantly. By the 0246 volume scan the Greensburg TC signature appeared to weaken somewhat aloft but had become extremely intense and large at the surface. In fact, at this point it appeared that KDDC, 55 km away, was actually able to resolve the interior of the tornado. From WSR-88D observations, video, and ground survey damage points, we can confidently estimate the tornado (including the damaging potential flow outside
5.2c Storm chaser and WSR-88D observations from
0225 to 0250 UTC The Greensburg TC is intense with values in the extreme range of NROT averaging about 3.4 during the

Figure 11. Images of Greensburg tornado during its “wedge” stage, (top-left, north view, by Rick Schmidt), (top-right, by Andy Fischer), and (bottom, by Mike Scantlin). Top-right and bottom views looking north-northeast just prior to tornado entering Greensburg.
the core flow) width to be between 2.0 km and 2.5 km (~ 1.2 to 1.6 statute mi.) from ~ 0230 up until and during the time the tornado struck Greensburg, but there was still some question as to whether we were resolving the tornado, the TC, or the mesocyclone on radar (or a “blended” signature of all three). 5.2d First-hand observations by a Greensburg High
School student This question was perhaps partially resolved by the help of an 18 year old high school girl, Megan Gardiner. She had seen a tornado warning for Greensburg stating that the tornado would be in Greensburg by 0250 (9:50 pm CDT). She then looked at her cell phone and the time shown there. Using her story which was corroborated by her father, Chris, we were able to put together her observations and to correlate those with the radar data. What we call Megan’s timeline is shown in Table 3. She and her family were in the basement of their home, a home where damage was later rated as EF-5 (Marshall et al. 2008). Note that we have high confidence in most of the times and especially those at 0237, 0249, 0250, and 0252, because Megan referred to her cell phone times sufficiently often. These observations correlate well with the radar except at two points. We determined that
Time (UTC) Megan's timeline of observations
0237 Winds picked up with quarter sized hail ~ 0248 Hail increased to ~ golfball size
0249 Wind ferocious and power went out ~ 0249 Pressure drop with intense pain for ~ 15 s
0250 Wind & hail "horrible" ~ 0250:45 Deathly quiet, "freaky" ~ 0251:+ Windows exploded
~ few seconds
later house tearing apart
0252:+ shirt and blanket start to fly up ~ 0253 Still going, horrible roar, screaming ~ 0254 Wind overpowering ~ 0255 Comes to an end, just rain
Table 3. Megan’s timeline of observations in Greensburg. the tornado motion was about 200o
at ~ 10 m s-1 (19 kts) over the previous 30 minutes. This means that using the tornado duration as ~ 4 minutes from Megan’s story and the vortex motion as 200o
at 10 m s-1 (19 kts) based on radar, the tornado was ~ 2.33 km (1.45 statute mi) in diameter. Using radar we estimate a tornado width of ~ 2.17 km (1.35 statute mi) but with an error of up to +/- 1 km due to sampling issues. Both these estimates are plagued with several significant error sources. That is
certainly seen when we compare these two closely matched estimates with that of a detailed storm damage survey reported on at this conference (Marshall et al., 2008). Marshall et al. conducted a house-by-house survey through Greensburg and found an EF-1 maximum damage width of ~ 1.4 km (0.86 statute mi). We conclude that when accounting for EF-0 damage to housing, the maximum width increases to at least ~ 1.8 km (1.12 statute mi). This has to be considered the best estimate of tornado size when it passed through Greensburg. But even that may be in error since the damage map (see Marshall et al. 2008, Fig. 5) only accounts for housing damage. It is also unknown how thorough the damage survey was to vegetation or other damage indicators outside the housing damage. Finally, there are two more complicating facts that must be considered. First, the tornado movement had changed markedly to northwest as it moved through Greensburg. Second, the tornado was shrinking in size and had begun to actually loop back on itself as it passed through the town. Here we briefly comment on Megan’s timeline as it compares to the radar data. As stated above that comparison is generally good. But the real disparity comes between 0250 and 0251 (9:50 CDT and 9:51 CDT). While we don’t actually scan the lowest elevation with the radar at that precise time, we can use the radar volume scans nearest that time (0250:05 and 0254:13). Megan (and her father) describes a very painful experience with their ears as they apparently experience a very rapid drop in pressure. (This was compared by Megan to swimming down to the floor drain at the bottom of the deepest portion of a swimming pool.) Using the radar data, we must conclude that this is during the very strong winds within the TC/tornado signature itself when this dramatic pressure drop occurred. Immediately following that, however, they both describe a short period of “extreme” quiet when the wind and precipitation abruptly and completely stop. (They insist that this was actually the case). This period of calm we do not and cannot resolve in the data. Moreover, the tornado itself actually began after the rapid drop in pressure and the “deathly quiet” – not during the tornado itself. This suggests the abrupt drop in pressure occurs outside the tornadic circulation and not within. One should keep in mind that Megan’s experiences must be considered as point observations while the radar observations are area (pulse volume) samples. 5.2e WSR-88D velocity profiles of the Greensburg TC During the GT, KDDC was sampling at a range of ~62 km, or about double the distance in range from radar as was KTLX to the 3 May 1999 Oklahoma City case. A
1.0° azimuthal sampling interval which was employed by KDDC at the time of the event corresponds to ~ 1.1 km sampling width at this range. In comparison, the KTLX sampling beam width was 350 to 800 m in the 3 May 1999 case. Not unlike the 3 May 1999 Oklahoma City case, however, Delta-V was found to be separated by two or three radials in many of the KDDC volume scans during the GT. On either side of these core azimuths, several successive radial velocity bins routinely exceeded 40 m s-1
(~ 78 kts) of opposite sign, and at times, these velocities were greater than 55 m s-1
(~ 107 kts). During a majority of the life of the GT, the Delta-V as observed by KDDC spanned a distance of 2.0 to 4 km. In the case of the 3 May 1999 Oklahoma City tornado, B2002 found that KTLX observed an average vortex core diameter of between 1.0 and 1.5 km during its life, or about two to three times smaller than the vortex resolved by KDDC in the case of the GT. However, as we have indicated, there is the difference in radar range to the vortex. Thus, we were resolving a vortex with a diameter from 2 to 4 km and a mean tangential velocity of ~ 50 m s-1
or ~ 100 kts (Delta V of 100 m s-1 or 200 kts). Clearly, these velocity values were power weighted and represented the mean of the pulse volume velocity distribution and not the spectral skirts. With the exception of the satellite vortices, no other vortex was resolved. The GR2Analyst LLSD with a kernel size designed to resolve a vortex on the order of the tornado, resolved this vortex core very well. To reinforce the statement made earlier in section 3.1, this vortex appears to be on the spatial scale of the mesocyclone, but with mean velocity on the scale of the tornado.
5.2e i. Cross-radial velocity profile The 0229 and 0233 volume scans of both the 0.5° and 0.9° elevation angles (mean beam height of ~ 790 m and ~ 1.2 km, respectively) reveal the largest TC diameter during the life of the GT. The two lowest elevation cuts at these times show a Delta-V separated by three 1.0°-resolution radials (two azimuths in between the Delta-V). It was about this time, visually, that the GT was observed by numerous witnesses to substantially expand in size as it was approaching U.S. Highway 183 (0232 UTC, Fig. 11). Figure 12 shows the KDDC base velocity profile across 13 successive radials cutting through the estimated center of the TC at 0234 UTC using the 0.9° elevation angle. Base velocity or ground relative velocity was used. Four successive 250m range bins were used to compute an average base velocity value over a 1 km sample at a range of 63 km from KDDC. The result is plotted in blue in Fig. 12. Between the 109° and 114° radials, the 4-bin mean

Figure 12. KDDC WSR-88D cross-radial velocity profile at 0234 and 63 km range for radials 109° to 121° and 0.9° elevation angle. 4-bin average base velocity, blue (left y-axis); 4-bin base velocity standard deviation, red (right y-axis); and 4-bin average spectrum in yellow (right y-axis). Bottom outlines subject area of magnified base reflectivity (left), base velocity (center), and spectrum width (right).
Figure 13. 0242, KDDC WSR-88D along-radial velocity profile for 0.5° elevation and 111°, range 58.75 km to 66.25 km. Non-dealiased base velocity, blue, dealiased velocity, red. Spectrum width yellow, and Nyquist velocity (Vmax), dashed black. Base velocity area profiled in inset. radial velocity (inbound) increases at a rate roughly inversely proportional to the distance from the estimated TC center (or approximating a potential vortex circulation). The 114° radial had the largest 4-bin average inbound velocity of 53.7 m s-1
(104.4 kts). The greatest “single-bin” inbound velocity making up the 4-bin average at this radial was found to be 57.5 m s-1
(111.7 kts). On the other side of the TC, 4-bin mean
velocity (outbound) decreased in more of a linear manner from 117° to 121°. The 117° radial had the largest 4-bin average outbound velocity of 36.1 m s-1
(70.2 kts), which is obviously appreciably less than the inbound velocity maximum. The maximum “single-bin” outbound velocity making up the 4-bin average along the 117° was 37.5 m s-1
(72.8 kts). The 4-bin average Delta-V from radials 114° to 117° is 89.8 m s-1
(174.6 kts), whereas computing Delta-V from the traditional single-bin (250 m) maximum results in 94.9 m s-1 (184.5 kts). Fig. 12 demonstrates a successive 4-bin velocity value that is essentially consistent with good continuity from bin to bin between the 109° and 114°. The standard deviation of the 4 bins was between 2 and 5 m s-1. The 115° and 116° radials, however, passing through the vortex core lacked significant continuity. While the 4-bin average velocity at these radials seem to suggest much lower velocities (consistent with the Rankine combined vortex core), the velocity variance was very wide with a standard deviation among the 4 successive bins of ~ 22 m s-1 along the 115° radial and nearly 15 m s-1 along the 116° radial. Using the spectrum width (SW) base product and by taking a 4-bin average of SW, we have another measurement of velocity variability, which is plotted in yellow in Fig. 12. This increases abruptly along the 115° and 116° radials, which is consistent with the abrupt increase in 4-bin base velocity standard deviation. This all suggests a very chaotic inner TC core lacking an approximation of solid body rotation (as a Rankine combined vortex model would suggest). Rather, the data suggest that complex and chaotic perturbations were occurring on scales smaller than what KDDC could sample. It is possible, and perhaps it seems likely, there could be a number of sub-vortices within the TC.
5.2e ii. Along-radial velocity profile A base velocity profile was also constructed along-radial for the 0.5° elevation angle at 0242 UTC. This particular time was chosen because of the extreme inbound tangential velocity peak found in the Greensburg TC at that time. Going downrange, the inbound velocity begins to fold over the Nyquist velocity (Vmax) of 26.2 m s-1
at a range of 61.75 km. The folded velocities retain very smooth continuity beyond this range as the graph reveals a characteristic “M” shape of folded inbound velocities within or very near the core flow of the sampled vortex between 61.75 and 64.25 km range. Given the very good radial continuity, it is appropriate to recover or unfold the velocities within this range to reveal the intensity of the TC. The result is shown in red in Fig. 13. Dealiased inbound velocities show a pronounced increase in

magnitude beginning at ~ 61.5 km range, reaching a peak inbound velocity of 70.5 m s-1
(137.0 kts) at 63 km range. SW (see also Fig. 13) shows a relatively uniform value between 9 and 11 m s-1. Since SW through the highest velocities are not extremely broad (remaining below one-half the Nyquist co-interval), there is increased confidence in the reliability of these base mean velocities (which also demonstrated very good radial continuity).
Figure 14. KDDC WSR-88D base velocity for 0.9° elevation and 0254. 250 m range bins, dealiased and non-dealiased as labeled. TC core circulation circled. At 0254, the very large and destructive tornado was beginning to exit the northwest portion of Greensburg. Much like the 0242 volume scan as analyzed in Fig. 13, the 0254 volume scan at both 0.5° and 0.9° elevation angles show high radial continuity of extreme inbound velocities along the north side of the TC. The 0.9o dealiased velocities (Fig. 14), would look very similar to Fig. 13, showing a general and substantial increase in inbound velocity downrange until reaching a peak tangential velocity of 70.9 m s-1 (137.9 kts). Continuing downrange, inbound velocities decrease beyond the peak tangential velocity but at a slower rate. There was vertical continuity with the 0.5° elevation angle at 0254 (not shown) with a dealiased peak tangential velocity of 65.2 m s-1 (126.7 kts), offset by one range bin from the 0.9° elevation angle. Again, we must emphasize that these velocity values are power weighted and represent the mean velocity of the largest debris within each pulse volume. Large debris motion significantly departs from the actual air motion and result in an under estimate of tangential velocity. In fact, if we use the results of Dowell et al. (2001) and Burgess et al. (2002) we conclude that these values are conservatively in the range of 30% to 40% too low. Thus, radar estimates suggest that erring on the conservative side, the actual tangential
TC or tornadic velocity may be ~ 90 m s-1 to 100 m s-
1 or 175 to 200 kts. This is consistent with the EF5 damage rating. 5.3 The Trousdale Tornado (TT) 5.3a Cyclic mesocyclone and tornado generation It appears that the Greensburg occlusion process began with the 0238 volume scan. By this time the gust front in the vicinity of the Greensburg TC was accelerating around the vortex and was arched toward the northeast and then trailing south of the vortex location itself. Aloft, above the gust front to the east-southeast of the TC was found a BWER in a region of cyclonic shear that seemed to be associated with another convective cell (Fig. 10). This BWER and intense updraft aloft were above the low-level enhanced convergence along
Figure 15. Same as Fig. 8 for the 0335 volume scan except left-panel is 50-dBZ isosurface and right-panel is 2.0 NROT isosurface.
the gust front serving to stretch the low-level vertical vorticity found along that same gust front. This is also very likely in a region of a vertically directed perturbation pressure gradient force in response to the environmental shear interacting with the updraft portion of the mesocyclone. Storm video also shows this is in a band of low, rain-free, cloud base further suggesting an updraft in this location. Therefore, this is in a region supportive of continued, rapid convective development and vorticity enhancement, and indeed this region is where the genesis of the Trousdale mesocyclone and tornado take place as the storm moved northeast.
At around this same time as well, it is also apparent (from radar time lapse loops) that the entire region of convection (including the Greensburg storm itself and other nearby storms) is in a region dominated by enhanced cyclonic vertical vorticity. This whole convective cluster is approximately 65 km by 55 km across. The radar data suggest that the center of vertical vorticity was the Greensburg TC. In other words, the potential vortex region itself surrounding the GT and TC is very large and encompasses the entire local area of convection. As the shrinking GT occludes during the 0250 to 0306 volume scans, it loops back around beginning to turn back into Greensburg from the northwest. At the same time the Greensburg TC is now strongly propagating toward the east southeast and becomes involved in the Trousdale mesocyclogenesis process. Because of the strong pre-existing vertical vorticity, in tandem with extremely large streamwise vorticity of the low level inflow, the Trousdale tornado (TT) develops very quickly into a very large tornado. This process is very similar to Burgess et al. (1982) and Dowell and Bluestein (2002). This abundant pre-existing vertical vorticity is also part of the reason for the satellite tornadoes that develop in the vicinity of the TT. In fact, as Donald Giuliano and David Demko tried to circumnavigate Greensburg to the east, they saw a large bowl shaped cloud region, the genesis of TT, along with a number of satellite tornadoes to the southeast and east of that tornado. Their video documentation will continue to be researched by the authors as it is believed this is the only video captured of the TT and its satellite tornadoes. 5.3b WSR-88D observations of a TT vortex hole With the 0259 volume scan, the developing and strengthening Trousdale TC is situated from low-levels through mid-levels such that the low spectrum widths of the updraft lay in the mesocyclone inflow (low-level notch and mid-level BWER region) where they would be expected and the outflow and broader spectrum widths of the rear-flank downdraft are found in the mesocyclone outflow (hook/pendent echo). (See Lemon and Doswell (1979) and Lemon (1998) for details of this “divided mesocyclone” structure). Above about 8.2 km altitude there are broad spectrum widths and dealiasing errors that prevent clear identification of the circulations or a VH. It was not until the 0307 volume scan that the VH began to develop in association with the Trousdale TC. From low-levels upward through about 4.9 km altitude, the Trousdale TC was located within a reflectivity maxima of the hook echo, but from a height of about 6 km upward through about 9.5 km the vortex had now become located within a reflectivity
minima, or a VH. Reflectivity within the VH ranged from mid to upper 40s dBZ while surrounding reflectivity values were considerably higher. It did not appear that the circulation or the VH extended above a height of ~ 9.5 km. The 0318 scan revealed that the VH extended from an altitude of ~ 1.8 km to ~ 8 km since the dealiasing failures did not hinder locating the vortex. Thus, this scan revealed the deep and well defined weak echo hole or column of the VH through the surrounding higher reflectivity regions of the storm. During the TT and a period when it was growing in size and was very strong, the VH became increasingly better developed. It was first noted in the 45 dBZ isosurface during the 0323 volume scan and persisted through the 0344 volume scan. It was perhaps most pronounced during the 0335 scan (Fig. 15), and as with the GT, this tornado was positioned in a column of lower reflectivity, typically less than about 45 to 50 dBZ, surrounded by reflectivity typically 55 dBZ and greater. 5.3c WSR-88D velocity profile of the Trousdale TC KDDC was between 68 km and 74 km from the Trousdale tornado during a majority of its life. Radial resolution, as a result, decreased somewhat as compared to that during the GT, with a 1.0° azimuthal sampling interval ranging between 1.2 and 1.3 km in width. The TT and the TC associated with it were both extremely large. During the early stages of the TT, the lowest two elevation angles revealed a very complicated velocity structure. In fact, between 0310 and 0318, the dealiasing algorithm employed by GR2Analyst as well as the operational algorithm employed by the KDDC Radar Product Generator struggled to successfully unfold velocities. After 0318, the TC becomes extremely large with very high velocities. In fact, there appear to be even more successive range bins with very large velocities than at any point with the Greensburg TC. This is actually quite impressive considering the size of the GT and its associated TC. Fig. 16 shows an along-radial profile through the southern portion of the maximum tangential core flow of the Trousdale TC at 0323. This is analogous to Fig. 13 except for outbound velocities, thus the range where aliased velocities fold over Vmax
take on the shape of a “W” when graphed downrange. The striking difference in this along-radial velocity profile to that of what is shown in Fig. 13 is the number of successive radial bins with velocities greater than ~ 50 m s-1, resulting in the broad peak of the recovered TC tangential velocity. Recovered velocities along this

radial exceeded 50 m s-1 (~ 97 kts) for ~ 2.5 km in contrast to ~ 1 km in Fig. 13 km for the GT.
Figure 16. Same as Fig. 13 except for radial 96° and 65.5 km to 74.5 km at 0323. 5.3d Circulation size and strength In addition to these velocities being detected through distances of 2 km and more along radials passing through the maximum tangential velocity, the associated TC itself is very large and intense. With the TT and later the TC becoming so large and intense, this once again prompts the question of what we are actually detecting within this storm. For example, at 0331 the core circulation was 2.6 km across with a mean tangential velocity of ~ 55 m s-1 (~ 107 kts). As before, this is a mean tangential velocity within the pulse volume and that these are power weighted velocities. The motion of the most highly reflective sources within the beam having the largest radar cross sections are moving with this mean tangential velocity. Much stronger velocities are contained within the spectrum skirts denoting smaller particles (and the air) moving at even substantially higher velocity. Using the earlier reasoning, but in this case with a substantially larger pulse volume, we estimate actual TC tangential velocity of 74 m s-1 or 144 kts. This becomes even more amazing when at 0433 the radar resolved core circulation TC at 0.5o has grown to 7 km (3.9 nm) across with a mean tangential velocity of 52 m s-1 or 101 kts! The radar pulse volume at this time was 1.7 km (0.92 nm) across with this mean of 52 m s-1 (101 kts)! We recognize that by this time the radar horizon (beam center) is at ~ 1.7 km (4500 ft) altitude or just above cloud base. We, of course, don’t know if these incredibly strong velocities extend downward to the surface but we do know that damaging winds were occurring at the ground. Once again this begs the questions: What is this core circulation? Do we call this a tornado, a TC, or a mesocyclone? It is apparent that the atmosphere knows nothing of our
nomenclature but it does know intense vortices very well. 5.4 The Hopewell Tornado (HT) and the occlusion
process The occlusion process of the Trousdale mesocyclone and was very similar to that of the Greensburg mesocyclone. During the 0318 volume scan a new cell was seen developing aloft over the gust front immediately south of the hook echo and over and west of Havilland, KS. This cell persisted in the same area remaining over the gust front and within the flanking line for the next 5 volume scans. The cell was slow to develop and slow to move until the 0335 scan when a new mesocyclone began to develop beneath its location and along the storm gust front. This was the Hopewell mesocyclone that led to the Hopewell tornado (HT) (#14, Fig. 1). Once again the convective cell aloft provided an updraft and resulting vertical stretching and amplification of the vertical vorticity along the Trousdale mesocyclone gust front. Once again this mesocyclone propagated (although more slowly) and became the Hopewell mesocyclone, TC, and tornado. The tornado itself appears to have developed rapidly and began near the start of the 0340 volume scan in extreme northeast Kiowa County. In contrast to the previous GT and the TT, the HT did not have a prominent or sustained Vortex Hole that affected the 45 dBZ isosurface aloft. (In part, diminished resolution owing to the longer radar range to the storm may account for this.) In fact, the interior column of weak echo was apparent only during the 0421 and 0425 scans. This coincides with the time frame when the HT was at its strongest. That VH was apparent only in the 55 and 56 dBZ isosurface and only during those volume scans. The VH was apparent during the earlier scan from a height of about 2.5 km through about 4.3 km. During the later scan the VH extended from ~ 1.8 km through 8.5 km. 5.5 Relationship between storm updraft, mesocyclone,
and tornado updraft Another aspect of the WSR-88D observations during the GT and TT is the large area of high reflectivity surrounding the VH. During the GT a very good example is seen at 0238 (Fig.10). In fact, this is very pronounced from the 0234 to 0242 volume scans. Another good example occurred during the 0315 volume scan and TT. The VH and collocated Trousdale TC were located from a height about 1.8 km upward through at least 8 km in the middle of a concentrated mass of hail (68 dBZ) and probably large

concentrations of mixed phase precipitation. Reflectivity of 60 dBZ extended to an altitude of 12.2 km and the echo summit was positioned almost directly above the vortex. (Dealiasing failures prevented identification of the vortex above ~ 8 km). This same correlation of the velocity TC, VH, and the surrounding high reflectivity mass continued throughout the TT lifetime and throughout the storm depth. There are two possible explanations for this sustained annulus of high reflectivity surrounding the TC. First, this may suggest that the tornado, TC, and mesocyclone associated updraft were large and responsible for the development of the large quantities of liquid and ice surrounding the vortex. The second possible explanation is that the storm updraft (within the BWER when present such as at 0238) was responsible for all the precipitation which would have then been transported and distributed around the vortex. However, when we examine the volume scans from 0234-0242, and at other times we see that there are two prominent cells making up this supercell storm. One is associated with the BWER and the second is associated with the mesocyclone, TC, and GT. This again suggests that the tornado and TC convergence and updraft become large and a major feature of the storm through this period even though, at its outset, the tornado and TC are located and associated with the storm WER, BWER, and parent updraft. In other words, while the tornado associated updraft begins as a byproduct and in association with the major storm updraft, the tornado and TC associated updraft seems to “take over” and becomes the major storm updraft. 6. Summary We have documented the remarkably intense and long lived Greensburg, KS storm which produced more than 22 tornadoes over an 8-hour period, four of which were large and long-tracked. We have examined several aspects of the storm. One of the more important was the radar resolution of a “core circulation” closely associated with the Greensburg tornado and another with the Trousdale tornado. We have chosen to call these “tornado cyclones” or TCs because of similarities to the 3 May 1999 Oklahoma City tornado cyclone documented by Burgess et al. (2002). However this TC was surprisingly more intense and larger than the Oklahoma City associated TC. In our case the TCs averaged around 3 km (1.5 nm) across and had mean tangential velocity at times reaching ~ 60 m s-1.(~ 116 kts). In the extreme case the Trousdale tornado cyclone (or mesocyclone or even tornado?) measured 7 km (3.9 nm) across and had a mean tangential velocity of over 50 m s-1. In other words we have documented a circulation with a spatial scale of a mesocyclone but
with the rotational velocity of a tornado! We further, with the use of continuity, were able to document mean velocity values within the Greensburg TC of ~ 71 m s-1 (138 kts). Because of very frequent lightning associated with the storm, significant portions of the storm and tornado lifetimes were documented with video obtained by several storm chasers. This video was correlated with the radar measurements. We were even able to correlate the radar measured TC/tornado with the detailed and excellent descriptions of a high school girl who, along with her family, survived unscathed, passage through the TC/tornado in the basement of a home sustaining EF5 damage. Associated with these TCs we have documented a radar reflectivity “Vortex Hole”; a weak echo column or cylinder, encompassing the TC. Reflectivity within the columnar VH ranges from < 30 dBZ to near 50 dBZ and is surrounded by an annulus of reflectivity typically greater than 55 dBZ to 65 dBZ. This VH we likened to the weak echo “eye” documented by the Doppler On Wheels in the case of the Oklahoma City tornado and TC (Burgess et al., 2002). This VH in the case of the Greensburg storm is found only in association with large, strong tornadoes. Because the VH encompasses the above TC and tornado, we suggest that it is the result of centrifuging of hydrometeors and large debris. Further, the VH was found in at least one radar volume scan to extend to storm summit. Moreover, we examined the occlusion process that took place repeatedly with this cyclic supercell storm, and finally we also noted that the TC and tornado associated updraft actually became the major storm updraft. All of these observations demand further study for many reasons and not the least of which is the fact that this storm was a storm of superlatives, a storm of extremes, and an occurrence that is rare. Hopefully, these observations will also translate into operational benefits as well as increased understanding. These authors intend to continue the study begun here. Acknowledgements. The authors would like to acknowledge many individuals, including Megan and Chris Gardiner for their detailed and powerful account of their tornado experience in Greensburg that fateful night. There are a number of storm chasers who provided valuable accounts, video stills, and photography of the Greensburg supercell and its numerous tornadoes, including, in no particular order, Dick McGowan, Darin Brunin, Steve Bluford, Joel Genung, David Demko, Donald Giuliano, Rick Schmidt, Andy Fischer, and Mike Scantlin. We also want to

thank Jeff Hutton, Warning Coordination Meteorologist of NWS Dodge City, Kansas for providing insights on tornado damage survey results and Larry Ruthi, Meteorologist-in-Charge of NWS Dodge City, Kansas for his support in this research. Finally, we would also like to thank Liz Quoetone for reviewing this manuscript. References Brown, R. A., and R. J. Meitín, 1994: Evolution and morphology of
two splitting thunderstorms with dominant left-moving members. Mon. Wea. Rev., 122, 2052-2067.
-------, L. R Lemon, and D. W. Burgess, 1978: Tornado detection by
pulsed Doppler radar. Mon. Wea Rev., 106, 29-38. Burgess D. W., M. A. Magsig, J. Wurman, D. Dowell, and Y.
Richardson, 2002: Radar observations of the 3 May 1999 Oklahoma City tornado. Wea. Forecasting, 17, 457-471.
Dowell, D. C., J. Wurman, and L. J. Wicker, 2001: Centrifuging of
scatterers in tornadoes. Preprints, 30th Conf. on Radar Meteorology, Munich, Germany, Amer. Meteor. Soc., 307-309.
Garrett, R. A., and V. D. Rockney, 1962: Tornadoes in northeastern
Kansas, May 19, 1960. Mon. Wea. Rev., 90, 231-240. Kennedy, A., J. M. Straka, E. N. Rasmussen, 2006: A
characterization of descending reflectivity cores in supercells. submitted to Wea. Forecasting.
Klemp, J. B., 1987: Dynamics of tornadic thunderstorms. Ann. Rev.
Fluid Mech., 19, 369-402. Lemon, L.R., 1998b: On the mesocyclone “dry intrusion” and
tornadogenesis. Preprints, 19th Conf. on Severe Local Storms, Minneapolis, MN, Amer. Meteor. Soc., 752-755.
-------, and C. A. Doswell III, 1979: Severe thunderstorm evolution
and mesocyclone structure as related to tornadogenesis. Mon. Wea. Rev., 107, 1184-1197.
-------, D. W. Burgess, and L. D. Hennington, 1982: A tornado
extending to great heights as revealed by Doppler radar. Preprints, 12th Conf. on Severe Local Storms, San Antonio, TX, Amer. Meteor. Soc., 430-432.
-------, A. Stan-Sion, C. Soci, and E. Cordoneanu, 2003e: A strong,
long-track, Romanian tornado. Atmos. Res., 67-68, 391-416. Markowski, P., Y. Richardson, E. Rasmussen, J. Straka, R. Davies-
Jones, and R. J. Trapp, 2008: Vortex lines within low-level mesocyclones obtained from pseudo-dual-doppler radar observations. Mon. Wea. Rev., 136, 3515-3535.
Marshall, T. P., D. McCarthy, J. LaDue, J. Wurman, C. Alexander, P.
Robinson, and K. Kosiba, 2008: Damage survey and deduction of vortex structure of the Greensburg, KS tornado. 24th Conf. on Severe Local Storms, Savannah, GA, Amer. Meteor. Soc., 8B.3
Rasmussen, E. N., 2003: Refined supercell and tornado forecast
parameters. Wea. Forecasting, 18, 530-535.
-------, and D. O. Blanchard, 1998: A baseline climatology of sounding-derived supercell and tornado forecast parameters. Wea. Forecasting, 13, 1148-1164.
Smith, T. M. and K. L. Elmore, 2004: The use of radial velocity
derivative to diagnose rotation and divergence. Preprints, 11th Conf. on Aviation, Range, and Aerospace, Hyannis, MA, Amer. Meteor. Soc., CD-ROM, P5.6.
Wood, V. T. and R. A. Brown, 1997: Effects of radar sampling on
single-Doppler velocity signatures of mesocyclones and tornadoes. Wea. Forecasting, 12, 928-938.