Embed Size (px)
Citation preview

24 September 2010Gene Wagenbreth
(310) [email protected]
Approved for public release; distribution is unlimited.
Nondisruptive Data Logging: Nondisruptive Data Logging: Tools for USJFCOM Large-scale SimulationsTools for USJFCOM Large-scale Simulations
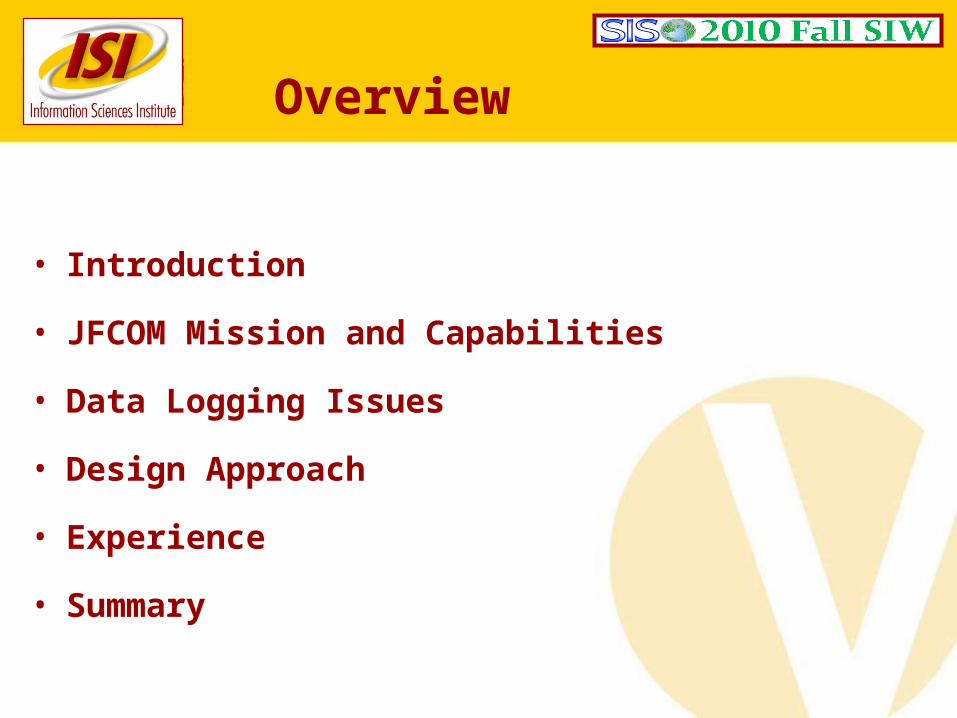
Overview
• Introduction
• JFCOM Mission and Capabilities
• Data Logging Issues
• Design Approach
• Experience
• Summary

Basic Concept
A persistent problem is the efficient and effective collection of data.
These issues have become exacerbated as the data being generated grows at unheard of rates.
These shortcomings can occur in several dimensions:• volume of information (data glut)• speed of transmission to the analyst (input overload)• geographical dispersion of the data (distributed data)
The authors have been wrestling with these issues for more than a decade
A review of the problems and a survey of various approaches to their solution will be presented.
There is a need to reliably collect the information that is required or desired by the user or analyst
This must not negatively impact the training, simulation or education that is the primary focus of the activity.

Approach
Acknowledging theoretical limits to non-intrusive observation, the goal is held to be: maximize the data and minimize the disruption.
The authors lay out with specificity their development of the JLogger system to collect needed information out of the Joint Forces Command’s experimentation that typically uses Joint Semi-Automated Forces (JSAF) simulations for analysis and evaluation.
Examples of problems faced in achieving the goals of the experiments, the approaches used to resolve these and the solutions developed are all presented with a view toward assisting other similarly-tasked professionals with assessing their needs, their problems and their opportunities.
The authors conclude by laying out the way the data were collected, then were structured to optimize their usability by the warfighter participants. Then they look to the future of data collection during live, virtual and constructive events.

Requirements for Joint Experimentation DataLarger Scale
Global scale vs. theatreHigher Fidelity
Greater complexity in models of entities
(sensors, people, vehicles, etc.)Urban Operations
Millions of civilians
All of the above produce dramatic increases in data relative to the previously experienced events.

US Joint Forces Command: Uses & Needs
Data needs driven by the
JFCOM Simulations
Large urban battle space
100K – 10M SAF entities
Support for the Warfighters
Developing future military
tactics and doctrine
Training being brought into
mix
OAVs
UGS
HUMINT
Mid Alt UAVs
High Alt UAVs
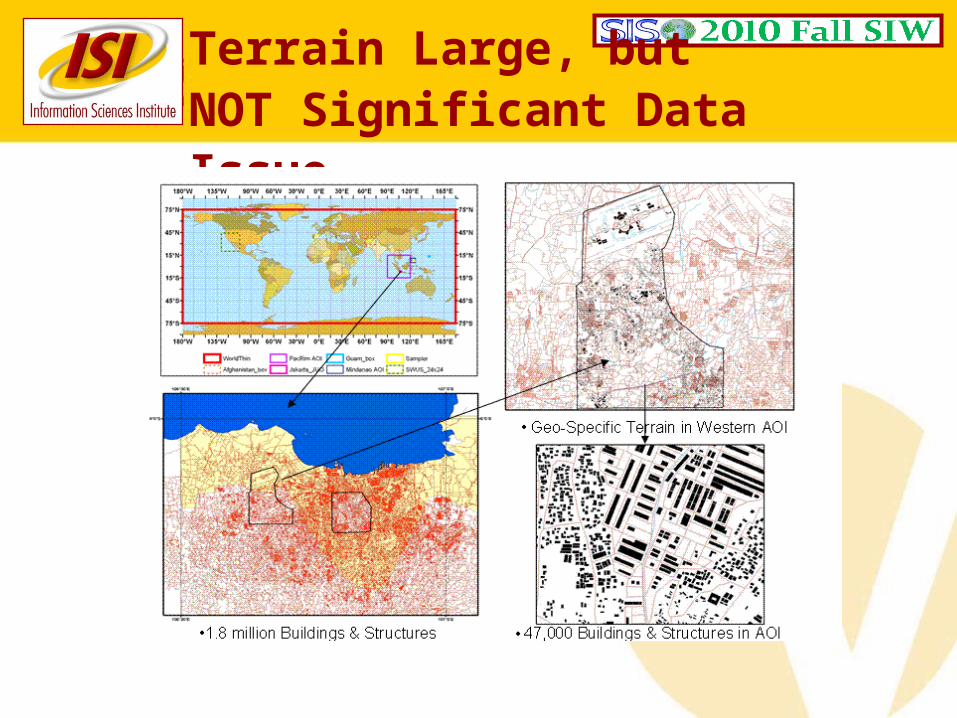
Terrain Large, but NOT Significant Data Issue
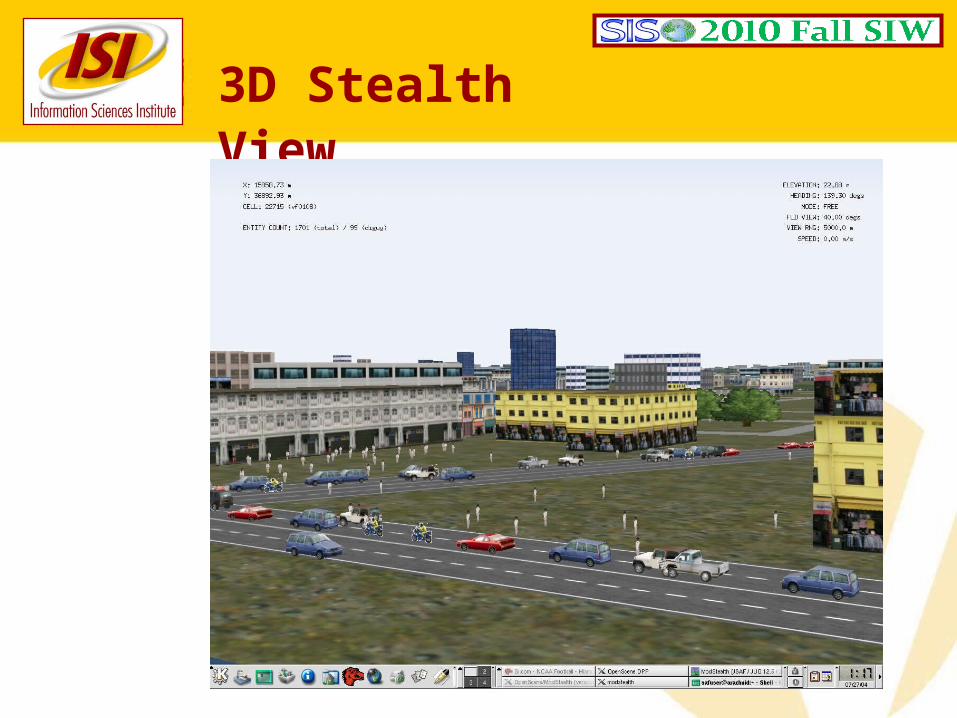
3D Stealth View
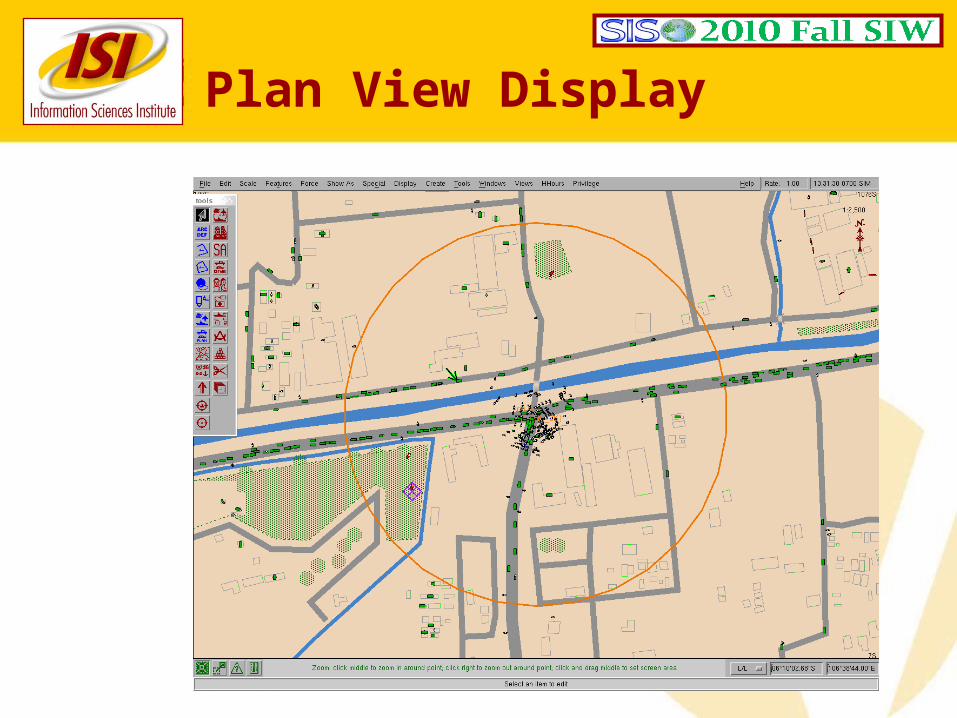
Plan View Display
Technical Successes
10 Million Entities Clutter and operational December, 2008
Consistent and stable service scheduled and delivered
Using DREN, both Classified and Unclass Technology adopted by CENTCOM
Fielded to Baghdad JSAF Experiments Demonstrated to:
Reps. Ford, Thornberry, and Forbes Former Speaker Newt Gingrich
Sen Hillary Clinton Gen Abizaid DDR&E
DDS&T
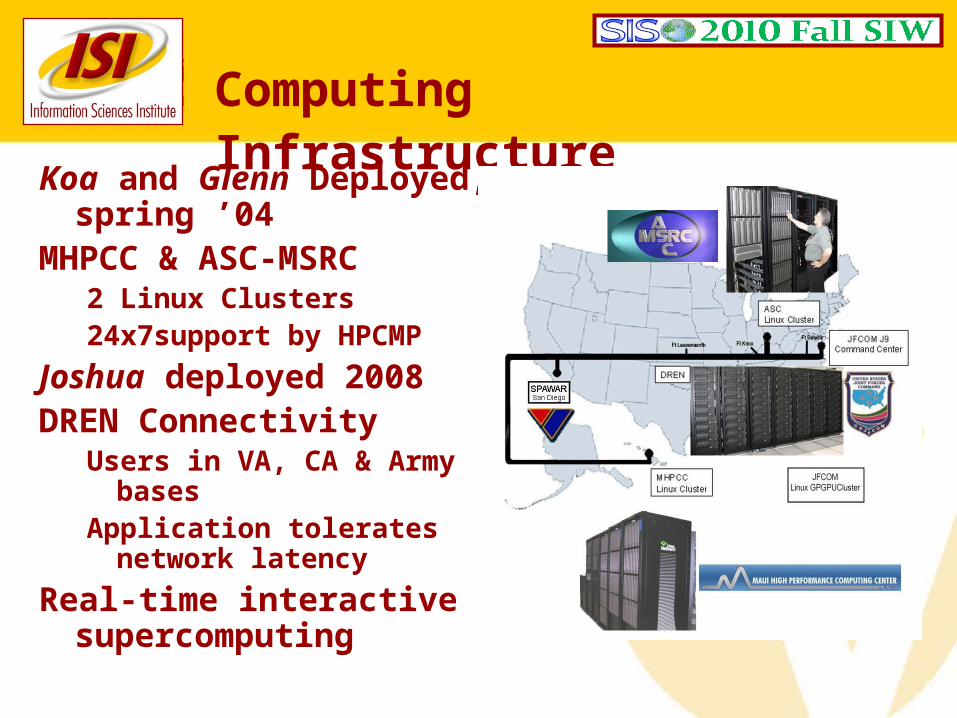
Computing Infrastructure
Koa and Glenn Deployed, spring ’04
MHPCC & ASC-MSRC2 Linux Clusters24x7support by HPCMP
Joshua deployed 2008DREN Connectivity
Users in VA, CA & Army bases
Application tolerates network latency
Real-time interactive supercomputing

Net Diagram forJFCOM (Notional)

JFCOM Mesh Diagram (Notional)

Typical Experiment Participants
JFCOM – Suffolk Virginia (Tidewater Area)TEC – Ft. Belvoir Virginia DTRA – Ft. Belvoir VirginiaSPAWAR – San Diego CaliforniaUS Army – Ft. Knox, KentuckyUS Army – Ft. Leavenworth Kansas
ASC MSRC – WPAFB, OhioMHPCC – Maui Hawai’i
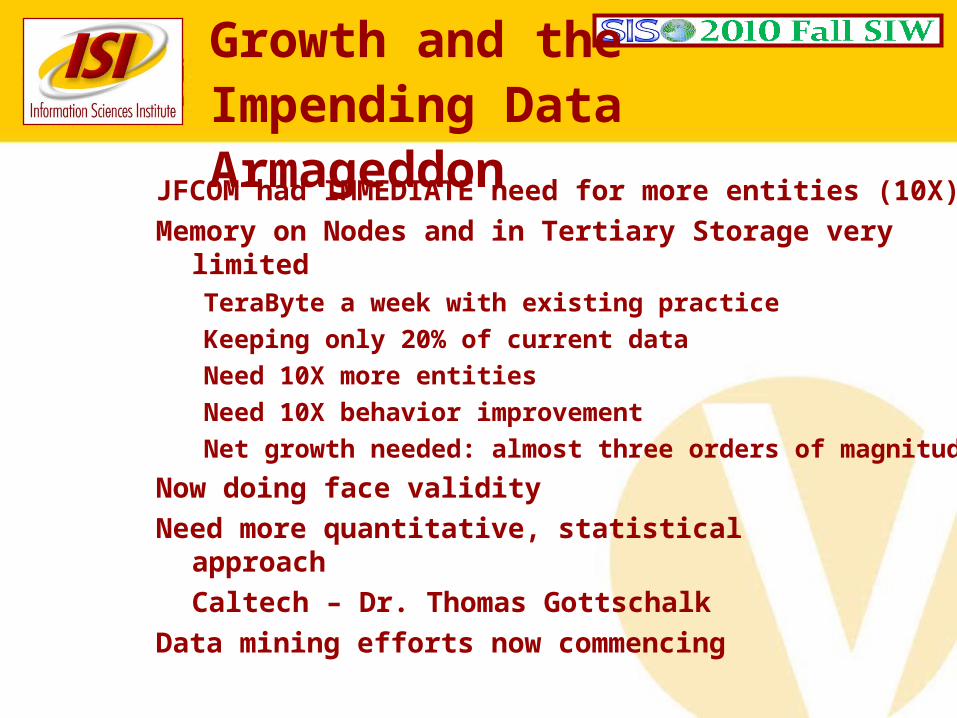
Growth and the Impending Data Armageddon JFCOM had IMMEDIATE need for more entities (10X)
Memory on Nodes and in Tertiary Storage very limitedTeraByte a week with existing practiceKeeping only 20% of current dataNeed 10X more entitiesNeed 10X behavior improvement Net growth needed: almost three orders of magnitude
Now doing face validityNeed more quantitative, statistical
approachCaltech – Dr. Thomas Gottschalk
Data mining efforts now commencing
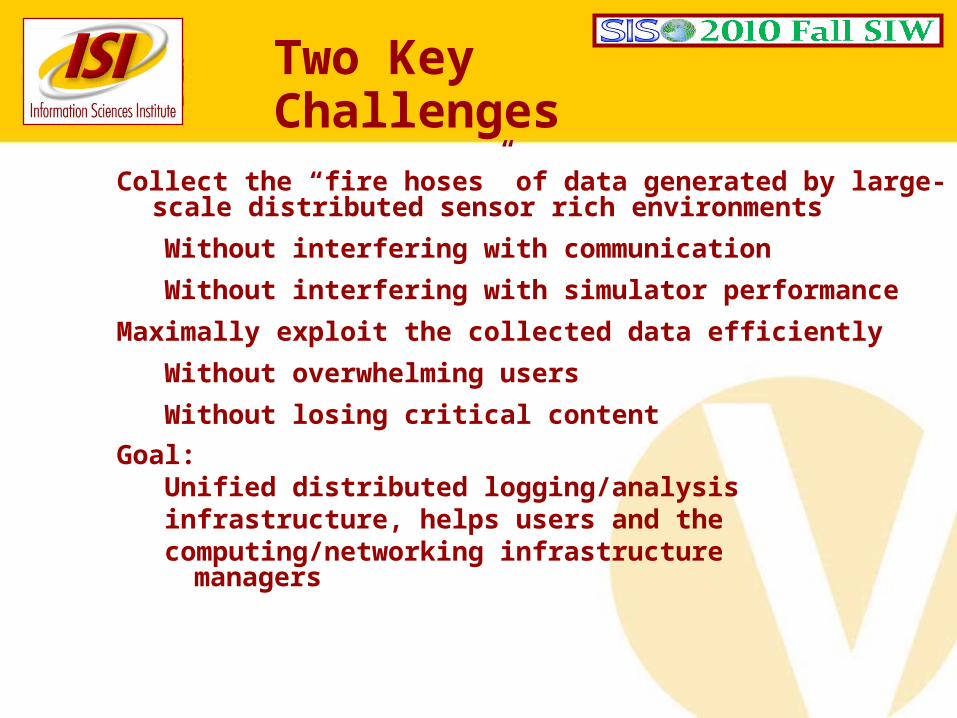
Two Key Challenges
Collect the “fire hoses” of data generated by large-scale distributed sensor rich environments
Without interfering with communication
Without interfering with simulator performance
Maximally exploit the collected data efficiently
Without overwhelming users
Without losing critical content
Goal: Unified distributed logging/analysis infrastructure, helps users and thecomputing/networking infrastructure
managers

Limitation: The First System did not Scale!
Two separate data analysis systemsOne for near-real time during the event
Another one for post event processing
For near-real timeToo much data access over wide-area network
For post event processing1-2 weeks to stage data to centralized
data store
Discards Green entities (80%)

Handling Dynamic Data
Data is NOT static during runs, but users need to accessLogger continuously inserts new data from the simulation
Need distributed query to combine remote data sourcesDistributed logger inserts data into SDG data store at
each siteProblems
Local cache invalid with respect to insertsCannot preposition data to optimize queries
ISI Strategy: explore trade-offsCompute on demand for better efficiency Compute on insert for faster queries Variable fidelity: periodic updatesDynamic pre-computation: detect frequent queries
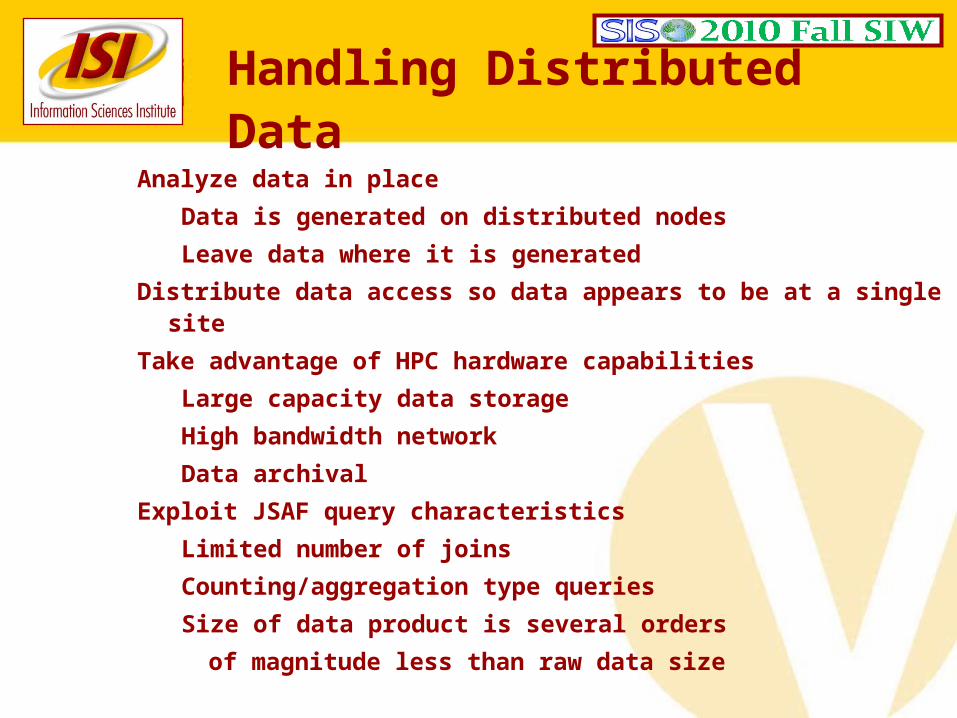
Handling Distributed Data
Analyze data in place
Data is generated on distributed nodes
Leave data where it is generated
Distribute data access so data appears to be at a single site
Take advantage of HPC hardware capabilities
Large capacity data storage
High bandwidth network
Data archival
Exploit JSAF query characteristics
Limited number of joins
Counting/aggregation type queries
Size of data product is several orders
of magnitude less than raw data size
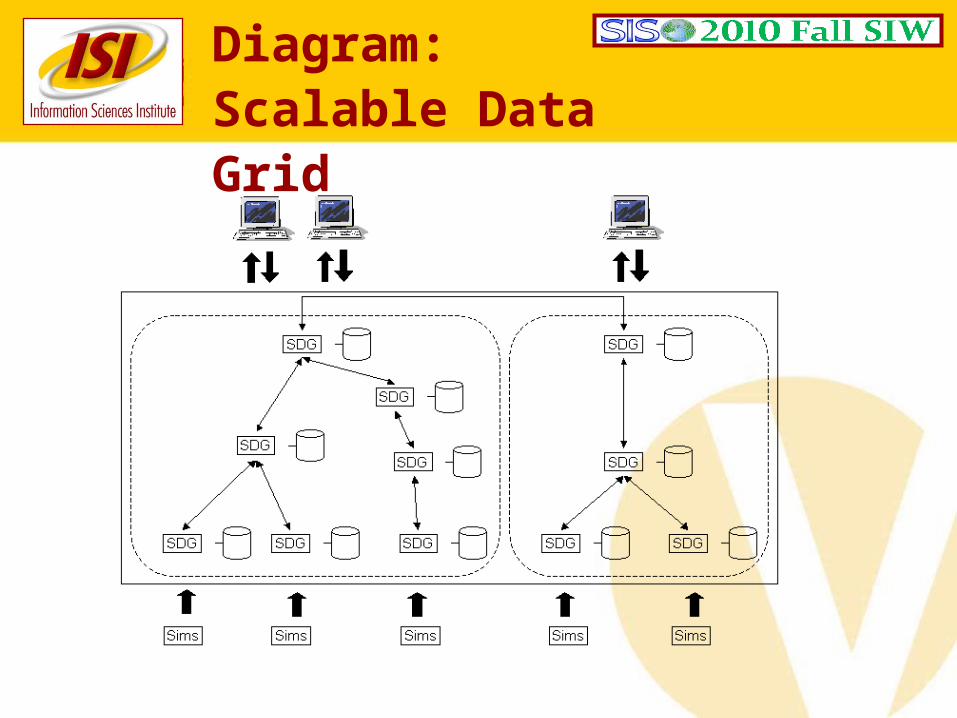
Diagram: Scalable Data Grid
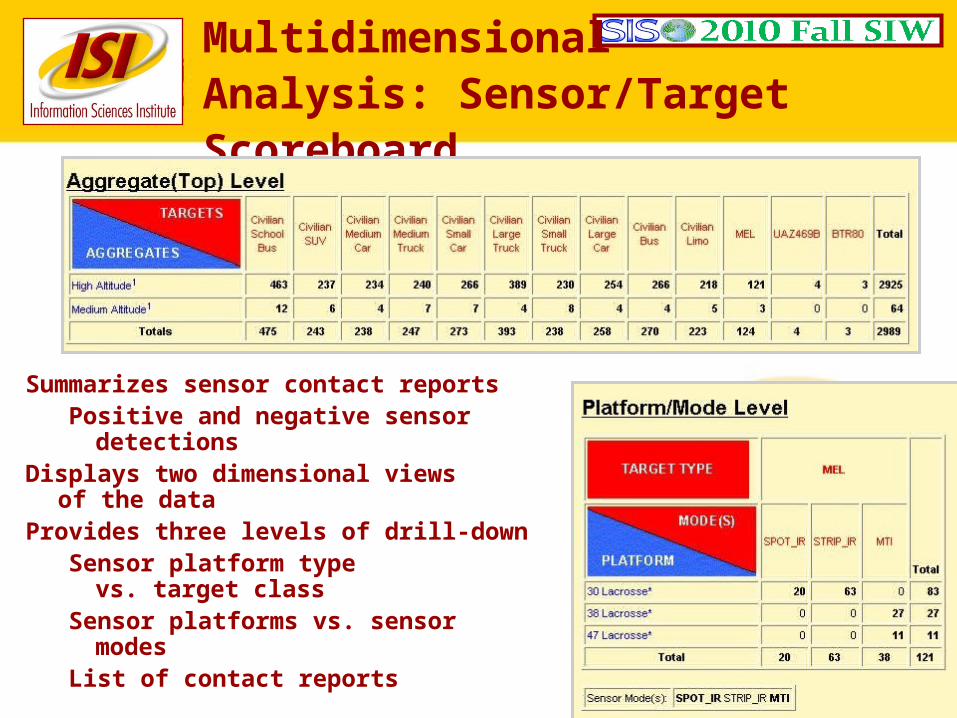
Multidimensional Analysis: Sensor/Target Scoreboard
Summarizes sensor contact reportsPositive and negative sensor
detectionsDisplays two dimensional views
of the dataProvides three levels of drill-down
Sensor platform type vs. target class
Sensor platforms vs. sensor modes
List of contact reports
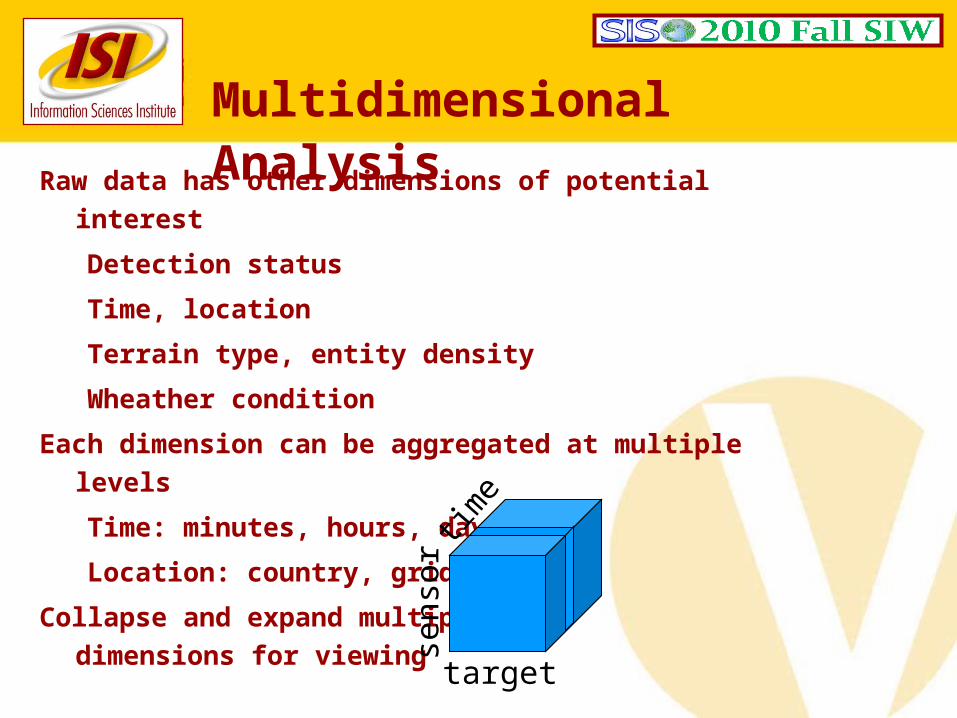
Multidimensional Analysis
Raw data has other dimensions of potential interest
Detection status
Time, location
Terrain type, entity density
Wheather condition
Each dimension can be aggregated at multiple levels
Time: minutes, hours, days
Location: country, grid square
Collapse and expand multiple dimensions for viewing
sens
or
target
time
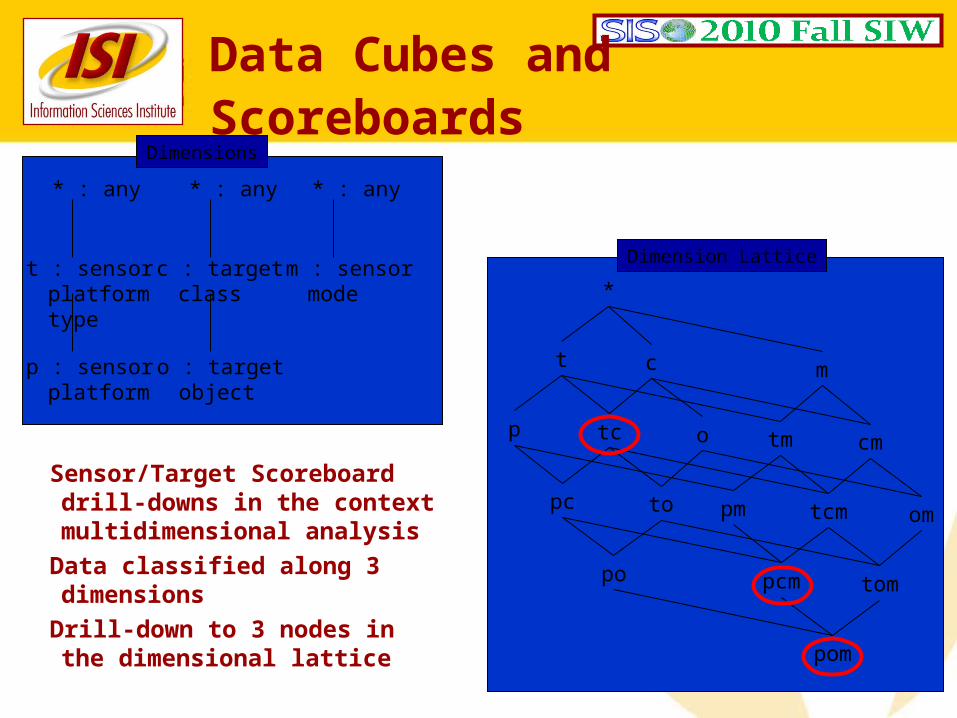
* : any * : any
t : sensor platform type
p : sensor platform
c : targetclass
o : targetobject
m : sensormode
Data Cubes and Scoreboards
* : any
*
t
p
c
tc
pc
o
to
po
m
tm
pm
cm
tcm
pcm
om
tom
pom
Sensor/Target Scoreboard drill-downs in the context multidimensional analysis
Data classified along 3 dimensions
Drill-down to 3 nodes in the dimensional lattice
Dimensions
Dimension Lattice
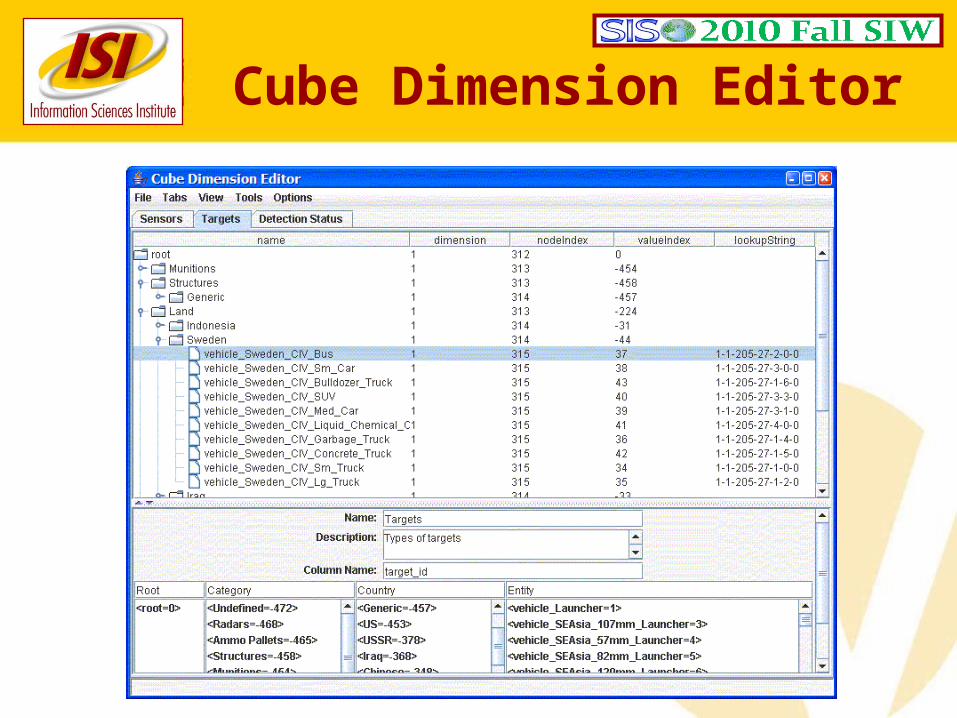
Cube Dimension Editor
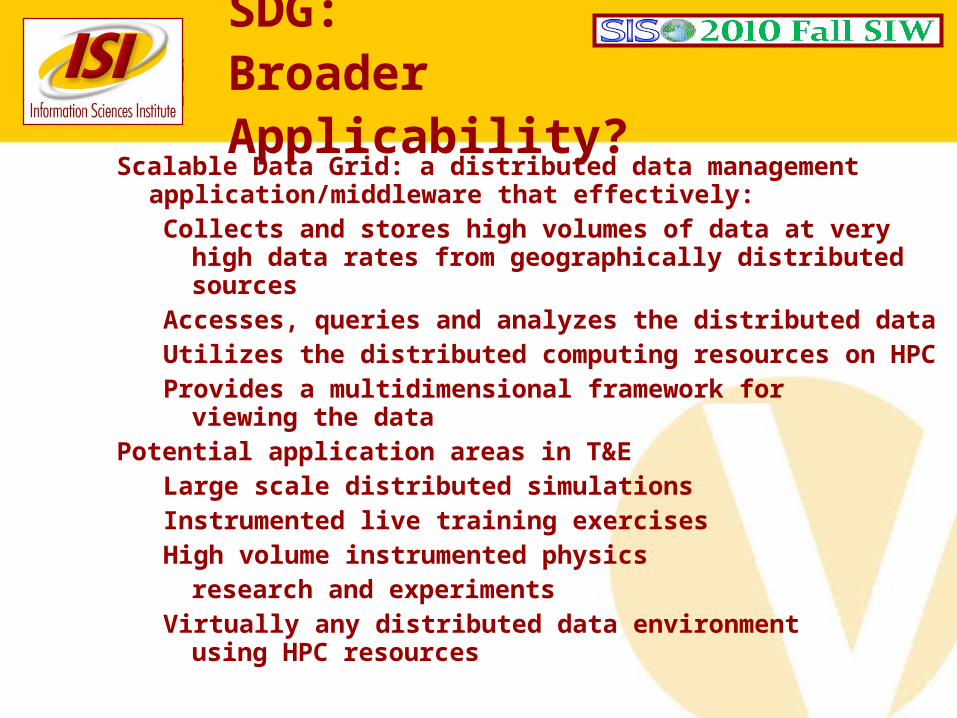
SDG: Broader Applicability?
Scalable Data Grid: a distributed data management application/middleware that effectively:Collects and stores high volumes of data at very high
data rates from geographically distributed sourcesAccesses, queries and analyzes the distributed dataUtilizes the distributed computing resources on HPCProvides a multidimensional framework for
viewing the dataPotential application areas in T&E
Large scale distributed simulationsInstrumented live training exercisesHigh volume instrumented physics
research and experimentsVirtually any distributed data environment
using HPC resources

Logging Data Flow
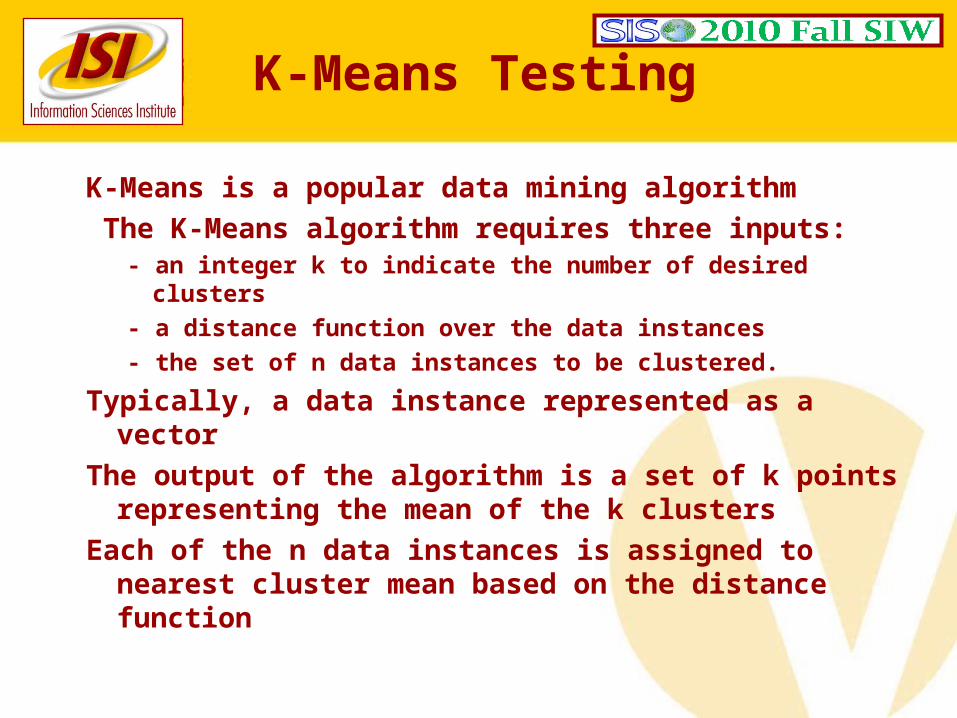
K-Means Testing
K-Means is a popular data mining algorithm The K-Means algorithm requires three inputs:
- an integer k to indicate the number of desired clusters- a distance function over the data instances- the set of n data instances to be clustered.
Typically, a data instance represented as a vectorThe output of the algorithm is a set of k points
representing the mean of the k clustersEach of the n data instances is assigned to nearest
cluster mean based on the distance function
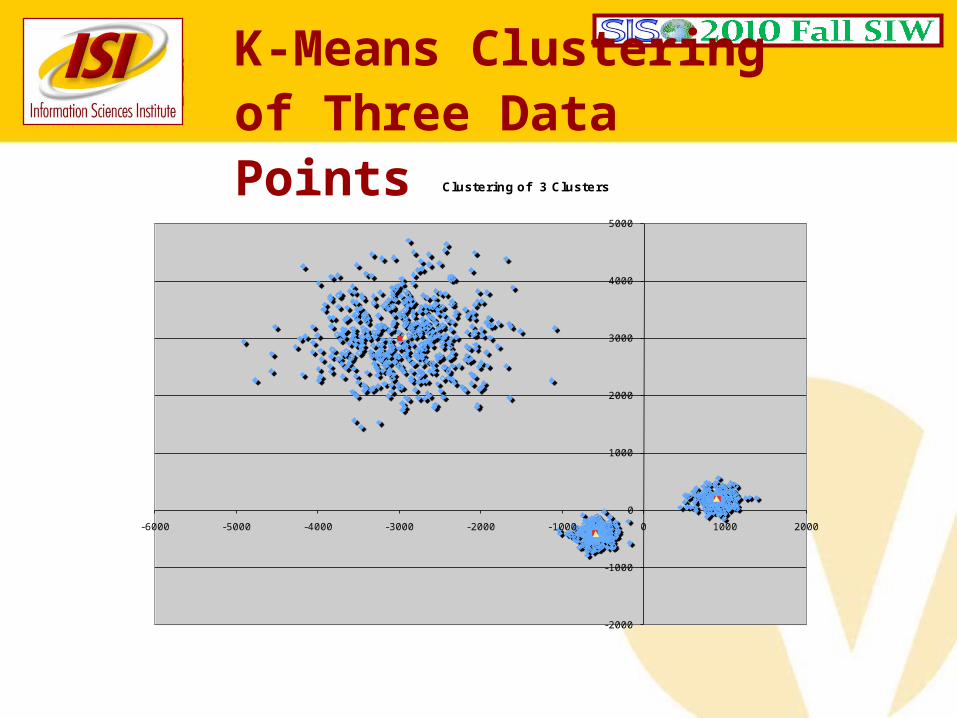
K-Means Clustering of Three Data Points
-2000
-1000
0
1000
2000
3000
4000
5000
-6000 -5000 -4000 -3000 -2000 -1000 0 1000 2000
Clustering of 3 Clusters

Summary
New capabilities for JFCOM Joint ExperimentsGlobal scaleHigher fidelityOrders of magnitude
more entities
They were the most effective due to:HPCMP provision of clusters at MHPCC, ASC-
MSRC and JFCOM Development under the watchful eye
of parallel architectsSupport by experienced staff at the centers
Conclusions
The use of the Scalable Data Grid and Hadoop show promise for the Test and Evaluation environments.
ISI experience was that the SDG and Hadoop provided a scalable, but conceptually simple, distributed computation paradigm.
The Hadoop filesystem dramatically reduced the disk scan time needed by iterative data mining algorithms.
ISI has successfully executed these algorithms across multiple Linux clusters over dedicated 10 Gigabit per second networks.
The results of these experiments support the potential for the use of these tools in Test and Evaluation.

Typical JFCOM Experimentation Network
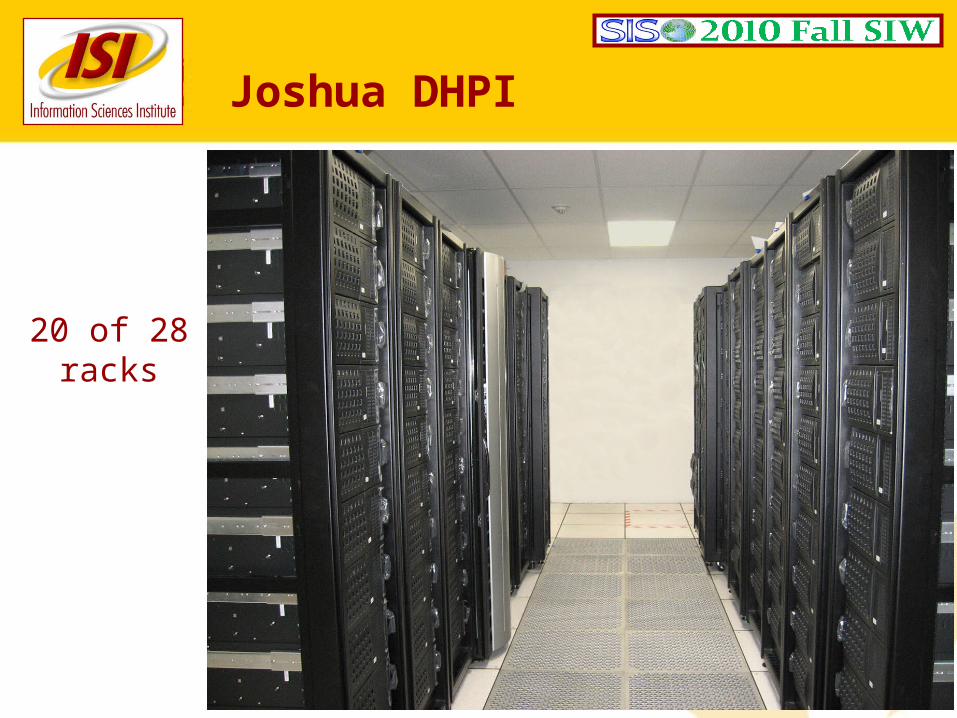
Joshua DHPI
20 of 28 racks

JLogger Logging Data Flow
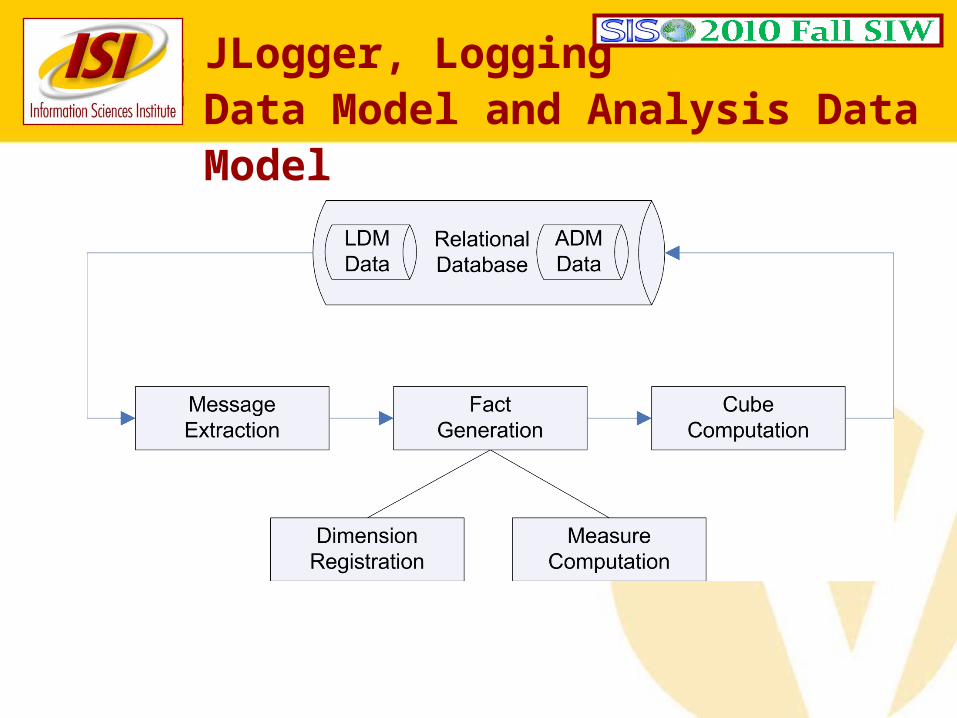
JLogger, Logging Data Model and Analysis Data Model
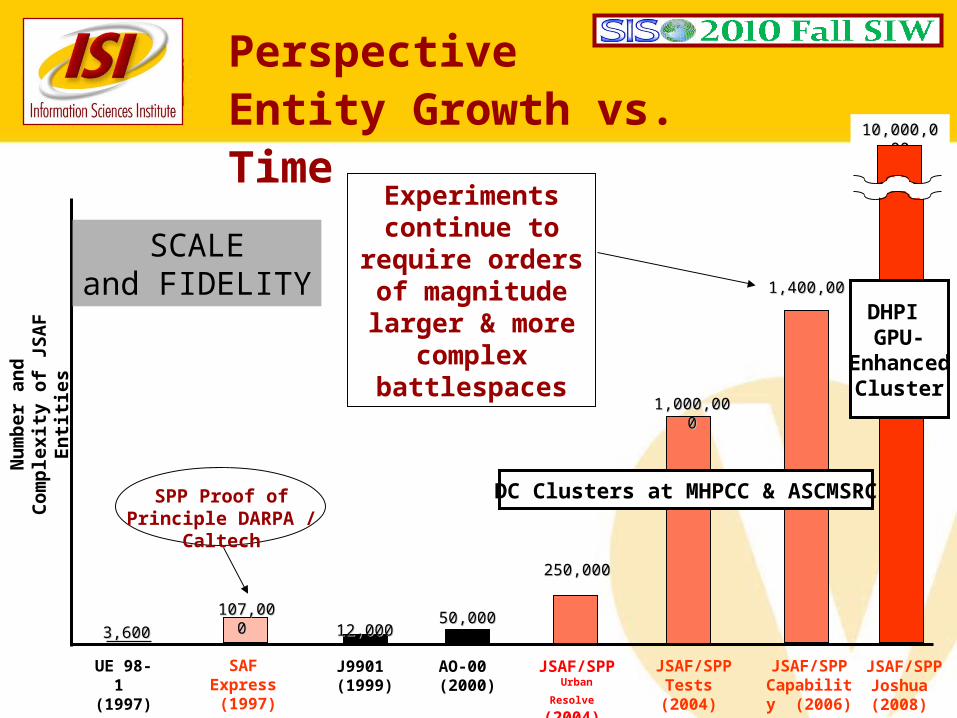
PerspectiveEntity Growth vs. Time
Nu
mb
er
an
d
Com
ple
xit
y o
f JS
AF
En
titi
es
JSAF/SPP Joshua (2008)
10,000,010,000,00000
UE 98-1
(1997)
JSAF/SPP Capability (2006)
JSAF/SPP Urban
Resolve (2004)
JSAF/SPP
Tests (2004)
J9901 (1999)
SAF Expres
s (1997)
3,600 3,600 12,000 12,000 107,00107,00
0 0
AO-00 (2000)
50,000 50,000
1,400,001,400,00
1,000,001,000,0000
250,000250,000
SPP Proof of Principle DARPA / Caltech
Experiments continue to require orders of magnitude larger &
more complex battlespaces
SCALEand FIDELITY
DC Clusters at MHPCC & ASCMSRC
DHPI GPU-
Enhanced Cluster
This material is based on research sponsored by the U.S. Joint Forces Command via a contract with the Lockheed Martin Corporation and SimIS, Inc., and on research sponsored by the Air Force Research Laboratory under agreement numbers F30602-02-C-0213 and FA8750-05-2-0204. The U.S. Government is authorized to reproduce and distribute reprints for Governmental purposes notwithstanding any copyright notation thereon. The views and conclusions contained herein are those of the authors and should not be interpreted as necessarily representing the official policies or endorsements, either expressed or implied, of the U.S. Government. Approved for public release; distribution is unlimited.
Research Funded by JFCOM and AFRL