Embed Size (px)
Citation preview
1
Mapletree Commercial Trust
2Q & 1H FY14/15 Financial Results
24 October 2014
2
Important Notice
This presentation is for information only and does not constitute an offer or solicitation of an offer to sell or
invitation to subscribe for or acquire any units in Mapletree Commercial Trust (“MCT”) and units in MCT,
(“Units”).
The past performance of the Units and MCT is not indicative of the future performance of MCT or
Mapletree Commercial Trust Management Ltd. (“Manager”). The value of Units and the income from them
may rise or fall. Units are not obligations of, deposits in or guaranteed by the Manger or any of its
affiliates. An investment in Units is subject to investment risks, including the possible loss of the principal
amount invested. Investors have no right to request the Manager to redeem their Units while the Units are
listed. It is intended that unitholders may only deal in their Units through trading on the SGX-ST. Listing of
the Units on the SGX-ST does not guarantee a liquid market for the Units
This presentation may also contain forward-looking statements that involve risks and uncertainties. Actual
future performance, outcomes and results may differ materially from those expressed in forward-looking
statements as a result of risks, uncertainties and assumptions. Representative examples of these factors
include general industry and economic conditions, interest rate trends, cost of capital, occupancy rate,
construction and development risks, changes in operating expenses (including employees wages,
benefits and training costs), governmental and public policy changes and the continued availability of
financing. You are cautioned not to place undue reliance on these forward-looking statements, which are
based on current view of management on future events.
Nothing in this presentation should be construed as financial, investment, business, legal or tax advice
and you should consult your own independent professional advisors. This presentation shall be read in
conjunction with MCT’s financial results for 2Q & 1H FY14/15 in the SGXNET announcement dated 24
October 2014.
3
Agenda Key Highlights
Financial Performance
Portfolio Update Outlook
4
Distribution per Unit (“DPU”) for 2Q FY14/15 up 9.4% year-on-year, to 1.97
cents
Portfolio Gross Revenue (“GR”) and Net Property Income (“NPI”) for 2Q
FY14/15 grew 6.3% and 8.8% year-on-year respectively
Aggregate leverage ratio reduced to 38.0%
Asset Enhancement Initiative (“AEI”) planned at VivoCity to create new
retail space of about 15,000 square feet at basement 1
2Q FY14/151 Key Highlights
1. The period from 1 July 2014 to 30 September 2014, referred to as “2Q FY14/15”
5
Financial Performance
6
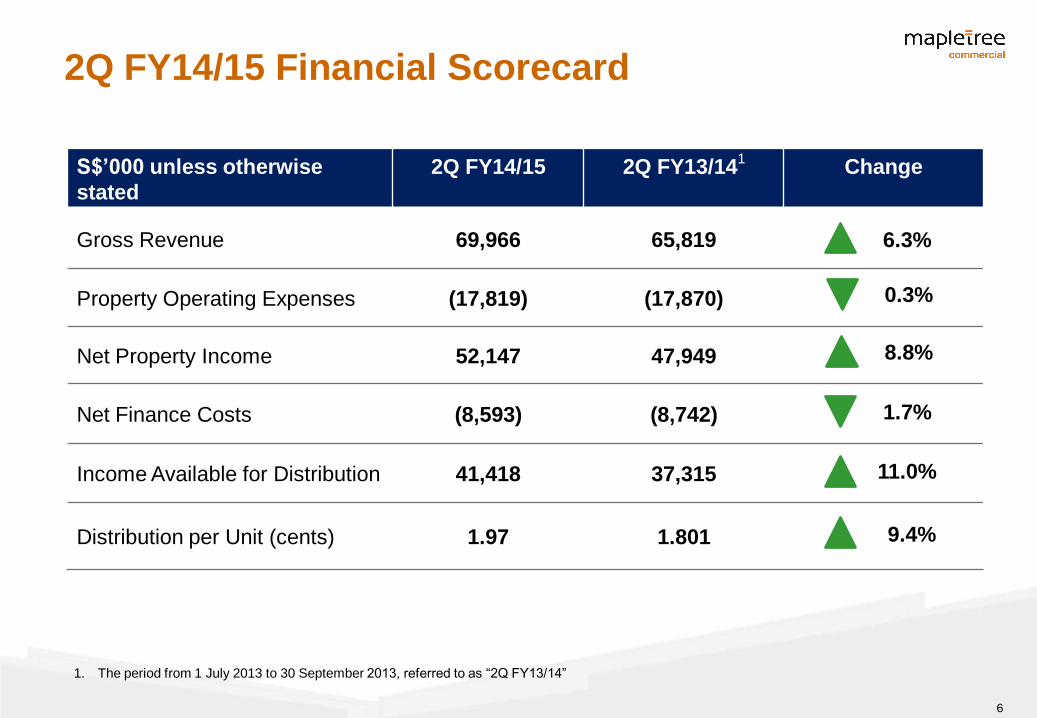
2Q FY14/15 Financial Scorecard
S$’000 unless otherwise
stated
2Q FY14/15 2Q FY13/141
Change
Gross Revenue 69,966 65,819
Property Operating Expenses (17,819) (17,870)
Net Property Income 52,147 47,949
Net Finance Costs (8,593) (8,742)
Income Available for Distribution 41,418 37,315
Distribution per Unit (cents) 1.97 1.801 9.4%
11.0%
8.8%
6.3%
0.3%
1.7%
1. The period from 1 July 2013 to 30 September 2013, referred to as “2Q FY13/14”
7
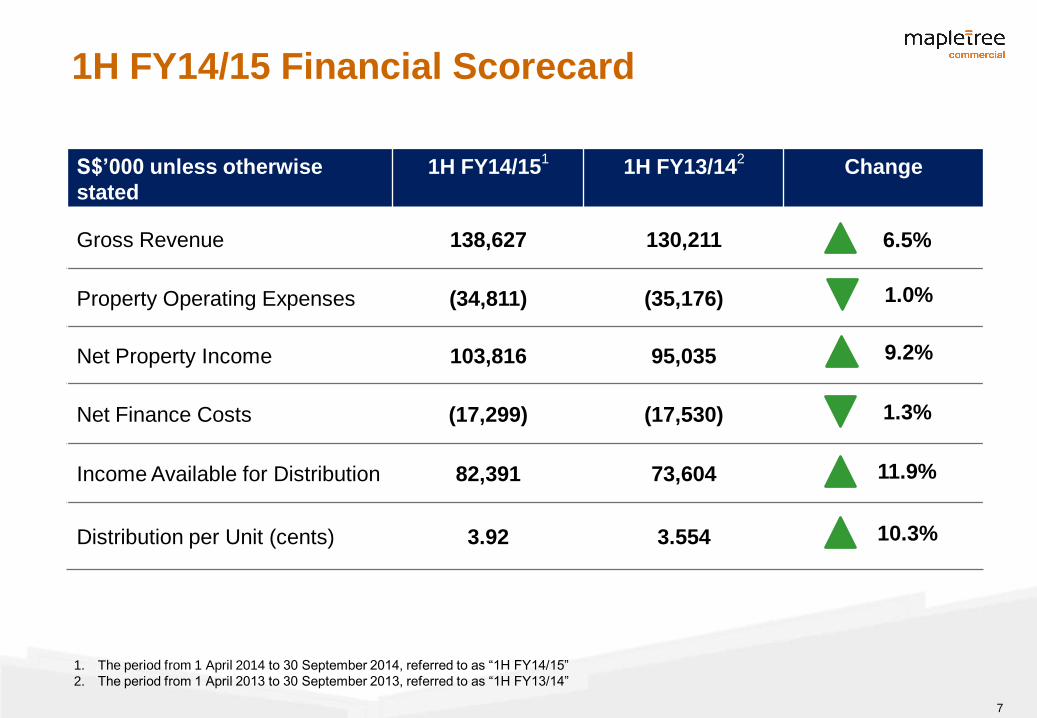
1H FY14/15 Financial Scorecard
S$’000 unless otherwise
stated
1H FY14/151 1H FY13/14
2 Change
Gross Revenue 138,627 130,211
Property Operating Expenses (34,811) (35,176)
Net Property Income 103,816 95,035
Net Finance Costs (17,299) (17,530)
Income Available for Distribution 82,391 73,604
Distribution per Unit (cents) 3.92 3.554 10.3%
11.9%
9.2%
6.5%
1.0%
1.3%
1. The period from 1 April 2014 to 30 September 2014, referred to as “1H FY14/15”
2. The period from 1 April 2013 to 30 September 2013, referred to as “1H FY13/14”
8
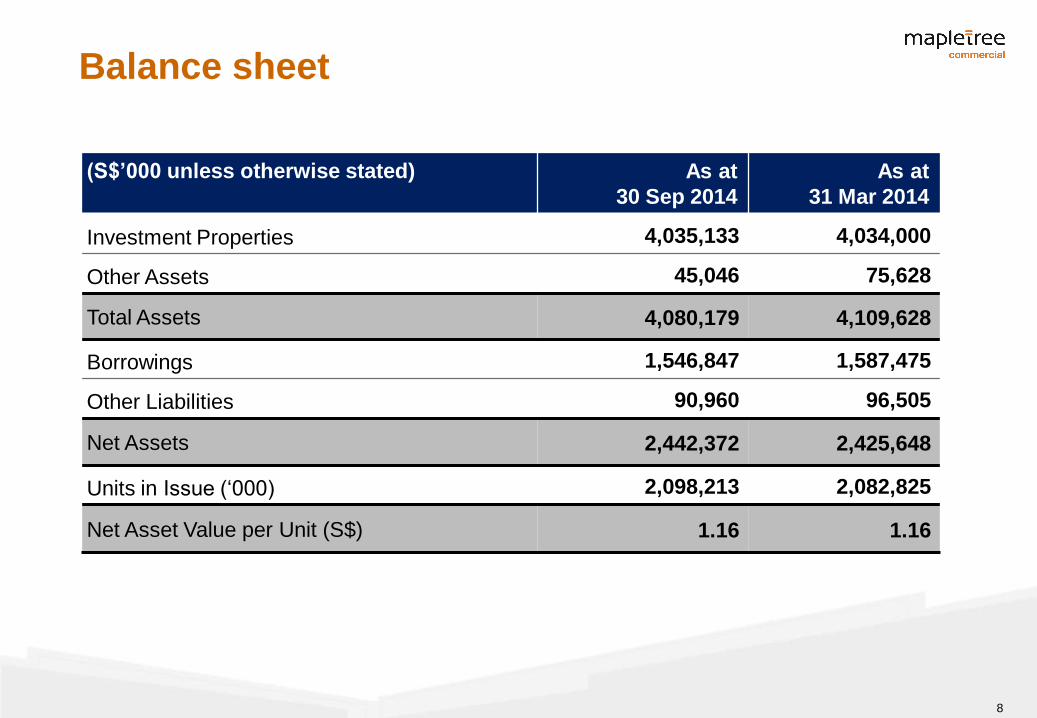
(S$’000 unless otherwise stated) As at
30 Sep 2014
As at
31 Mar 2014
Investment Properties 4,035,133 4,034,000
Other Assets 45,046 75,628
Total Assets 4,080,179 4,109,628
Borrowings 1,546,847 1,587,475
Other Liabilities 90,960 96,505
Net Assets 2,442,372 2,425,648
Units in Issue (‘000) 2,098,213 2,082,825
Net Asset Value per Unit (S$) 1.16 1.16
Balance sheet
9
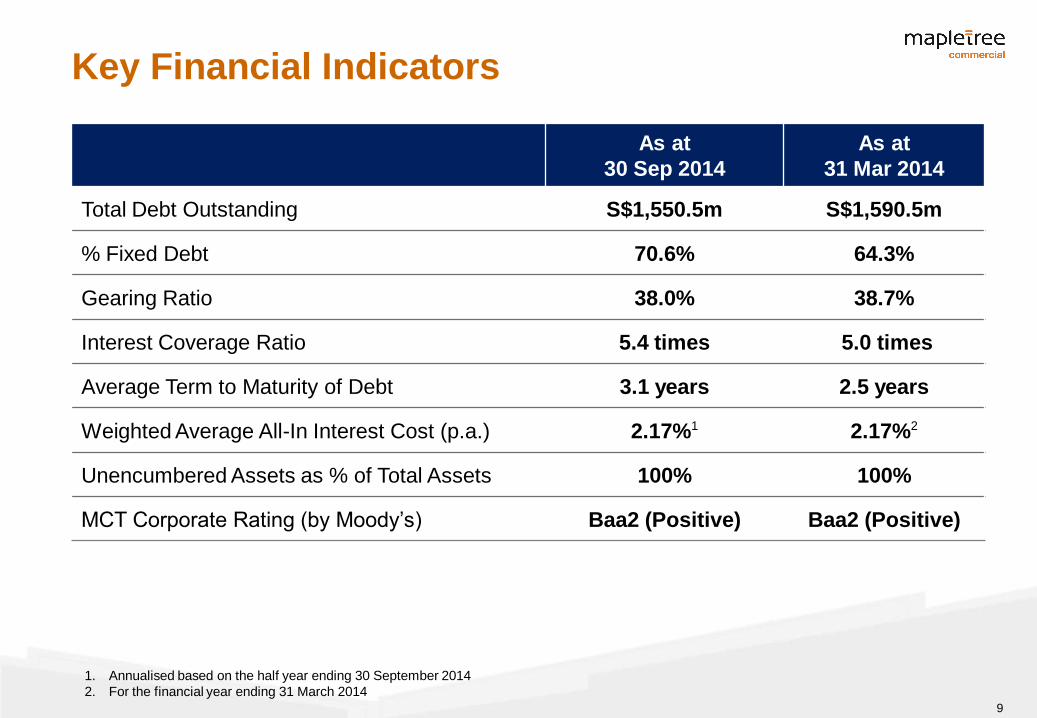
As at
30 Sep 2014
As at
31 Mar 2014
Total Debt Outstanding S$1,550.5m S$1,590.5m
% Fixed Debt 70.6% 64.3%
Gearing Ratio 38.0% 38.7%
Interest Coverage Ratio 5.4 times 5.0 times
Average Term to Maturity of Debt 3.1 years 2.5 years
Weighted Average All-In Interest Cost (p.a.) 2.17%1 2.17%2
Unencumbered Assets as % of Total Assets 100% 100%
MCT Corporate Rating (by Moody’s) Baa2 (Positive) Baa2 (Positive)
Key Financial Indicators
1. Annualised based on the half year ending 30 September 2014
2. For the financial year ending 31 March 2014
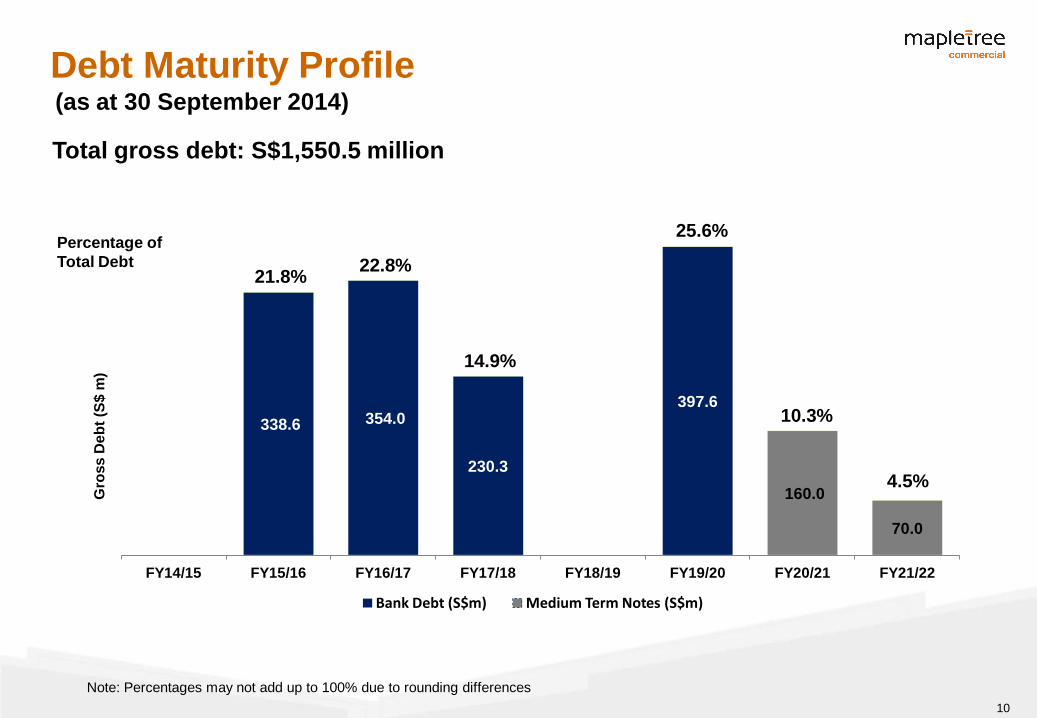
10
338.6 354.0
230.3
397.6
160.0
70.0
FY14/15 FY15/16 FY16/17 FY17/18 FY18/19 FY19/20 FY20/21 FY21/22
Gro
ss D
eb
t (S
$ m
)
Bank Debt (S$m) Medium Term Notes (S$m)
21.8%
14.9%
22.8%
10.3%
4.5%
25.6% Percentage of
Total Debt
Debt Maturity Profile
Note: Percentages may not add up to 100% due to rounding differences
Total gross debt: S$1,550.5 million
(as at 30 September 2014)
11
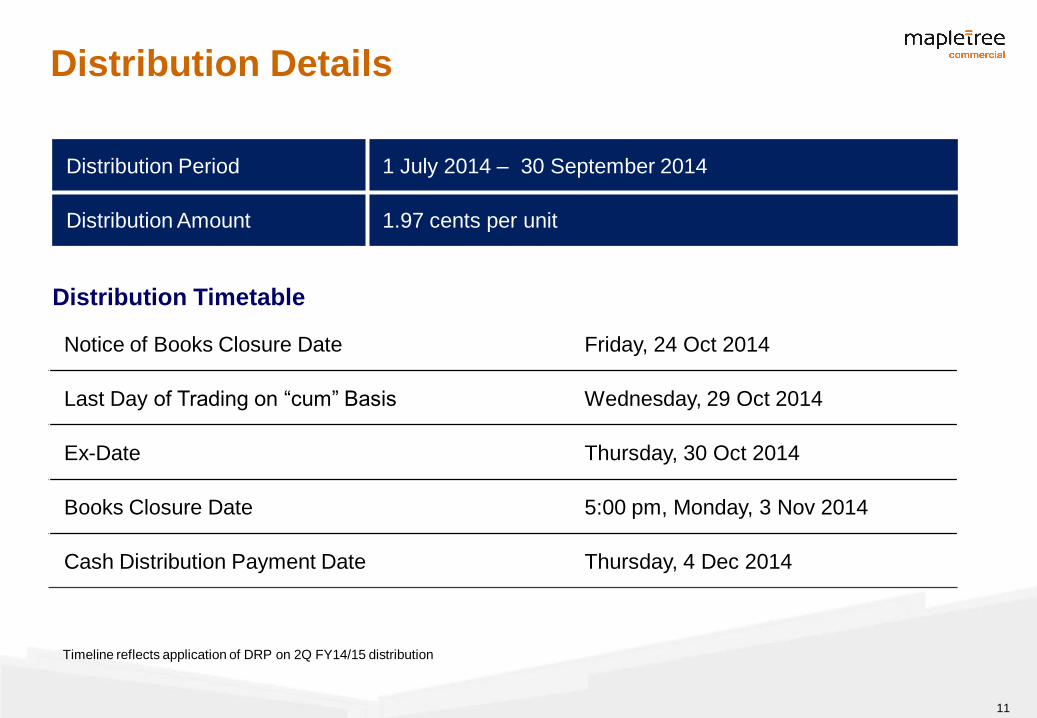
Distribution Details
Distribution Period 1 July 2014 – 30 September 2014
Distribution Amount 1.97 cents per unit
Notice of Books Closure Date Friday, 24 Oct 2014
Last Day of Trading on “cum” Basis Wednesday, 29 Oct 2014
Ex-Date Thursday, 30 Oct 2014
Books Closure Date 5:00 pm, Monday, 3 Nov 2014
Cash Distribution Payment Date Thursday, 4 Dec 2014
Distribution Timetable
Timeline reflects application of DRP on 2Q FY14/15 distribution
12
Portfolio Update
13
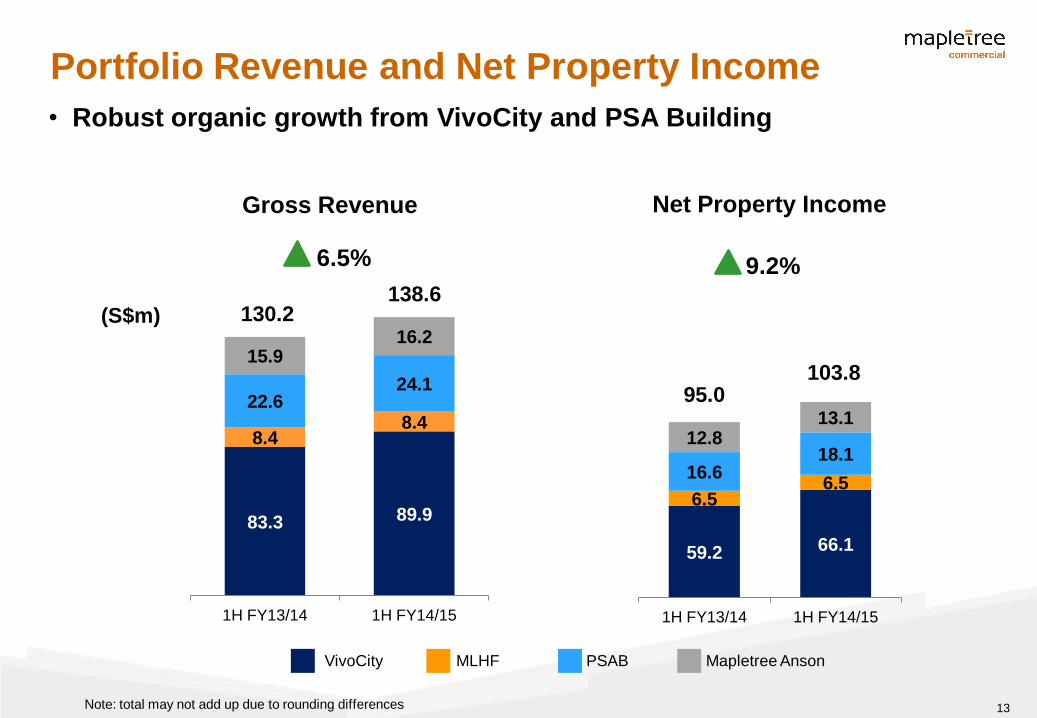
83.3 89.9
8.4 8.4
22.6 24.1
15.9 16.2
1H FY13/14 1H FY14/15
Gross Revenue
6.5%
59.2 66.1
6.5 6.5
16.6 18.1
12.8 13.1
1H FY13/14 1H FY14/15
Net Property Income
9.2%
130.2 138.6
(S$m)
95.0 103.8
VivoCity PSAB Mapletree Anson MLHF
Portfolio Revenue and Net Property Income
Note: total may not add up due to rounding differences
• Robust organic growth from VivoCity and PSA Building
14
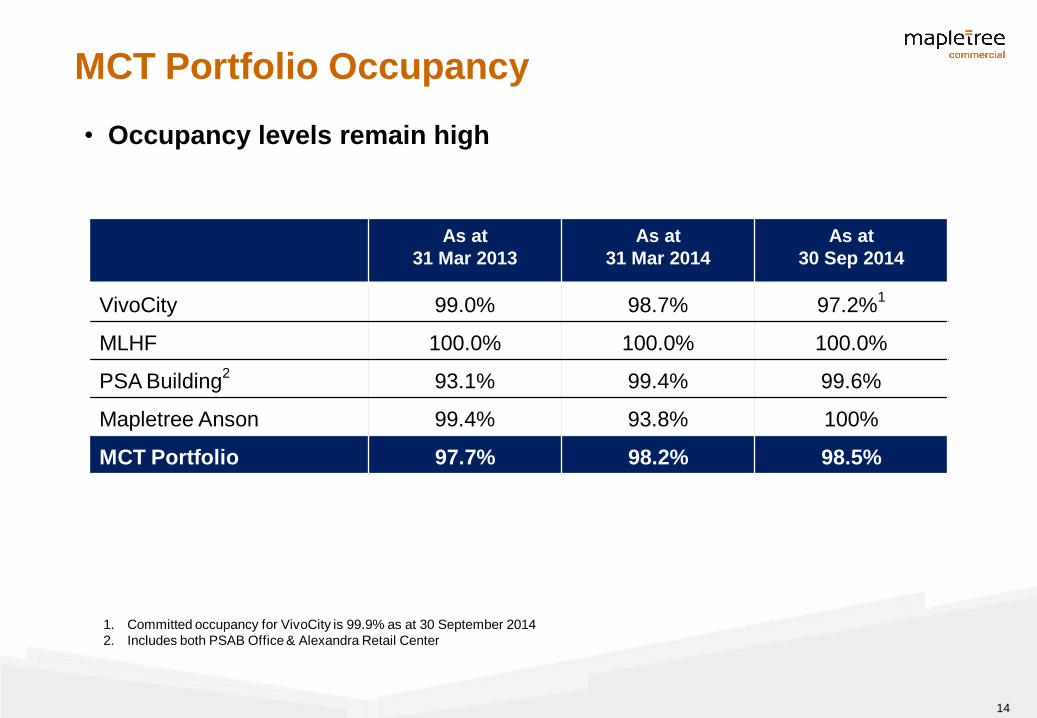
As at
31 Mar 2013
As at
31 Mar 2014
As at
30 Sep 2014
VivoCity
99.0% 98.7% 97.2%1
MLHF 100.0% 100.0% 100.0%
PSA Building2
93.1% 99.4% 99.6%
Mapletree Anson
99.4% 93.8% 100%
MCT Portfolio 97.7% 98.2% 98.5%
1. Committed occupancy for VivoCity is 99.9% as at 30 September 2014
2. Includes both PSAB Office & Alexandra Retail Center
• Occupancy levels remain high
MCT Portfolio Occupancy
15
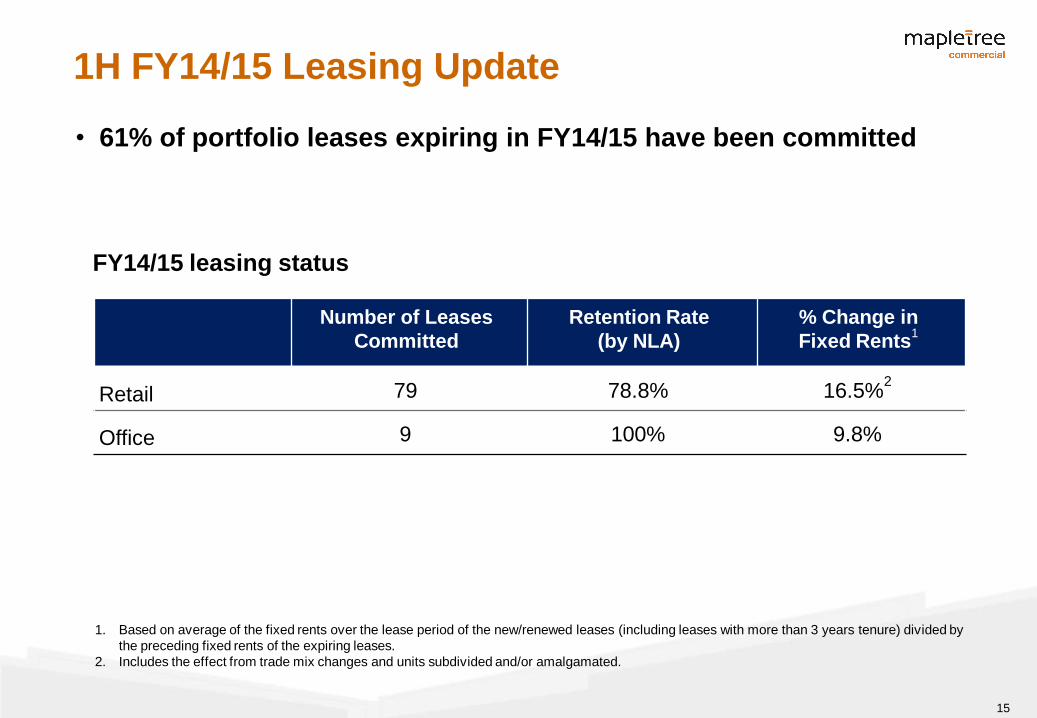
FY14/15 leasing status
• 61% of portfolio leases expiring in FY14/15 have been committed
Number of Leases
Committed
Retention Rate
(by NLA)
% Change in
Fixed Rents1
Retail 79 78.8% 16.5%2
Office 9 100% 9.8%
1. Based on average of the fixed rents over the lease period of the new/renewed leases (including leases with more than 3 years tenure) divided by
the preceding fixed rents of the expiring leases.
2. Includes the effect from trade mix changes and units subdivided and/or amalgamated.
1H FY14/15 Leasing Update
16
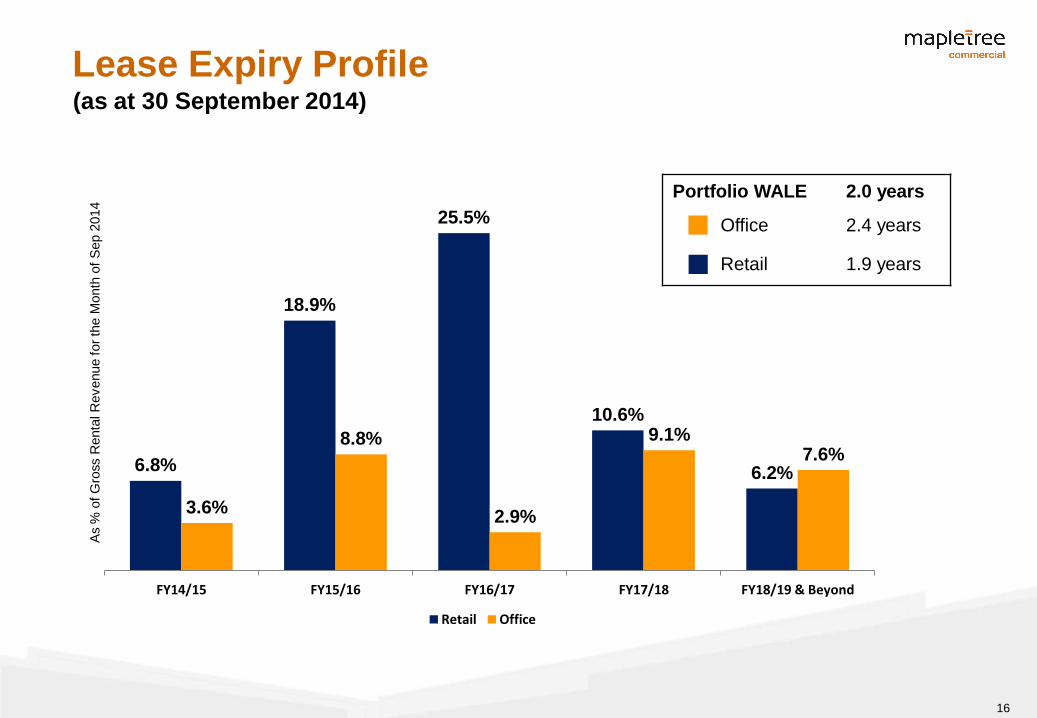
Lease Expiry Profile
Portfolio WALE 2.0 years
Office 2.4 years
Retail 1.9 years
(as at 30 September 2014)
6.8%
18.9%
25.5%
10.6%
6.2%
3.6%
8.8%
2.9%
9.1% 7.6%
FY14/15 FY15/16 FY16/17 FY17/18 FY18/19 & Beyond
As %
of G
ross R
enta
l R
evenue for
the M
onth
of
Sep 2
014
Retail Office
17
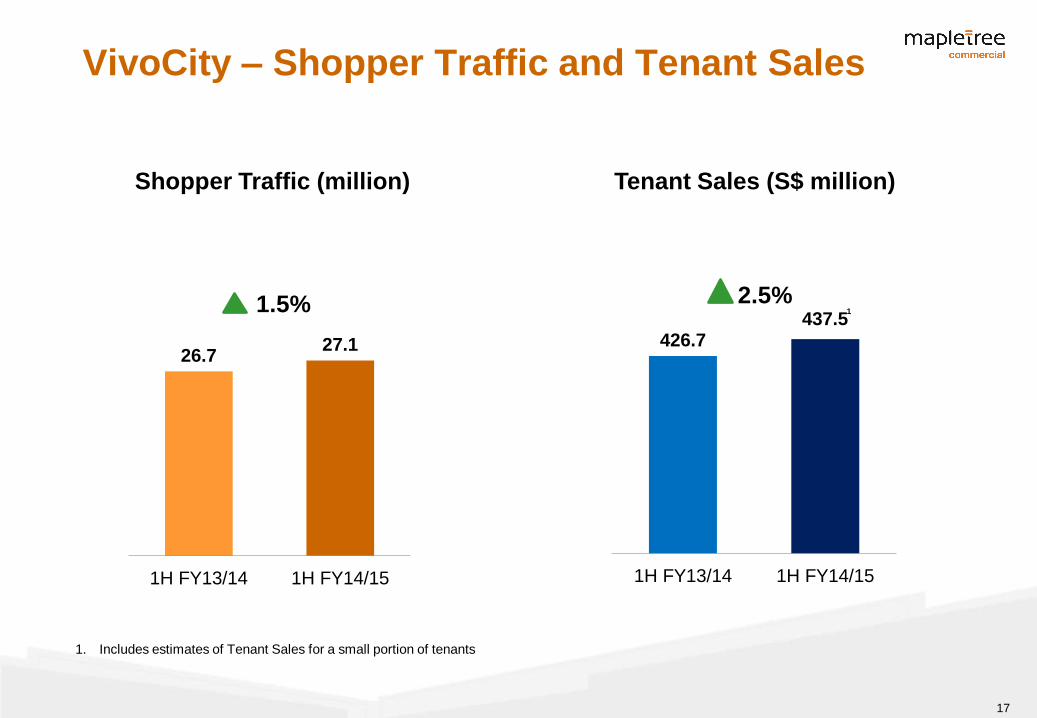
26.7 27.1
1H FY13/14 1H FY14/15
426.7 437.5
1H FY13/14 1H FY14/15
VivoCity – Shopper Traffic and Tenant Sales
Shopper Traffic (million) Tenant Sales (S$ million)
1. Includes estimates of Tenant Sales for a small portion of tenants
1.5% 2.5% 1
18
Proposed Asset Enhancement
at VivoCity
19
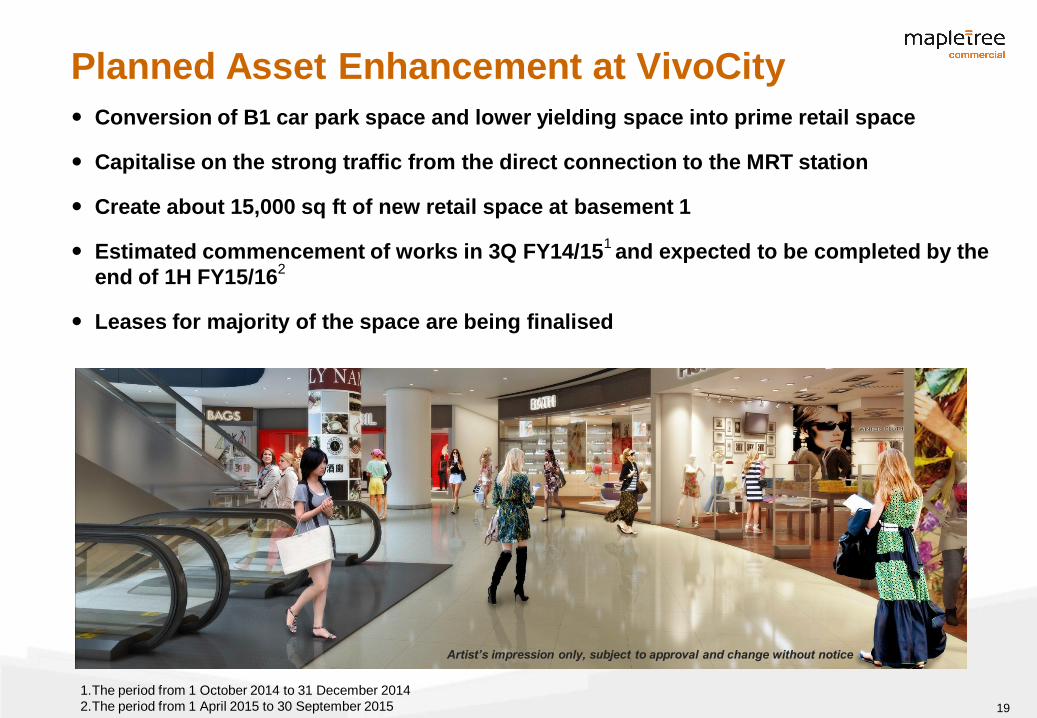
Conversion of B1 car park space and lower yielding space into prime retail space
Capitalise on the strong traffic from the direct connection to the MRT station
Create about 15,000 sq ft of new retail space at basement 1
Estimated commencement of works in 3Q FY14/151 and expected to be completed by the
end of 1H FY15/162
Leases for majority of the space are being finalised
Planned Asset Enhancement at VivoCity
Artist’s impression only, subject to approval and change without notice
1.The period from 1 October 2014 to 31 December 2014
2.The period from 1 April 2015 to 30 September 2015
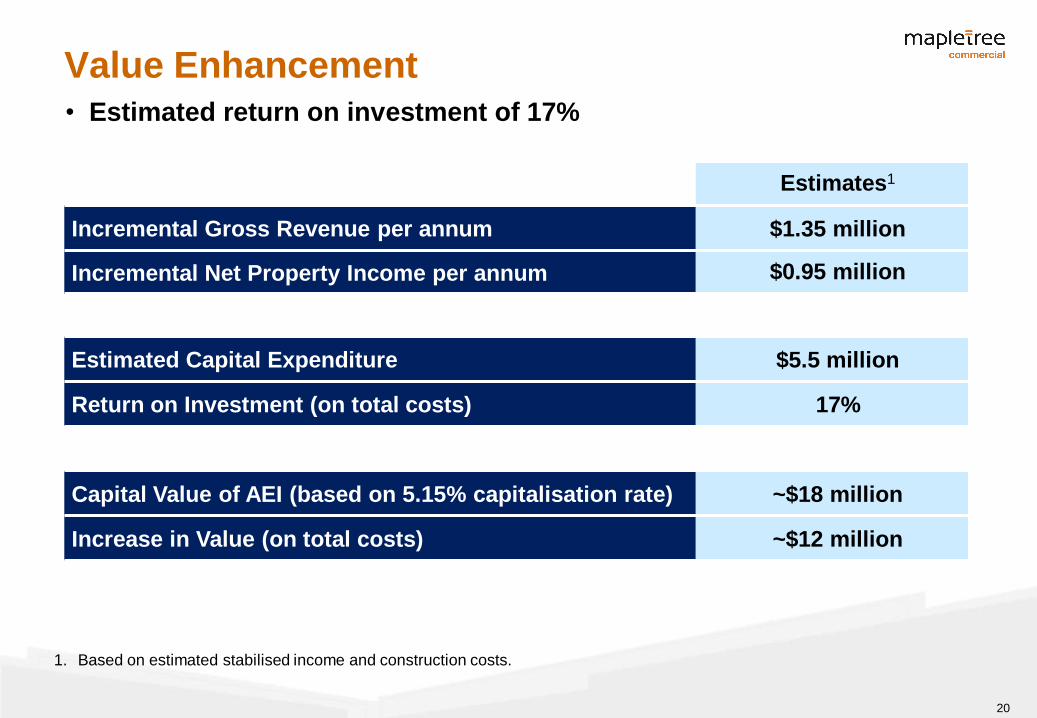
20
Estimates1
Incremental Gross Revenue per annum $1.35 million
Incremental Net Property Income per annum $0.95 million
Estimated Capital Expenditure $5.5 million
Return on Investment (on total costs) 17%
Capital Value of AEI (based on 5.15% capitalisation rate) ~$18 million
Increase in Value (on total costs) ~$12 million
1. Based on estimated stabilised income and construction costs.
Value Enhancement • Estimated return on investment of 17%
21
Outlook
22
Outlook
Singapore economy
• Based on MTI’s advanced estimates, GDP grew 2.4% year-on-year in the quarter
ended September 2014, the same pace of growth as in the previous quarter
• On a quarter-to-quarter seasonally adjusted annualised basis, the economy
expanded by 1.2%, a reversal from the 0.1% contraction in the previous quarter
• For 2014, MTI has narrowed its GDP growth forecast to 2.5% to 3.5%
Retail market
• According to CBRE, more occupiers are facing tighter profit margins due to relatively
flat or lower sales volume amidst rising costs and challenges faced in securing
manpower.
• Despite the challenging operating conditions, there was still strong demand by new
or expanding retailers for prime space in the quarter. The choice of store locations
has become an even more important factor to such retailers.
• The outlook for the retail market is likely to remain challenging in the next 6-12
months.
23
Outlook (Cont’d)
Office market
• Office rents continued to rise in Q3 2014 with quarter-on-quarter increases ranging
from 2.3% to 3.3%, led by better quality developments. CBRE expects rental growth
for office to remain through the next few quarters, underpinned by low vacancy and
steady demand.
• However, it is possible that the pace of rental growth may ease by as early as the
second half of 2015 as the impact of impending supply from mid-2016 through 2017
is likely to result in a more competitive office leasing market.
24
For enquiries, please contact:
Jason Lim
Investor Relations
Tel: +65 6377 6836
Email: [email protected]
Thank You


![REVISION FURTHER - Lakewood€¦ · [1]Debt to EBITDA (2014) 1.4x Total Cash & LT Investments (2014) $54.5 million . Cash & LT Investments to [1]Debt (2014) 434.9% [1] Debt includes](https://img.pdfslide.us/doc/110x75/5f660906a1917d28de740fff/revision-further-1debt-to-ebitda-2014-14x-total-cash-lt-investments.jpg)