Embed Size (px)
Citation preview
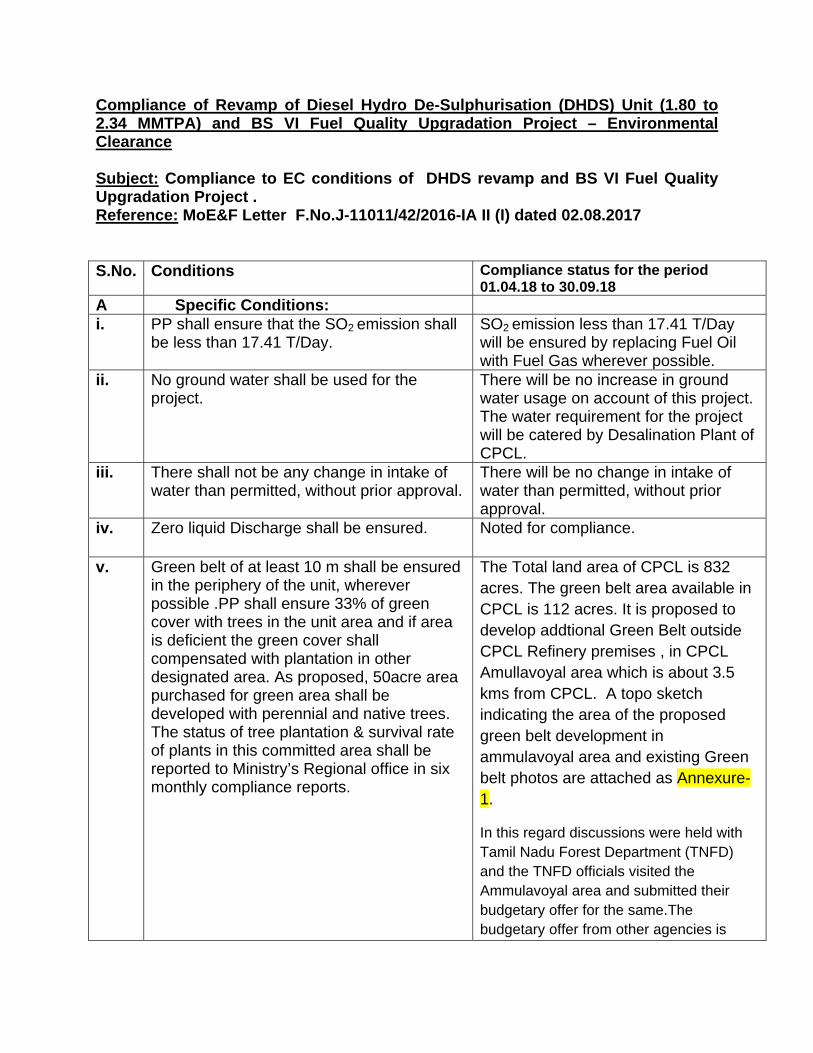
Compliance of Revamp of Diesel Hydro De-Sulphurisation (DHDS) Unit (1.80 to 2.34 MMTPA) and BS VI Fuel Quality Upgradation Project – Environmental Clearance Subject: Compliance to EC conditions of DHDS revamp and BS VI Fuel Quality Upgradation Project . Reference: MoE&F Letter F.No.J-11011/42/2016-IA II (I) dated 02.08.2017 S.No. Conditions Compliance status for the period
01.04.18 to 30.09.18 A Specific Conditions: i. PP shall ensure that the SO2 emission shall
be less than 17.41 T/Day. SO2 emission less than 17.41 T/Day will be ensured by replacing Fuel Oil with Fuel Gas wherever possible.
ii. No ground water shall be used for the project.
There will be no increase in ground water usage on account of this project. The water requirement for the project will be catered by Desalination Plant of CPCL.
iii. There shall not be any change in intake of water than permitted, without prior approval.
There will be no change in intake of water than permitted, without prior approval.
iv. Zero liquid Discharge shall be ensured. Noted for compliance.
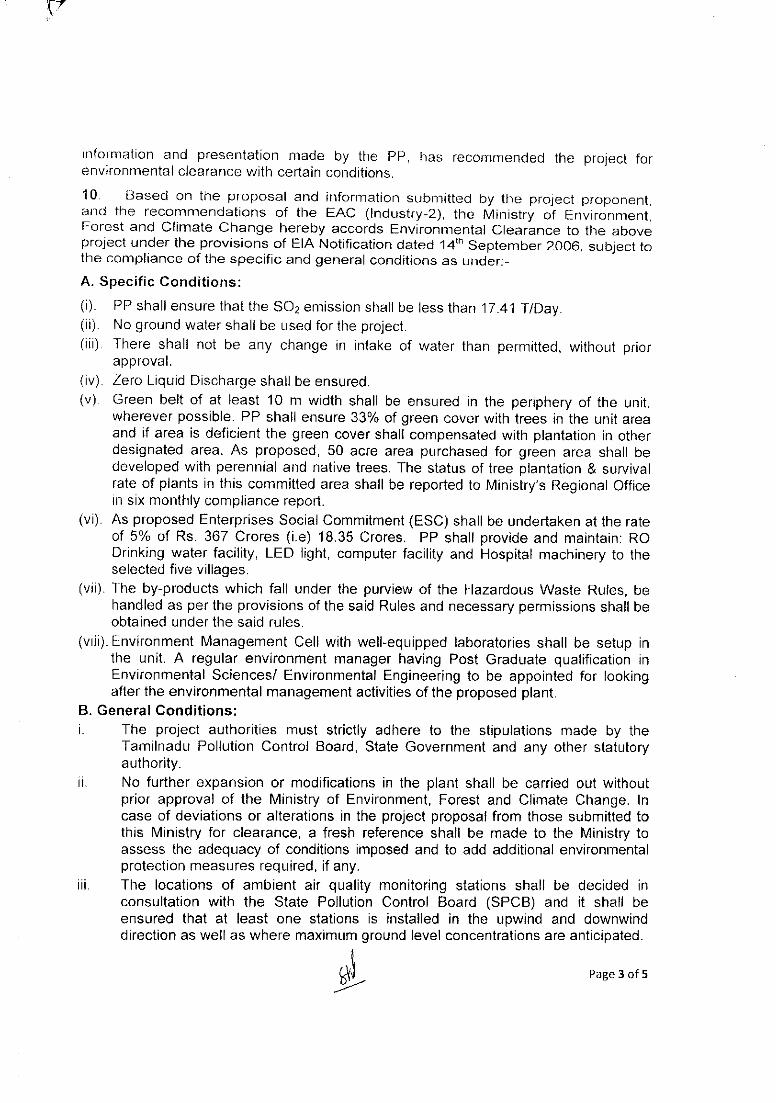
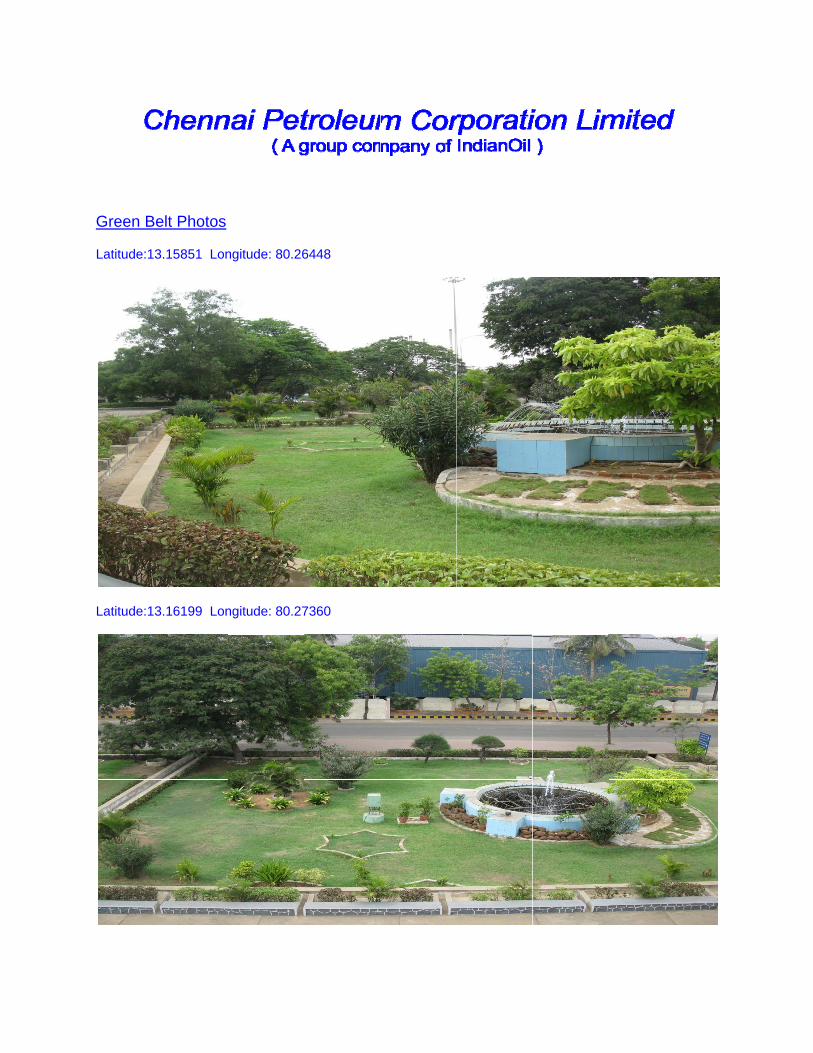
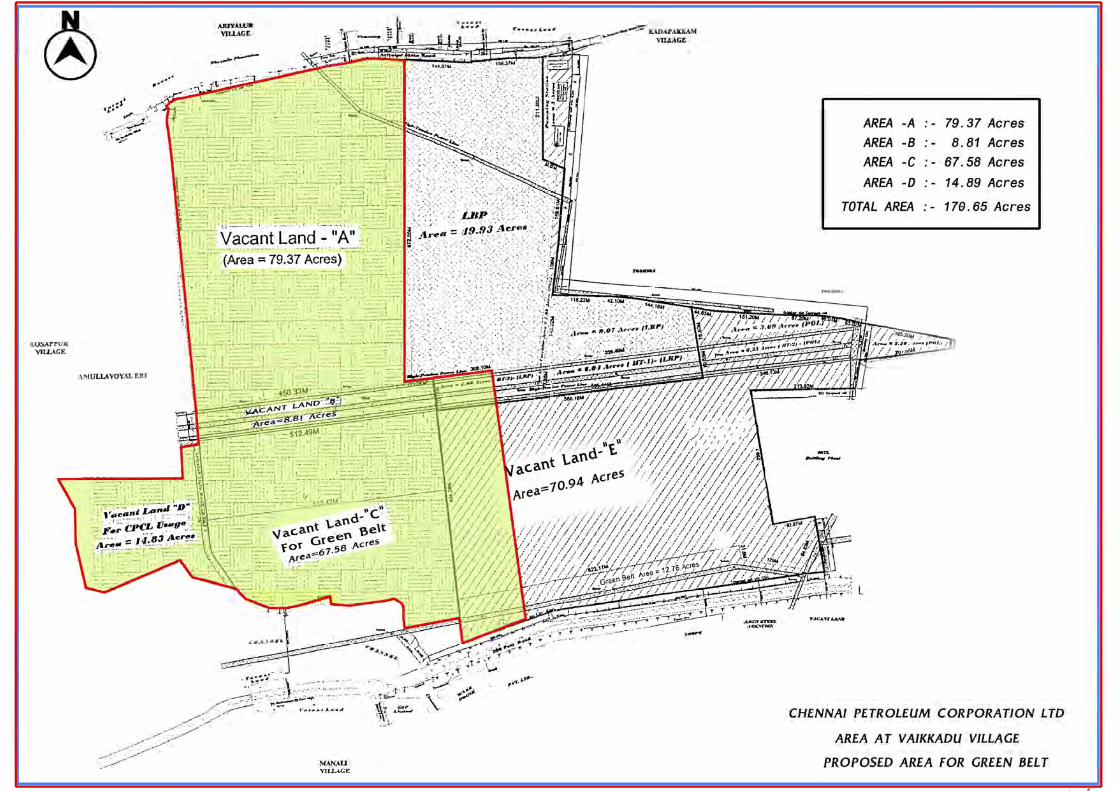
v. Green belt of at least 10 m shall be ensured in the periphery of the unit, wherever possible .PP shall ensure 33% of green cover with trees in the unit area and if area is deficient the green cover shall compensated with plantation in other designated area. As proposed, 50acre area purchased for green area shall be developed with perennial and native trees. The status of tree plantation & survival rate of plants in this committed area shall be reported to Ministry’s Regional office in six monthly compliance reports.
The Total land area of CPCL is 832 acres. The green belt area available in CPCL is 112 acres. It is proposed to develop addtional Green Belt outside CPCL Refinery premises , in CPCL Amullavoyal area which is about 3.5 kms from CPCL. A topo sketch indicating the area of the proposed green belt development in ammulavoyal area and existing Green belt photos are attached as Annexure-1.
In this regard discussions were held with Tamil Nadu Forest Department (TNFD) and the TNFD officials visited the Ammulavoyal area and submitted their budgetary offer for the same.The budgetary offer from other agencies is
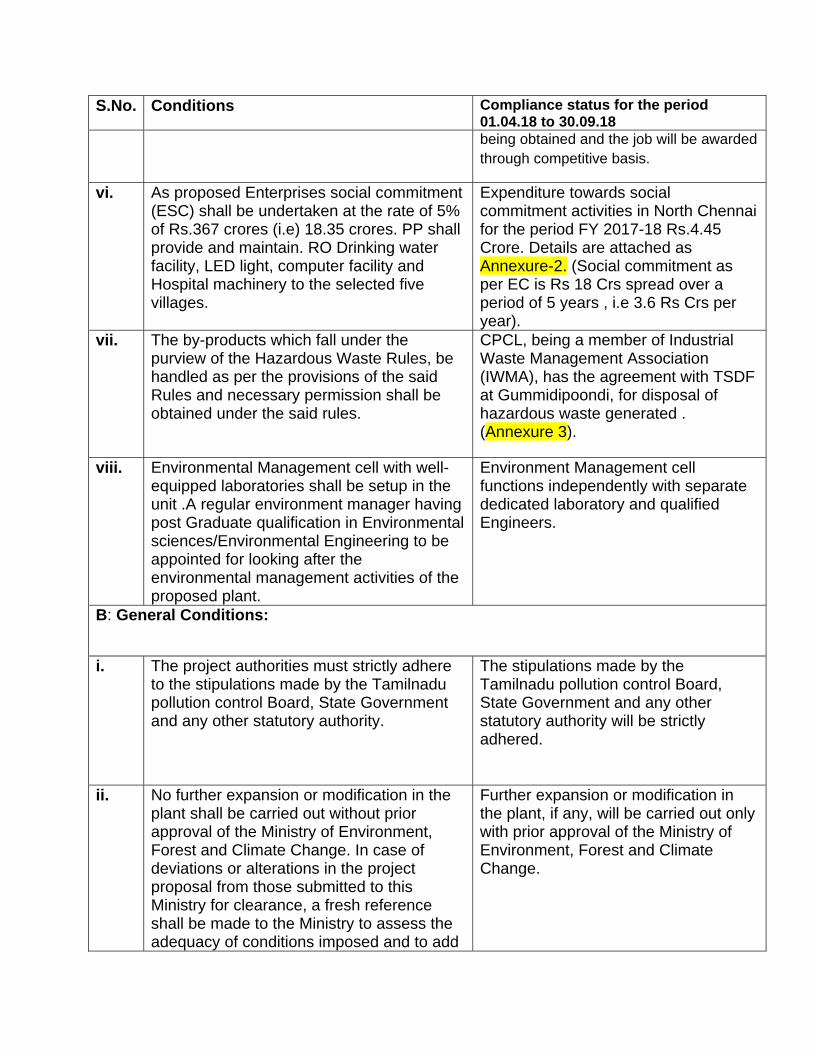
S.No. Conditions Compliance status for the period 01.04.18 to 30.09.18 being obtained and the job will be awarded through competitive basis.
vi. As proposed Enterprises social commitment (ESC) shall be undertaken at the rate of 5% of Rs.367 crores (i.e) 18.35 crores. PP shall provide and maintain. RO Drinking water facility, LED light, computer facility and Hospital machinery to the selected five villages.
Expenditure towards social commitment activities in North Chennai for the period FY 2017-18 Rs.4.45 Crore. Details are attached as Annexure-2. (Social commitment as per EC is Rs 18 Crs spread over a period of 5 years , i.e 3.6 Rs Crs per year).
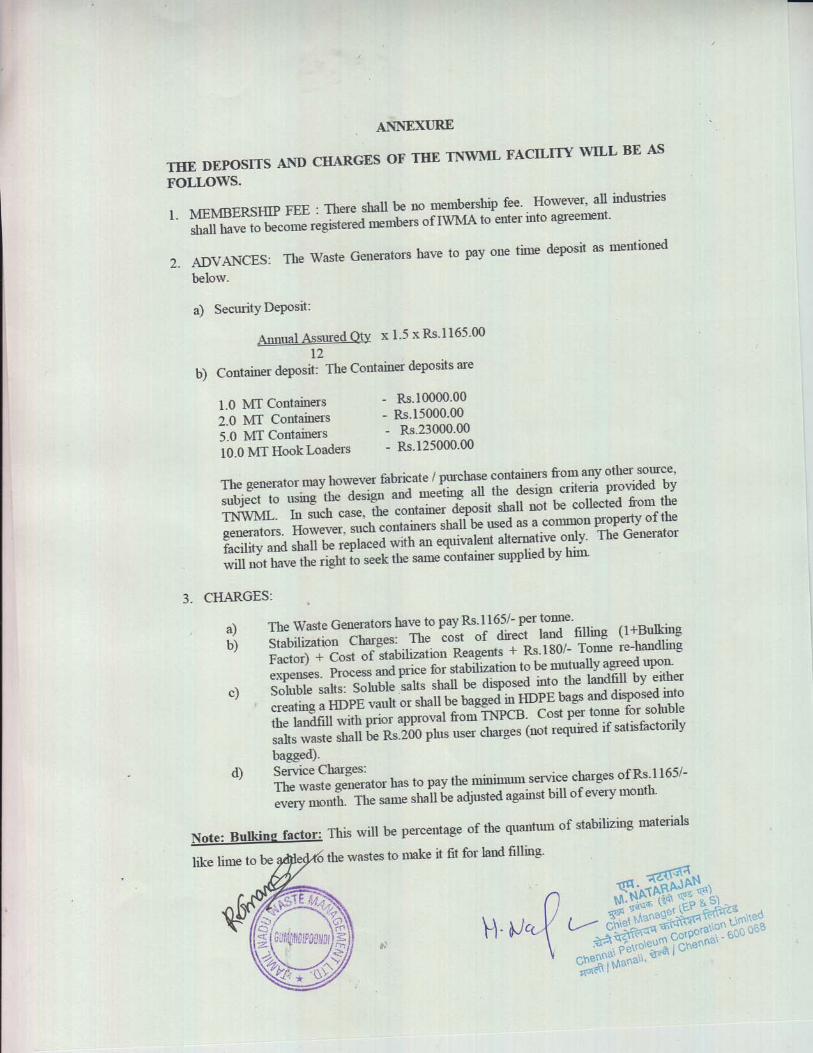
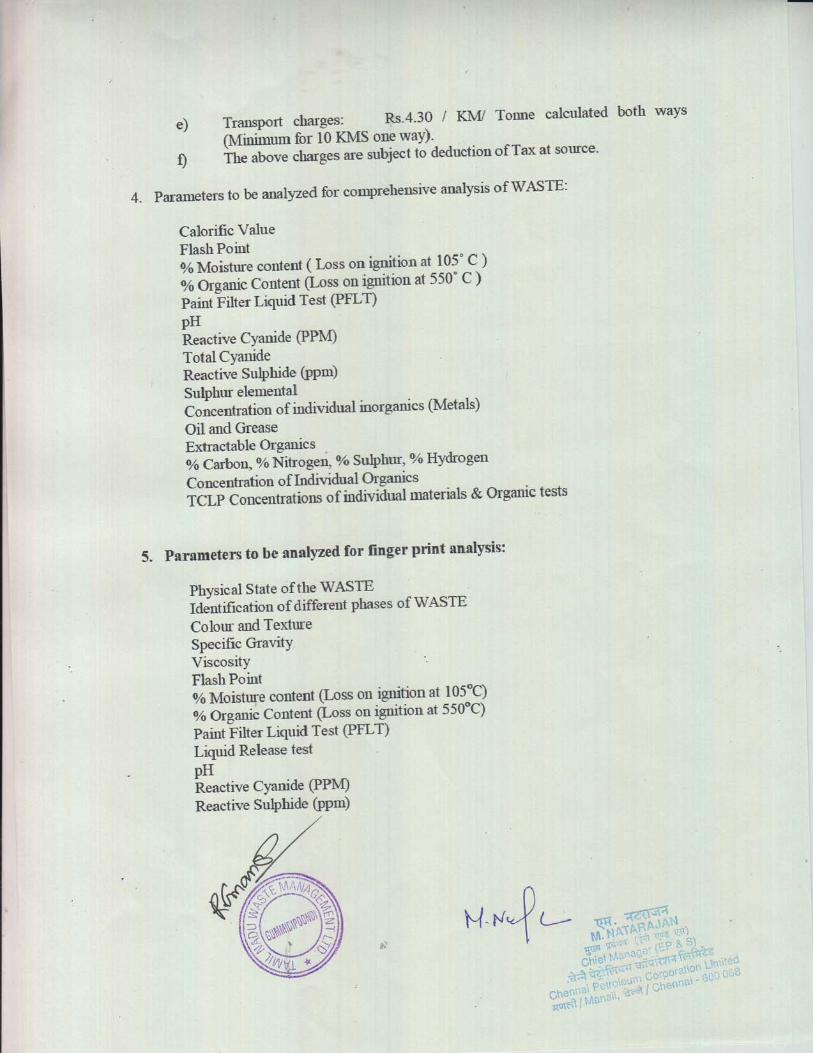
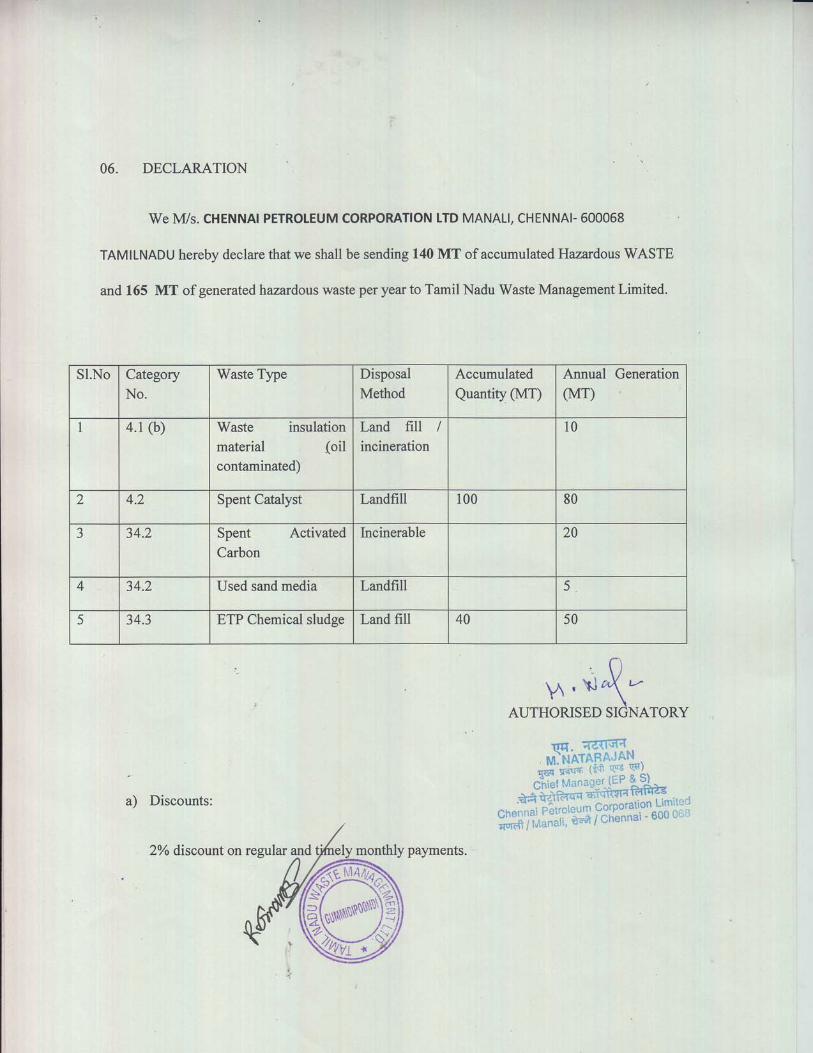
vii. The by-products which fall under the purview of the Hazardous Waste Rules, be handled as per the provisions of the said Rules and necessary permission shall be obtained under the said rules.
CPCL, being a member of Industrial Waste Management Association (IWMA), has the agreement with TSDF at Gummidipoondi, for disposal of hazardous waste generated . (Annexure 3).
viii. Environmental Management cell with well-equipped laboratories shall be setup in the unit .A regular environment manager having post Graduate qualification in Environmental sciences/Environmental Engineering to be appointed for looking after the environmental management activities of the proposed plant.
Environment Management cell functions independently with separate dedicated laboratory and qualified Engineers.
B: General Conditions:
i. The project authorities must strictly adhere to the stipulations made by the Tamilnadu pollution control Board, State Government and any other statutory authority.
The stipulations made by the Tamilnadu pollution control Board, State Government and any other statutory authority will be strictly adhered.
ii. No further expansion or modification in the plant shall be carried out without prior approval of the Ministry of Environment, Forest and Climate Change. In case of deviations or alterations in the project proposal from those submitted to this Ministry for clearance, a fresh reference shall be made to the Ministry to assess the adequacy of conditions imposed and to add
Further expansion or modification in the plant, if any, will be carried out only with prior approval of the Ministry of Environment, Forest and Climate Change.
S.No. Conditions Compliance status for the period 01.04.18 to 30.09.18
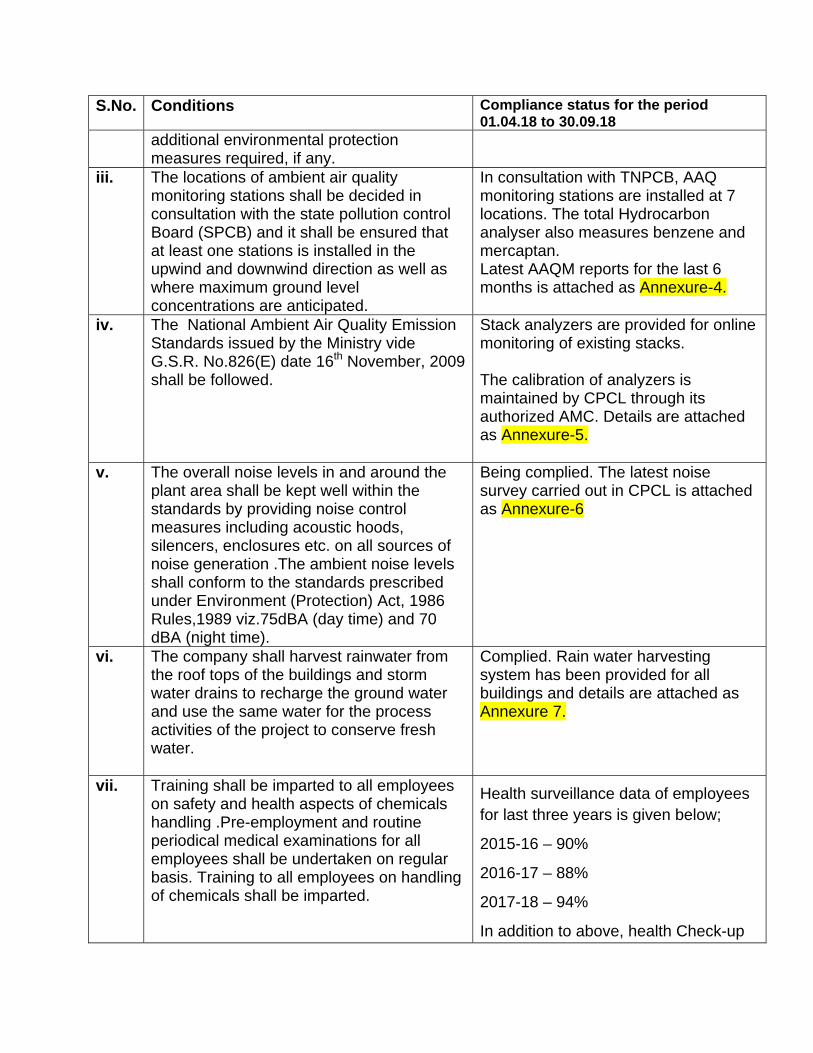
additional environmental protection measures required, if any.
iii. The locations of ambient air quality monitoring stations shall be decided in consultation with the state pollution control Board (SPCB) and it shall be ensured that at least one stations is installed in the upwind and downwind direction as well as where maximum ground level concentrations are anticipated.
In consultation with TNPCB, AAQ monitoring stations are installed at 7 locations. The total Hydrocarbon analyser also measures benzene and mercaptan. Latest AAQM reports for the last 6 months is attached as Annexure-4.
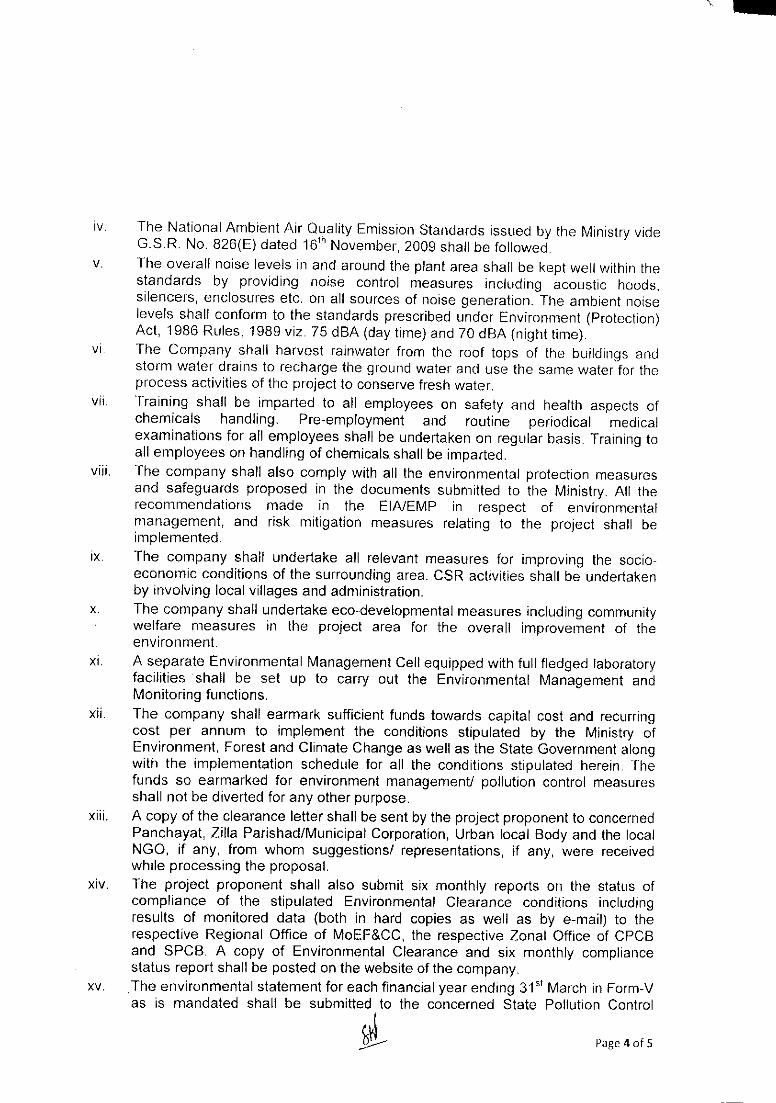
iv. The National Ambient Air Quality Emission Standards issued by the Ministry vide G.S.R. No.826(E) date 16th November, 2009 shall be followed.
Stack analyzers are provided for online monitoring of existing stacks. The calibration of analyzers is maintained by CPCL through its authorized AMC. Details are attached as Annexure-5.
v. The overall noise levels in and around the plant area shall be kept well within the standards by providing noise control measures including acoustic hoods, silencers, enclosures etc. on all sources of noise generation .The ambient noise levels shall conform to the standards prescribed under Environment (Protection) Act, 1986 Rules,1989 viz.75dBA (day time) and 70 dBA (night time).
Being complied. The latest noise survey carried out in CPCL is attached as Annexure-6
vi. The company shall harvest rainwater from the roof tops of the buildings and storm water drains to recharge the ground water and use the same water for the process activities of the project to conserve fresh water.
Complied. Rain water harvesting system has been provided for all buildings and details are attached as Annexure 7.
vii. Training shall be imparted to all employees on safety and health aspects of chemicals handling .Pre-employment and routine periodical medical examinations for all employees shall be undertaken on regular basis. Training to all employees on handling of chemicals shall be imparted.
Health surveillance data of employees for last three years is given below;
2015-16 – 90%
2016-17 – 88%
2017-18 – 94%
In addition to above, health Check-up
S.No. Conditions Compliance status for the period 01.04.18 to 30.09.18 of CISF employees, contract Workers is also being taken up.
viii. The company shall also comply with all the environmental protection measures and safeguards proposed in the documents submitted to the Ministry. All the recommendation made in the EIA/EMP in respect of environmental management, and risk mitigation measures relating to the project shall be implemented.
All the recommendations made in the EIA/EMP in respect of environmental management, and risk mitigation measures relating to the project have been implemented.
ix. The company shall undertake all relevant measures for improving the socio-economic conditions of the surrounding area.CSR activities shall be undertaken by involving local villages and administration.
Adequate funds are being earmarked in revenue budget for improving the socio-economic conditions of the surrounding area. Year-wise expenditure of CSR activities for last three years is given below Year Rs. lakhs 2015-16 - 133.02 2016-17 - 187.51 2017-18 - 918.18 Apr-Sep 2018 - 590.24
x. The company shall undertake eco-developmental measures including community welfare measures in the project area for the overall improvement of the environment.
Noted for compliance.
xi. A Separate Environmental management Cell equipped with full fledged laboratory facilities shall be set up to carry out the Environmental Management and Monitoring functions.
Environment Management cell functions independently with separate dedicated laboratory and qualified Engineers.
xii. The company shall earmark sufficient funds towards capital cost and recurring cost per annum to implement the conditions stipulated by the ministry of Environment ,Forest and climate change as well as the state Government along with the implementation schedule for all the conditions stipulated herein .The funds so earmarked for environment management /pollution control measures shall not be diverted for any other purpose .
As per CPCL policy , the funds earmarked for particular activity cannot be diverted for any other purpose . Thus the funds so earmarked for environment management /pollution control measures will not be diverted for any other purpose . The details of capital expenditure for the past years
S.No. Conditions Compliance status for the period 01.04.18 to 30.09.18 are as under:
2008: Rs 240.00 Crore – for Sea water desalination
2009: Rs 25.00 Crore for energy conservation
2010: Rs 40.00 Crore -ETP -2 augmentation
2011: Rs 20.00 Crore closed tanks for ETP
2012:Rs 20.00 Crore : AAQM data linking/Energy Conservation
2013: Rs 25.00 Crore : VOC collection & removal system in ETP-2, SRP-1 revamp, AAQM/CSM connectivity
2015: For ETP4 which is under commissioning at an estimated cost of Rs 220 Crore.
2016: Rs.12.50 Crore : For commissioning SO2,NOx,PM & CO analysers for 19 stacks/ Effluent analysers in 2 locations
Apart from the above every year around Rs 5.00 crore is spent on operation and Maintenance of ETP facilities.
xiii. A copy of the clearance letter shall be sent by the project proponent to concerned panchayat, Zilla Parishad /Municipal Corporation ,Urban local Body and the local NGO if any ,from whom suggestions /representations ,if any were received while processing the proposal.
Being followed.
Xiv The project proponent shall also submit six monthly reports on the status of compliance of the stipulated Environmental Clearance
Being followed. The latest Six monthly compliance was sent on 15.05.18.
S.No. Conditions Compliance status for the period 01.04.18 to 30.09.18
conditions including results of monitored data (both in hard copies as well as by e-mail) to the respective Regional office of MoEF&CC , the respective Zonal office of CPCB and SPCB .A copy of Environmental Clearance and six monthly compliance status report shall be posted on the website of the company.
xv The environmental statement for each financial year ending 31st March in Form-V as is mandated shall be submitted to the concerned state pollution control Board as prescribed under the Environment (Protection) Rules, 1986,as amended subsequently ,shall also be put on the website of the company along with the status of compliance of environmental clearance conditions and shall also be sent to the respective Regional offices of MoEF&CC by e-mail.
Form V is being submitted to TNPCB, CPCB, MoEF&CC and CHT on a regular basis. Latest Form V submitted is attached as Annexure-8
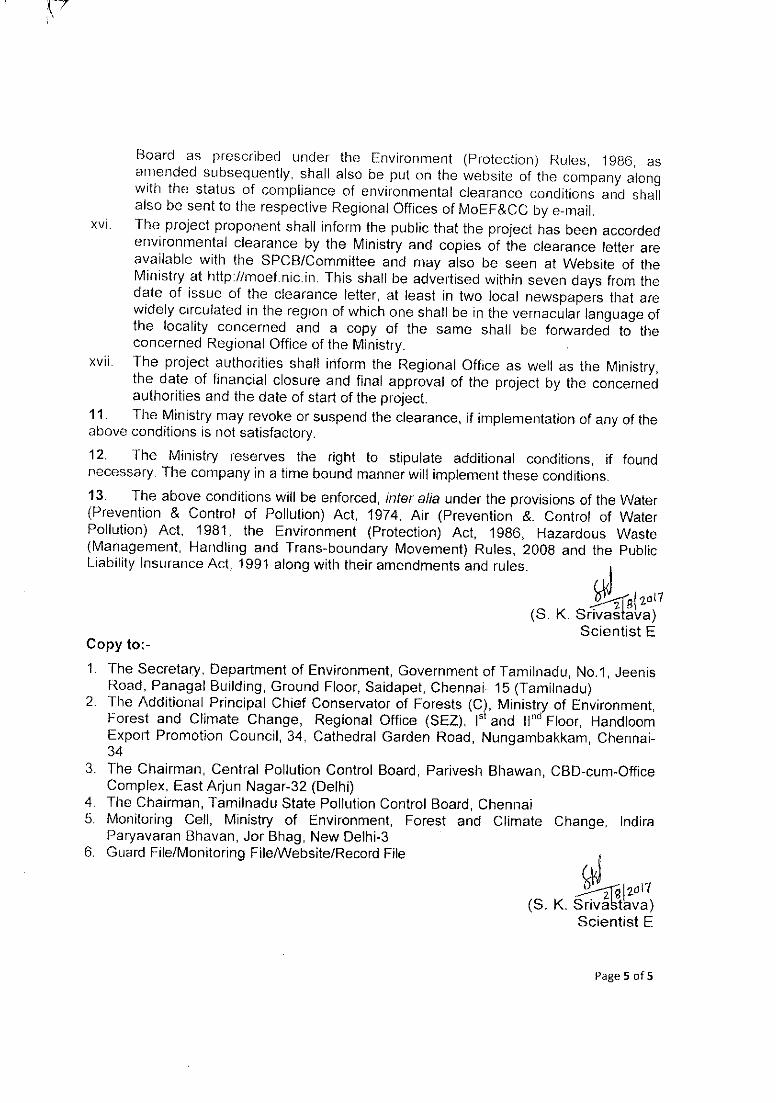
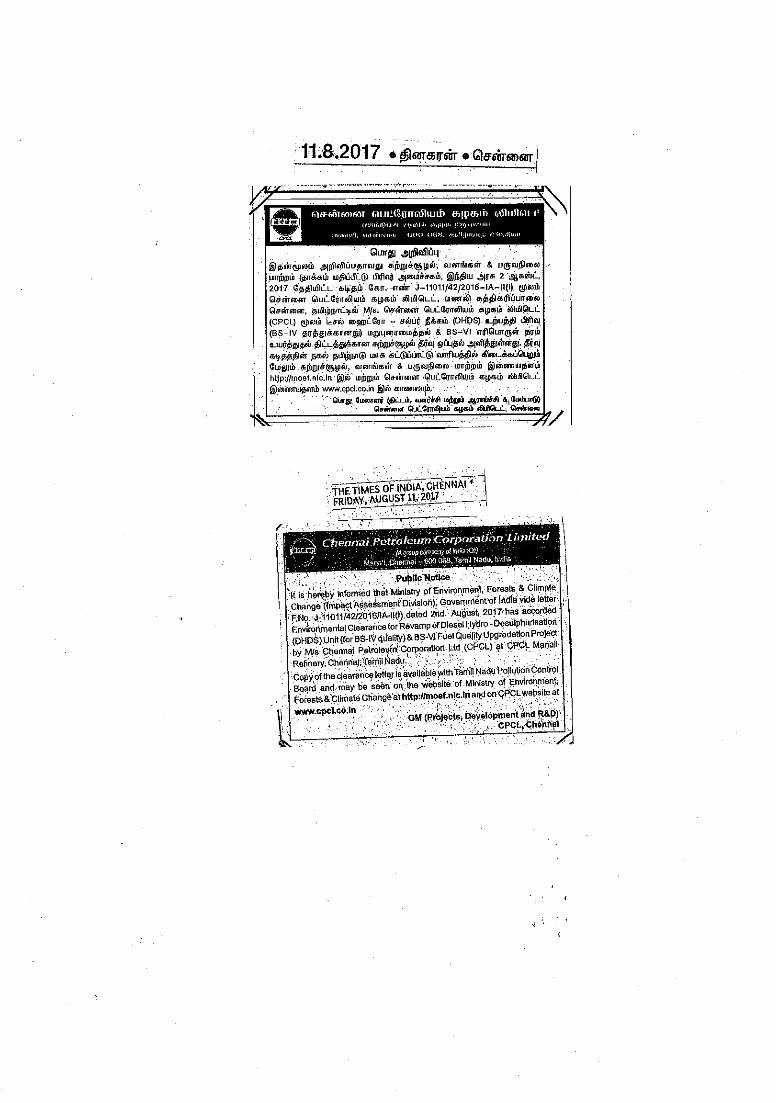
Xvi The project proponent shall inform the public that the project has been accorded environmental clearance by the Ministry and copies of the clearance letter are available with the SPCB/ Committee and may also be seen at Website of the Ministry at http://moef.nic.in This shall be advertised within seven days from the date of issue of the clearance letter, at least in two local newspaper that are Widely circulated in the region of which one shall be in the vernacular language of the locality concerned and a copy of the same shall be forwarded to the concerned Regional office of the Ministry.
Complied and copies were sent to Regional office.(Annexure-9)
xvii The project authorities shall inform the Regional office as well as the Ministry the date of financial closure and final approval of the project by the concerned authorities and the date of start of the project.
Investment Approval of Board for DHDS Revamp Project was obtained in 11.02.2016. & for BS-VI Fuel Quality Upgradation Project was obtained in 22.09.2017 . Date of Financial closure will be intimated after the completion of the same.
Green B
Latitude:1
Latitude:1
Belt Photos
3.15851 Lon
3.16199 Lon
ngitude: 80.26
ngitude: 80.27
6448
7360
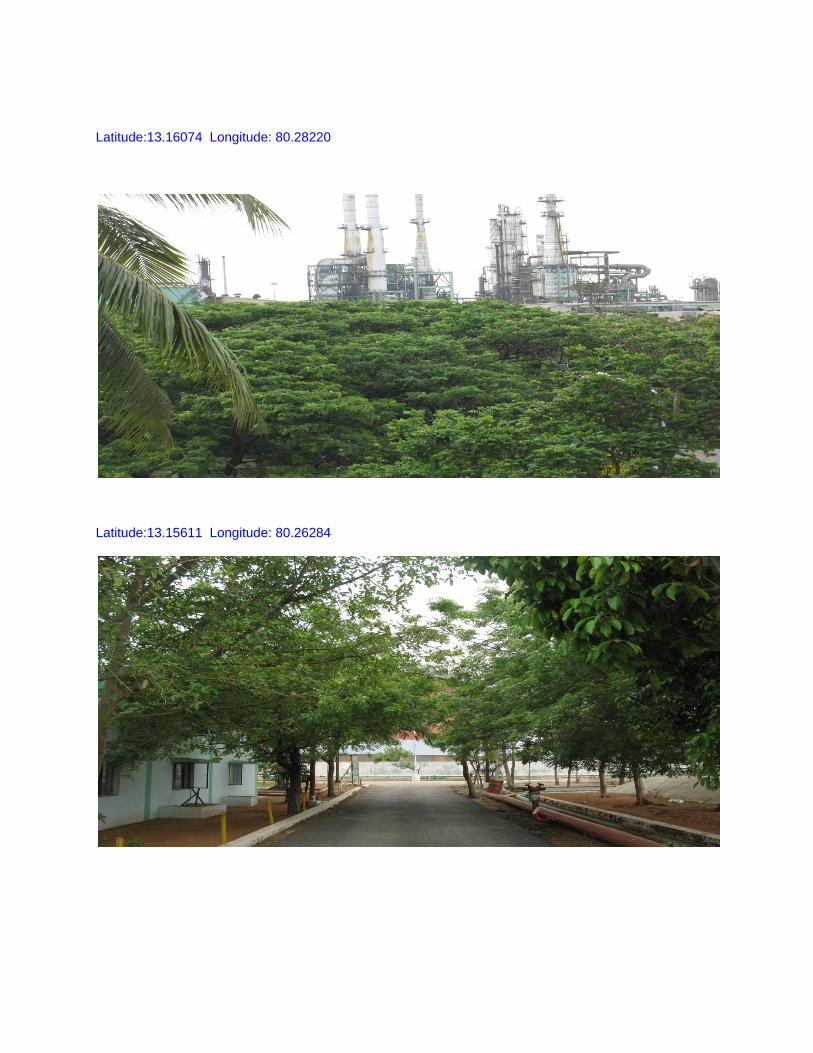
Latitude:13.16074 Longitude: 80.28220
Latitude:13.15611 Longitude: 80.26284
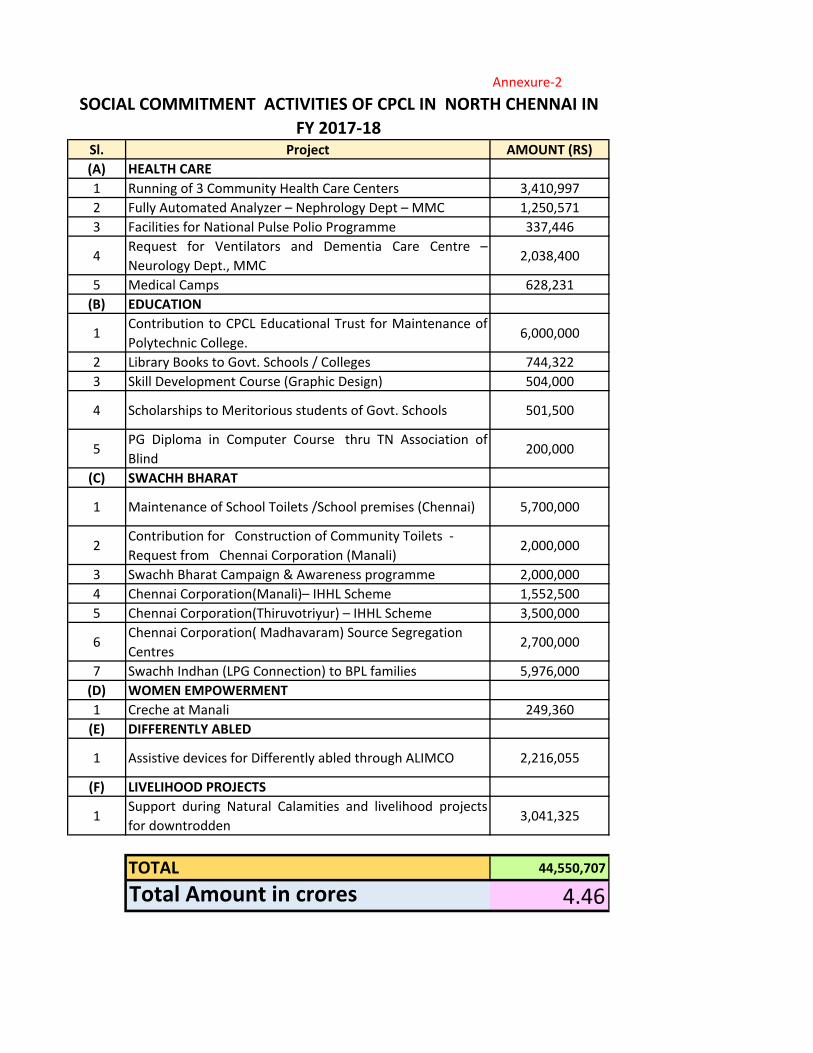
Annexure‐2
Sl. Project AMOUNT (RS)
(A) HEALTH CARE
1 Running of 3 Community Health Care Centers 3,410,997
2 Fully Automated Analyzer – Nephrology Dept – MMC 1,250,571
3 Facilities for National Pulse Polio Programme 337,446
4Request for Ventilators and Dementia Care Centre –
Neurology Dept., MMC 2,038,400
5 Medical Camps 628,231
(B) EDUCATION
1Contribution to CPCL Educational Trust for Maintenance of
Polytechnic College. 6,000,000
2 Library Books to Govt. Schools / Colleges 744,322
3 Skill Development Course (Graphic Design) 504,000
4 Scholarships to Meritorious students of Govt. Schools 501,500
5PG Diploma in Computer Course thru TN Association of
Blind 200,000
(C) SWACHH BHARAT
1 Maintenance of School Toilets /School premises (Chennai) 5,700,000
2Contribution for Construction of Community Toilets ‐
Request from Chennai Corporation (Manali)2,000,000
3 Swachh Bharat Campaign & Awareness programme 2,000,000
4 Chennai Corporation(Manali)– IHHL Scheme 1,552,500
5 Chennai Corporation(Thiruvotriyur) – IHHL Scheme 3,500,000
6Chennai Corporation( Madhavaram) Source Segregation
Centres 2,700,000
7 Swachh Indhan (LPG Connection) to BPL families 5,976,000
(D) WOMEN EMPOWERMENT
1 Creche at Manali 249,360
(E) DIFFERENTLY ABLED
1 Assistive devices for Differently abled through ALIMCO 2,216,055
(F) LIVELIHOOD PROJECTS
1Support during Natural Calamities and livelihood projects
for downtrodden 3,041,325
TOTAL 44,550,707
Total Amount in crores 4.46
SOCIAL COMMITMENT ACTIVITIES OF CPCL IN NORTH CHENNAI IN
FY 2017‐18
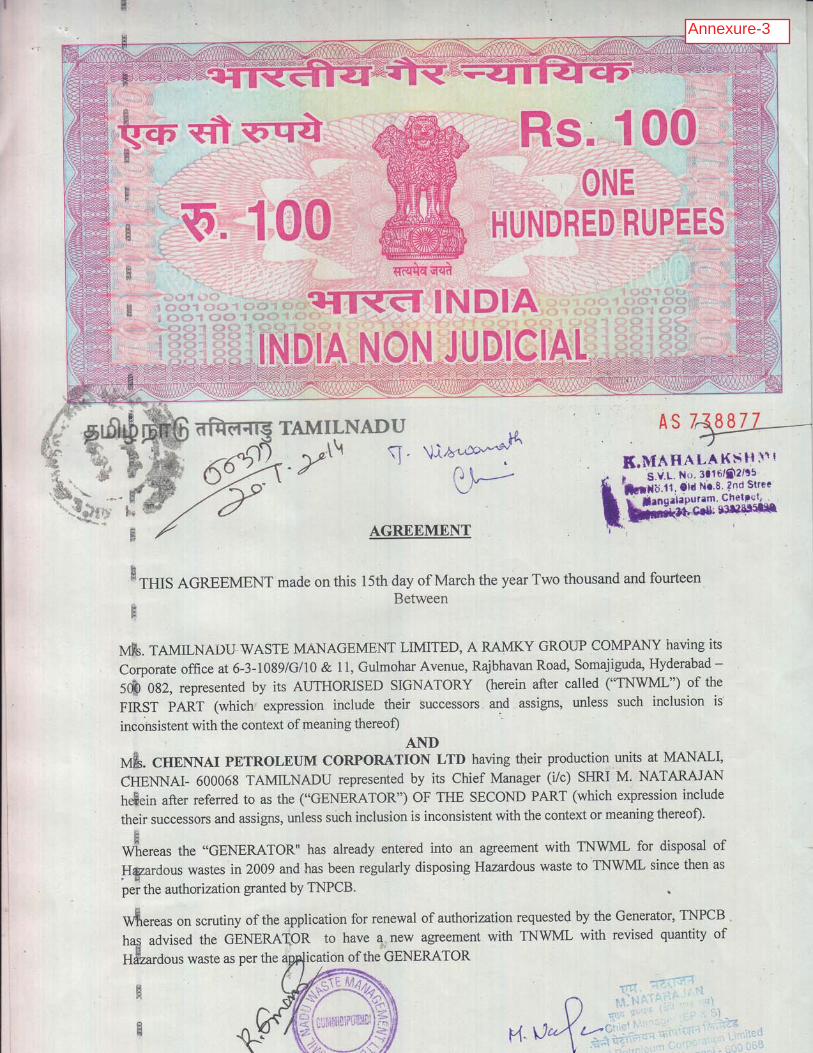
Annexure-3
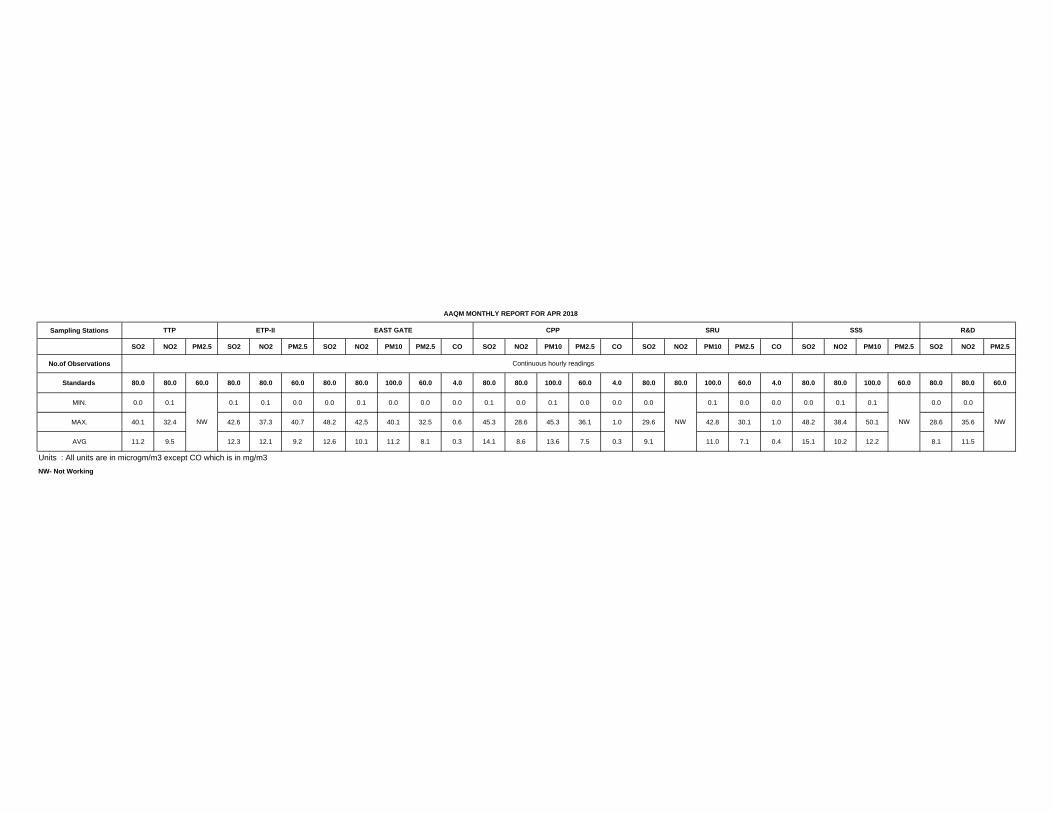
Sampling Stations
SO2 NO2 PM2.5 SO2 NO2 PM2.5 SO2 NO2 PM10 PM2.5 CO SO2 NO2 PM10 PM2.5 CO SO2 NO2 PM10 PM2.5 CO SO2 NO2 PM10 PM2.5 SO2 NO2 PM2.5
No.of Observations
Standards 80.0 80.0 60.0 80.0 80.0 60.0 80.0 80.0 100.0 60.0 4.0 80.0 80.0 100.0 60.0 4.0 80.0 80.0 100.0 60.0 4.0 80.0 80.0 100.0 60.0 80.0 80.0 60.0
MIN. 0.0 0.1 0.1 0.1 0.0 0.0 0.1 0.0 0.0 0.0 0.1 0.0 0.1 0.0 0.0 0.0 0.1 0.0 0.0 0.0 0.1 0.1 0.0 0.0
MAX. 40.1 32.4 42.6 37.3 40.7 48.2 42.5 40.1 32.5 0.6 45.3 28.6 45.3 36.1 1.0 29.6 42.8 30.1 1.0 48.2 38.4 50.1 28.6 35.6
AVG 11.2 9.5 12.3 12.1 9.2 12.6 10.1 11.2 8.1 0.3 14.1 8.6 13.6 7.5 0.3 9.1 11.0 7.1 0.4 15.1 10.2 12.2 8.1 11.5
NW- Not Working
AAQM MONTHLY REPORT FOR APR 2018
EAST GATE CPP SRU SS5ETP-II TTP R&D
NWNW NW
Units : All units are in microgm/m3 except CO which is in mg/m3
Continuous hourly readings
NW
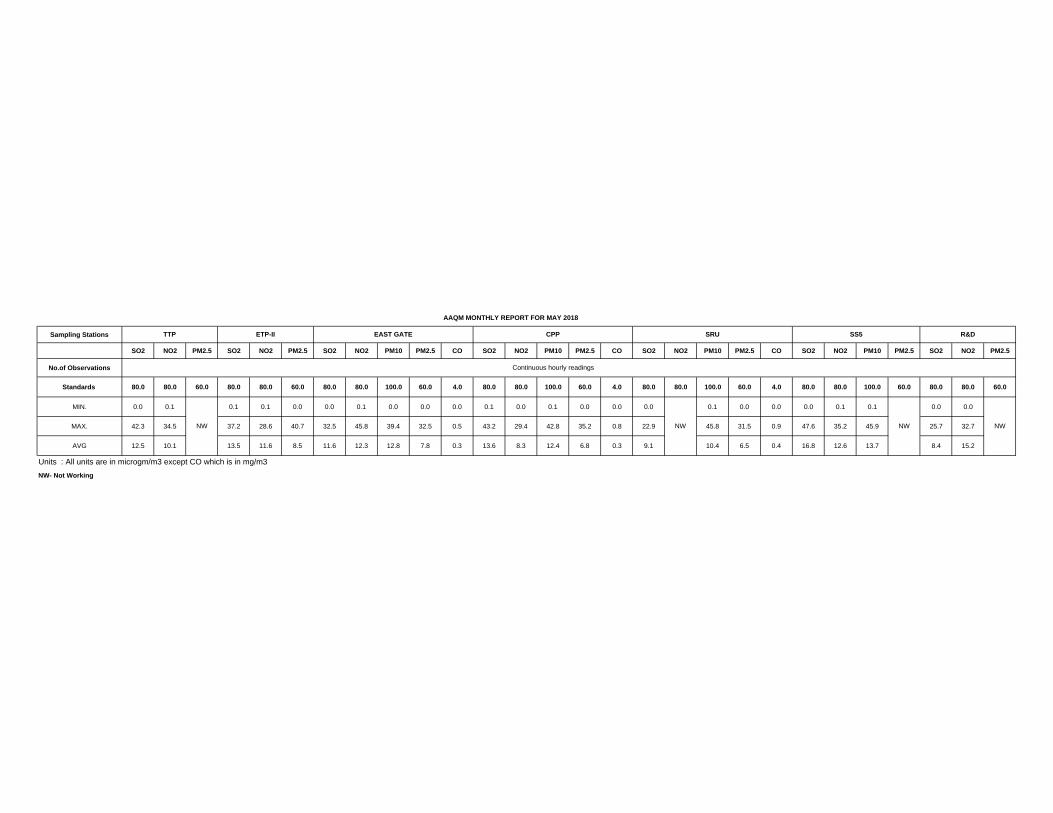
Sampling Stations
SO2 NO2 PM2.5 SO2 NO2 PM2.5 SO2 NO2 PM10 PM2.5 CO SO2 NO2 PM10 PM2.5 CO SO2 NO2 PM10 PM2.5 CO SO2 NO2 PM10 PM2.5 SO2 NO2 PM2.5
No.of Observations
Standards 80.0 80.0 60.0 80.0 80.0 60.0 80.0 80.0 100.0 60.0 4.0 80.0 80.0 100.0 60.0 4.0 80.0 80.0 100.0 60.0 4.0 80.0 80.0 100.0 60.0 80.0 80.0 60.0
MIN. 0.0 0.1 0.1 0.1 0.0 0.0 0.1 0.0 0.0 0.0 0.1 0.0 0.1 0.0 0.0 0.0 0.1 0.0 0.0 0.0 0.1 0.1 0.0 0.0
MAX. 42.3 34.5 37.2 28.6 40.7 32.5 45.8 39.4 32.5 0.5 43.2 29.4 42.8 35.2 0.8 22.9 45.8 31.5 0.9 47.6 35.2 45.9 25.7 32.7
AVG 12.5 10.1 13.5 11.6 8.5 11.6 12.3 12.8 7.8 0.3 13.6 8.3 12.4 6.8 0.3 9.1 10.4 6.5 0.4 16.8 12.6 13.7 8.4 15.2
NW- Not Working
Units : All units are in microgm/m3 except CO which is in mg/m3
AAQM MONTHLY REPORT FOR MAY 2018
TTP ETP-II EAST GATE CPP SRU SS5 R&D
Continuous hourly readings
NW NW NW NW
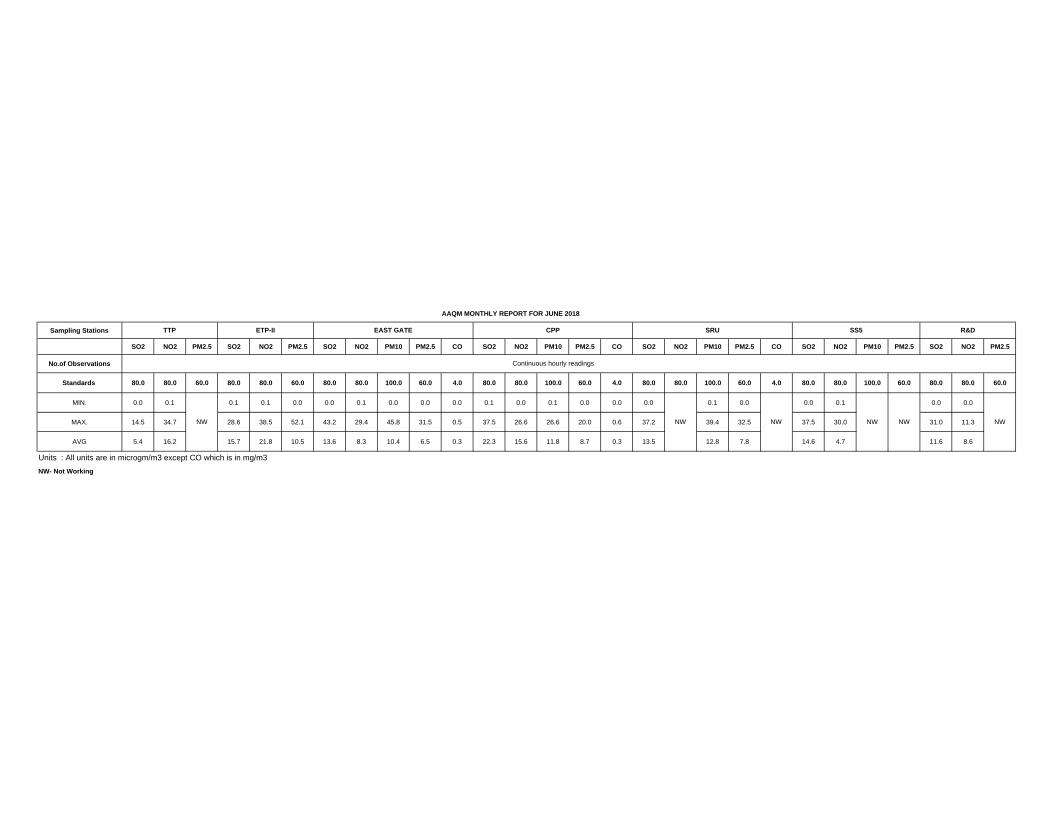
Sampling Stations
SO2 NO2 PM2.5 SO2 NO2 PM2.5 SO2 NO2 PM10 PM2.5 CO SO2 NO2 PM10 PM2.5 CO SO2 NO2 PM10 PM2.5 CO SO2 NO2 PM10 PM2.5 SO2 NO2 PM2.5
No.of Observations
Standards 80.0 80.0 60.0 80.0 80.0 60.0 80.0 80.0 100.0 60.0 4.0 80.0 80.0 100.0 60.0 4.0 80.0 80.0 100.0 60.0 4.0 80.0 80.0 100.0 60.0 80.0 80.0 60.0
MIN. 0.0 0.1 0.1 0.1 0.0 0.0 0.1 0.0 0.0 0.0 0.1 0.0 0.1 0.0 0.0 0.0 0.1 0.0 0.0 0.1 0.0 0.0
MAX. 14.5 34.7 28.6 38.5 52.1 43.2 29.4 45.8 31.5 0.5 37.5 26.6 26.6 20.0 0.6 37.2 39.4 32.5 37.5 30.0 31.0 11.3
AVG 5.4 16.2 15.7 21.8 10.5 13.6 8.3 10.4 6.5 0.3 22.3 15.6 11.8 8.7 0.3 13.5 12.8 7.8 14.6 4.7 11.6 8.6
NW- Not Working
NWNW
Units : All units are in microgm/m3 except CO which is in mg/m3
AAQM MONTHLY REPORT FOR JUNE 2018
TTP ETP-II EAST GATE CPP SRU SS5 R&D
Continuous hourly readings
NW NW NW NW

Sampling Stations
SO2 NO2 PM2.5 SO2 NO2 PM2.5 SO2 NO2 PM10 PM2.5 CO SO2 NO2 PM10 PM2.5 CO SO2 NO2 PM10 PM2.5 CO SO2 NO2 PM10 PM2.5 SO2 NO2 PM2.5
No.of Observations
Standards 80.0 80.0 60.0 80.0 80.0 60.0 80.0 80.0 100.0 60.0 4.0 80.0 80.0 100.0 60.0 4.0 80.0 80.0 100.0 60.0 4.0 80.0 80.0 100.0 60.0 80.0 80.0 60.0
MIN. 0.0 0.1 0.0 0.1 0.0 0.0 0.1 0.0 0.0 0.0 0.1 0.1 0.0 0.0 0.0 0.0 0.1 0.0 0.0 0.0 0.1 0.0 0.0
MAX. 29.9 23.6 36.9 30.0 35.5 36.6 30.4 16.2 32.7 0.3 18.7 29.6 17.8 0.3 37.2 32.9 32.5 25.6 0.2 35.3 41.9 28.7 34.9
AVG 15.8 16.5 16.4 18.8 19.6 22.7 16.4 24.2 16.4 0.2 18.9 17.5 17.8 0.2 15.7 20.0 12.8 7.8 0.2 18.7 16.4 16.9 19.4
NW- Not Working
NW
AAQM MONTHLY REPORT FOR JULY 2018
TTP ETP-II EAST GATE CPP SRU SS5 R&D
Units : All units are in microgm/m3 except CO which is in mg/m3
Continuous hourly readings
NW NW NW NW
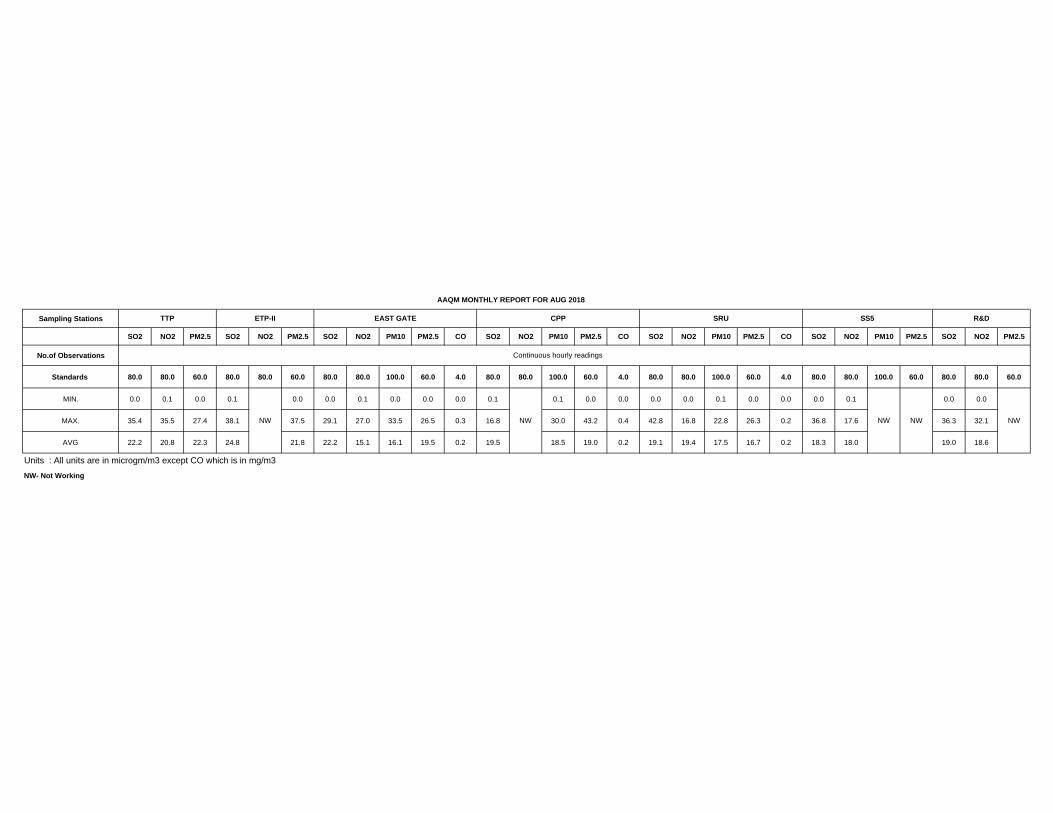
Sampling Stations
SO2 NO2 PM2.5 SO2 NO2 PM2.5 SO2 NO2 PM10 PM2.5 CO SO2 NO2 PM10 PM2.5 CO SO2 NO2 PM10 PM2.5 CO SO2 NO2 PM10 PM2.5 SO2 NO2 PM2.5
No.of Observations
Standards 80.0 80.0 60.0 80.0 80.0 60.0 80.0 80.0 100.0 60.0 4.0 80.0 80.0 100.0 60.0 4.0 80.0 80.0 100.0 60.0 4.0 80.0 80.0 100.0 60.0 80.0 80.0 60.0
MIN. 0.0 0.1 0.0 0.1 0.0 0.0 0.1 0.0 0.0 0.0 0.1 0.1 0.0 0.0 0.0 0.0 0.1 0.0 0.0 0.0 0.1 0.0 0.0
MAX. 35.4 35.5 27.4 38.1 37.5 29.1 27.0 33.5 26.5 0.3 16.8 30.0 43.2 0.4 42.8 16.8 22.8 26.3 0.2 36.8 17.6 36.3 32.1
AVG 22.2 20.8 22.3 24.8 21.8 22.2 15.1 16.1 19.5 0.2 19.5 18.5 19.0 0.2 19.1 19.4 17.5 16.7 0.2 18.3 18.0 19.0 18.6
NW- Not Working
NW
AAQM MONTHLY REPORT FOR AUG 2018
TTP ETP-II EAST GATE CPP SRU SS5 R&D
Units : All units are in microgm/m3 except CO which is in mg/m3
Continuous hourly readings
NW NW NW NW
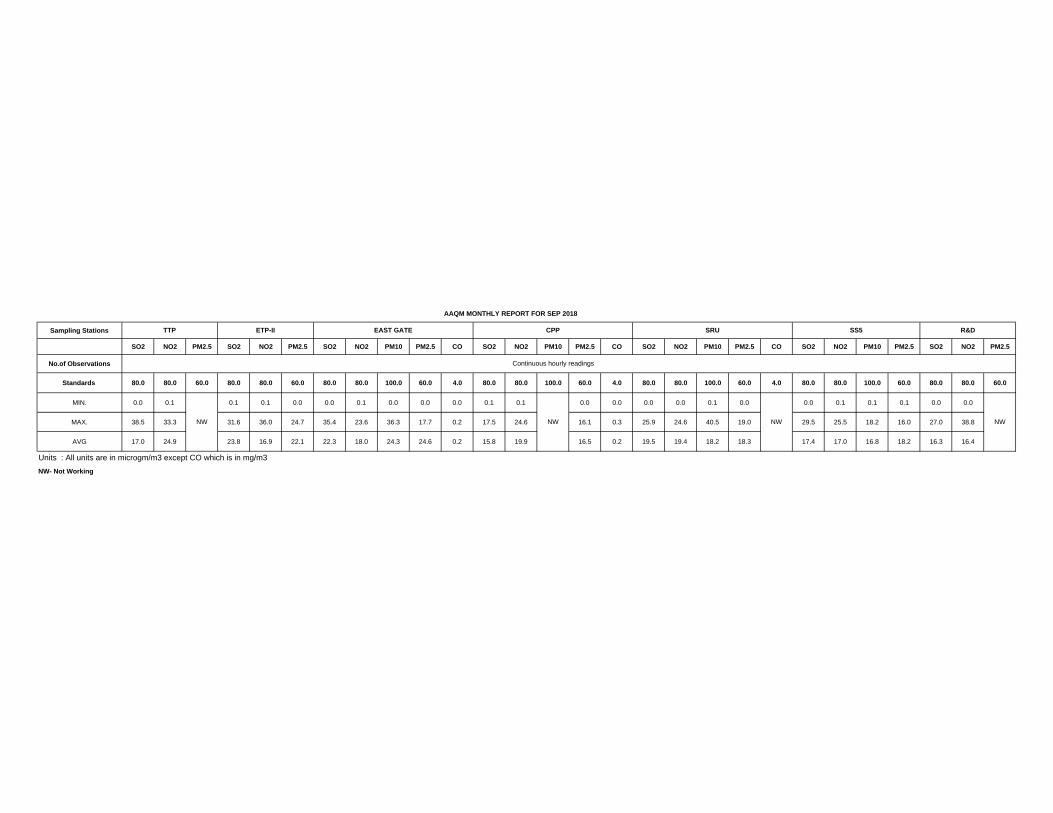
Sampling Stations
SO2 NO2 PM2.5 SO2 NO2 PM2.5 SO2 NO2 PM10 PM2.5 CO SO2 NO2 PM10 PM2.5 CO SO2 NO2 PM10 PM2.5 CO SO2 NO2 PM10 PM2.5 SO2 NO2 PM2.5
No.of Observations
Standards 80.0 80.0 60.0 80.0 80.0 60.0 80.0 80.0 100.0 60.0 4.0 80.0 80.0 100.0 60.0 4.0 80.0 80.0 100.0 60.0 4.0 80.0 80.0 100.0 60.0 80.0 80.0 60.0
MIN. 0.0 0.1 0.1 0.1 0.0 0.0 0.1 0.0 0.0 0.0 0.1 0.1 0.0 0.0 0.0 0.0 0.1 0.0 0.0 0.1 0.1 0.1 0.0 0.0
MAX. 38.5 33.3 31.6 36.0 24.7 35.4 23.6 36.3 17.7 0.2 17.5 24.6 16.1 0.3 25.9 24.6 40.5 19.0 29.5 25.5 18.2 16.0 27.0 38.8
AVG 17.0 24.9 23.8 16.9 22.1 22.3 18.0 24.3 24.6 0.2 15.8 19.9 16.5 0.2 19.5 19.4 18.2 18.3 17.4 17.0 16.8 18.2 16.3 16.4
NW- Not Working
Continuous hourly readings
NW
Units : All units are in microgm/m3 except CO which is in mg/m3
AAQM MONTHLY REPORT FOR SEP 2018
TTP ETP-II EAST GATE CPP SRU SS5 R&D
NW NWNW
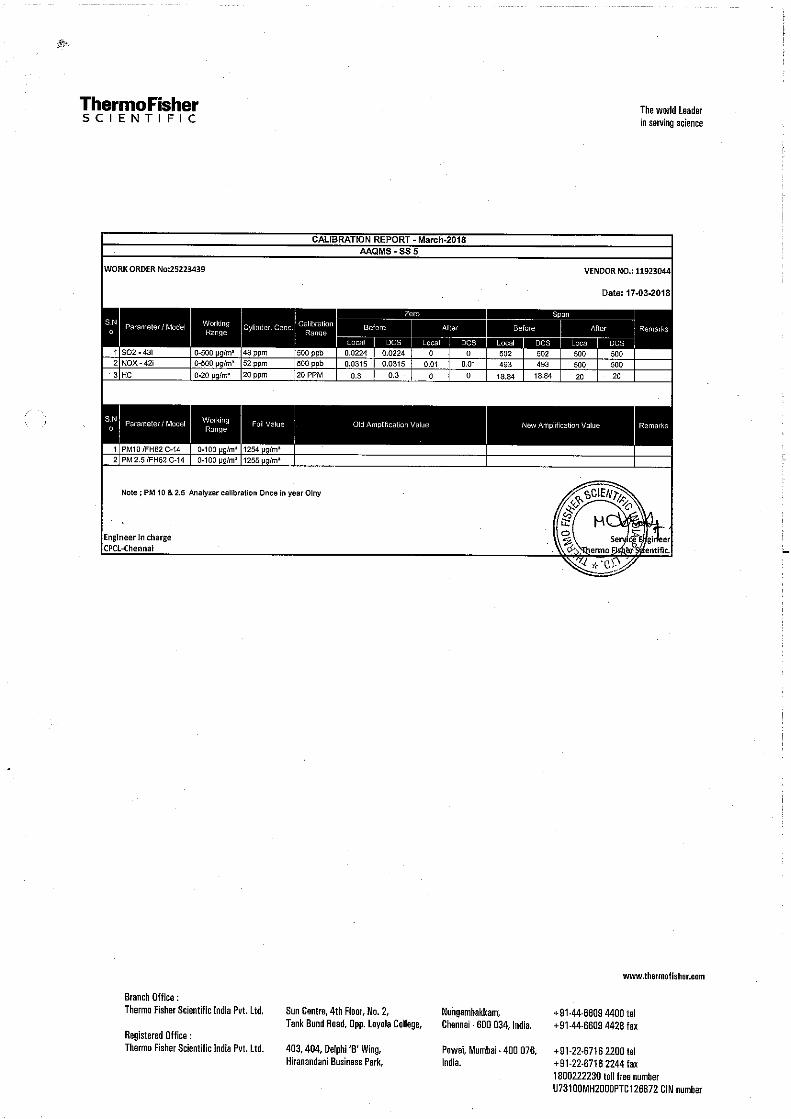
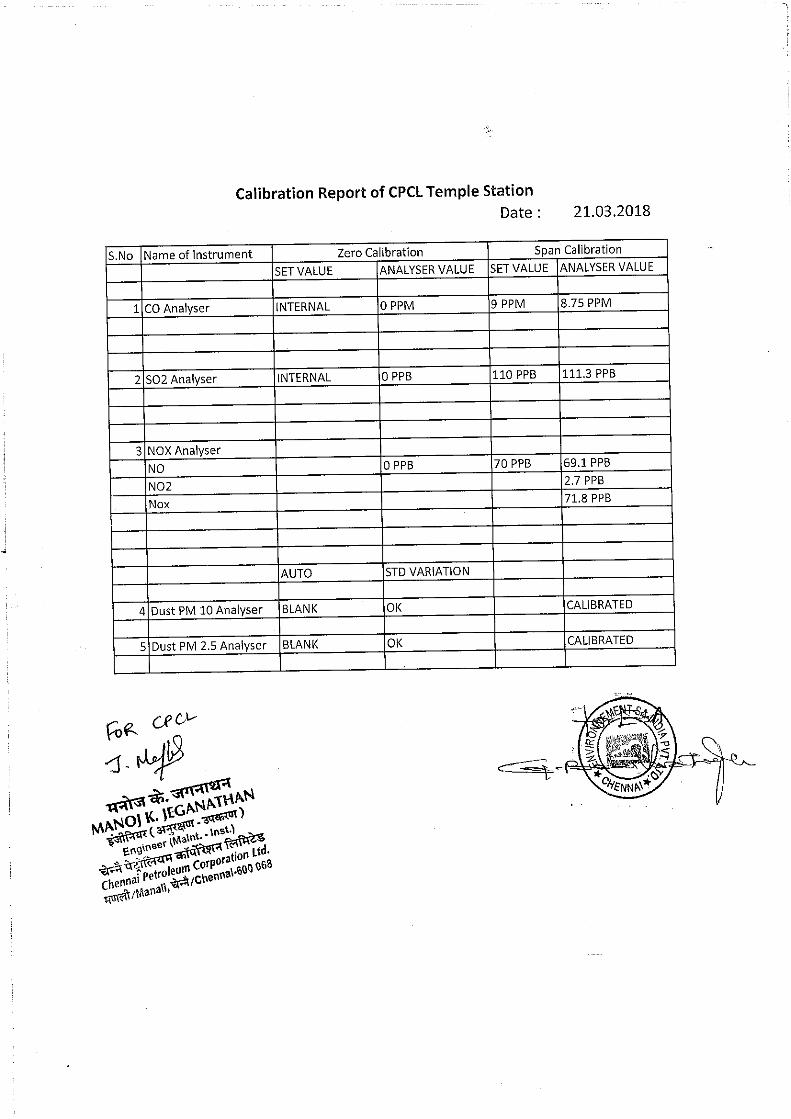
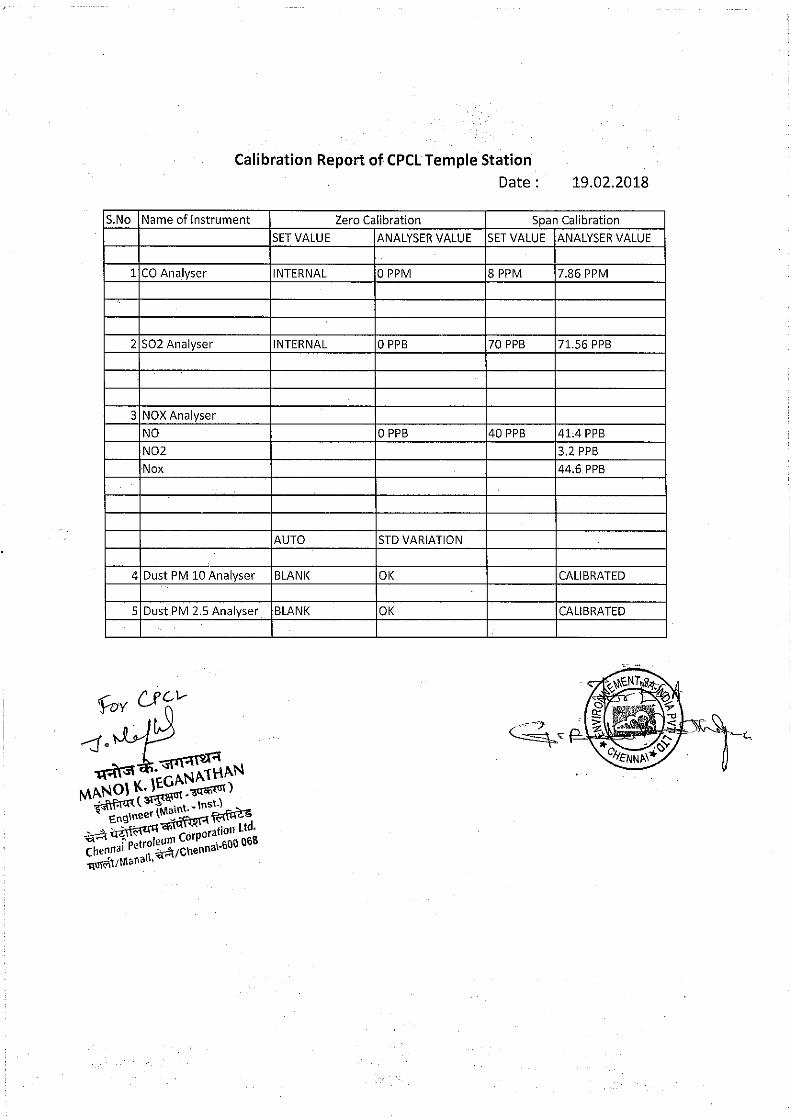
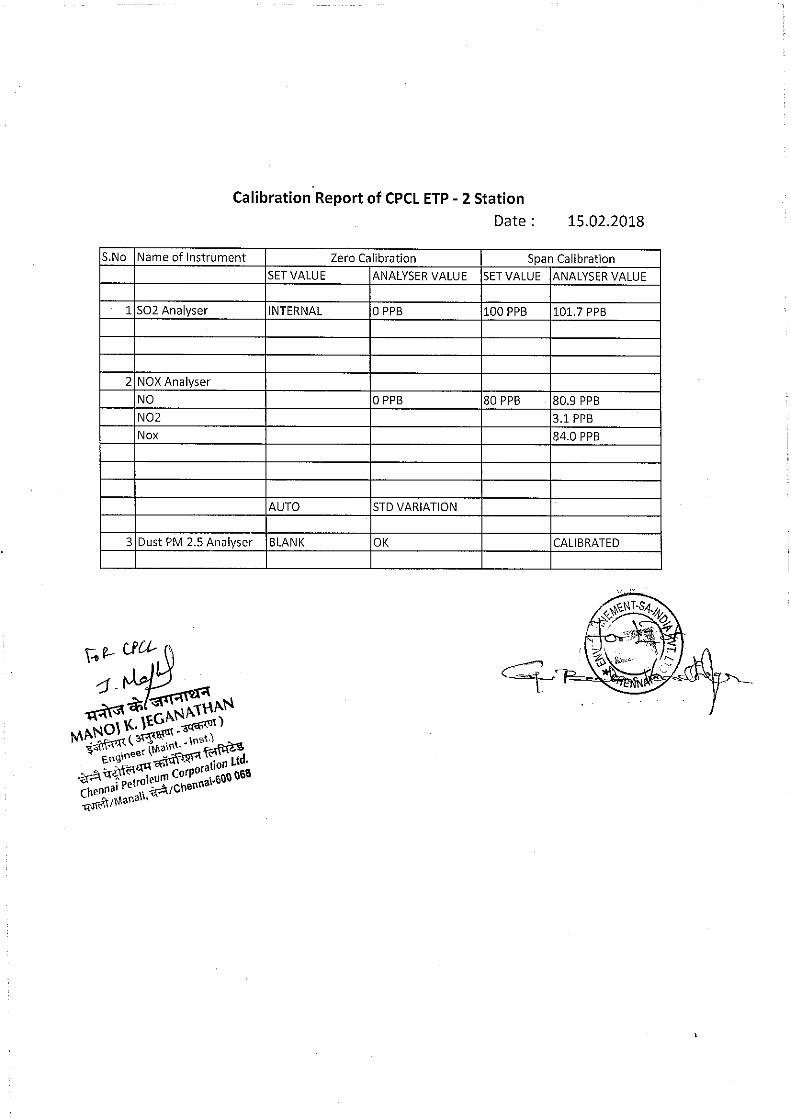
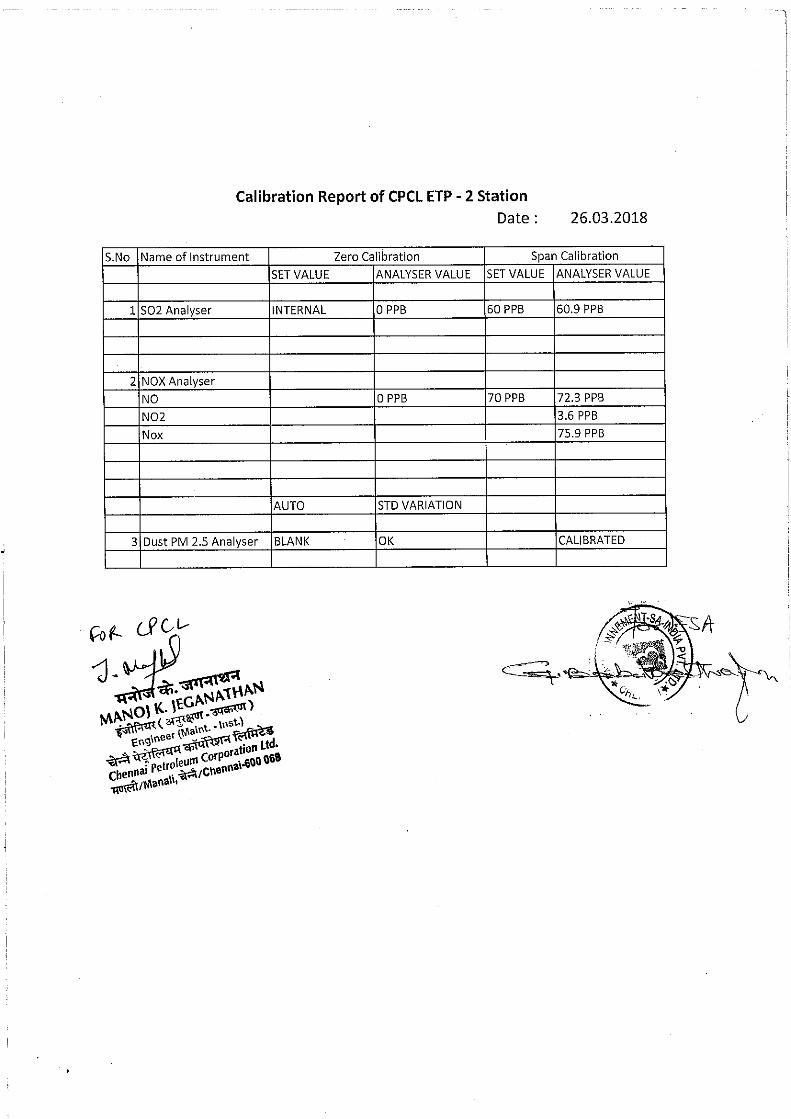
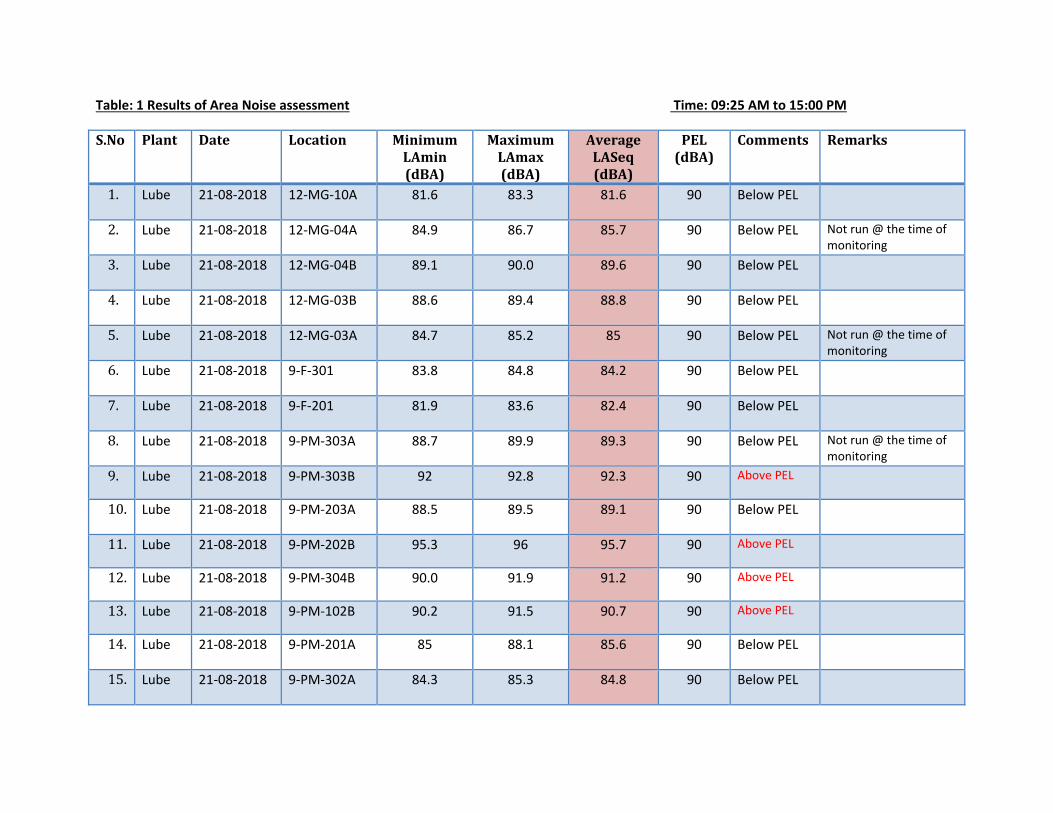
Table: 1 Results of Area Noise assessment Time: 09:25 AM to 15:00 PM
S.No Plant Date Location MinimumLAmin(dBA)
MaximumLAmax(dBA)
AverageLASeq(dBA)
PEL(dBA)
Comments Remarks
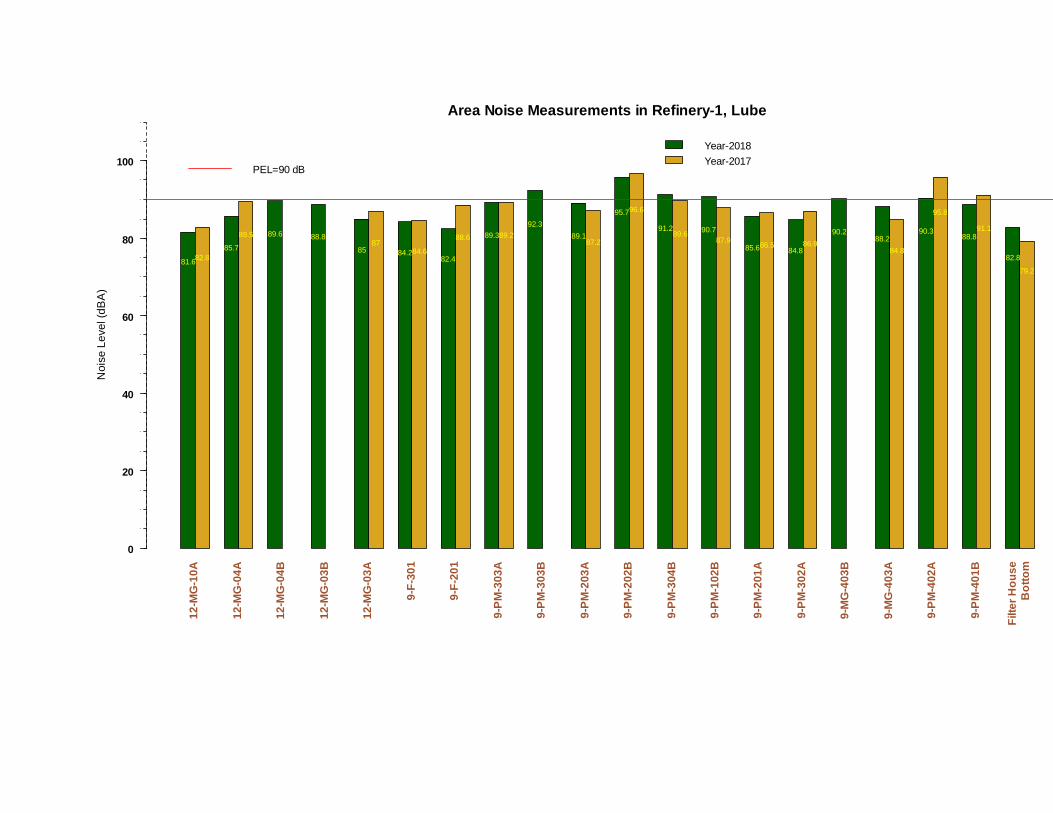
1. Lube 21‐08‐2018 12‐MG‐10A 81.6 83.3 81.6 90 Below PEL
2. Lube 21‐08‐2018 12‐MG‐04A 84.9 86.7 85.7 90 Below PEL Not run @ the time of monitoring
3. Lube 21‐08‐2018 12‐MG‐04B 89.1 90.0 89.6 90 Below PEL
4. Lube 21‐08‐2018 12‐MG‐03B 88.6 89.4 88.8 90 Below PEL
5. Lube 21‐08‐2018 12‐MG‐03A 84.7 85.2 85 90 Below PEL Not run @ the time of monitoring
6. Lube 21‐08‐2018 9‐F‐301 83.8 84.8 84.2 90 Below PEL
7. Lube 21‐08‐2018 9‐F‐201 81.9 83.6 82.4 90 Below PEL
8. Lube 21‐08‐2018 9‐PM‐303A 88.7 89.9 89.3 90 Below PEL Not run @ the time of monitoring
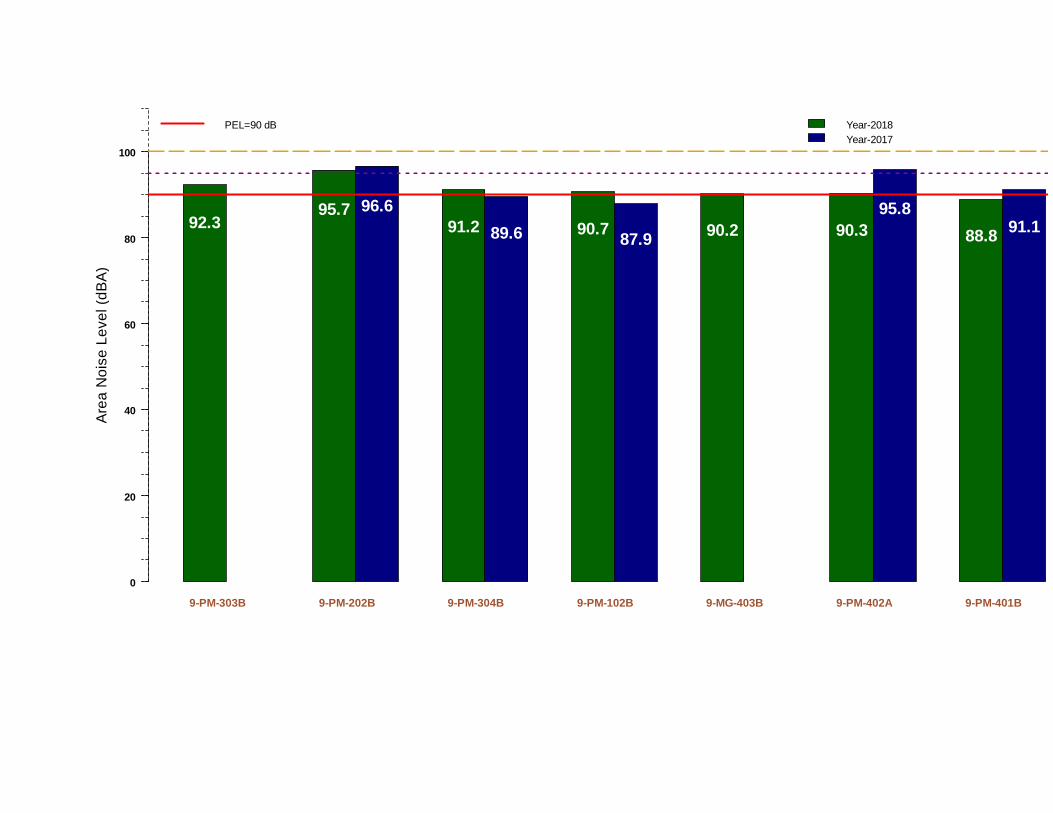
9. Lube 21‐08‐2018 9‐PM‐303B 92 92.8 92.3 90 Above PEL
10. Lube 21‐08‐2018 9‐PM‐203A 88.5 89.5 89.1 90 Below PEL
11. Lube 21‐08‐2018 9‐PM‐202B 95.3 96 95.7 90 Above PEL
12. Lube 21‐08‐2018 9‐PM‐304B 90.0 91.9 91.2 90 Above PEL
13. Lube 21‐08‐2018 9‐PM‐102B 90.2 91.5 90.7 90 Above PEL
14. Lube 21‐08‐2018 9‐PM‐201A 85 88.1 85.6 90 Below PEL
15. Lube 21‐08‐2018 9‐PM‐302A 84.3 85.3 84.8 90 Below PEL
S.No Plant Date Location MinimumLAmin(dBA)
MaximumLAmax(dBA)
AverageLASeq(dBA)
PEL(dBA)
Comments Remarks
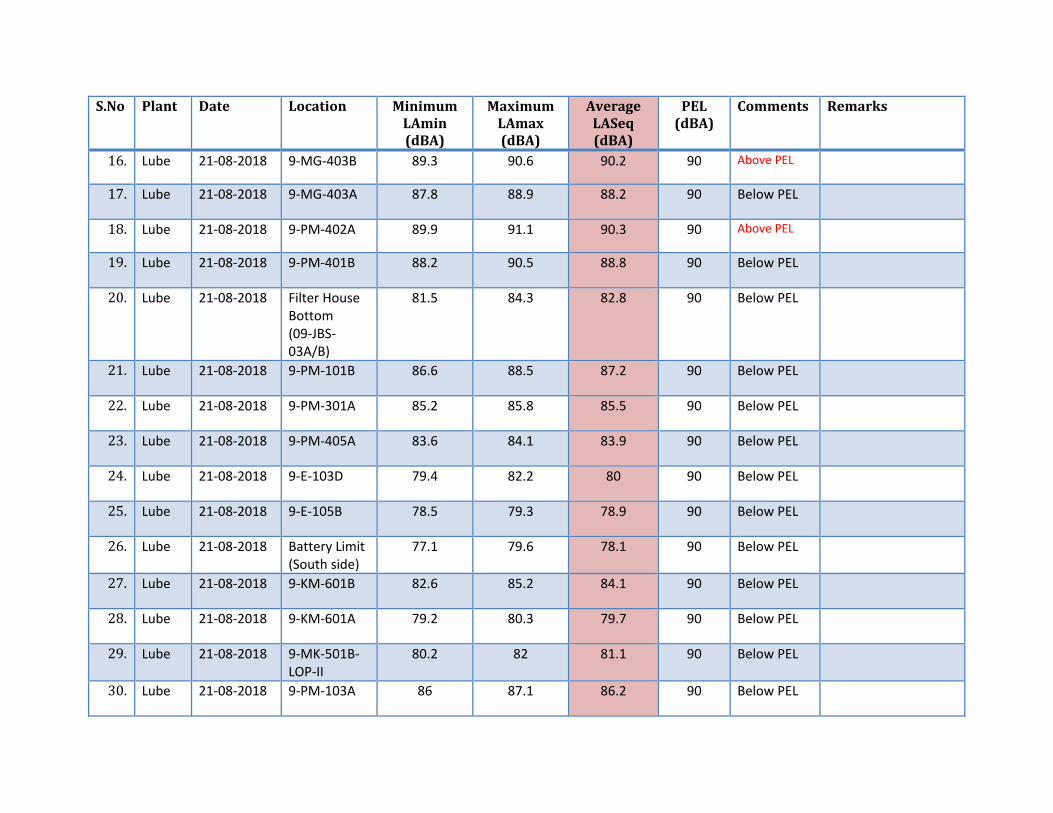
16. Lube 21‐08‐2018 9‐MG‐403B 89.3 90.6 90.2 90 Above PEL
17. Lube 21‐08‐2018 9‐MG‐403A 87.8 88.9 88.2 90 Below PEL
18. Lube 21‐08‐2018 9‐PM‐402A 89.9 91.1 90.3 90 Above PEL
19. Lube 21‐08‐2018 9‐PM‐401B 88.2 90.5 88.8 90 Below PEL
20. Lube 21‐08‐2018 Filter House Bottom (09‐JBS‐03A/B)
81.5 84.3 82.8 90 Below PEL
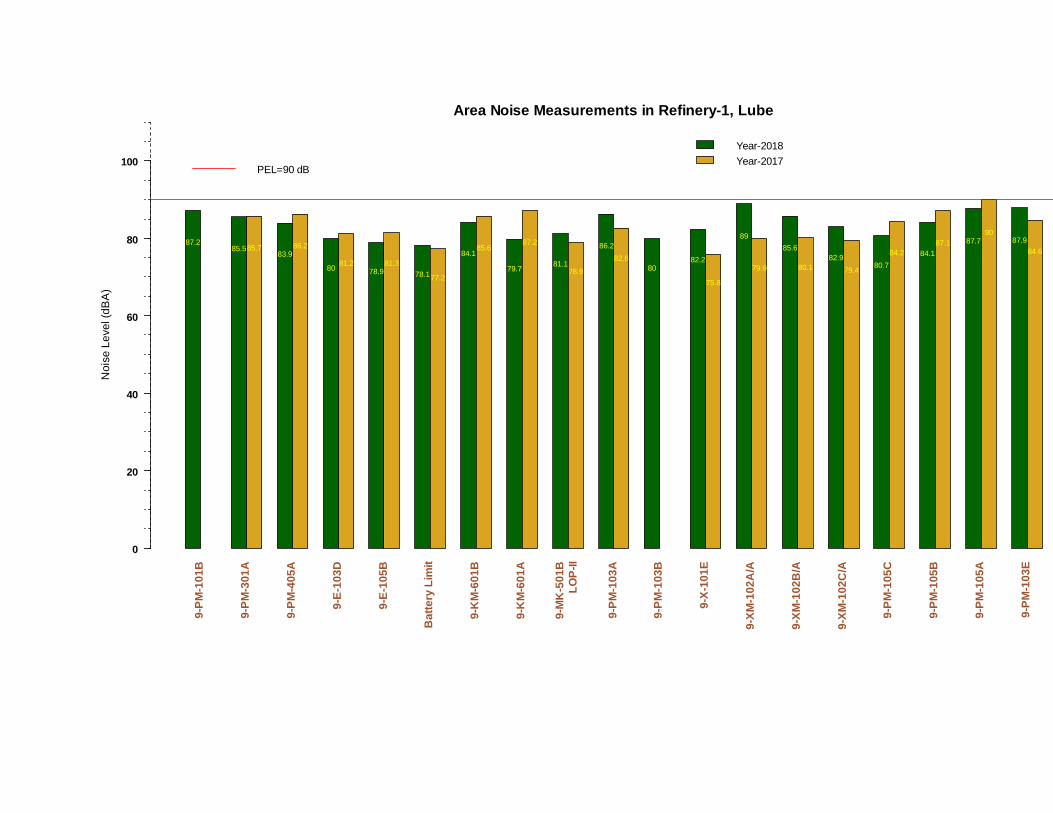
21. Lube 21‐08‐2018 9‐PM‐101B 86.6 88.5 87.2 90 Below PEL
22. Lube 21‐08‐2018 9‐PM‐301A 85.2 85.8 85.5 90 Below PEL
23. Lube 21‐08‐2018 9‐PM‐405A 83.6 84.1 83.9 90 Below PEL
24. Lube 21‐08‐2018 9‐E‐103D 79.4 82.2 80 90 Below PEL
25. Lube 21‐08‐2018 9‐E‐105B 78.5 79.3 78.9 90 Below PEL
26. Lube 21‐08‐2018 Battery Limit (South side)
77.1 79.6 78.1 90 Below PEL
27. Lube 21‐08‐2018 9‐KM‐601B 82.6 85.2 84.1 90 Below PEL
28. Lube 21‐08‐2018 9‐KM‐601A 79.2 80.3 79.7 90 Below PEL
29. Lube 21‐08‐2018 9‐MK‐501B‐LOP‐II
80.2 82 81.1 90 Below PEL
30. Lube 21‐08‐2018 9‐PM‐103A 86 87.1 86.2 90 Below PEL
S.No Plant Date Location MinimumLAmin(dBA)
MaximumLAmax(dBA)
AverageLASeq(dBA)
PEL(dBA)
Comments Remarks
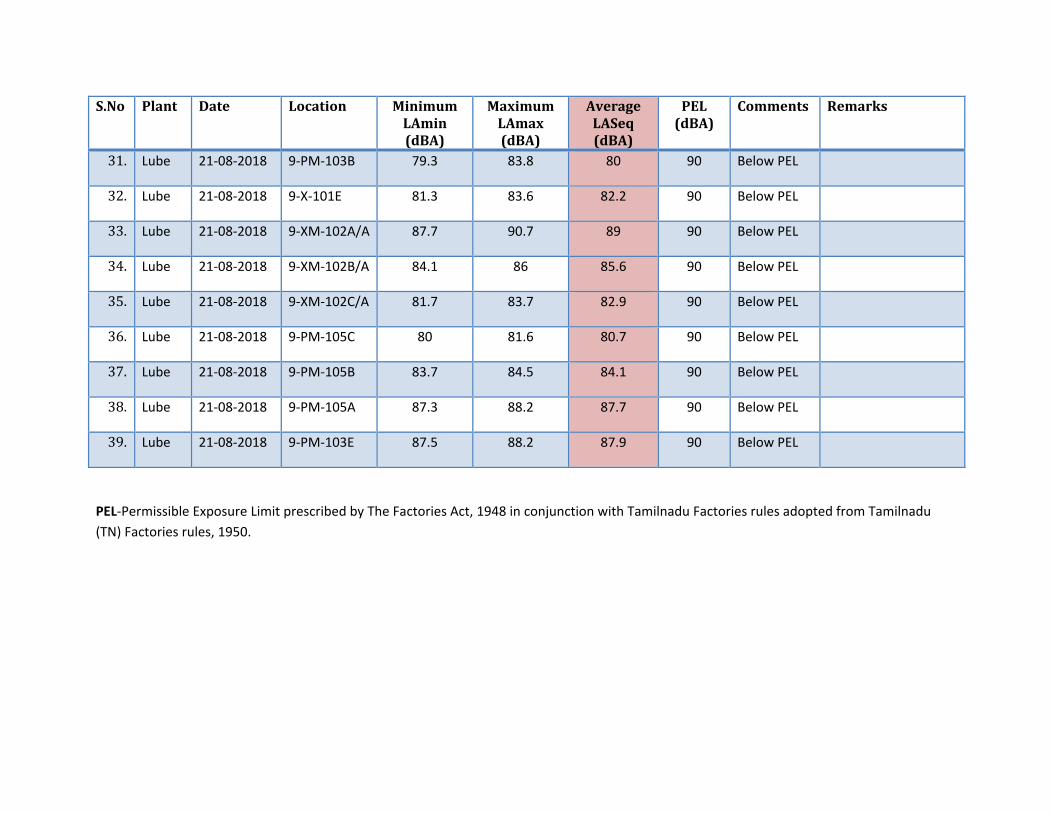
31. Lube 21‐08‐2018 9‐PM‐103B 79.3 83.8 80 90 Below PEL
32. Lube 21‐08‐2018 9‐X‐101E 81.3 83.6 82.2 90 Below PEL
33. Lube 21‐08‐2018 9‐XM‐102A/A 87.7 90.7 89 90 Below PEL
34. Lube 21‐08‐2018 9‐XM‐102B/A 84.1 86 85.6 90 Below PEL
35. Lube 21‐08‐2018 9‐XM‐102C/A 81.7 83.7 82.9 90 Below PEL
36. Lube 21‐08‐2018 9‐PM‐105C 80 81.6 80.7 90 Below PEL
37. Lube 21‐08‐2018 9‐PM‐105B 83.7 84.5 84.1 90 Below PEL
38. Lube 21‐08‐2018 9‐PM‐105A 87.3 88.2 87.7 90 Below PEL
39. Lube 21‐08‐2018 9‐PM‐103E 87.5 88.2 87.9 90 Below PEL
PEL‐Permissible Exposure Limit prescribed by The Factories Act, 1948 in conjunction with Tamilnadu Factories rules adopted from Tamilnadu
(TN) Factories rules, 1950.
Area Noise Measurements in Refinery-1, LubeN
oise
Le
vel (
dB
A)
0
20
40
60
80
100
Year-2018
Year-2017
12-M
G-1
0A
12-M
G-0
4A
12-M
G-0
4B
12-M
G-0
3B
12-M
G-0
3A
9-F
-30
1
9-F
-20
1
9-P
M-3
03A
9-P
M-3
03B
9-P
M-2
03A
9-P
M-2
02B
9-P
M-3
04B
9-P
M-1
02B
9-P
M-2
01A
9-P
M-3
02A
9-M
G-4
03B
9-M
G-4
03A
9-P
M-4
02A
9-P
M-4
01B
Filt
er H
ou
se
Bo
tto
m
PEL=90 dB
81.682.885.7
89.5 89.6 88.8
8587
84.284.682.4
88.6 89.389.2
92.3
89.187.2
95.796.6
91.289.6 90.7
87.985.686.5
84.886.9
90.288.2
84.8
90.3
95.8
88.891.1
82.8
79.2
Area Noise Measurements in Refinery-1, LubeN
oise
Le
vel (
dB
A)
0
20
40
60
80
100
Year-2018
Year-2017
9-P
M-1
01B
9-P
M-3
01A
9-P
M-4
05A
9-E
-103
D
9-E
-105
B
Bat
tery
Lim
it
9-K
M-6
01B
9-K
M-6
01A
9-M
K-5
01B
LO
P-I
I
9-P
M-1
03A
9-P
M-1
03B
9-X
-10
1E
9-X
M-1
02A
/A
9-X
M-1
02B
/A
9-X
M-1
02C
/A
9-P
M-1
05C
9-P
M-1
05B
9-P
M-1
05A
9-P
M-1
03
E
PEL=90 dB
87.285.585.7
83.986.2
8081.2
78.981.3
78.177.2
84.185.6
79.7
87.2
81.178.9
86.2
82.680
82.2
75.8
89
79.9
85.6
80.182.9
79.480.7
84.2 84.187.1 87.7
9087.9
84.6
Are
a N
ois
e L
eve
l (d
BA
)
0
20
40
60
80
100
Year-2018
Year-2017
9-PM-303B 9-PM-202B 9-PM-304B 9-PM-102B 9-MG-403B 9-PM-402A 9-PM-401B
PEL=90 dB
92.395.7 96.6
91.2 89.6 90.787.9 90.2 90.3
95.8
88.8 91.1
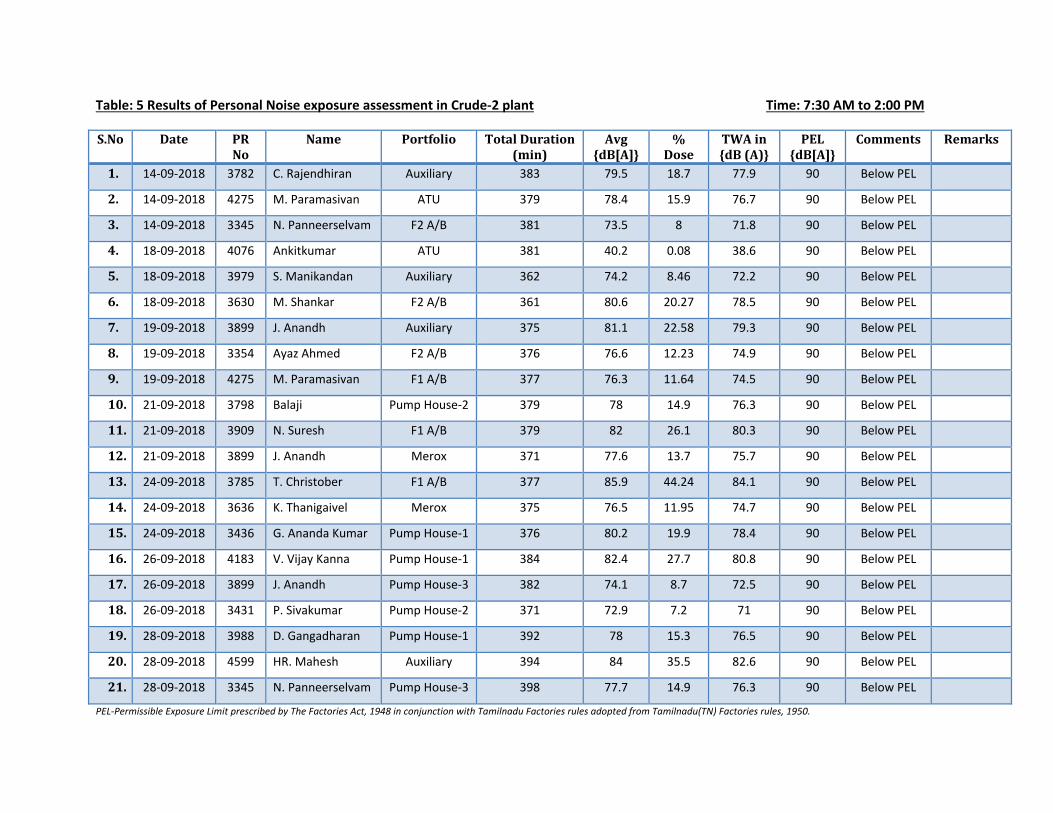
Table: 5 Results of Personal Noise exposure assessment in Crude‐2 plant Time: 7:30 AM to 2:00 PM
S.No Date PRNo
Name Portfolio TotalDuration(min)
Avg{dB[A]}
%Dose
TWAin{dB(A)}
PEL{dB[A]}
Comments Remarks
1. 14‐09‐2018 3782 C. Rajendhiran Auxiliary 383 79.5 18.7 77.9 90 Below PEL
2. 14‐09‐2018 4275 M. Paramasivan ATU 379 78.4 15.9 76.7 90 Below PEL
3. 14‐09‐2018 3345 N. Panneerselvam F2 A/B 381 73.5 8 71.8 90 Below PEL
4. 18‐09‐2018 4076 Ankitkumar ATU 381 40.2 0.08 38.6 90 Below PEL
5. 18‐09‐2018 3979 S. Manikandan Auxiliary 362 74.2 8.46 72.2 90 Below PEL
6. 18‐09‐2018 3630 M. Shankar F2 A/B 361 80.6 20.27 78.5 90 Below PEL
7. 19‐09‐2018 3899 J. Anandh Auxiliary 375 81.1 22.58 79.3 90 Below PEL
8. 19‐09‐2018 3354 Ayaz Ahmed F2 A/B 376 76.6 12.23 74.9 90 Below PEL
9. 19‐09‐2018 4275 M. Paramasivan F1 A/B 377 76.3 11.64 74.5 90 Below PEL
10. 21‐09‐2018 3798 Balaji Pump House‐2 379 78 14.9 76.3 90 Below PEL
11. 21‐09‐2018 3909 N. Suresh F1 A/B 379 82 26.1 80.3 90 Below PEL
12. 21‐09‐2018 3899 J. Anandh Merox 371 77.6 13.7 75.7 90 Below PEL
13. 24‐09‐2018 3785 T. Christober F1 A/B 377 85.9 44.24 84.1 90 Below PEL
14. 24‐09‐2018 3636 K. Thanigaivel Merox 375 76.5 11.95 74.7 90 Below PEL
15. 24‐09‐2018 3436 G. Ananda Kumar Pump House‐1 376 80.2 19.9 78.4 90 Below PEL
16. 26‐09‐2018 4183 V. Vijay Kanna Pump House‐1 384 82.4 27.7 80.8 90 Below PEL
17. 26‐09‐2018 3899 J. Anandh Pump House‐3 382 74.1 8.7 72.5 90 Below PEL
18. 26‐09‐2018 3431 P. Sivakumar Pump House‐2 371 72.9 7.2 71 90 Below PEL
19. 28‐09‐2018 3988 D. Gangadharan Pump House‐1 392 78 15.3 76.5 90 Below PEL
20. 28‐09‐2018 4599 HR. Mahesh Auxiliary 394 84 35.5 82.6 90 Below PEL
21. 28‐09‐2018 3345 N. Panneerselvam Pump House‐3 398 77.7 14.9 76.3 90 Below PEL
PEL‐Permissible Exposure Limit prescribed by The Factories Act, 1948 in conjunction with Tamilnadu Factories rules adopted from Tamilnadu(TN) Factories rules, 1950.
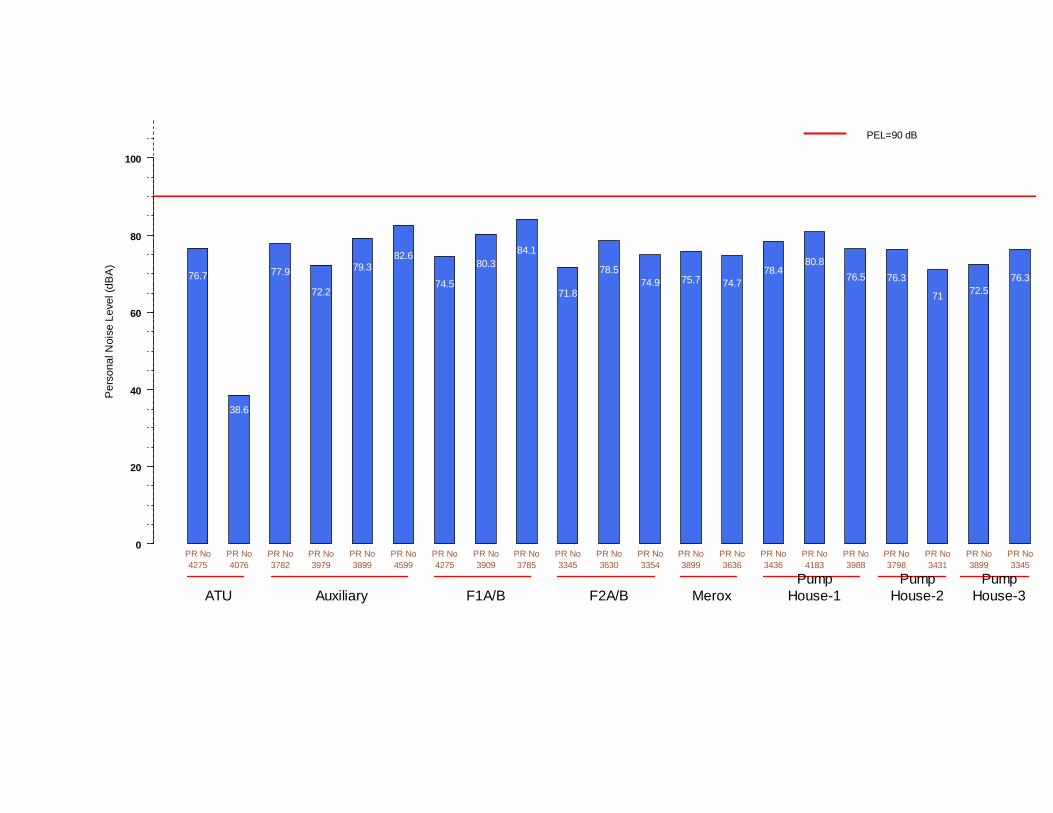
P
ers
on
al N
ois
e L
eve
l (d
BA
)
0
20
40
60
80
100
PR No4275
PR No4076
PR No3782
PR No3979
PR No3899
PR No4599
PR No4275
PR No3909
PR No3785
PR No3345
PR No3630
PR No3354
PR No3899
PR No3636
PR No3436
PR No4183
PR No3988
PR No3798
PR No3431
PR No3899
PR No3345
PEL=90 dB
76.7
38.6
77.9
72.2
79.382.6
74.5
80.384.1
71.8
78.574.9 75.7 74.7
78.480.8
76.5 76.3
71 72.576.3
ATU Auxiliary F1A/B F2A/B MeroxPump
House-1Pump
House-2Pump
House-3
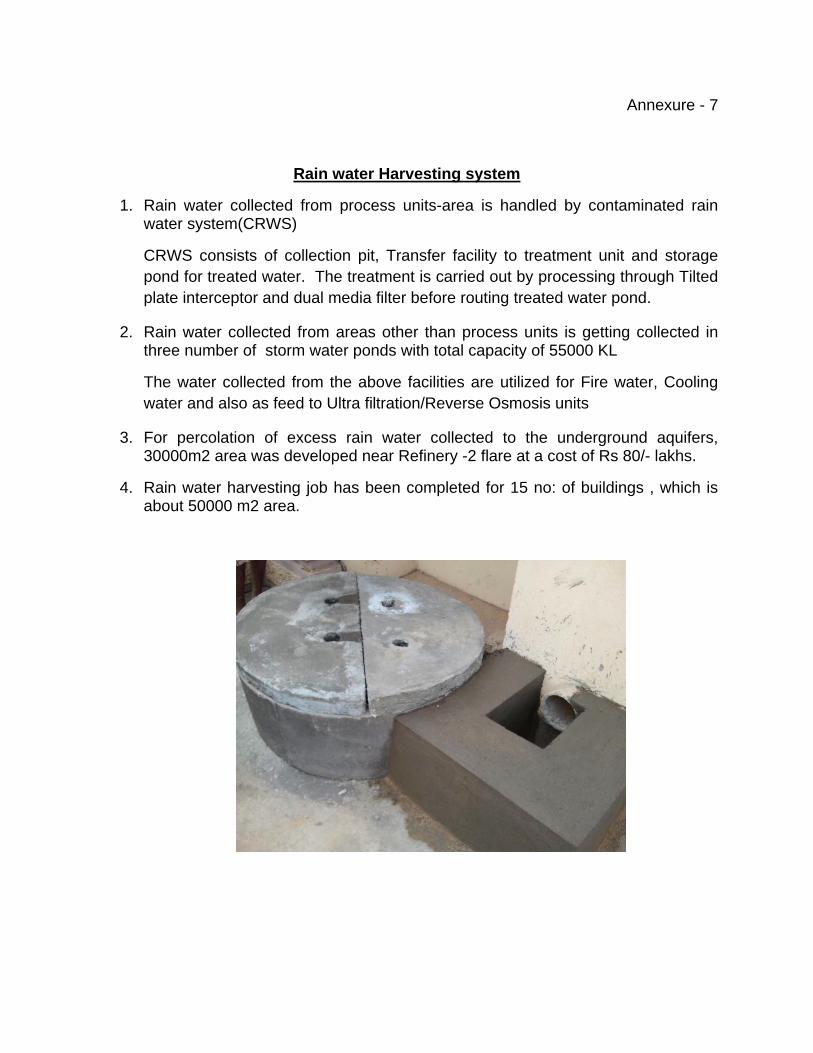
Annexure - 7
Rain water Harvesting system
1. Rain water collected from process units-area is handled by contaminated rain water system(CRWS)
CRWS consists of collection pit, Transfer facility to treatment unit and storage pond for treated water. The treatment is carried out by processing through Tilted plate interceptor and dual media filter before routing treated water pond.
2. Rain water collected from areas other than process units is getting collected in three number of storm water ponds with total capacity of 55000 KL
The water collected from the above facilities are utilized for Fire water, Cooling water and also as feed to Ultra filtration/Reverse Osmosis units
3. For percolation of excess rain water collected to the underground aquifers, 30000m2 area was developed near Refinery -2 flare at a cost of Rs 80/- lakhs.
4. Rain water harvesting job has been completed for 15 no: of buildings , which is about 50000 m2 area.
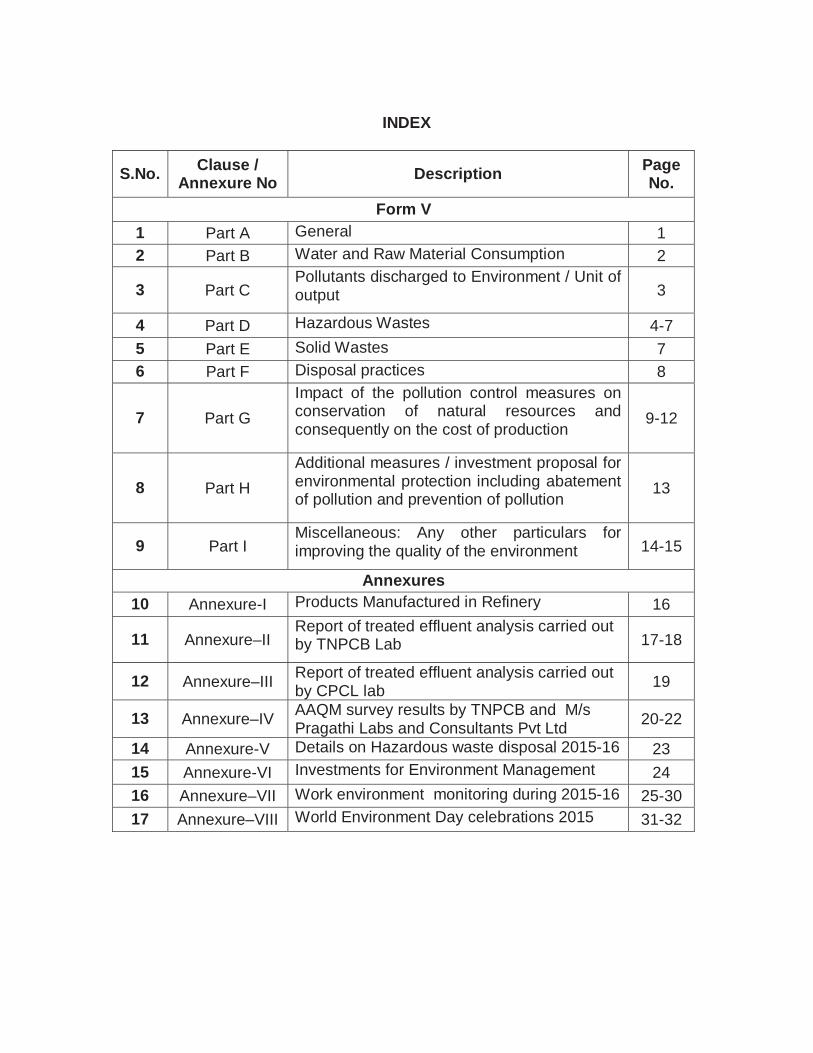
INDEX
S.No. Clause /
Annexure No Description
Page No.
Form V
1 Part A General 1
2 Part B Water and Raw Material Consumption 2
3 Part C Pollutants discharged to Environment / Unit of output 3
4 Part D Hazardous Wastes 4-7
5 Part E Solid Wastes 7
6 Part F Disposal practices 8
7 Part G
Impact of the pollution control measures on conservation of natural resources and consequently on the cost of production
9-12
8 Part H
Additional measures / investment proposal for environmental protection including abatement of pollution and prevention of pollution
13
9 Part I Miscellaneous: Any other particulars for improving the quality of the environment 14-15
Annexures
10 Annexure-I Products Manufactured in Refinery 16
11 Annexure–II Report of treated effluent analysis carried out by TNPCB Lab 17-18
12 Annexure–III Report of treated effluent analysis carried out by CPCL lab
19
13 Annexure–IV AAQM survey results by TNPCB and M/s Pragathi Labs and Consultants Pvt Ltd
20-22
14 Annexure-V Details on Hazardous waste disposal 2015-16 23
15 Annexure-VI Investments for Environment Management 24
16 Annexure–VII Work environment monitoring during 2015-16 25-30
17 Annexure–VIII World Environment Day celebrations 2015 31-32
CPCL Environment Statement 2017-18
1 | P a g e
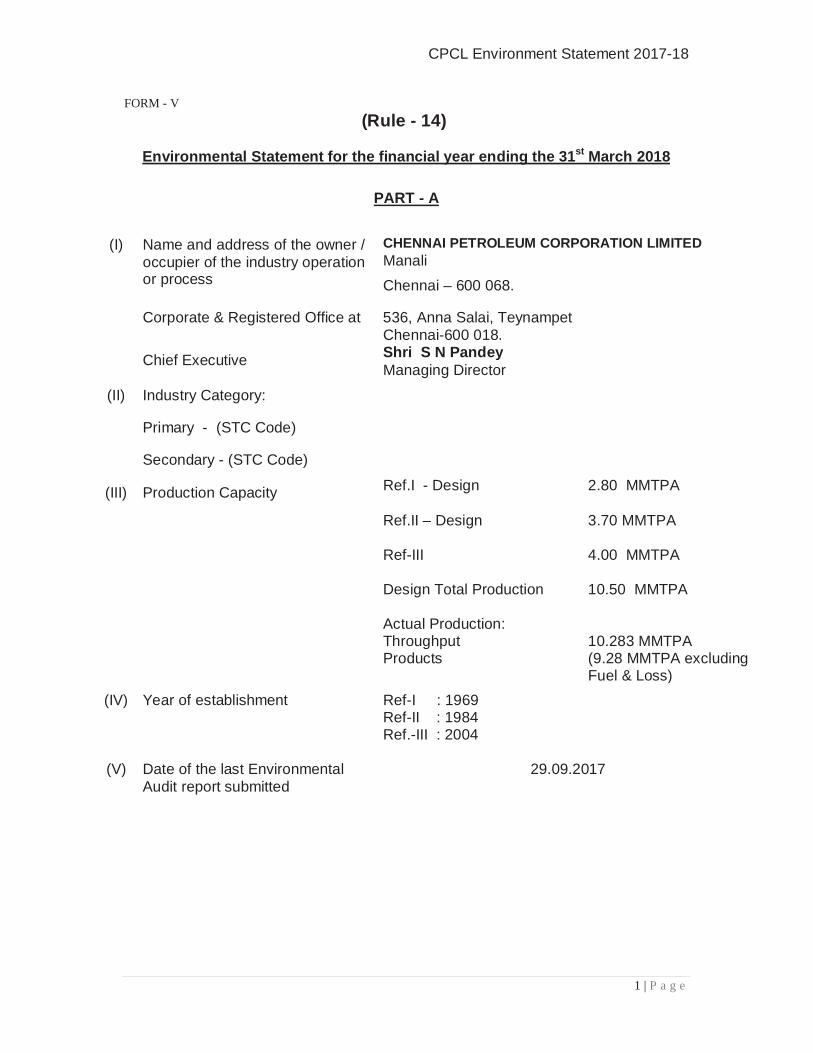
FORM - V (Rule - 14)
Environmental Statement for the financial year ending the 31st March 2018
PART - A
(I) Name and address of the owner / occupier of the industry operation or process
CHENNAI PETROLEUM CORPORATION LIMITED Manali
Chennai – 600 068.
Corporate & Registered Office at 536, Anna Salai, Teynampet Chennai-600 018.
Chief Executive Shri S N Pandey
Managing Director
(II) Industry Category:
Primary - (STC Code)
Secondary - (STC Code)
(III) Production Capacity Ref.I - Design 2.80 MMTPA Ref.II – Design Ref-III
3.70 MMTPA 4.00 MMTPA
Design Total Production
10.50 MMTPA
Actual Production: Throughput Products
10.283 MMTPA (9.28 MMTPA excluding Fuel & Loss)
(IV) Year of establishment Ref-I : 1969 Ref-II : 1984 Ref.-III : 2004
(V) Date of the last Environmental Audit report submitted
29.09.2017
CPCL Environment Statement 2017-18
2 | P a g e
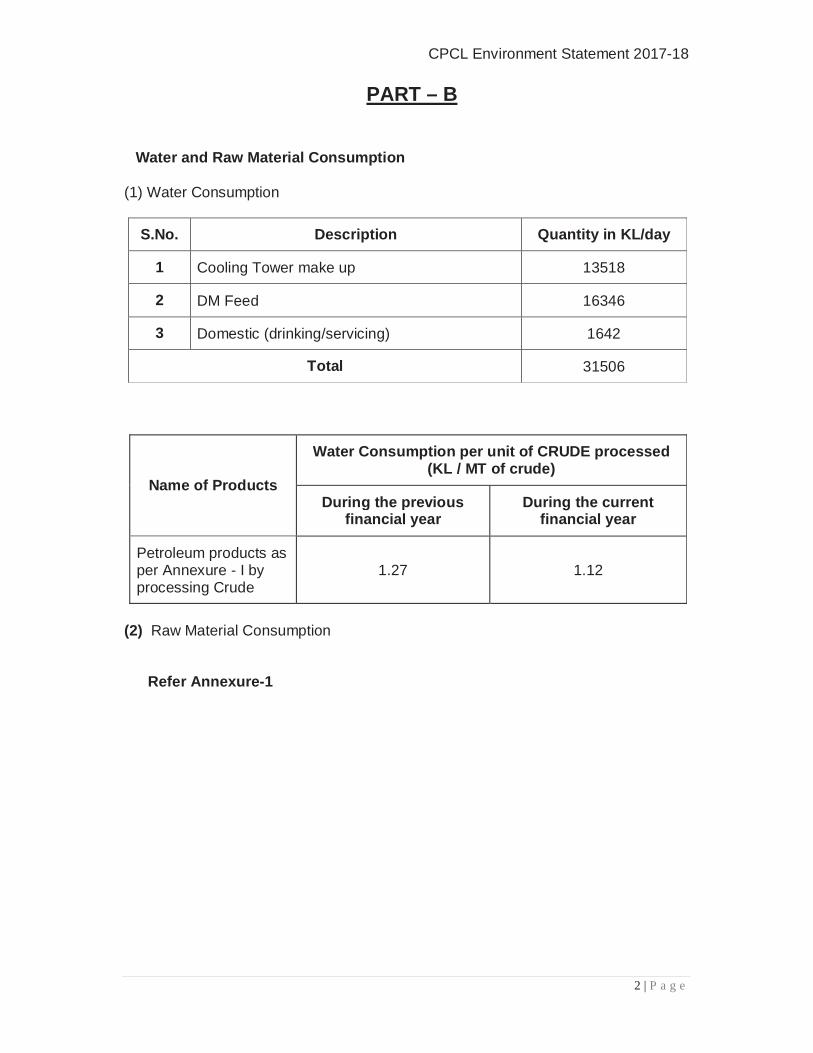
PART – B
Water and Raw Material Consumption
(1) Water Consumption
S.No. Description Quantity in KL/day
1 Cooling Tower make up 13518
2 DM Feed 16346
3 Domestic (drinking/servicing) 1642
Total 31506
Name of Products
Water Consumption per unit of CRUDE processed (KL / MT of crude)
During the previous financial year
During the current financial year
Petroleum products as per Annexure - I by processing Crude
1.27 1.12
(2) Raw Material Consumption
Refer Annexure-1
CPCL Environment Statement 2017-18
3 | P a g e
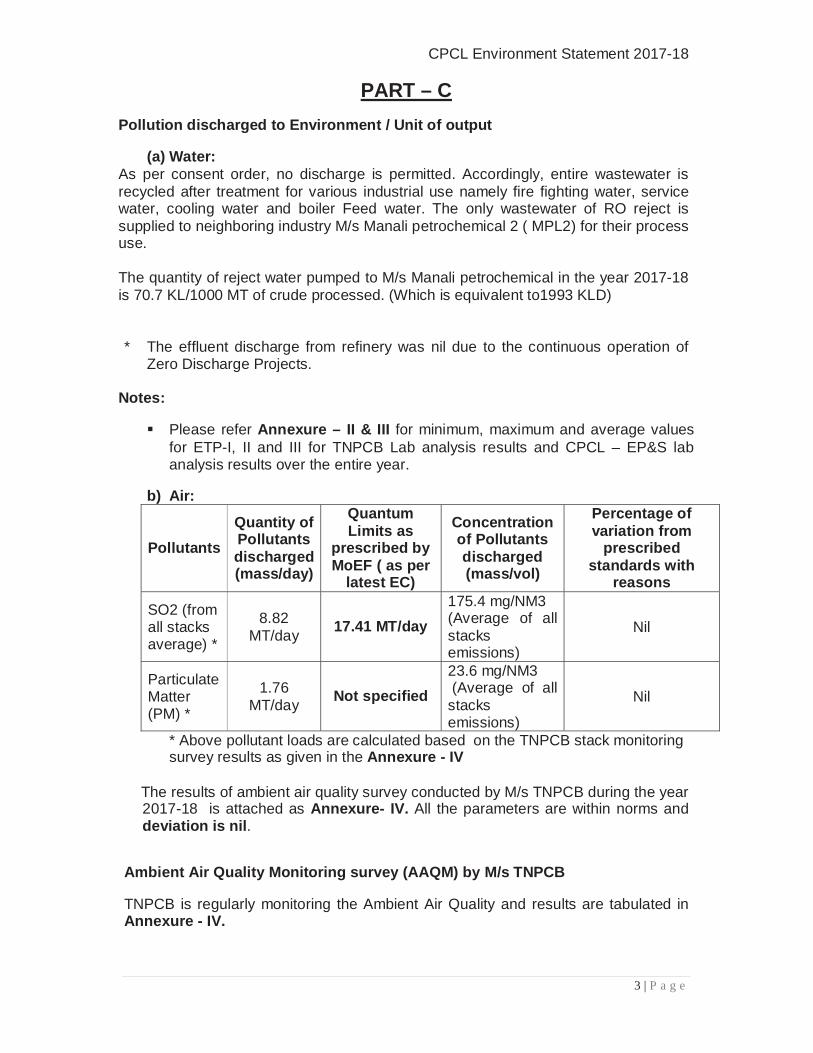
PART – C
Pollution discharged to Environment / Unit of output
(a) Water: As per consent order, no discharge is permitted. Accordingly, entire wastewater is recycled after treatment for various industrial use namely fire fighting water, service water, cooling water and boiler Feed water. The only wastewater of RO reject is supplied to neighboring industry M/s Manali petrochemical 2 ( MPL2) for their process use. The quantity of reject water pumped to M/s Manali petrochemical in the year 2017-18 is 70.7 KL/1000 MT of crude processed. (Which is equivalent to1993 KLD) * The effluent discharge from refinery was nil due to the continuous operation of
Zero Discharge Projects. Notes:
Please refer Annexure – II & III for minimum, maximum and average values for ETP-I, II and III for TNPCB Lab analysis results and CPCL – EP&S lab analysis results over the entire year.
b) Air:
Pollutants
Quantity of Pollutants discharged (mass/day)
Quantum Limits as
prescribed by MoEF ( as per
latest EC)
Concentration of Pollutants discharged (mass/vol)
Percentage of variation from
prescribed standards with
reasons
SO2 (from all stacks average) *
8.82 MT/day
17.41 MT/day
175.4 mg/NM3 (Average of all stacks emissions)
Nil
Particulate Matter (PM) *
1.76 MT/day
Not specified
23.6 mg/NM3 (Average of all stacks emissions)
Nil
* Above pollutant loads are calculated based on the TNPCB stack monitoring survey results as given in the Annexure - IV
The results of ambient air quality survey conducted by M/s TNPCB during the year 2017-18 is attached as Annexure- IV. All the parameters are within norms and deviation is nil.
Ambient Air Quality Monitoring survey (AAQM) by M/s TNPCB TNPCB is regularly monitoring the Ambient Air Quality and results are tabulated in Annexure - IV.
CPCL Environment Statement 2017-18
4 | P a g e
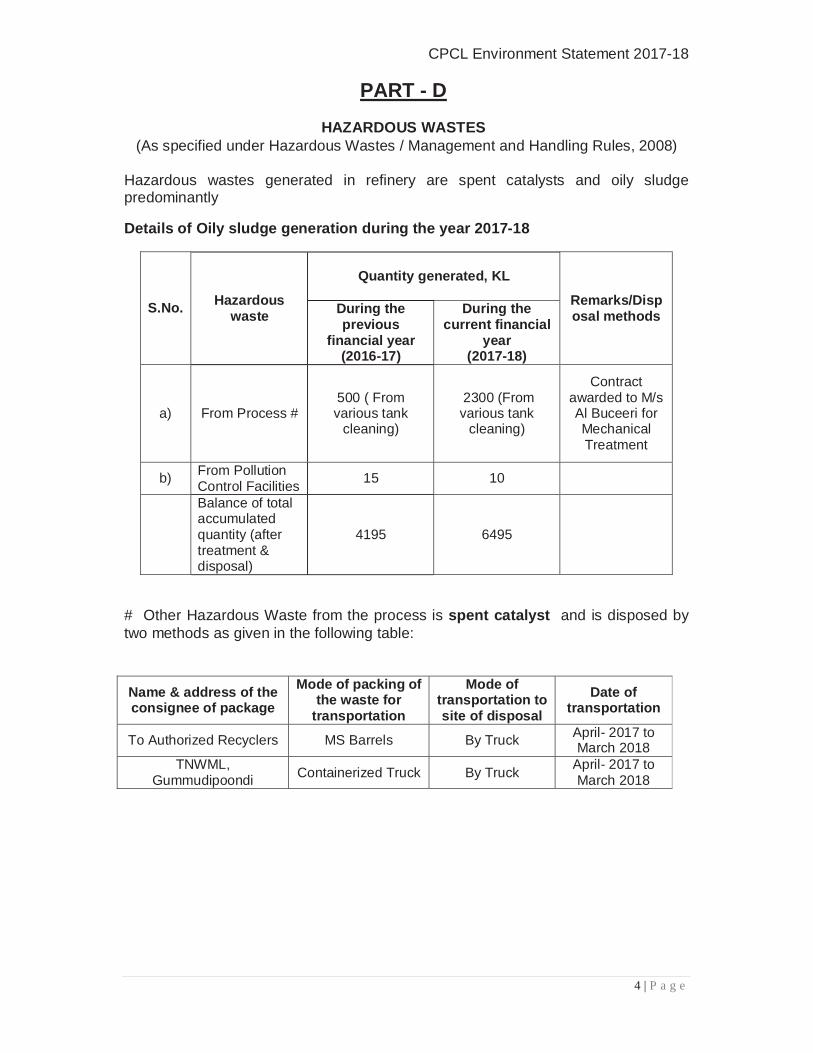
PART - D
HAZARDOUS WASTES (As specified under Hazardous Wastes / Management and Handling Rules, 2008)
Hazardous wastes generated in refinery are spent catalysts and oily sludge predominantly Details of Oily sludge generation during the year 2017-18
S.No. Hazardous waste
Quantity generated, KL
Remarks/Disposal methods During the
previous financial year
(2016-17)
During the current financial
year (2017-18)
a) From Process # 500 ( From various tank
cleaning)
2300 (From various tank
cleaning)
Contract awarded to M/s Al Buceeri for Mechanical Treatment
b) From Pollution Control Facilities
15 10
Balance of total accumulated quantity (after treatment & disposal)
4195 6495
# Other Hazardous Waste from the process is spent catalyst and is disposed by two methods as given in the following table:
Name & address of the consignee of package
Mode of packing of the waste for
transportation
Mode of transportation to site of disposal
Date of transportation
To Authorized Recyclers MS Barrels By Truck April- 2017 to March 2018
TNWML, Gummudipoondi Containerized Truck By Truck
April- 2017 to March 2018
CPCL Environment Statement 2017-18
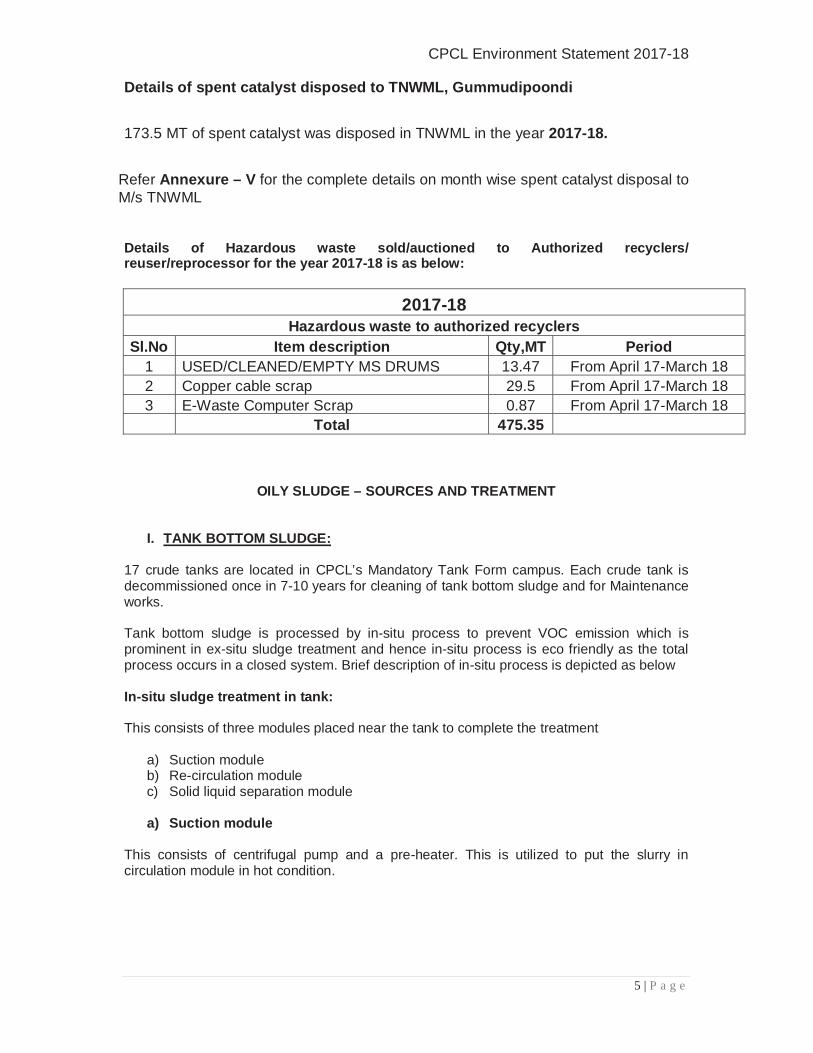
5 | P a g e
Details of spent catalyst disposed to TNWML, Gummudipoondi 173.5 MT of spent catalyst was disposed in TNWML in the year 2017-18.
Refer Annexure – V for the complete details on month wise spent catalyst disposal to M/s TNWML Details of Hazardous waste sold/auctioned to Authorized recyclers/ reuser/reprocessor for the year 2017-18 is as below:
2017-18
Hazardous waste to authorized recyclers Sl.No Item description Qty,MT Period
1 USED/CLEANED/EMPTY MS DRUMS 13.47 From April 17-March 18 2 Copper cable scrap 29.5 From April 17-March 18 3 E-Waste Computer Scrap 0.87 From April 17-March 18 Total 475.35
OILY SLUDGE – SOURCES AND TREATMENT
I. TANK BOTTOM SLUDGE:
17 crude tanks are located in CPCL’s Mandatory Tank Form campus. Each crude tank is decommissioned once in 7-10 years for cleaning of tank bottom sludge and for Maintenance works. Tank bottom sludge is processed by in-situ process to prevent VOC emission which is prominent in ex-situ sludge treatment and hence in-situ process is eco friendly as the total process occurs in a closed system. Brief description of in-situ process is depicted as below In-situ sludge treatment in tank: This consists of three modules placed near the tank to complete the treatment
a) Suction module b) Re-circulation module c) Solid liquid separation module
a) Suction module
This consists of centrifugal pump and a pre-heater. This is utilized to put the slurry in circulation module in hot condition.
CPCL Environment Statement 2017-18
6 | P a g e
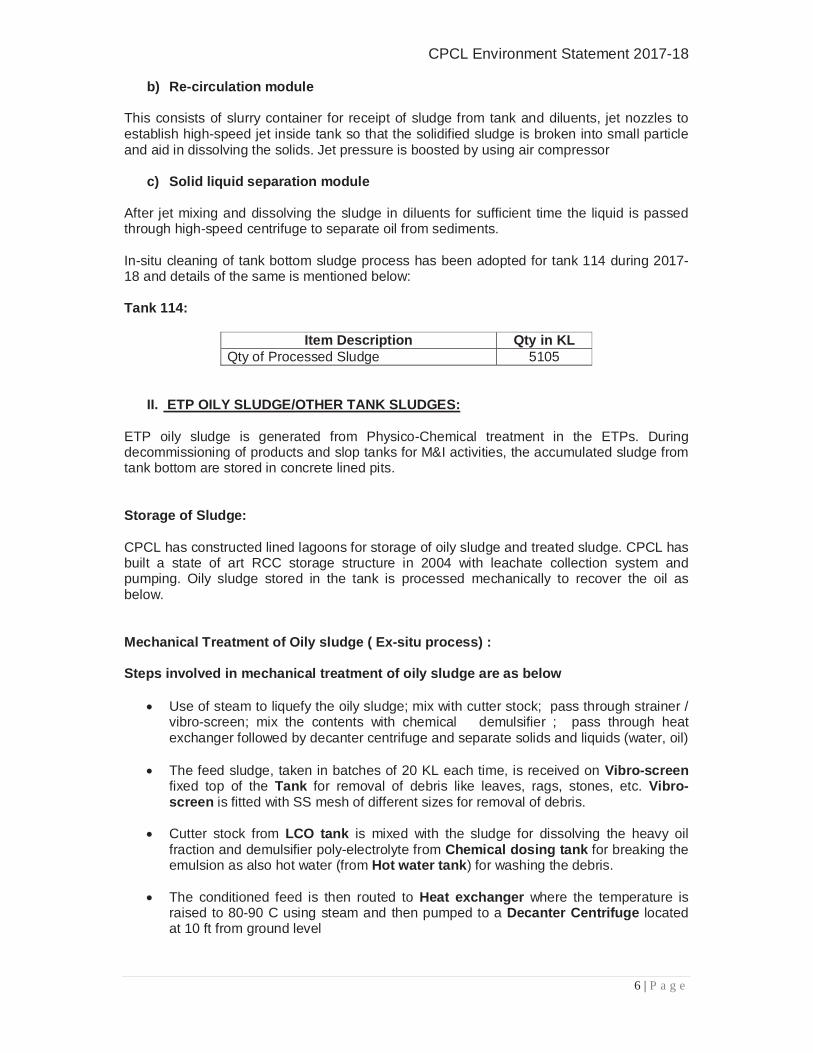
b) Re-circulation module This consists of slurry container for receipt of sludge from tank and diluents, jet nozzles to establish high-speed jet inside tank so that the solidified sludge is broken into small particle and aid in dissolving the solids. Jet pressure is boosted by using air compressor
c) Solid liquid separation module After jet mixing and dissolving the sludge in diluents for sufficient time the liquid is passed through high-speed centrifuge to separate oil from sediments. In-situ cleaning of tank bottom sludge process has been adopted for tank 114 during 2017-18 and details of the same is mentioned below: Tank 114:
Item Description Qty in KL Qty of Processed Sludge 5105
II. ETP OILY SLUDGE/OTHER TANK SLUDGES: ETP oily sludge is generated from Physico-Chemical treatment in the ETPs. During decommissioning of products and slop tanks for M&I activities, the accumulated sludge from tank bottom are stored in concrete lined pits. Storage of Sludge: CPCL has constructed lined lagoons for storage of oily sludge and treated sludge. CPCL has built a state of art RCC storage structure in 2004 with leachate collection system and pumping. Oily sludge stored in the tank is processed mechanically to recover the oil as below. Mechanical Treatment of Oily sludge ( Ex-situ process) : Steps involved in mechanical treatment of oily sludge are as below
Use of steam to liquefy the oily sludge; mix with cutter stock; pass through strainer / vibro-screen; mix the contents with chemical demulsifier ; pass through heat exchanger followed by decanter centrifuge and separate solids and liquids (water, oil)
The feed sludge, taken in batches of 20 KL each time, is received on Vibro-screen
fixed top of the Tank for removal of debris like leaves, rags, stones, etc. Vibro-screen is fitted with SS mesh of different sizes for removal of debris.
Cutter stock from LCO tank is mixed with the sludge for dissolving the heavy oil fraction and demulsifier poly-electrolyte from Chemical dosing tank for breaking the emulsion as also hot water (from Hot water tank) for washing the debris.
The conditioned feed is then routed to Heat exchanger where the temperature is raised to 80-90 C using steam and then pumped to a Decanter Centrifuge located at 10 ft from ground level
CPCL Environment Statement 2017-18
7 | P a g e
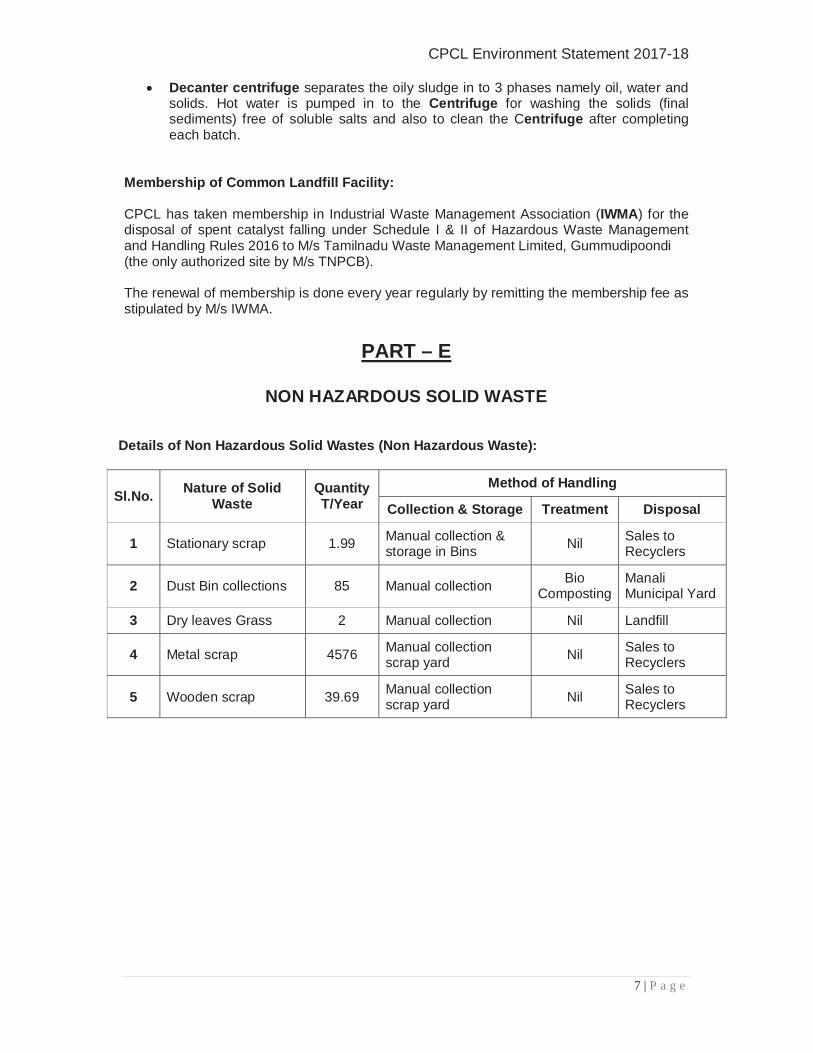
Decanter centrifuge separates the oily sludge in to 3 phases namely oil, water and solids. Hot water is pumped in to the Centrifuge for washing the solids (final sediments) free of soluble salts and also to clean the Centrifuge after completing each batch.
Membership of Common Landfill Facility: CPCL has taken membership in Industrial Waste Management Association (IWMA) for the disposal of spent catalyst falling under Schedule I & II of Hazardous Waste Management and Handling Rules 2016 to M/s Tamilnadu Waste Management Limited, Gummudipoondi (the only authorized site by M/s TNPCB). The renewal of membership is done every year regularly by remitting the membership fee as stipulated by M/s IWMA.
PART – E
NON HAZARDOUS SOLID WASTE
Details of Non Hazardous Solid Wastes (Non Hazardous Waste):
Sl.No. Nature of Solid
Waste Quantity T/Year
Method of Handling
Collection & Storage Treatment Disposal
1 Stationary scrap 1.99 Manual collection & storage in Bins
Nil Sales to Recyclers
2 Dust Bin collections 85 Manual collection Bio
Composting Manali Municipal Yard
3 Dry leaves Grass 2 Manual collection Nil Landfill
4 Metal scrap 4576 Manual collection scrap yard
Nil Sales to Recyclers
5 Wooden scrap 39.69 Manual collection scrap yard Nil
Sales to Recyclers
CPCL Environment Statement 2017-18
8 | P a g e
PART - F
The characterization (in terms of composition and quantum) of hazardous as well as solid wastes and indicates disposal practice adopted for both these categories of wastes.
I. CHARACTERIZATION OF SOLID WASTE:
Characterization of Hazardous solid waste is done by conducting comprehensive analysis of sample as and when generated in the lab operated by M/s Tamilnadu Waste Management Limited authorized by TNPCB. Since in the year 2017-18, no new hazardous waste was originated, no analysis has been carried out. Further, M/s NEERI has carried out “Comprehensive Audit of Solid Waste Generation at M/s Chennai Petroleum Corporation Ltd.,” Chennai in the year 2013 to characterize various waste from process and pollution control facilities.
II. DISPOSAL & WASTE MINIMIZATION PRACTICES:
Oil Sludge: Minimization of sludge and recovery of oil from sludge in crude tanks is done by adopting the following steps: Side mixers (3 Nos.) in crude storage tanks to re-suspend the sludge into crude. Hot gas oil recirculation to recover oil from the sludge.
Maintaining high temperature in BH crude tanks to eliminate sludge buildup by using
steam coils. Mechanical treatment of sludge thereby ensuring sludge minimization and avoiding
accumulation
In-situ tank bottom sludge process Disposal: Please refer write up on sludge management in CPCL under Part-D Effluent Treatment Plant Sludge: After oil extraction to the maximum possible extent, oily chemical sludge is stored in
lined pits then it is disposed to TNWML Gummudipundi
Tertiary Treatment Plant Sludge: Bio-Sludge: After de-watering in drying beds used either for greenbelt or earth filling
CPCL Environment Statement 2017-18
9 | P a g e
PART - G Impact of the pollution control measures on conservation of natural resources and consequently on the cost of production Following measures have been taken to reduce the impact on environment & cost of production and to conserve natural resources:
Basic pollution control measures (viz., effluent treatment plants, air pollution control equipment, monitoring equipment’s etc.) have been installed for complying with environmental statutory requirements and is in continuous operation within the refinery. In addition to pollution control measures, use of Cleaner Technology in process operations has been resorted which helps in conservation of natural resources and consequently reduces the cost of production. Cleaner Technology includes the following:
I. Use of new process technology / change to eco-friendly manufacturing processes
(i) New Effluent Treatment plant (ETP4) combined with DM plant was commissioned to treat the effluents generated from DCU facilities at a cost of Rs 220 Crore.
(ii) Construction & laying of new 42” Crude Oil pipeline with enhanced safety features is in progress from Chennai Port Trust to Manali Refinery at an estimated cost of Rs 257.87 Crore to have a better reliability. Design of the above said pipeline includes the latest leak detection and automatic isolation system.
(iii) CPCL has commissioned 5.8 MGD Desalination plant in the year 2010 at a cost of Rs 231.34 Crore thereby reducing the fresh water receipt from CMWSSB so as to supply the equivalent water to city.
(iv) A new SRU plant (2 X 100 TPD) is under commissioning to treat the sulphur laden stream from Delayed Coker Unit ( DCU).
(v) As part of Auto Fuel Policy, the entire MS and Diesel produced is conforming to BS-IV since 1st April 2017. Further, CPCL is in the process of implementing BS-VI in line with Auto Fuel Policy directions.
II. Use of environment-friendly inputs / products in the manufacturing processes
(i) CPCL is in the process of implementing RLNG project in a phased manner which will result in the reduction of pollutant load to the atmosphere. Target for the above project is end of 2018.
(ii) Low Sulfur fuel (LSHS) is being used in Refinery to reduce sulfur emissions in to the environment.
(iii) Low NOx burners are in use in boilers and process furnace heaters of DHDS, Ref-III and Ref II
III. Development / production / distribution of eco-friendly products
a. Volatile Organic Compounds (VOC) collection & Removal system
CPCL has commissioned and put in continuous operation of VOC collection and removal system for ETP II. The VOCs generated from the oil handling ETP equipments such as API, TPI, DAF, pH adjustment tank, Flash mixing tank, Flocculation tank, sludge sump
CPCL Environment Statement 2017-18
10 | P a g e
supernatant sump and slop oil is collected and stripped of by passing through Activated Carbon Filters. The existing ETP-II open surge pond was decommissioned and new closed tanks (Three nos.) have been installed and commissioned.
b. Provision of Dome Roof tanks for Naphtha tanks with Nitrogen Blanketing:
Dome Roof tanks with nitrogen blanketing instead of floating roof tanks (4X 3000 KL) with double seal have been provided for Naphtha tanks in Euro IV projects which results reduction of 4 MT/year of VOC. IV. Reduction in the consumption of Fresh Water (i) A Tertiary cum RO plant installed in 1991 for reclamation of city sewage about 2.5
MGD (475 KL/hr), which is first of its kind in Asia in magnitude and application wise. This plant has been de-bottlenecked during 2004-05 and the new plant has been commissioned in Mar’05 to increase the hydraulic recovery and reduce generation of solid waste (lime sludge).
(ii) Recycling and Reuse of 100% treated effluents for cooling water, Boiler Feed
Water(BFW) and Fire water. (iii) The CPCL has implemented an additional 2.5 MGD sewage reclamation plant in
2006. (iv) Seawater Desalination plant was commissioned for 5.8 MGD at a cost of Rs 231.34
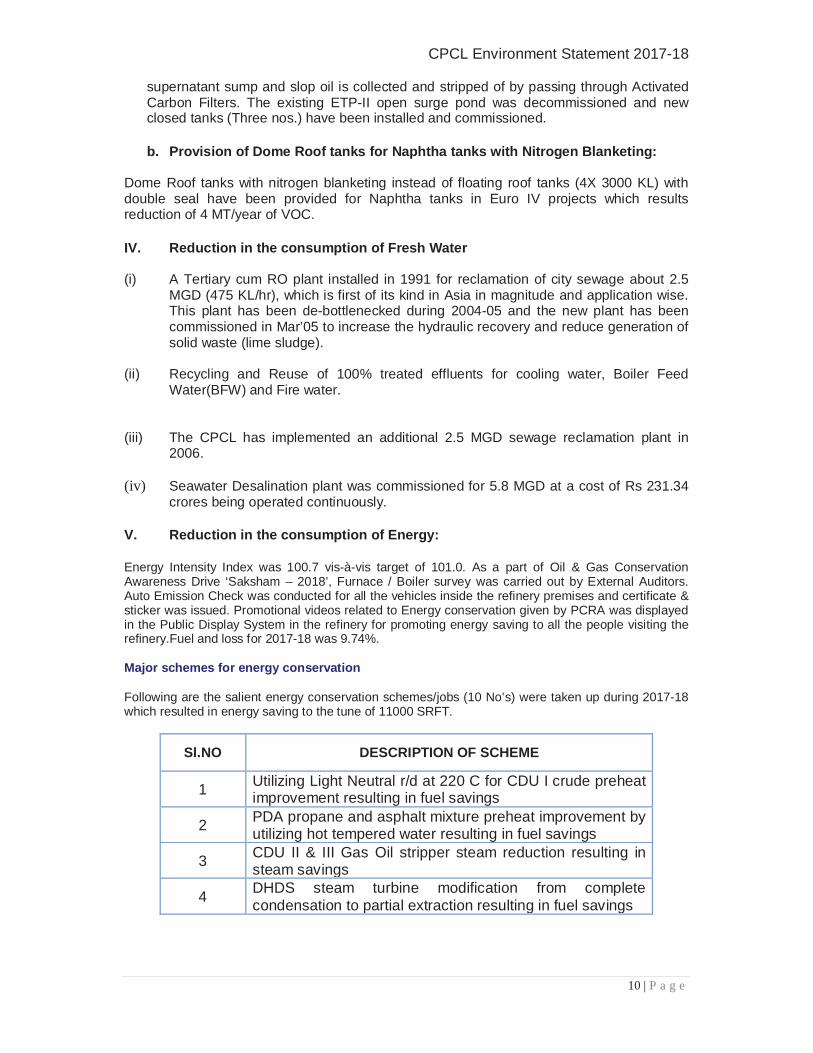
crores being operated continuously. V. Reduction in the consumption of Energy: Energy Intensity Index was 100.7 vis-à-vis target of 101.0. As a part of Oil & Gas Conservation Awareness Drive ‘Saksham – 2018’, Furnace / Boiler survey was carried out by External Auditors. Auto Emission Check was conducted for all the vehicles inside the refinery premises and certificate & sticker was issued. Promotional videos related to Energy conservation given by PCRA was displayed in the Public Display System in the refinery for promoting energy saving to all the people visiting the refinery.Fuel and loss for 2017-18 was 9.74%. Major schemes for energy conservation
Following are the salient energy conservation schemes/jobs (10 No’s) were taken up during 2017-18 which resulted in energy saving to the tune of 11000 SRFT.
Sl.NO DESCRIPTION OF SCHEME
1 Utilizing Light Neutral r/d at 220 C for CDU I crude preheat improvement resulting in fuel savings
2 PDA propane and asphalt mixture preheat improvement by utilizing hot tempered water resulting in fuel savings
3 CDU II & III Gas Oil stripper steam reduction resulting in steam savings
4 DHDS steam turbine modification from complete condensation to partial extraction resulting in fuel savings
CPCL Environment Statement 2017-18
11 | P a g e
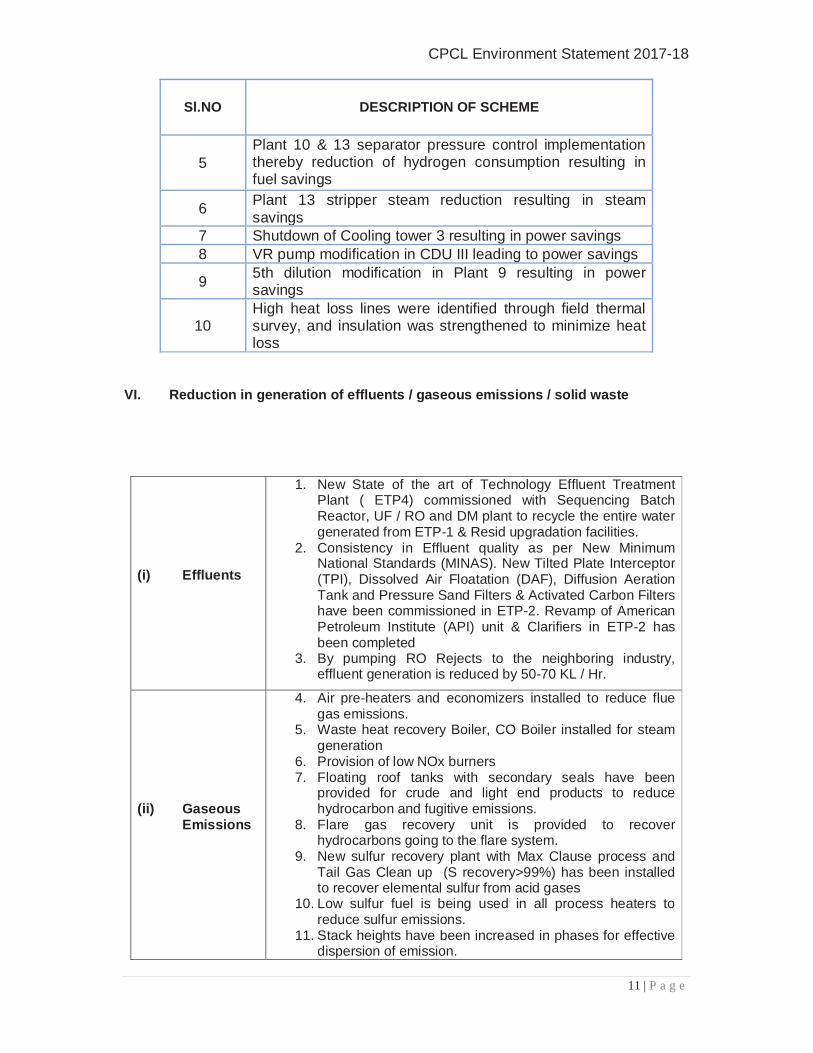
Sl.NO DESCRIPTION OF SCHEME
5 Plant 10 & 13 separator pressure control implementation thereby reduction of hydrogen consumption resulting in fuel savings
6 Plant 13 stripper steam reduction resulting in steam savings
7 Shutdown of Cooling tower 3 resulting in power savings 8 VR pump modification in CDU III leading to power savings
9 5th dilution modification in Plant 9 resulting in power savings
10 High heat loss lines were identified through field thermal survey, and insulation was strengthened to minimize heat loss
VI. Reduction in generation of effluents / gaseous emissions / solid waste
(i) Effluents
1. New State of the art of Technology Effluent Treatment Plant ( ETP4) commissioned with Sequencing Batch Reactor, UF / RO and DM plant to recycle the entire water generated from ETP-1 & Resid upgradation facilities.
2. Consistency in Effluent quality as per New Minimum National Standards (MINAS). New Tilted Plate Interceptor (TPI), Dissolved Air Floatation (DAF), Diffusion Aeration Tank and Pressure Sand Filters & Activated Carbon Filters have been commissioned in ETP-2. Revamp of American Petroleum Institute (API) unit & Clarifiers in ETP-2 has been completed
3. By pumping RO Rejects to the neighboring industry, effluent generation is reduced by 50-70 KL / Hr.
(ii) Gaseous Emissions
4. Air pre-heaters and economizers installed to reduce flue gas emissions.
5. Waste heat recovery Boiler, CO Boiler installed for steam generation
6. Provision of low NOx burners 7. Floating roof tanks with secondary seals have been
provided for crude and light end products to reduce hydrocarbon and fugitive emissions.
8. Flare gas recovery unit is provided to recover hydrocarbons going to the flare system.
9. New sulfur recovery plant with Max Clause process and Tail Gas Clean up (S recovery>99%) has been installed to recover elemental sulfur from acid gases
10. Low sulfur fuel is being used in all process heaters to reduce sulfur emissions.
11. Stack heights have been increased in phases for effective dispersion of emission.
CPCL Environment Statement 2017-18
12 | P a g e
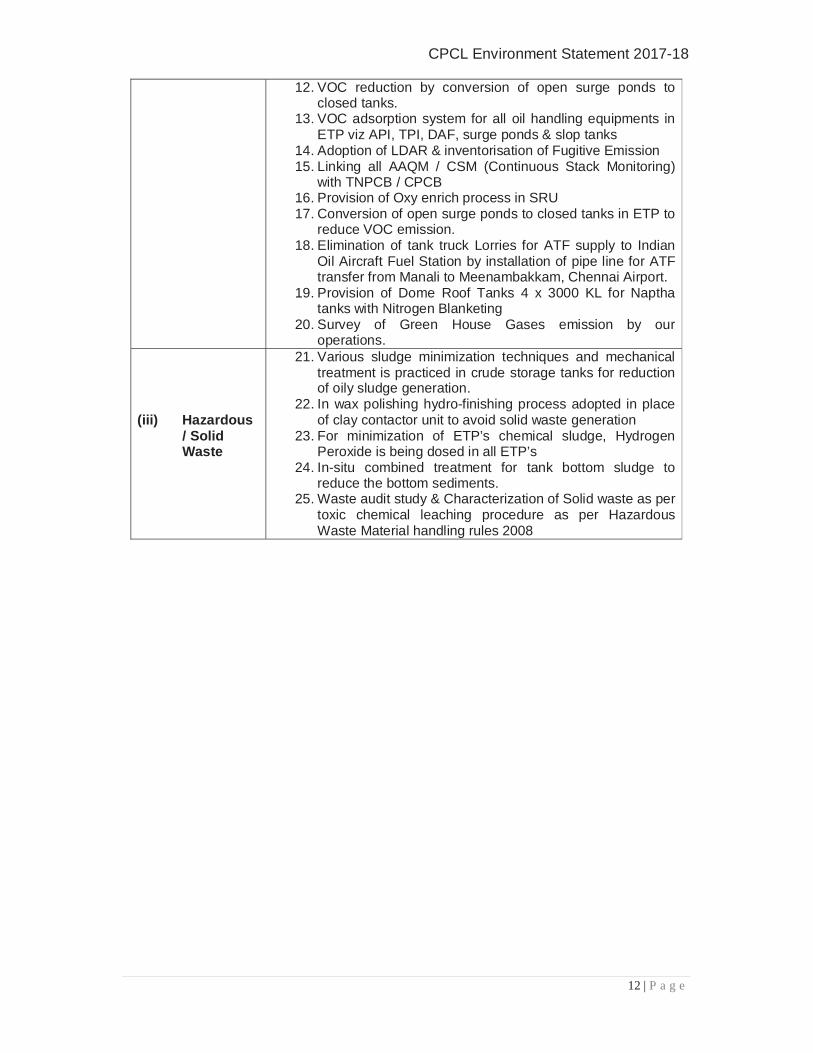
12. VOC reduction by conversion of open surge ponds to closed tanks.
13. VOC adsorption system for all oil handling equipments in ETP viz API, TPI, DAF, surge ponds & slop tanks
14. Adoption of LDAR & inventorisation of Fugitive Emission 15. Linking all AAQM / CSM (Continuous Stack Monitoring)
with TNPCB / CPCB 16. Provision of Oxy enrich process in SRU 17. Conversion of open surge ponds to closed tanks in ETP to
reduce VOC emission. 18. Elimination of tank truck Lorries for ATF supply to Indian
Oil Aircraft Fuel Station by installation of pipe line for ATF transfer from Manali to Meenambakkam, Chennai Airport.
19. Provision of Dome Roof Tanks 4 x 3000 KL for Naptha tanks with Nitrogen Blanketing
20. Survey of Green House Gases emission by our operations.
(iii) Hazardous / Solid Waste
21. Various sludge minimization techniques and mechanical treatment is practiced in crude storage tanks for reduction of oily sludge generation.
22. In wax polishing hydro-finishing process adopted in place of clay contactor unit to avoid solid waste generation
23. For minimization of ETP’s chemical sludge, Hydrogen Peroxide is being dosed in all ETP’s
24. In-situ combined treatment for tank bottom sludge to reduce the bottom sediments.
25. Waste audit study & Characterization of Solid waste as per toxic chemical leaching procedure as per Hazardous Waste Material handling rules 2008
CPCL Environment Statement 2017-18
13 | P a g e
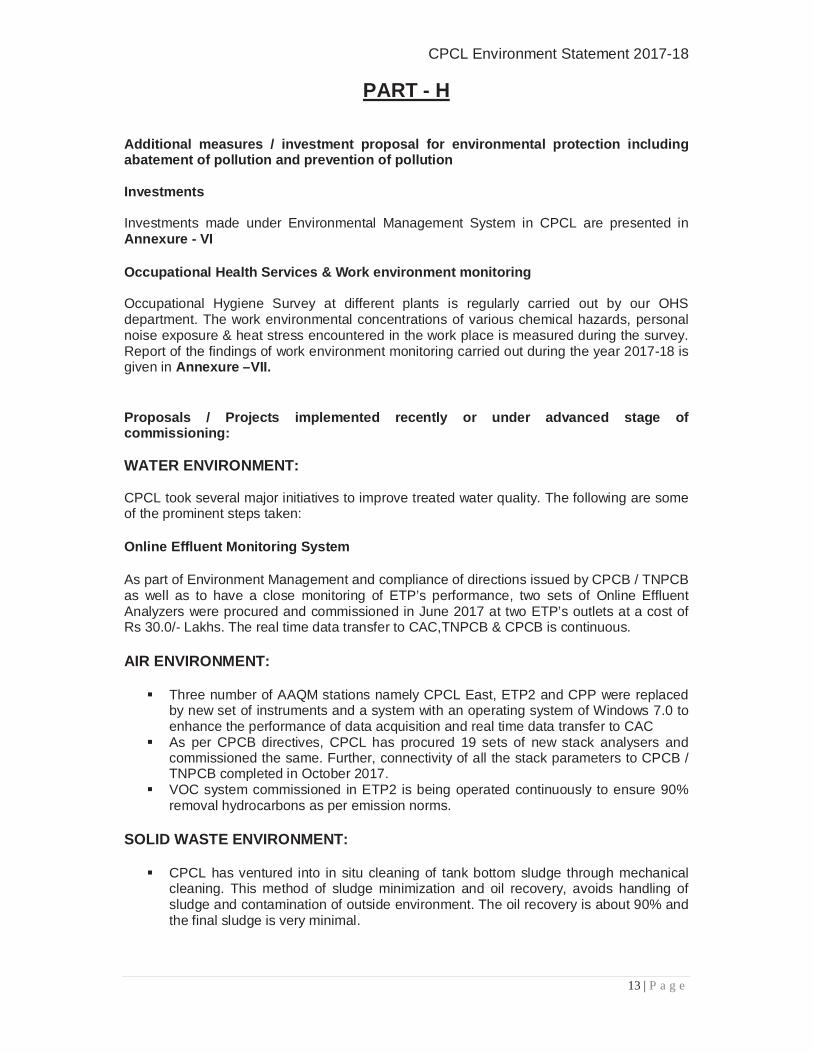
PART - H Additional measures / investment proposal for environmental protection including abatement of pollution and prevention of pollution Investments Investments made under Environmental Management System in CPCL are presented in Annexure - VI Occupational Health Services & Work environment monitoring Occupational Hygiene Survey at different plants is regularly carried out by our OHS department. The work environmental concentrations of various chemical hazards, personal noise exposure & heat stress encountered in the work place is measured during the survey. Report of the findings of work environment monitoring carried out during the year 2017-18 is given in Annexure –VII. Proposals / Projects implemented recently or under advanced stage of commissioning: WATER ENVIRONMENT: CPCL took several major initiatives to improve treated water quality. The following are some of the prominent steps taken: Online Effluent Monitoring System As part of Environment Management and compliance of directions issued by CPCB / TNPCB as well as to have a close monitoring of ETP’s performance, two sets of Online Effluent Analyzers were procured and commissioned in June 2017 at two ETP’s outlets at a cost of Rs 30.0/- Lakhs. The real time data transfer to CAC,TNPCB & CPCB is continuous. AIR ENVIRONMENT: Three number of AAQM stations namely CPCL East, ETP2 and CPP were replaced
by new set of instruments and a system with an operating system of Windows 7.0 to enhance the performance of data acquisition and real time data transfer to CAC
As per CPCB directives, CPCL has procured 19 sets of new stack analysers and commissioned the same. Further, connectivity of all the stack parameters to CPCB / TNPCB completed in October 2017.
VOC system commissioned in ETP2 is being operated continuously to ensure 90% removal hydrocarbons as per emission norms.
SOLID WASTE ENVIRONMENT: CPCL has ventured into in situ cleaning of tank bottom sludge through mechanical
cleaning. This method of sludge minimization and oil recovery, avoids handling of sludge and contamination of outside environment. The oil recovery is about 90% and the final sludge is very minimal.
CPCL Environment Statement 2017-18
14 | P a g e
PART – I
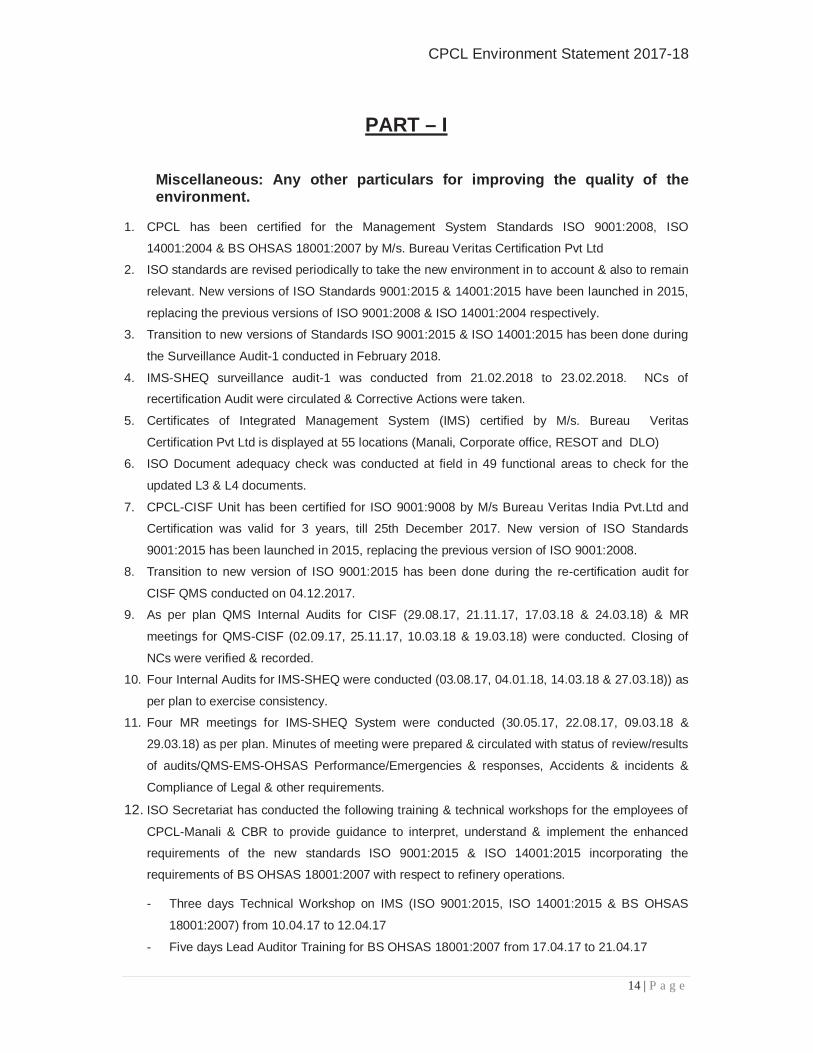
Miscellaneous: Any other particulars for improving the quality of the environment.
1. CPCL has been certified for the Management System Standards ISO 9001:2008, ISO
14001:2004 & BS OHSAS 18001:2007 by M/s. Bureau Veritas Certification Pvt Ltd
2. ISO standards are revised periodically to take the new environment in to account & also to remain
relevant. New versions of ISO Standards 9001:2015 & 14001:2015 have been launched in 2015,
replacing the previous versions of ISO 9001:2008 & ISO 14001:2004 respectively.
3. Transition to new versions of Standards ISO 9001:2015 & ISO 14001:2015 has been done during
the Surveillance Audit-1 conducted in February 2018.
4. IMS-SHEQ surveillance audit-1 was conducted from 21.02.2018 to 23.02.2018. NCs of
recertification Audit were circulated & Corrective Actions were taken.
5. Certificates of Integrated Management System (IMS) certified by M/s. Bureau Veritas
Certification Pvt Ltd is displayed at 55 locations (Manali, Corporate office, RESOT and DLO)
6. ISO Document adequacy check was conducted at field in 49 functional areas to check for the
updated L3 & L4 documents.
7. CPCL-CISF Unit has been certified for ISO 9001:9008 by M/s Bureau Veritas India Pvt.Ltd and
Certification was valid for 3 years, till 25th December 2017. New version of ISO Standards
9001:2015 has been launched in 2015, replacing the previous version of ISO 9001:2008.
8. Transition to new version of ISO 9001:2015 has been done during the re-certification audit for
CISF QMS conducted on 04.12.2017.
9. As per plan QMS Internal Audits for CISF (29.08.17, 21.11.17, 17.03.18 & 24.03.18) & MR
meetings for QMS-CISF (02.09.17, 25.11.17, 10.03.18 & 19.03.18) were conducted. Closing of
NCs were verified & recorded.
10. Four Internal Audits for IMS-SHEQ were conducted (03.08.17, 04.01.18, 14.03.18 & 27.03.18)) as
per plan to exercise consistency.
11. Four MR meetings for IMS-SHEQ System were conducted (30.05.17, 22.08.17, 09.03.18 &
29.03.18) as per plan. Minutes of meeting were prepared & circulated with status of review/results
of audits/QMS-EMS-OHSAS Performance/Emergencies & responses, Accidents & incidents &
Compliance of Legal & other requirements.
12. ISO Secretariat has conducted the following training & technical workshops for the employees of
CPCL-Manali & CBR to provide guidance to interpret, understand & implement the enhanced
requirements of the new standards ISO 9001:2015 & ISO 14001:2015 incorporating the
requirements of BS OHSAS 18001:2007 with respect to refinery operations.
- Three days Technical Workshop on IMS (ISO 9001:2015, ISO 14001:2015 & BS OHSAS
18001:2007) from 10.04.17 to 12.04.17
- Five days Lead Auditor Training for BS OHSAS 18001:2007 from 17.04.17 to 21.04.17
CPCL Environment Statement 2017-18
15 | P a g e
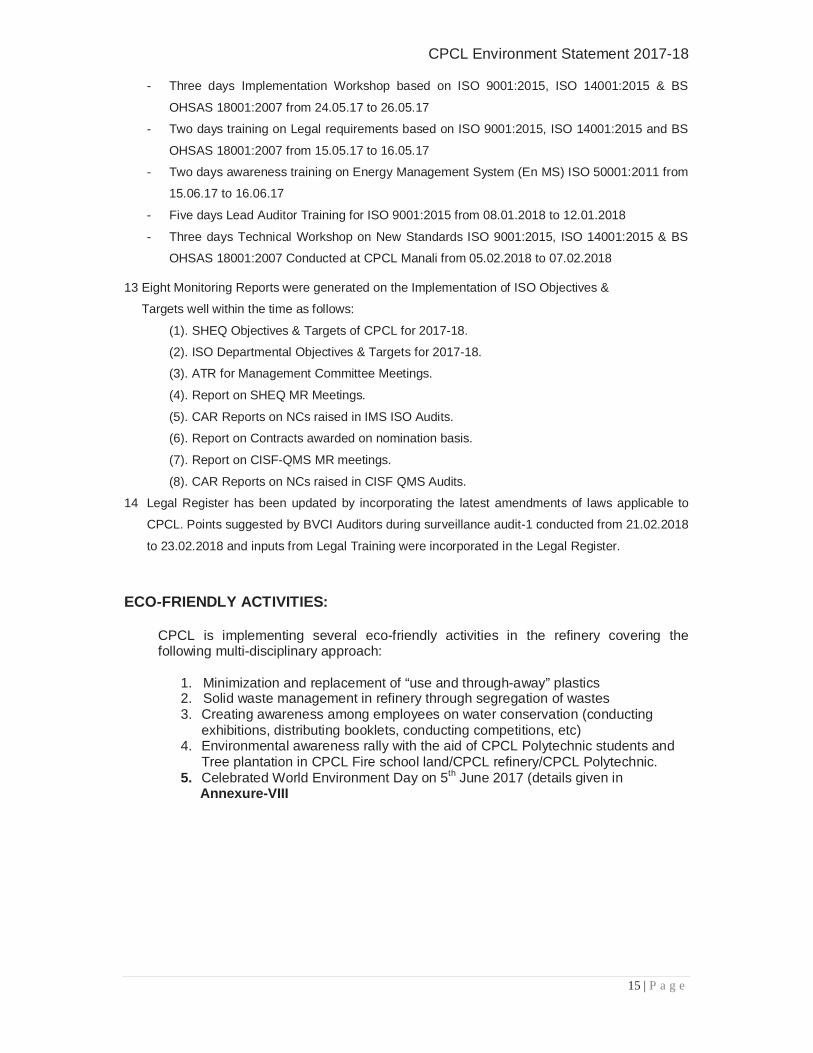
- Three days Implementation Workshop based on ISO 9001:2015, ISO 14001:2015 & BS
OHSAS 18001:2007 from 24.05.17 to 26.05.17
- Two days training on Legal requirements based on ISO 9001:2015, ISO 14001:2015 and BS
OHSAS 18001:2007 from 15.05.17 to 16.05.17
- Two days awareness training on Energy Management System (En MS) ISO 50001:2011 from
15.06.17 to 16.06.17
- Five days Lead Auditor Training for ISO 9001:2015 from 08.01.2018 to 12.01.2018
- Three days Technical Workshop on New Standards ISO 9001:2015, ISO 14001:2015 & BS
OHSAS 18001:2007 Conducted at CPCL Manali from 05.02.2018 to 07.02.2018
13 Eight Monitoring Reports were generated on the Implementation of ISO Objectives &
Targets well within the time as follows:
(1). SHEQ Objectives & Targets of CPCL for 2017-18.
(2). ISO Departmental Objectives & Targets for 2017-18.
(3). ATR for Management Committee Meetings.
(4). Report on SHEQ MR Meetings.
(5). CAR Reports on NCs raised in IMS ISO Audits.
(6). Report on Contracts awarded on nomination basis.
(7). Report on CISF-QMS MR meetings.
(8). CAR Reports on NCs raised in CISF QMS Audits.
14 Legal Register has been updated by incorporating the latest amendments of laws applicable to
CPCL. Points suggested by BVCI Auditors during surveillance audit-1 conducted from 21.02.2018
to 23.02.2018 and inputs from Legal Training were incorporated in the Legal Register.
ECO-FRIENDLY ACTIVITIES:
CPCL is implementing several eco-friendly activities in the refinery covering the following multi-disciplinary approach:
1. Minimization and replacement of “use and through-away” plastics 2. Solid waste management in refinery through segregation of wastes 3. Creating awareness among employees on water conservation (conducting
exhibitions, distributing booklets, conducting competitions, etc) 4. Environmental awareness rally with the aid of CPCL Polytechnic students and
Tree plantation in CPCL Fire school land/CPCL refinery/CPCL Polytechnic. 5. Celebrated World Environment Day on 5th June 2017 (details given in Annexure-VIII
CPCL Environment Statement 2017-18
16 | P a g e
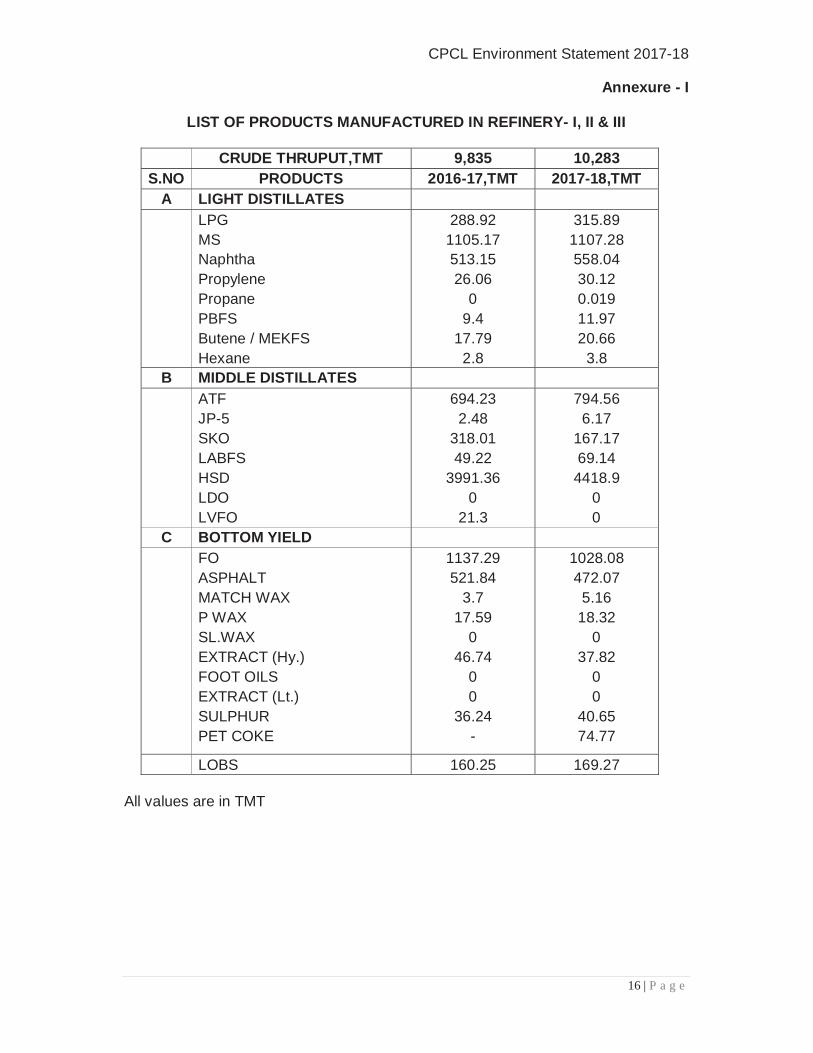
Annexure - I
LIST OF PRODUCTS MANUFACTURED IN REFINERY- I, II & III
CRUDE THRUPUT,TMT 9,835 10,283 S.NO PRODUCTS 2016-17,TMT 2017-18,TMT
A LIGHT DISTILLATES
LPG MS Naphtha Propylene Propane PBFS Butene / MEKFS Hexane
288.92 1105.17 513.15 26.06
0 9.4
17.79 2.8
315.89 1107.28 558.04 30.12 0.019 11.97 20.66
3.8 B MIDDLE DISTILLATES
ATF JP-5 SKO LABFS HSD LDO LVFO
694.23 2.48
318.01 49.22
3991.36 0
21.3
794.56 6.17
167.17 69.14 4418.9
0 0
C BOTTOM YIELD
FO ASPHALT MATCH WAX P WAX SL.WAX EXTRACT (Hy.) FOOT OILS EXTRACT (Lt.) SULPHUR PET COKE
1137.29 521.84
3.7 17.59
0 46.74
0 0
36.24 -
1028.08 472.07 5.16 18.32
0 37.82
0 0
40.65 74.77
LOBS 160.25 169.27 All values are in TMT
CPCL Environment Statement 2017-18
17 | P a g e
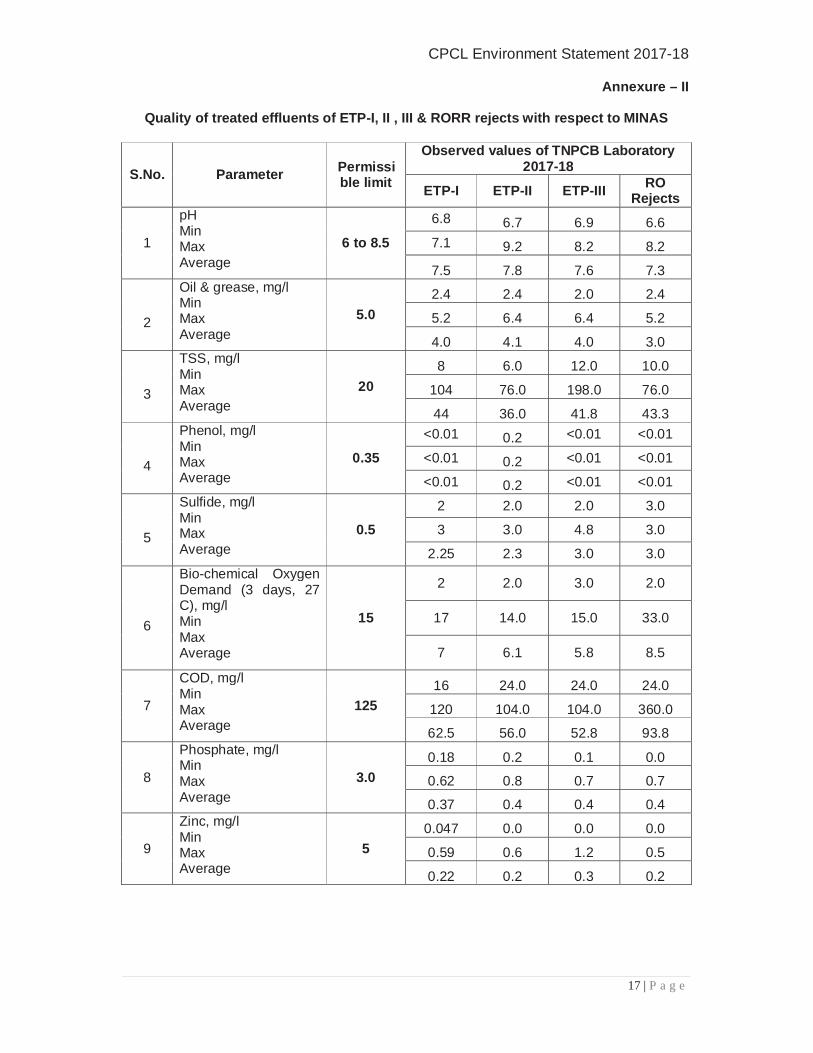
Annexure – II
Quality of treated effluents of ETP-I, II , III & RORR rejects with respect to MINAS
S.No. Parameter Permissible limit
Observed values of TNPCB Laboratory 2017-18
ETP-I ETP-II ETP-III RO
Rejects
1
pH Min Max Average
6 to 8.5
6.8 6.7 6.9 6.6
7.1 9.2 8.2 8.2
7.5 7.8 7.6 7.3
2
Oil & grease, mg/l Min Max Average
5.0
2.4 2.4 2.0 2.4
5.2 6.4 6.4 5.2
4.0 4.1 4.0 3.0
3
TSS, mg/l Min Max Average
20
8 6.0 12.0 10.0
104 76.0 198.0 76.0
44 36.0 41.8 43.3
4
Phenol, mg/l Min Max Average
0.35
<0.01 0.2 <0.01 <0.01
<0.01 0.2 <0.01 <0.01
<0.01 0.2 <0.01 <0.01
5
Sulfide, mg/l Min Max Average
0.5
2 2.0 2.0 3.0
3 3.0 4.8 3.0
2.25 2.3 3.0 3.0
6
Bio-chemical Oxygen Demand (3 days, 27 C), mg/l Min Max Average
15
2 2.0 3.0 2.0
17 14.0 15.0 33.0
7 6.1 5.8 8.5
7
COD, mg/l Min Max Average
125
16 24.0 24.0 24.0
120 104.0 104.0 360.0
62.5 56.0 52.8 93.8
8
Phosphate, mg/l Min Max Average
3.0
0.18 0.2 0.1 0.0
0.62 0.8 0.7 0.7
0.37 0.4 0.4 0.4
9
Zinc, mg/l Min Max Average
5
0.047 0.0 0.0 0.0
0.59 0.6 1.2 0.5
0.22 0.2 0.3 0.2
CPCL Environment Statement 2017-18
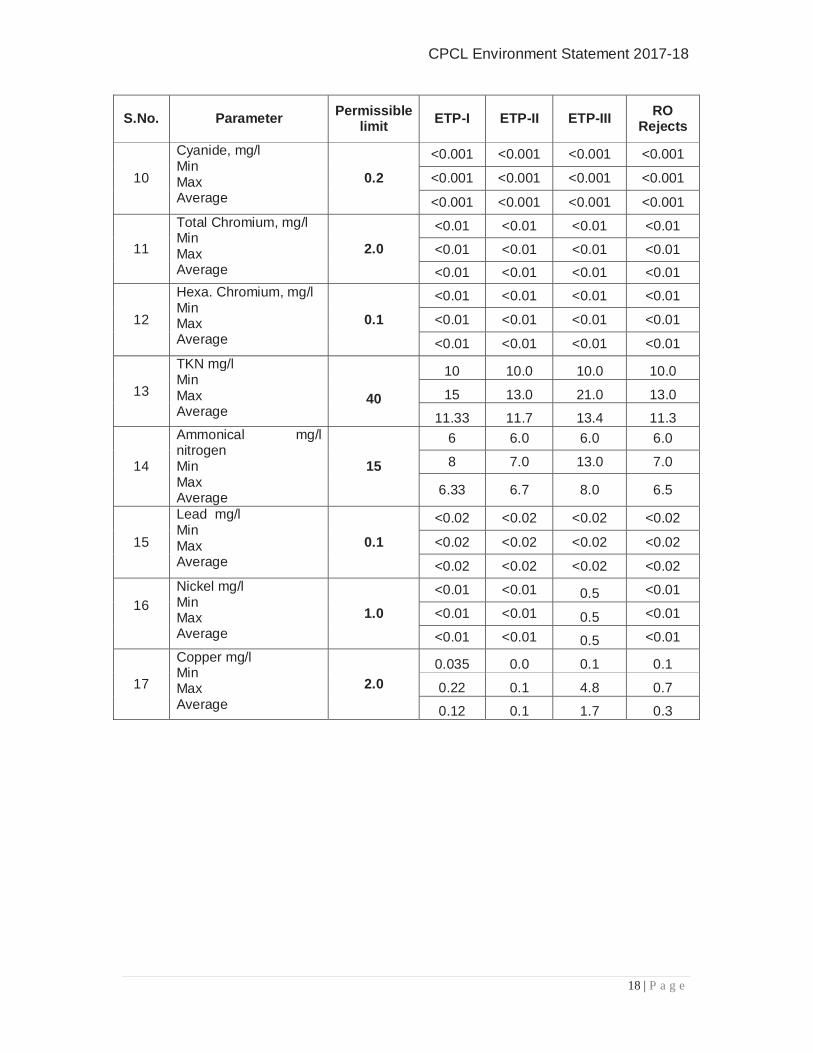
18 | P a g e
S.No. Parameter Permissible limit
ETP-I ETP-II ETP-III RO Rejects
10
Cyanide, mg/l Min Max Average
0.2
<0.001 <0.001 <0.001 <0.001
<0.001 <0.001 <0.001 <0.001
<0.001 <0.001 <0.001 <0.001
11
Total Chromium, mg/l Min Max Average
2.0
<0.01 <0.01 <0.01 <0.01
<0.01 <0.01 <0.01 <0.01
<0.01 <0.01 <0.01 <0.01
12
Hexa. Chromium, mg/l Min Max Average
0.1
<0.01 <0.01 <0.01 <0.01
<0.01 <0.01 <0.01 <0.01
<0.01 <0.01 <0.01 <0.01
13
TKN mg/l Min Max Average
40
10 10.0 10.0 10.0
15 13.0 21.0 13.0
11.33 11.7 13.4 11.3
14
Ammonical mg/l nitrogen Min Max Average
15
6 6.0 6.0 6.0
8 7.0 13.0 7.0
6.33 6.7 8.0 6.5
15
Lead mg/l Min Max Average
0.1
<0.02 <0.02 <0.02 <0.02
<0.02 <0.02 <0.02 <0.02
<0.02 <0.02 <0.02 <0.02
16
Nickel mg/l Min Max Average
1.0
<0.01 <0.01 0.5 <0.01
<0.01 <0.01 0.5 <0.01
<0.01 <0.01 0.5 <0.01
17
Copper mg/l Min Max Average
2.0
0.035 0.0 0.1 0.1
0.22 0.1 4.8 0.7
0.12 0.1 1.7 0.3
CPCL Environment Statement 2017-18
19 | P a g e
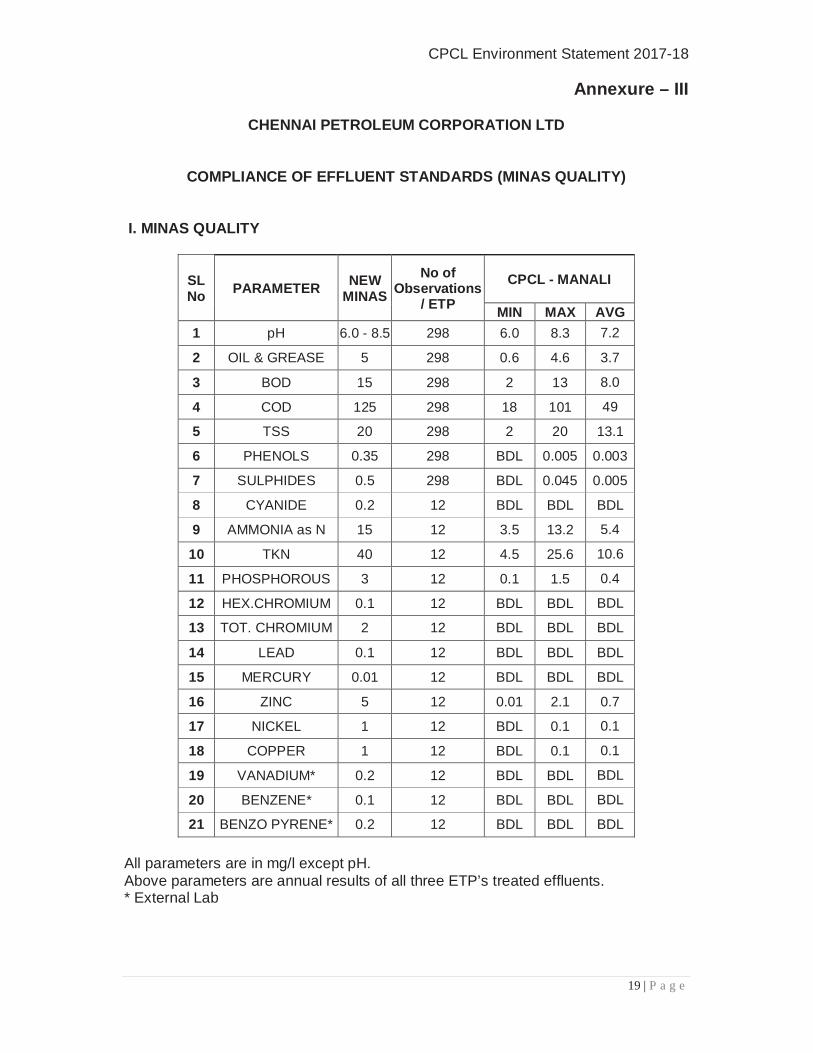
Annexure – III
CHENNAI PETROLEUM CORPORATION LTD
COMPLIANCE OF EFFLUENT STANDARDS (MINAS QUALITY)
I. MINAS QUALITY
SL No
PARAMETER NEW
MINAS
No of Observations
/ ETP
CPCL - MANALI
MIN MAX AVG
1 pH 6.0 - 8.5 298 6.0 8.3 7.2
2 OIL & GREASE 5 298 0.6 4.6 3.7
3 BOD 15 298 2 13 8.0
4 COD 125 298 18 101 49
5 TSS 20 298 2 20 13.1
6 PHENOLS 0.35 298 BDL 0.005 0.003
7 SULPHIDES 0.5 298 BDL 0.045 0.005
8 CYANIDE 0.2 12 BDL BDL BDL
9 AMMONIA as N 15 12 3.5 13.2 5.4
10 TKN 40 12 4.5 25.6 10.6
11 PHOSPHOROUS 3 12 0.1 1.5 0.4
12 HEX.CHROMIUM 0.1 12 BDL BDL BDL
13 TOT. CHROMIUM 2 12 BDL BDL BDL
14 LEAD 0.1 12 BDL BDL BDL
15 MERCURY 0.01 12 BDL BDL BDL
16 ZINC 5 12 0.01 2.1 0.7
17 NICKEL 1 12 BDL 0.1 0.1
18 COPPER 1 12 BDL 0.1 0.1
19 VANADIUM* 0.2 12 BDL BDL BDL
20 BENZENE* 0.1 12 BDL BDL BDL
21 BENZO PYRENE* 0.2 12 BDL BDL BDL
All parameters are in mg/l except pH. Above parameters are annual results of all three ETP’s treated effluents. * External Lab
CPCL Environment Statement 2017-18
20 | P a g e
Annexure-IV
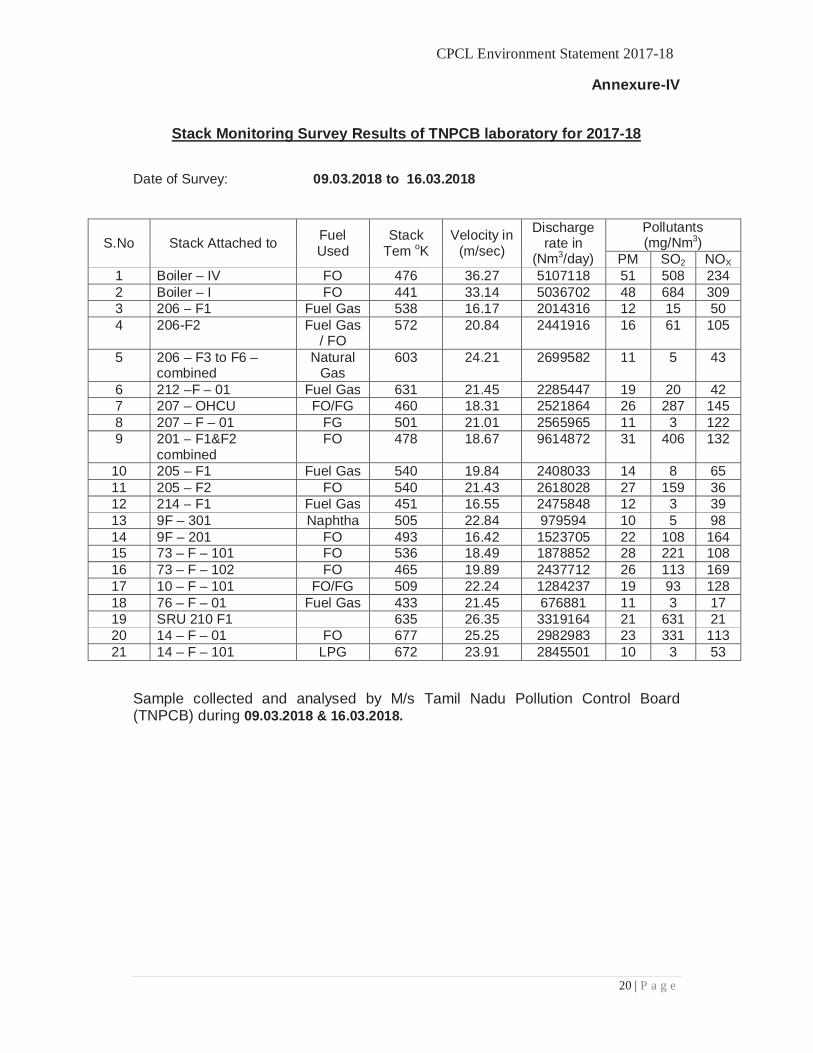
Stack Monitoring Survey Results of TNPCB laboratory for 2017-18
Date of Survey: 09.03.2018 to 16.03.2018
S.No Stack Attached to Fuel Used
Stack Tem oK
Velocity in (m/sec)
Discharge rate in
(Nm3/day)
Pollutants (mg/Nm3)
PM SO2 NOX 1 Boiler – IV FO 476 36.27 5107118 51 508 234 2 Boiler – I FO 441 33.14 5036702 48 684 309 3 206 – F1 Fuel Gas 538 16.17 2014316 12 15 50 4 206-F2 Fuel Gas
/ FO 572 20.84 2441916 16 61 105
5 206 – F3 to F6 – combined
Natural Gas
603 24.21 2699582 11 5 43
6 212 –F – 01 Fuel Gas 631 21.45 2285447 19 20 42 7 207 – OHCU FO/FG 460 18.31 2521864 26 287 145 8 207 – F – 01 FG 501 21.01 2565965 11 3 122 9 201 – F1&F2
combined FO 478 18.67 9614872 31 406 132
10 205 – F1 Fuel Gas 540 19.84 2408033 14 8 65 11 205 – F2 FO 540 21.43 2618028 27 159 36 12 214 – F1 Fuel Gas 451 16.55 2475848 12 3 39 13 9F – 301 Naphtha 505 22.84 979594 10 5 98 14 9F – 201 FO 493 16.42 1523705 22 108 164 15 73 – F – 101 FO 536 18.49 1878852 28 221 108 16 73 – F – 102 FO 465 19.89 2437712 26 113 169 17 10 – F – 101 FO/FG 509 22.24 1284237 19 93 128 18 76 – F – 01 Fuel Gas 433 21.45 676881 11 3 17 19 SRU 210 F1 635 26.35 3319164 21 631 21 20 14 – F – 01 FO 677 25.25 2982983 23 331 113 21 14 – F – 101 LPG 672 23.91 2845501 10 3 53
Sample collected and analysed by M/s Tamil Nadu Pollution Control Board (TNPCB) during 09.03.2018 & 16.03.2018.
CPCL Environment Statement 2017-18
21 | P a g e
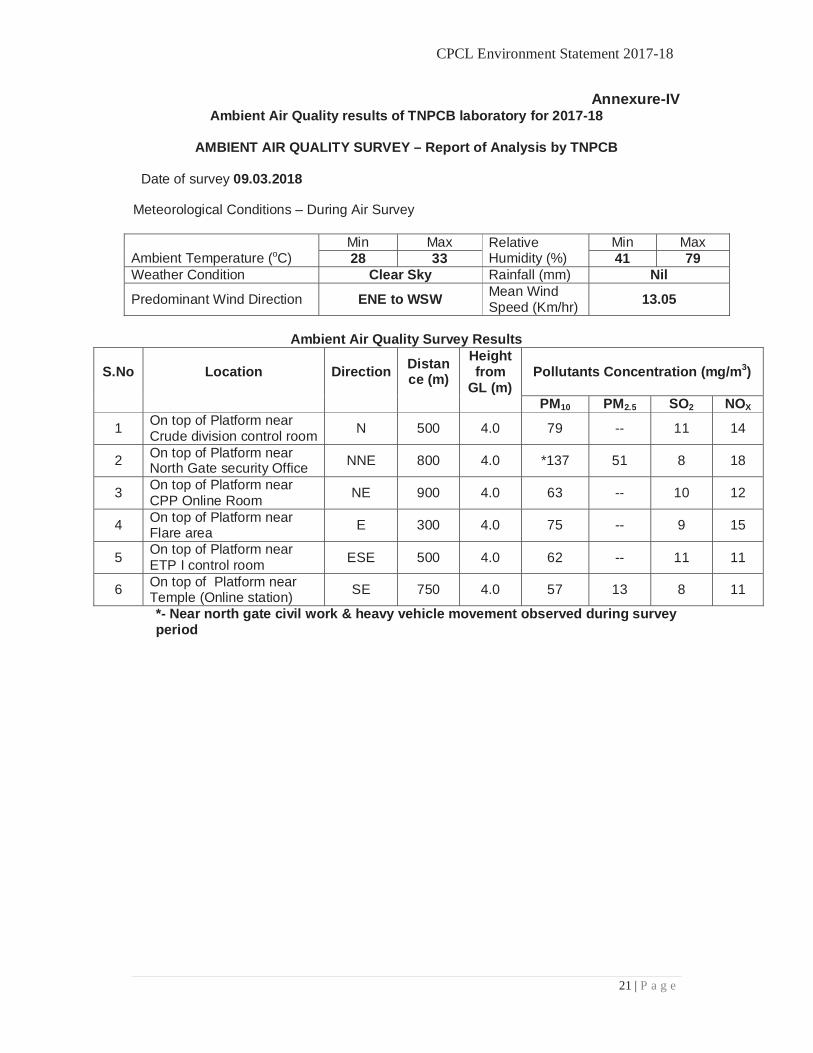
Annexure-IV
Ambient Air Quality results of TNPCB laboratory for 2017-18
AMBIENT AIR QUALITY SURVEY – Report of Analysis by TNPCB
Date of survey 09.03.2018
Meteorological Conditions – During Air Survey Ambient Temperature (oC)
Min Max Relative Humidity (%)
Min Max 28 33 41 79
Weather Condition Clear Sky Rainfall (mm) Nil
Predominant Wind Direction ENE to WSW Mean Wind Speed (Km/hr)
13.05
Ambient Air Quality Survey Results
S.No Location Direction Distance (m)
Height from
GL (m) Pollutants Concentration (mg/m3)
PM10 PM2.5 SO2 NOX
1 On top of Platform near Crude division control room
N 500 4.0 79 -- 11 14
2 On top of Platform near North Gate security Office NNE 800 4.0 *137 51 8 18
3 On top of Platform near CPP Online Room
NE 900 4.0 63 -- 10 12
4 On top of Platform near Flare area
E 300 4.0 75 -- 9 15
5 On top of Platform near ETP I control room ESE 500 4.0 62 -- 11 11
6 On top of Platform near Temple (Online station)
SE 750 4.0 57 13 8 11
*- Near north gate civil work & heavy vehicle movement observed during survey period
CPCL Environment Statement 2017-18
22 | P a g e
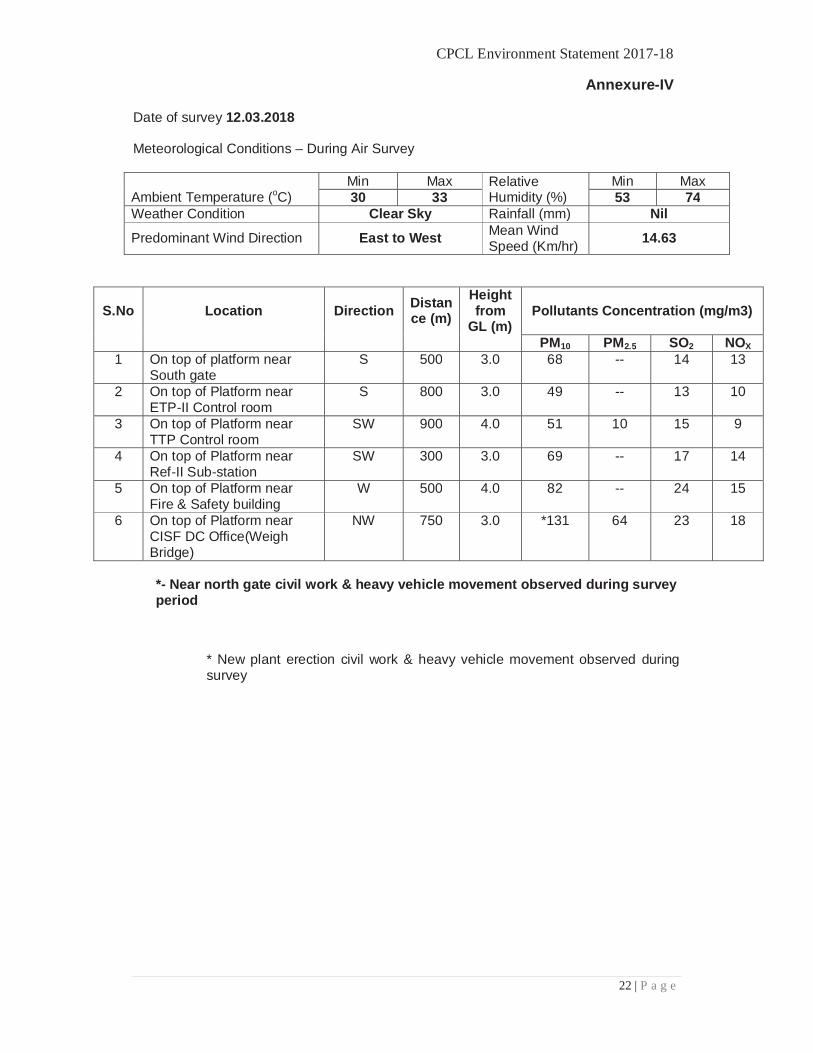
Annexure-IV Date of survey 12.03.2018 Meteorological Conditions – During Air Survey Ambient Temperature (oC)
Min Max Relative Humidity (%)
Min Max 30 33 53 74
Weather Condition Clear Sky Rainfall (mm) Nil
Predominant Wind Direction East to West Mean Wind Speed (Km/hr)
14.63
S.No Location Direction Distance (m)
Height from
GL (m) Pollutants Concentration (mg/m3)
PM10 PM2.5 SO2 NOX 1 On top of platform near
South gate S 500 3.0 68 -- 14 13
2 On top of Platform near ETP-II Control room
S 800 3.0 49 -- 13 10
3 On top of Platform near TTP Control room
SW 900 4.0 51 10 15 9
4 On top of Platform near Ref-II Sub-station
SW 300 3.0 69 -- 17 14
5 On top of Platform near Fire & Safety building
W 500 4.0 82 -- 24 15
6 On top of Platform near CISF DC Office(Weigh Bridge)
NW 750 3.0 *131 64 23 18
*- Near north gate civil work & heavy vehicle movement observed during survey period
* New plant erection civil work & heavy vehicle movement observed during survey
CPCL Environment Statement 2017-18
23 | P a g e
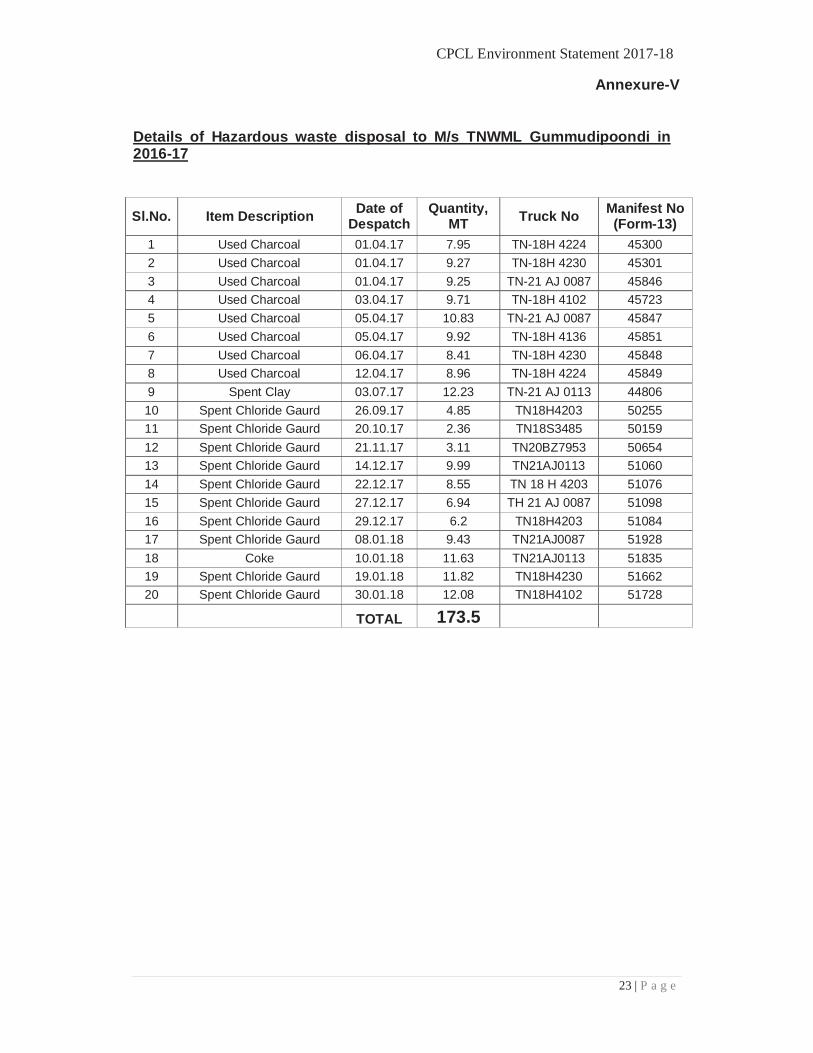
Annexure-V
Details of Hazardous waste disposal to M/s TNWML Gummudipoondi in 2016-17
Sl.No. Item Description Date of
Despatch Quantity,
MT Truck No Manifest No (Form-13)
1 Used Charcoal 01.04.17 7.95 TN-18H 4224 45300
2 Used Charcoal 01.04.17 9.27 TN-18H 4230 45301
3 Used Charcoal 01.04.17 9.25 TN-21 AJ 0087 45846
4 Used Charcoal 03.04.17 9.71 TN-18H 4102 45723
5 Used Charcoal 05.04.17 10.83 TN-21 AJ 0087 45847
6 Used Charcoal 05.04.17 9.92 TN-18H 4136 45851
7 Used Charcoal 06.04.17 8.41 TN-18H 4230 45848
8 Used Charcoal 12.04.17 8.96 TN-18H 4224 45849
9 Spent Clay 03.07.17 12.23 TN-21 AJ 0113 44806
10 Spent Chloride Gaurd 26.09.17 4.85 TN18H4203 50255
11 Spent Chloride Gaurd 20.10.17 2.36 TN18S3485 50159
12 Spent Chloride Gaurd 21.11.17 3.11 TN20BZ7953 50654
13 Spent Chloride Gaurd 14.12.17 9.99 TN21AJ0113 51060
14 Spent Chloride Gaurd 22.12.17 8.55 TN 18 H 4203 51076
15 Spent Chloride Gaurd 27.12.17 6.94 TH 21 AJ 0087 51098
16 Spent Chloride Gaurd 29.12.17 6.2 TN18H4203 51084
17 Spent Chloride Gaurd 08.01.18 9.43 TN21AJ0087 51928
18 Coke 10.01.18 11.63 TN21AJ0113 51835
19 Spent Chloride Gaurd 19.01.18 11.82 TN18H4230 51662
20 Spent Chloride Gaurd 30.01.18 12.08 TN18H4102 51728
TOTAL 173.5
CPCL Environment Statement 2017-18
24 | P a g e
Annexure-VI
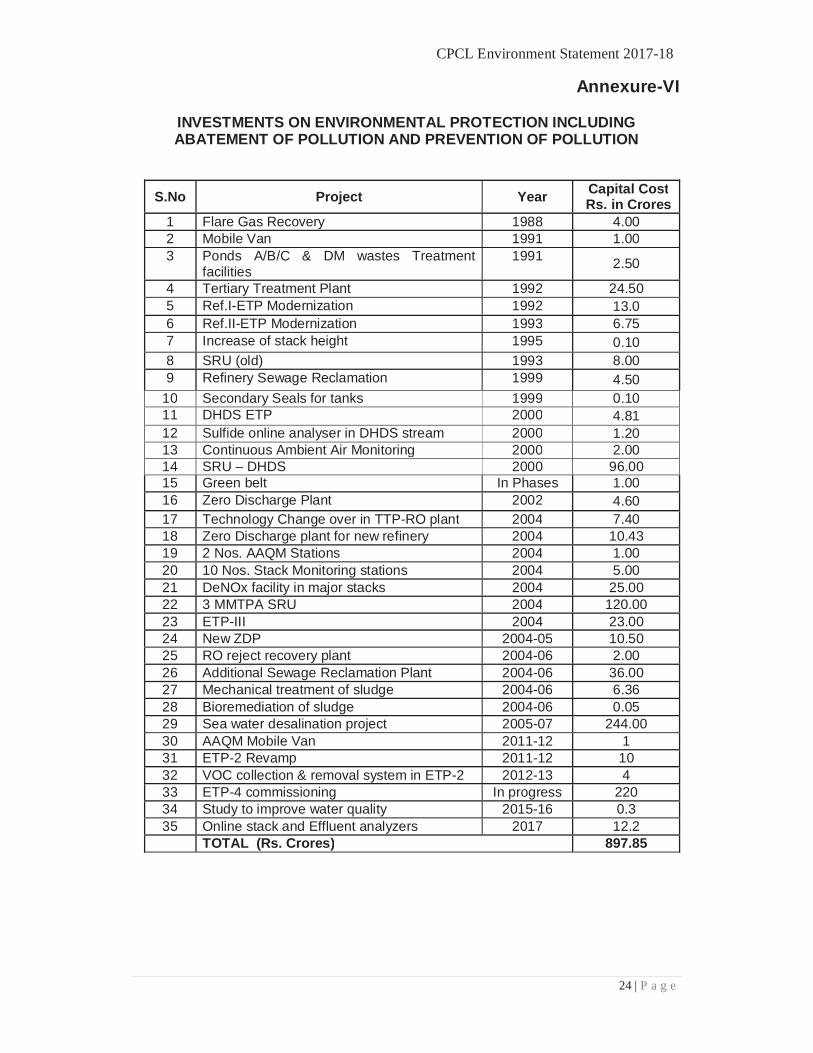
INVESTMENTS ON ENVIRONMENTAL PROTECTION INCLUDING ABATEMENT OF POLLUTION AND PREVENTION OF POLLUTION
S.No Project Year Capital Cost Rs. in Crores
1 Flare Gas Recovery 1988 4.00 2 Mobile Van 1991 1.00 3 Ponds A/B/C & DM wastes Treatment
facilities 1991 2.50
4 Tertiary Treatment Plant 1992 24.50 5 Ref.I-ETP Modernization 1992 13.0 6 Ref.II-ETP Modernization 1993 6.75 7 Increase of stack height 1995 0.10 8 SRU (old) 1993 8.00 9 Refinery Sewage Reclamation 1999 4.50
10 Secondary Seals for tanks 1999 0.10 11 DHDS ETP 2000 4.81 12 Sulfide online analyser in DHDS stream 2000 1.20 13 Continuous Ambient Air Monitoring 2000 2.00 14 SRU – DHDS 2000 96.00 15 Green belt In Phases 1.00 16 Zero Discharge Plant 2002 4.60 17 Technology Change over in TTP-RO plant 2004 7.40 18 Zero Discharge plant for new refinery 2004 10.43 19 2 Nos. AAQM Stations 2004 1.00 20 10 Nos. Stack Monitoring stations 2004 5.00 21 DeNOx facility in major stacks 2004 25.00 22 3 MMTPA SRU 2004 120.00 23 ETP-III 2004 23.00 24 New ZDP 2004-05 10.50 25 RO reject recovery plant 2004-06 2.00 26 Additional Sewage Reclamation Plant 2004-06 36.00 27 Mechanical treatment of sludge 2004-06 6.36 28 Bioremediation of sludge 2004-06 0.05 29 Sea water desalination project 2005-07 244.00 30 AAQM Mobile Van 2011-12 1 31 ETP-2 Revamp 2011-12 10 32 VOC collection & removal system in ETP-2 2012-13 4 33 ETP-4 commissioning In progress 220 34 Study to improve water quality 2015-16 0.3 35 Online stack and Effluent analyzers 2017 12.2
TOTAL (Rs. Crores) 897.85
CPCL Environment Statement 2017-18
25 | P a g e
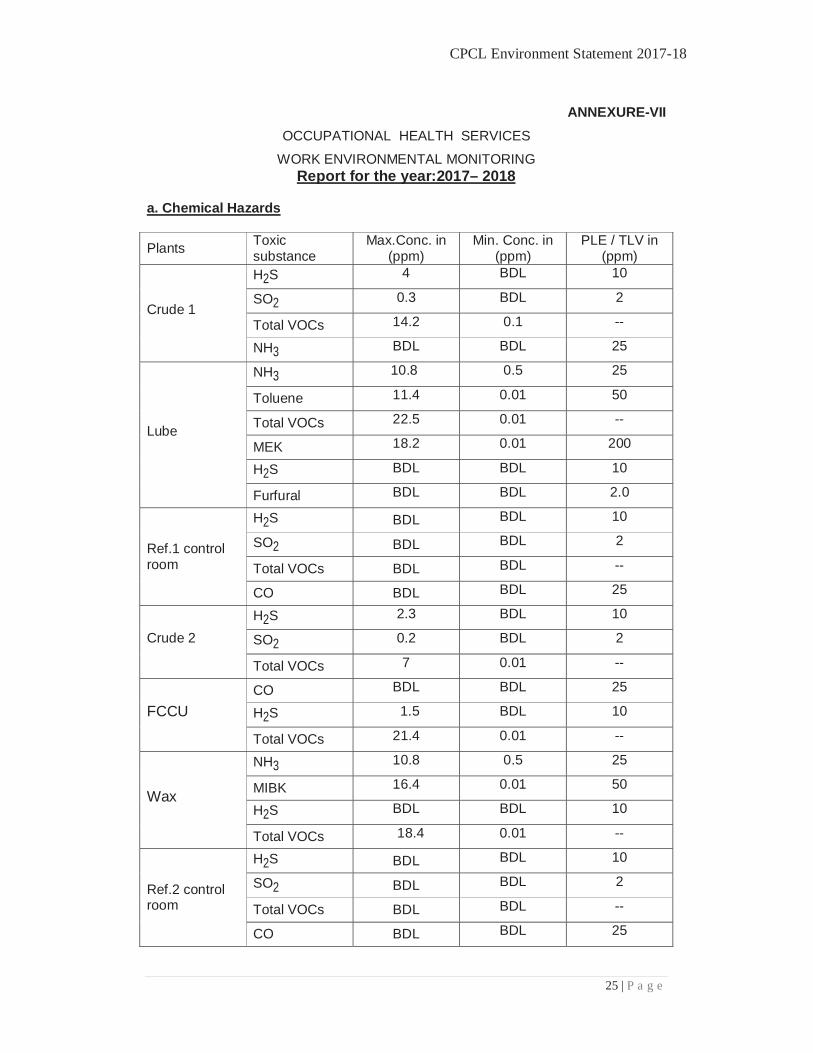
ANNEXURE-VII
OCCUPATIONAL HEALTH SERVICES
WORK ENVIRONMENTAL MONITORING Report for the year:2017– 2018
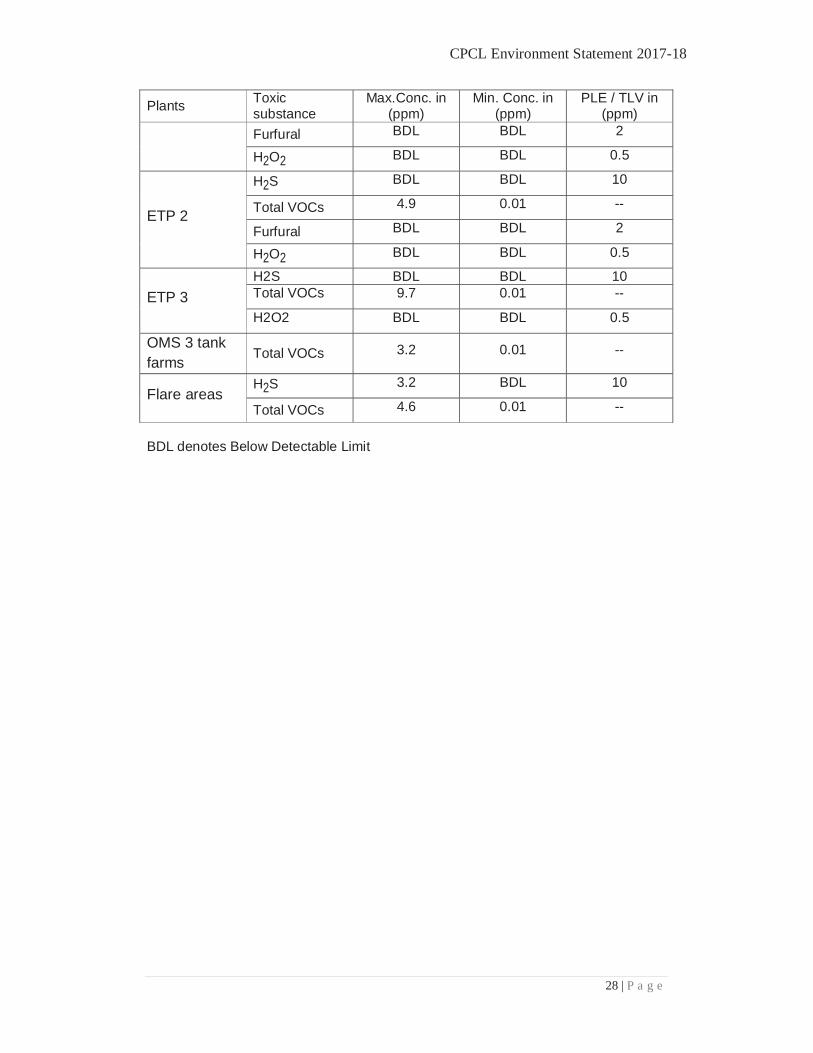
a. Chemical Hazards
Plants Toxic substance
Max.Conc. in (ppm)
Min. Conc. in (ppm)
PLE / TLV in (ppm)
Crude 1
H2S 4 BDL 10
SO2 0.3 BDL 2
Total VOCs 14.2 0.1 --
NH3 BDL BDL 25
Lube
NH3 10.8 0.5 25
Toluene 11.4 0.01 50
Total VOCs 22.5 0.01 --
MEK 18.2 0.01 200
H2S BDL BDL 10
Furfural BDL BDL 2.0
Ref.1 control room
H2S BDL BDL 10
SO2 BDL BDL 2
Total VOCs BDL BDL --
CO BDL BDL 25
Crude 2
H2S 2.3 BDL 10
SO2 0.2 BDL 2
Total VOCs 7 0.01 --
FCCU
CO BDL BDL 25
H2S 1.5 BDL 10
Total VOCs 21.4 0.01 --
Wax
NH3 10.8 0.5 25
MIBK 16.4 0.01 50
H2S BDL BDL 10
Total VOCs 18.4 0.01 --
Ref.2 control room
H2S BDL BDL 10
SO2 BDL BDL 2
Total VOCs BDL BDL --
CO BDL BDL 25
CPCL Environment Statement 2017-18
26 | P a g e
Plants Toxic substance
Max.Conc. in (ppm)
Min. Conc. in (ppm)
PLE / TLV in (ppm)
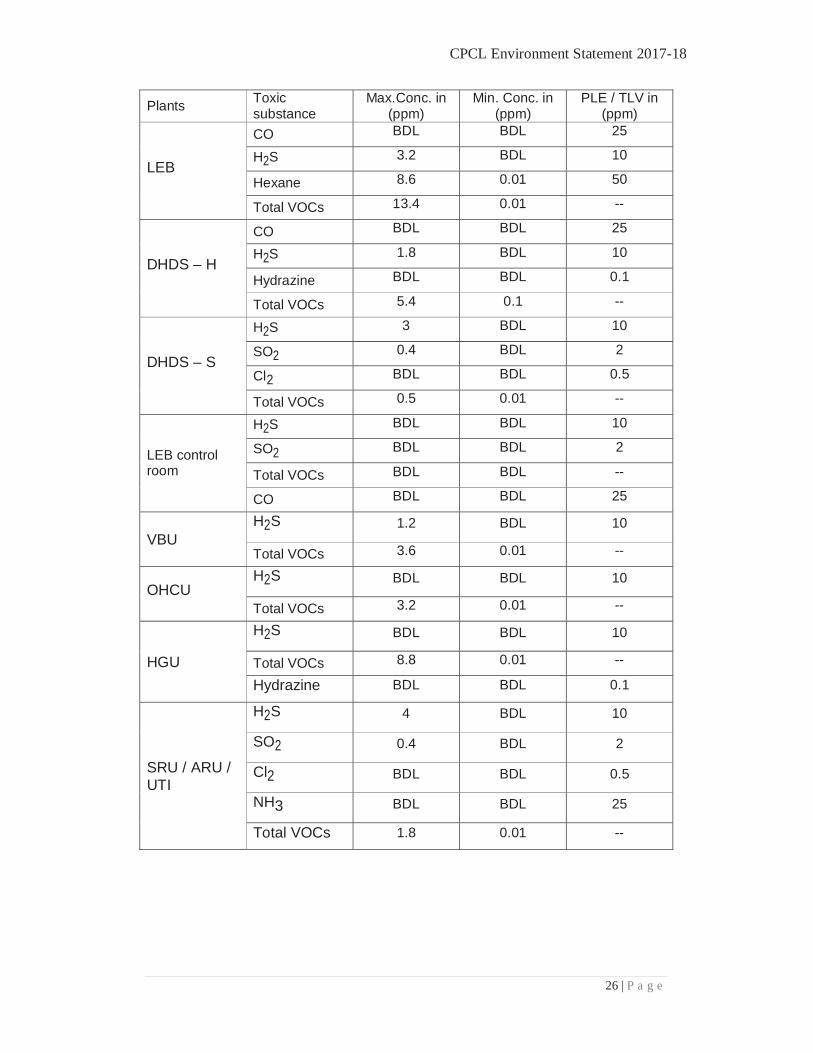
LEB
CO BDL BDL 25
H2S 3.2 BDL 10
Hexane 8.6 0.01 50
Total VOCs 13.4 0.01 --
DHDS – H
CO BDL BDL 25
H2S 1.8 BDL 10
Hydrazine BDL BDL 0.1
Total VOCs 5.4 0.1 --
DHDS – S
H2S 3 BDL 10
SO2 0.4 BDL 2
Cl2 BDL BDL 0.5
Total VOCs 0.5 0.01 --
LEB control room
H2S BDL BDL 10
SO2 BDL BDL 2
Total VOCs BDL BDL --
CO BDL BDL 25
VBU H2S 1.2 BDL 10
Total VOCs 3.6 0.01 --
OHCU H2S BDL BDL 10
Total VOCs 3.2 0.01 --
HGU
H2S BDL BDL 10
Total VOCs 8.8 0.01 --
Hydrazine BDL BDL 0.1
SRU / ARU / UTI
H2S 4 BDL 10
SO2 0.4 BDL 2
Cl2 BDL BDL 0.5
NH3 BDL BDL 25
Total VOCs 1.8 0.01 --
CPCL Environment Statement 2017-18
27 | P a g e
Plants Toxic substance
Max.Conc. in (ppm)
Min. Conc. in (ppm)
PLE / TLV in (ppm)
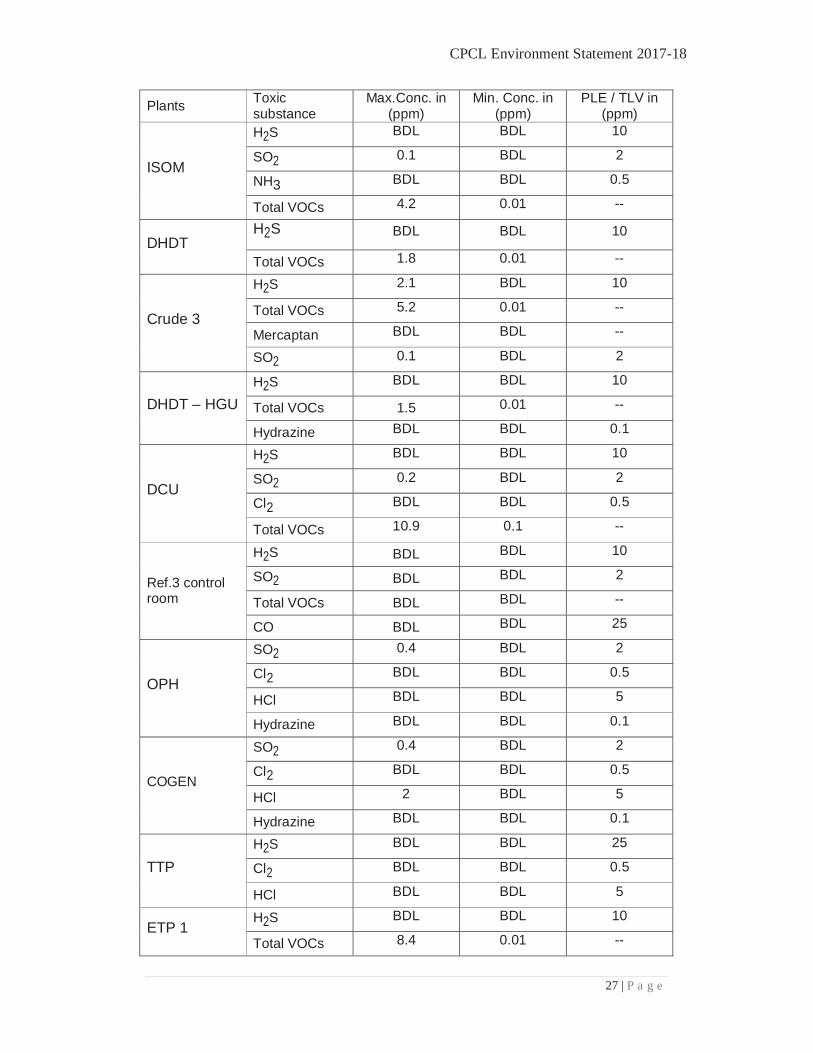
ISOM
H2S BDL BDL 10
SO2 0.1 BDL 2
NH3 BDL BDL 0.5
Total VOCs 4.2 0.01 --
DHDT H2S BDL BDL 10
Total VOCs 1.8 0.01 --
Crude 3
H2S 2.1 BDL 10
Total VOCs 5.2 0.01 --
Mercaptan BDL BDL --
SO2 0.1 BDL 2
DHDT – HGU
H2S BDL BDL 10
Total VOCs 1.5 0.01 --
Hydrazine BDL BDL 0.1
DCU
H2S BDL BDL 10
SO2 0.2 BDL 2
Cl2 BDL BDL 0.5
Total VOCs 10.9 0.1 --
Ref.3 control room
H2S BDL BDL 10
SO2 BDL BDL 2
Total VOCs BDL BDL --
CO BDL BDL 25
OPH
SO2 0.4 BDL 2
Cl2 BDL BDL 0.5
HCl BDL BDL 5
Hydrazine BDL BDL 0.1
COGEN
SO2 0.4 BDL 2
Cl2 BDL BDL 0.5
HCl 2 BDL 5
Hydrazine BDL BDL 0.1
TTP
H2S BDL BDL 25
Cl2 BDL BDL 0.5
HCl BDL BDL 5
ETP 1 H2S BDL BDL 10
Total VOCs 8.4 0.01 --
CPCL Environment Statement 2017-18
28 | P a g e
Plants Toxic substance
Max.Conc. in (ppm)
Min. Conc. in (ppm)
PLE / TLV in (ppm)
Furfural BDL BDL 2
H2O2 BDL BDL 0.5
ETP 2
H2S BDL BDL 10
Total VOCs 4.9 0.01 --
Furfural BDL BDL 2
H2O2 BDL BDL 0.5
ETP 3
H2S BDL BDL 10 Total VOCs 9.7 0.01 --
H2O2 BDL BDL 0.5
OMS 3 tank farms
Total VOCs 3.2 0.01 --
Flare areas H2S 3.2 BDL 10
Total VOCs 4.6 0.01 --
BDL denotes Below Detectable Limit
CPCL Environment Statement 2017-18
29 | P a g e
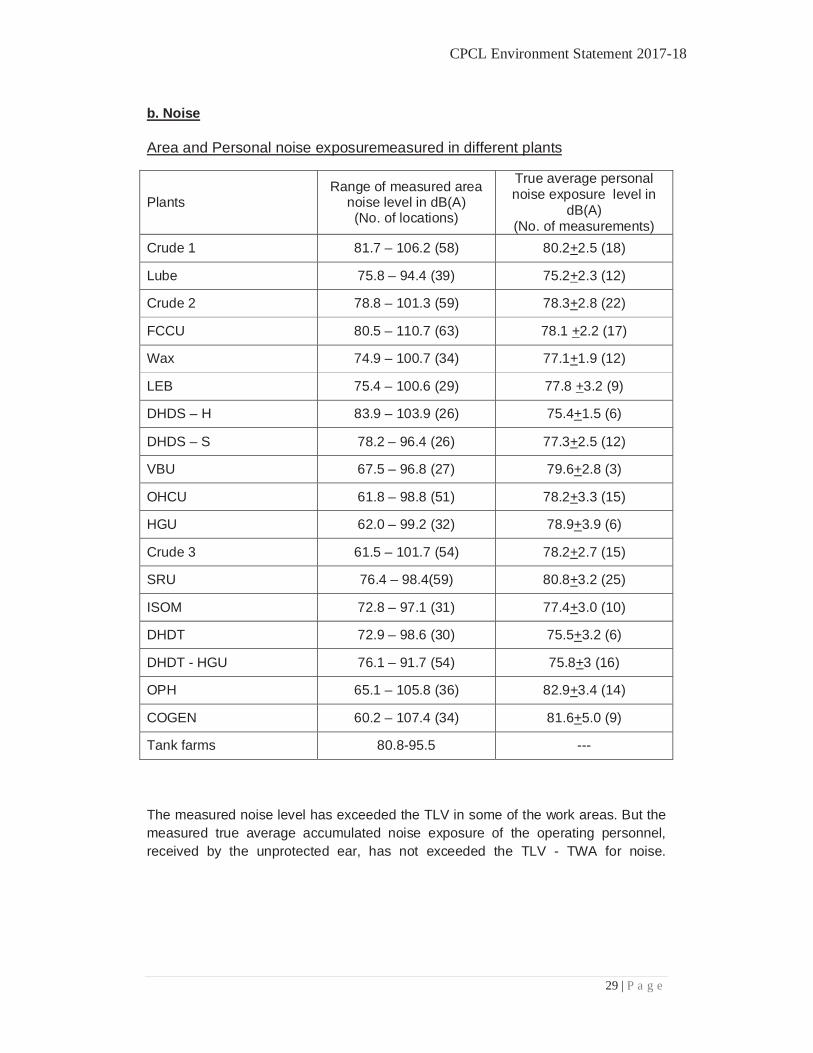
b. Noise Area and Personal noise exposuremeasured in different plants
Plants Range of measured area
noise level in dB(A) (No. of locations)
True average personal noise exposure level in
dB(A) (No. of measurements)
Crude 1 81.7 – 106.2 (58) 80.2+2.5 (18)
Lube 75.8 – 94.4 (39) 75.2+2.3 (12)
Crude 2 78.8 – 101.3 (59) 78.3+2.8 (22)
FCCU 80.5 – 110.7 (63) 78.1 +2.2 (17)
Wax 74.9 – 100.7 (34) 77.1+1.9 (12)
LEB 75.4 – 100.6 (29) 77.8 +3.2 (9)
DHDS – H 83.9 – 103.9 (26) 75.4+1.5 (6)
DHDS – S 78.2 – 96.4 (26) 77.3+2.5 (12)
VBU 67.5 – 96.8 (27) 79.6+2.8 (3)
OHCU 61.8 – 98.8 (51) 78.2+3.3 (15)
HGU 62.0 – 99.2 (32) 78.9+3.9 (6)
Crude 3 61.5 – 101.7 (54) 78.2+2.7 (15)
SRU 76.4 – 98.4(59) 80.8+3.2 (25)
ISOM 72.8 – 97.1 (31) 77.4+3.0 (10)
DHDT 72.9 – 98.6 (30) 75.5+3.2 (6)
DHDT - HGU 76.1 – 91.7 (54) 75.8+3 (16)
OPH 65.1 – 105.8 (36) 82.9+3.4 (14)
COGEN 60.2 – 107.4 (34) 81.6+5.0 (9)
Tank farms 80.8-95.5 ---
The measured noise level has exceeded the TLV in some of the work areas. But the measured true average accumulated noise exposure of the operating personnel, received by the unprotected ear, has not exceeded the TLV - TWA for noise.
CPCL Environment Statement 2017-18
30 | P a g e
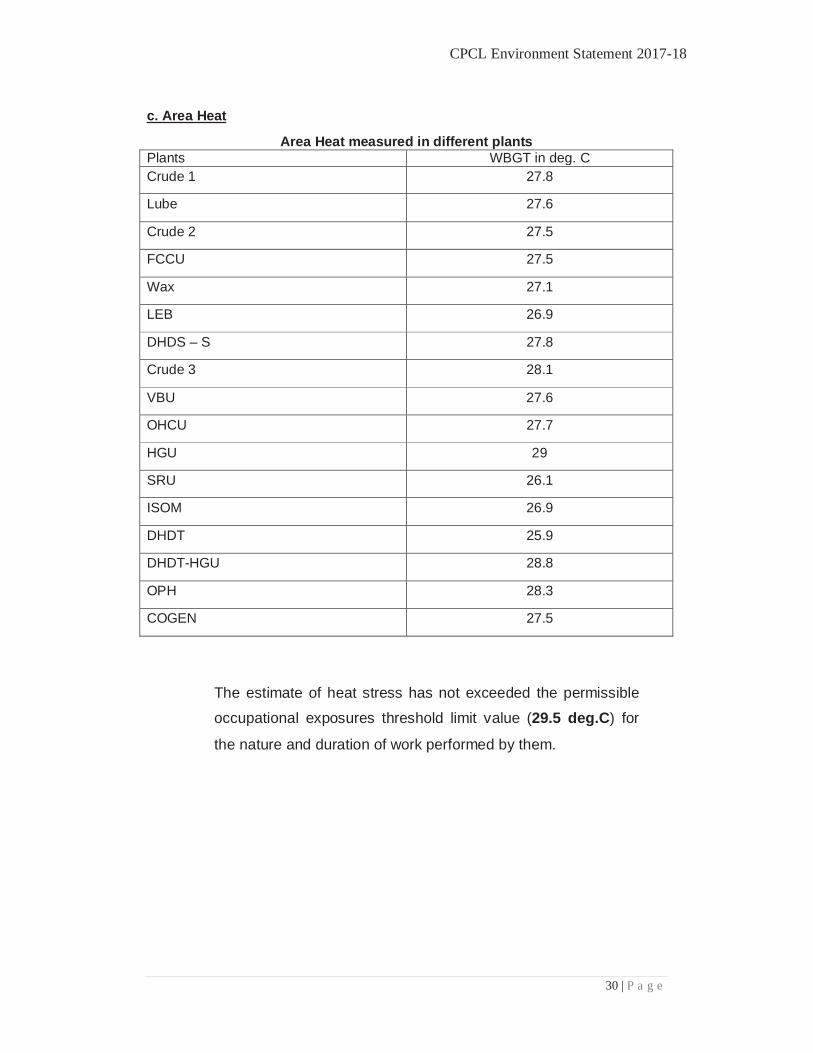
c. Area Heat
Area Heat measured in different plants Plants WBGT in deg. C Crude 1 27.8
Lube 27.6
Crude 2 27.5
FCCU 27.5
Wax 27.1
LEB 26.9
DHDS – S 27.8
Crude 3 28.1
VBU 27.6
OHCU 27.7
HGU 29
SRU 26.1
ISOM 26.9
DHDT 25.9
DHDT-HGU 28.8
OPH 28.3
COGEN 27.5
The estimate of heat stress has not exceeded the permissible
occupational exposures threshold limit value (29.5 deg.C) for
the nature and duration of work performed by them.
CPCL Environment Statement 2017-18
31 | P a g e
Annexure – VIII
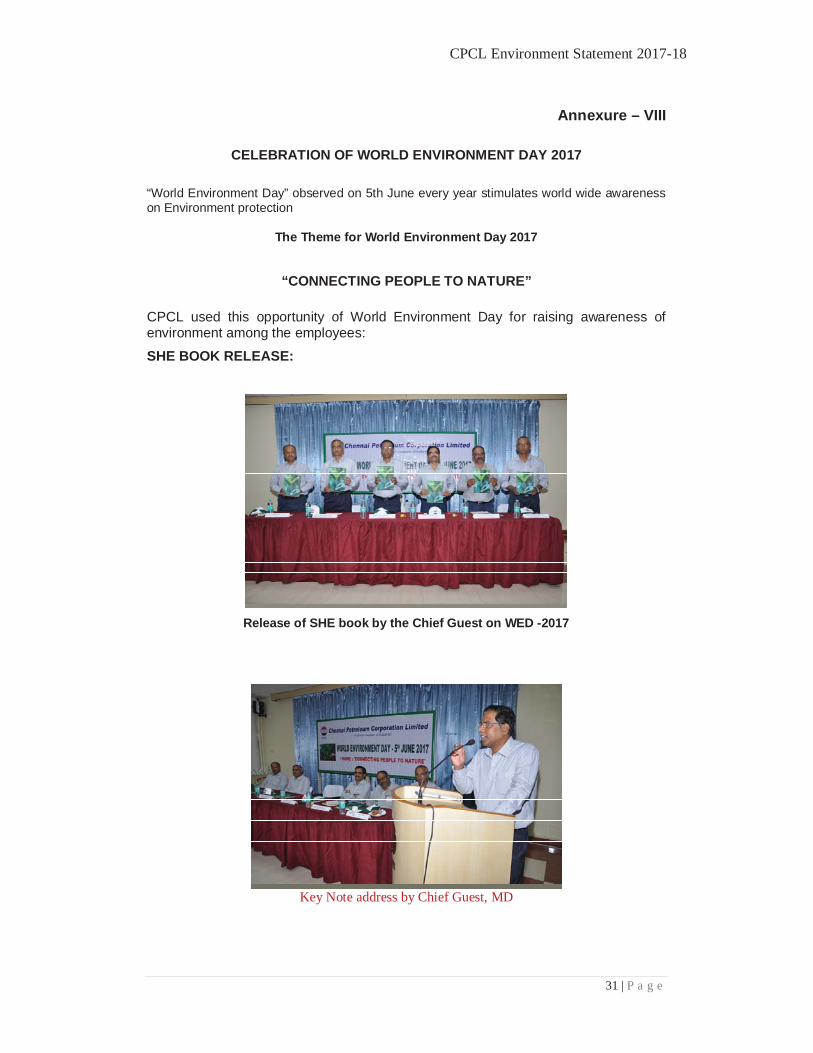
CELEBRATION OF WORLD ENVIRONMENT DAY 2017
“World Environment Day” observed on 5th June every year stimulates world wide awareness on Environment protection
The Theme for World Environment Day 2017
“CONNECTING PEOPLE TO NATURE”
CPCL used this opportunity of World Environment Day for raising awareness of environment among the employees:
SHE BOOK RELEASE:
Release of SHE book by the Chief Guest on WED -2017
Key Note address by Chief Guest, MD
CPCL Environment Statement 2017-18
32 | P a g e
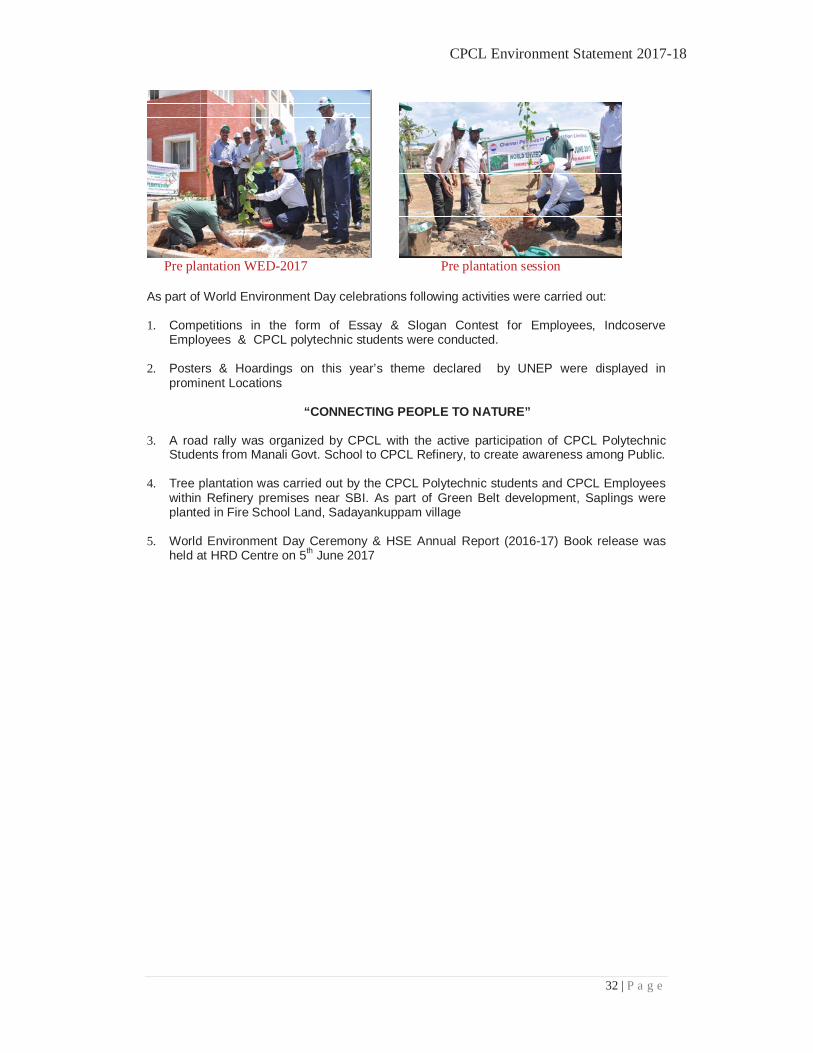
Pre plantation WED-2017 Pre plantation session As part of World Environment Day celebrations following activities were carried out: 1. Competitions in the form of Essay & Slogan Contest for Employees, Indcoserve
Employees & CPCL polytechnic students were conducted.
2. Posters & Hoardings on this year’s theme declared by UNEP were displayed in prominent Locations
“CONNECTING PEOPLE TO NATURE”
3. A road rally was organized by CPCL with the active participation of CPCL Polytechnic Students from Manali Govt. School to CPCL Refinery, to create awareness among Public.
4. Tree plantation was carried out by the CPCL Polytechnic students and CPCL Employees within Refinery premises near SBI. As part of Green Belt development, Saplings were planted in Fire School Land, Sadayankuppam village
5. World Environment Day Ceremony & HSE Annual Report (2016-17) Book release was held at HRD Centre on 5th June 2017