Embed Size (px)
Citation preview
14-05-T01 Thunder Ridge DRAFT Cost Analysis Ltr RO MR0916gc.docx
Cane Engineering
231 SE Barrington Dr, Suite 205 P.O. Box 459 Oak Harbor, WA 98277
Tel: 360-279-0615 Fax: 360-679-5046
Gregory R. Cane, P.E.
March 9, 2016 Thunder Ridge Water System Re: Central Camano Water Systems Cooperation Study - Report Appendix
(Capital Facilities Replacement Review) Dear Thunder Ridge Water System: Please find enclosed the DRAFT Capital Facilities Replacement Review for your water system. The purpose of analyses such as this is to use available information to estimate both the total cost, and the annual contribution to the eventual replacement, of all water system components. I have prepared the analysis based on the records available to me at this time. One reason for this initial draft is to seek refining data (e.g. for Thunder Ridge, the age of the well pump). Once the data is refined, the final report can be a very useful tool for the Water System Owners in guiding future decisions relative to assessments for the replacement of the water system’s facilities (I’ve discussed this further below). There is one caution that I always make when preparing these analyses, that is, we should be wary of over-refinement. There is no doubt that there could be much fine-tuning on the margins. For example, should the useful life of the storage tank be 40 years, as I have used, or should it be 50 years? Or, should interest / inflation be included in the calculations? Communities invariably determine, even after many tweaks, that the required cost per household per year (as reflected in Column K) is still very high. The lesson, therefore, is not whether the Thunder Ridge cost per household per year should be $684.33, or $600, or $800, but that the replacement cost of the water systems capital facilities is high and should be addressed to the best ability of your organization. If you would like to further discuss the results of this review, I would be happy to answer any questions that may arise. As possible, it would be very helpful if you could forward to me any updates or corrections that you may have by Monday, April 11, 2016. - - - - - The notes below discuss the columns in the attached table.
Page 2 of 4
14-05-T01 Thunder Ridge DRAFT Cost Analysis Ltr RO MR0916gc.docx
Column A
This column reflects a summary of the water system components. Water system component sizes, capacities, age, etc. have been based upon record information and documents. Please review this column and if you find incorrect information, please note it.
Column B
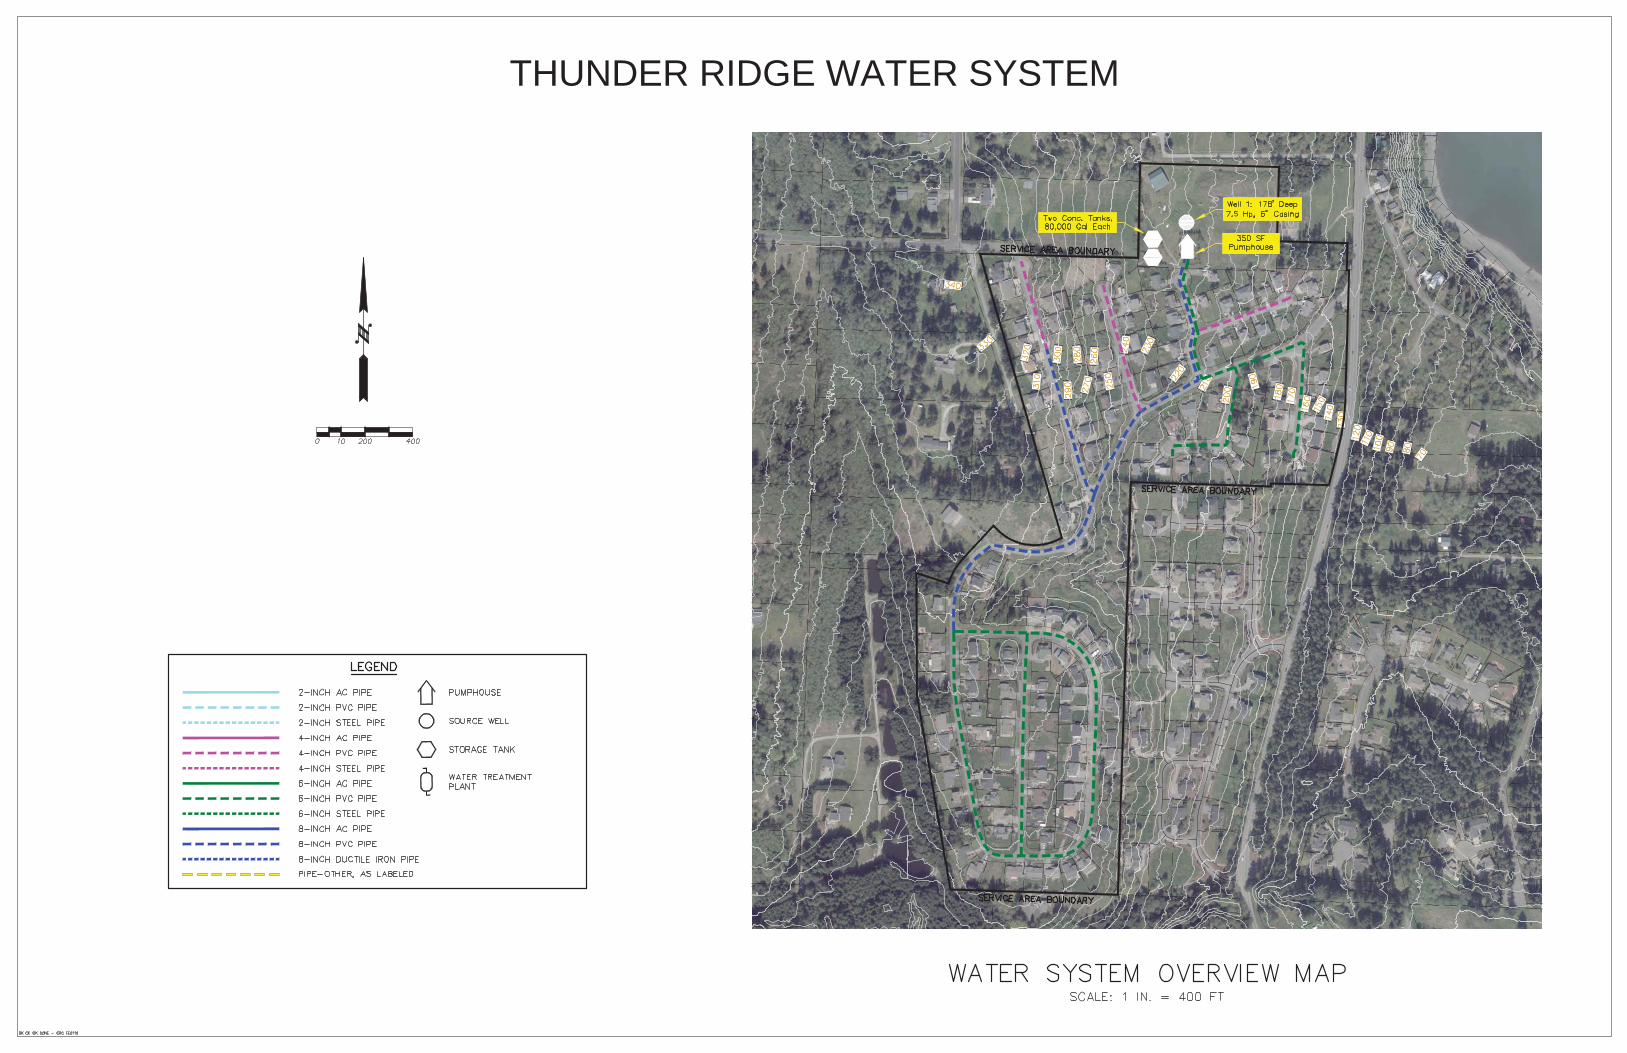
This is an estimate of the replacement cost (construction only) for the various water system components. For the most part, it is based on the budget cost information sheets enclosed herein. For instance, for the 350 square foot pumphouse, it is prudent to budget $670 per square foot for a new pumphouse. This is an all‐inclusive construction cost and takes into account the building, piping, pumps, electrical, control system, etc. The Column B value therefore for the 350 square foot pumphouse is (350 x $670/sq. ft.) = $234,500.
Column C
Recent experience has shown that other (non‐construction) costs for water system projects in Island County can add as much as 35% – 40% on top of construction costs. For this cost analysis, an additional 35% has been used. These additional costs can include engineering, construction management, archaeological / environmental review and mitigation, permitting, attorney’s fees and contingencies. This column reflects the total estimated component replacement costs.
Column D
The review year for this report is 2016.
Column E
Based on available information, the installation year for the noted component is reflected in this column. In some cases, I have estimated the installation year of a component. Please review this column. If your information differs from that included herein, please note this also. Column F
Column D minus Column E.
Column G
The expected life of a component is based upon the table enclosed in this report (Enclosure E-1). This Expected Useful Life table is a summary of fourteen data sources which evaluated

Page 3 of 4
14-05-T01 Thunder Ridge DRAFT Cost Analysis Ltr RO MR0916gc.docx
the expected life of water system components. In the right hand column of the table, I have suggested an anticipated useful life for the various components. Column H
Column H is the arithmetic difference between the component age and the expected life. As noted herein, the result may not necessarily be meaningful for this cost review. For example, for the well pump, the time remaining to replacement is 1 year. The well pump is functioning, and will likely continue to function for some time into the future.
Column I
This column allows the reviewer to use a more reasonable anticipated remaining life value for the various components. Again, considering the well pump, I have estimated a remaining life of five years for this component. The values placed within this column will be based upon the reviewer’s knowledge of the condition of the various water system facilities.
Column J
The current number of households (aka, Equivalent Residential Units) connected to the water system.
Column K
This is the amount that each household would need to contribute toward a Capital Facilities Replacement Fund (“Replacement Fund”) each year to provide their share of the cost for the noted component. For example, for Storage Tank 1, each household would need to contribute $53.73 per year for the replacement of this component.
Column L
The noted support documents for your report are included herein, and the location reflected in this column.
Column M Miscellaneous notes, including cost information not reflected elsewhere in the report.
Discussion
Looking at the bottom of Column K, the total required contribution per household of $684.33 per year to a Replacement Fund is much more than is typically acceptable to the average homeowner. With the exception of a new water system, I am not aware of any similar analysis which did not result in an uncomfortably high required contribution to a Replacement Fund. Most communities, therefore, do not find it feasible to contribute to a Replacement Fund at
Page 4 of 4
14-05-T01 Thunder Ridge DRAFT Cost Analysis Ltr RO MR0916gc.docx
the level provided in these analyses.
Having said that, however, one should not cast aside the results of this analysis as it does a reasonably good job of providing a long‐term replacement cost of a community’s water system. Most communities of which I am aware, have utilized the results of these analyses to increase (or to initiate) contributions to a Replacement Fund. If a given component were to fail and require replacement before there is sufficient money in the Fund, a water system may elect to finance these capital replacements through one of a number of loan programs available.
Sincerely,
Cane Engineering
Gregory R. Cane, P.E.
Encl
THUNDER RIDGE WATER SYSTEM

A B C D E F G H I J K L M
Water System ComponentReplacement
Cost - Construction
Replacement Cost -
Total (1)Review
Year
Year Installed (Approx.)
Component AgeExpected
Life (2)
Years to Replacement (Theoretical)
Years to Replacement (For
Analysis)
Number of Households
Required per Household
per YearEnclosure Notes
Well 1 - 178' Deep, 6" Casing 11,570 15,620 2016 1996 20 35 15 15 134 7.77 E-2
Well 1 Pump -7.5 Hp 13,800 18,630 2016 2002 14 15 1 5 134 27.81 E-3
Pumphouse - 350 SF 234,500 316,575 2016 2000 16 40 24 24 134 98.44 E-4
Chain Link Fence - 625 LF 14,375 19,406 2016 2000 16 40 24 24 134 6.03 E-5
Storage Tank 1 - 80,000 Gallons 128,000 172,800 2016 2000 16 40 24 24 134 53.73 E-6 Reinforced Concrete; "Low" Tank"; Per Graph, Use $1.60 / Gal.
Storage Tank 2- 80,000 Gallons 128,000 172,800 2016 2001 15 40 25 25 134 51.58 E-6 Reinforced Concrete; "Low" Tank"; Per Graph, Use $1.60 / Gal.
8" PVC - 2,830 LF 325,450 439,358 2016 2001 15 75 60 60 134 54.65 E-7
6" PVC Pipe - 5,720 LF 600,600 810,810 2016 2001 15 75 60 60 134 100.85 E-8
4" PVC Pipe - 1,350 LF 128,250 173,138 2016 2001 15 75 60 60 134 21.53 Est. $95/Lf for 4" PVC
Standby Generator - 60 Kw 52,000 70,200 2016 2000 16 15 -1 2 134 261.94 E-9 Generator (and Electric Pumps) Assumed to Replace Engine-Driven Fireflow Pumps
Totals $1,636,545 $2,209,336 $684.33
Thunder Ridge Water System. - Capital Facilities Replacement Review - 2016
Notes:
(1) Total Cost reflects additional 35% for engineering, archaeological and environmental review / mitigation, permitting, construction administration, attorney's fees and contingencies.(2) See Enclosure E-1.
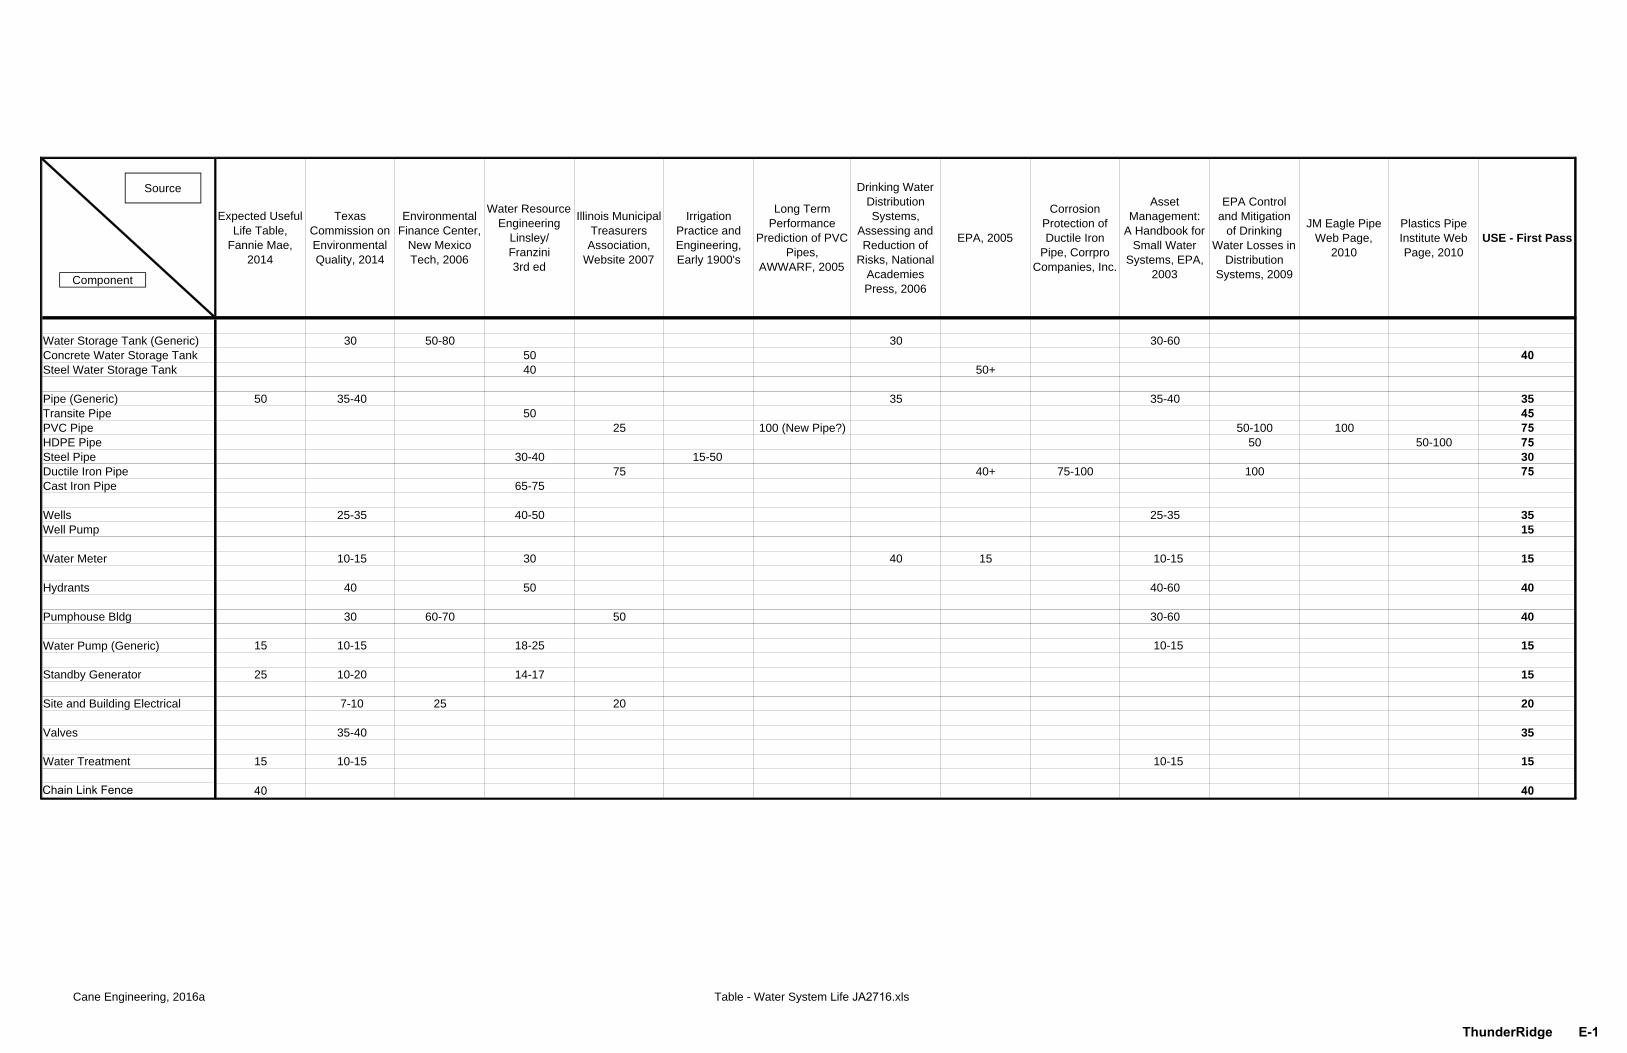
Expected Useful Life Table,
Fannie Mae, 2014
Texas Commission on Environmental Quality, 2014
Environmental Finance Center,
New Mexico Tech, 2006
Water Resource Engineering
Linsley/ Franzini 3rd ed
Illinois Municipal Treasurers Association,
Website 2007
Irrigation Practice and Engineering, Early 1900's
Long Term Performance
Prediction of PVC Pipes,
AWWARF, 2005
Drinking Water Distribution Systems,
Assessing and Reduction of
Risks, National Academies Press, 2006
EPA, 2005
Corrosion Protection of Ductile Iron
Pipe, Corrpro Companies, Inc.
Asset Management:
A Handbook for Small Water
Systems, EPA, 2003
EPA Control and Mitigation
of Drinking Water Losses in
Distribution Systems, 2009
JM Eagle Pipe Web Page,
2010
Plastics Pipe Institute Web Page, 2010
USE - First Pass
Water Storage Tank (Generic) 30 50-80 30 30-60Concrete Water Storage Tank 50 40Steel Water Storage Tank 40 50+
Pipe (Generic) 50 35-40 35 35-40 35Transite Pipe 50 45PVC Pipe 25 100 (New Pipe?) 50-100 100 75HDPE Pipe 50 50-100 75Steel Pipe 30-40 15-50 30Ductile Iron Pipe 75 40+ 75-100 100 75Cast Iron Pipe 65-75
Wells 25-35 40-50 25-35 35Well Pump 15
Water Meter 10-15 30 40 15 10-15 15
Hydrants 40 50 40-60 40
Pumphouse Bldg 30 60-70 50 30-60 40
Water Pump (Generic) 15 10-15 18-25 10-15 15
Standby Generator 25 10-20 14-17 15
Site and Building Electrical 7-10 25 20 20
Valves 35-40 35
Water Treatment 15 10-15 10-15 15
Source
Component
Cane Engineering, 2016a Table - Water System Life JA2716.xls
Chain Link Fence 40 40
ThunderRidge E-1

Project Cost Per Ft
Recent Bid Information 62.48$ Estimate for Budgeting 65.00$
New Drilled Well - Budget Construction Cost
(Estimated Lifespan: 35 years)
Island County (2015 Dollars)
Cost Assumptions:‐ 6‐inch casing‐ ≥ 100 ft deep‐ Includes tax‐ Includes some site work‐ Does not include contingency
Well Costs DE1815gc.xlsx
ThunderRidge E-2

$10000
$12,000
$14,000
$16,000
$18,000
$20,000
$22,000
$24,000
eplacement CostWell Pump ‐Budget Rep
lacement Cost ‐Island County (2015 Dollars)
Estimated
Useful Life: 15 Years
$0
$2,000
$4,000
$6,000
$8,000
$10,000
05
10
15
20
25
30
R
Capacity (HP)
Cost Assumptions:
‐Includes new piping and wiring
‐Includes minor well rehabilitation
‐Includes tax
‐Does not include contingency
ThunderRidge E-3
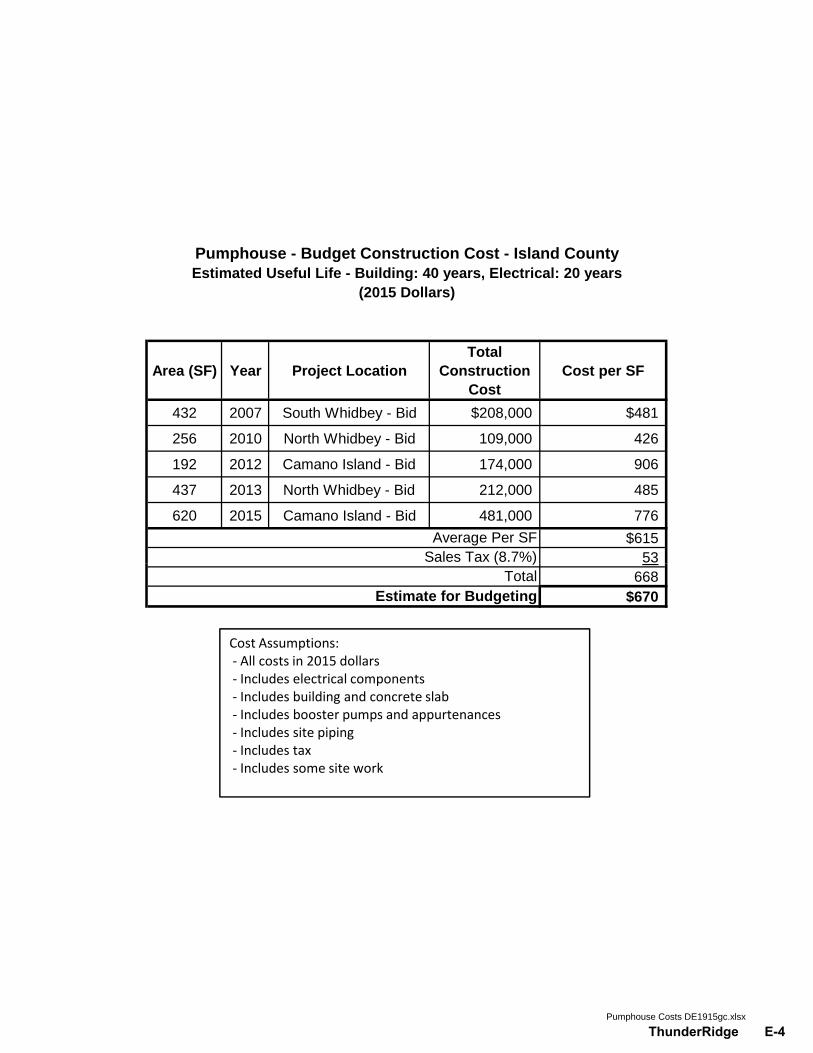
Area (SF) Year Project LocationTotal
Construction Cost
Cost per SF
432 2007 South Whidbey - Bid $208,000 $481
256 2010 North Whidbey - Bid 109,000 426
192 2012 Camano Island - Bid 174,000 906
437 2013 North Whidbey - Bid 212,000 485
620 2015 Camano Island - Bid 481,000 776$615
53
Pumphouse - Budget Construction Cost - Island CountyEstimated Useful Life - Building: 40 years, Electrical: 20 years
(2015 Dollars)
Average Per SFSales Tax (8.7%)
668$670
( )Total
Estimate for Budgeting
Cost Assumptions:‐ All costs in 2015 dollars‐ Includes electrical components‐ Includes building and concrete slab‐ Includes booster pumps and appurtenances‐ Includes site piping‐ Includes tax‐ Includes some site work
Pumphouse Costs DE1915gc.xlsx
ThunderRidge E-4

$30
$35
$40
$45
$50
placement Cost / FtChain Link Fence‐Budget Rep
lacement Cost ‐Island County (2015 Dollars)
Estimated
Useful Life: 40 Years
$15
$20
$25
$30
100
150
200
250
300
350
400
450
500
Rep
Fence Len
gth (Ft)
Cost Assumptions:
‐6 Ft High Fence
‐Includes Barbed
Wire Atop
‐Includes Gate(s)
‐Includes SomeSite Preparation
‐Includes Tax
‐Does Not Include Contingency
ThunderRidge E-5
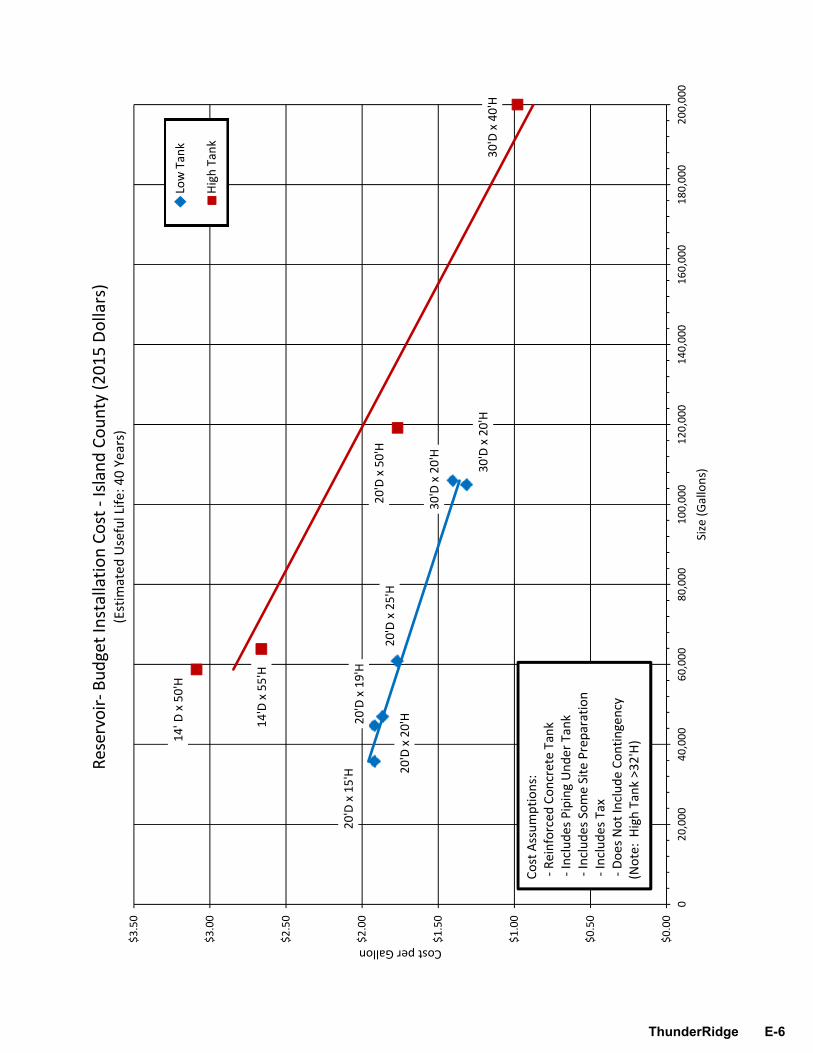
20'D x 15'H
20'D x 19'H
20'D x 25'H
30'D x 20'H
20'D x 20'H
14' D
x 50'H
14'D x 55'H
20'D x 50'H
$1.50
$2.00
$2.50
$3.00
$3.50
Cost per GallonReservoir‐B
udget Installation Cost ‐
Island County (2015 Dollars)
(Estim
ated
Useful Life: 4
0 Years)
Low Tank
High Tank
30'D x 20'H
30'D x 40'H
$0.00
$0.50
$1.00
020,000
40,000
60,000
80,000
100,000
120,000
140,000
160,000
180,000
200,000
Size (Gallons)
Cost Assumptions:
‐Reinforced
Concrete Tank
‐Includes Piping Under Tank
‐Includes Some Site Preparation
‐Includes Tax
‐Does Not Include Contingency
(Note: High Tank >32'H)
ThunderRidge E-6
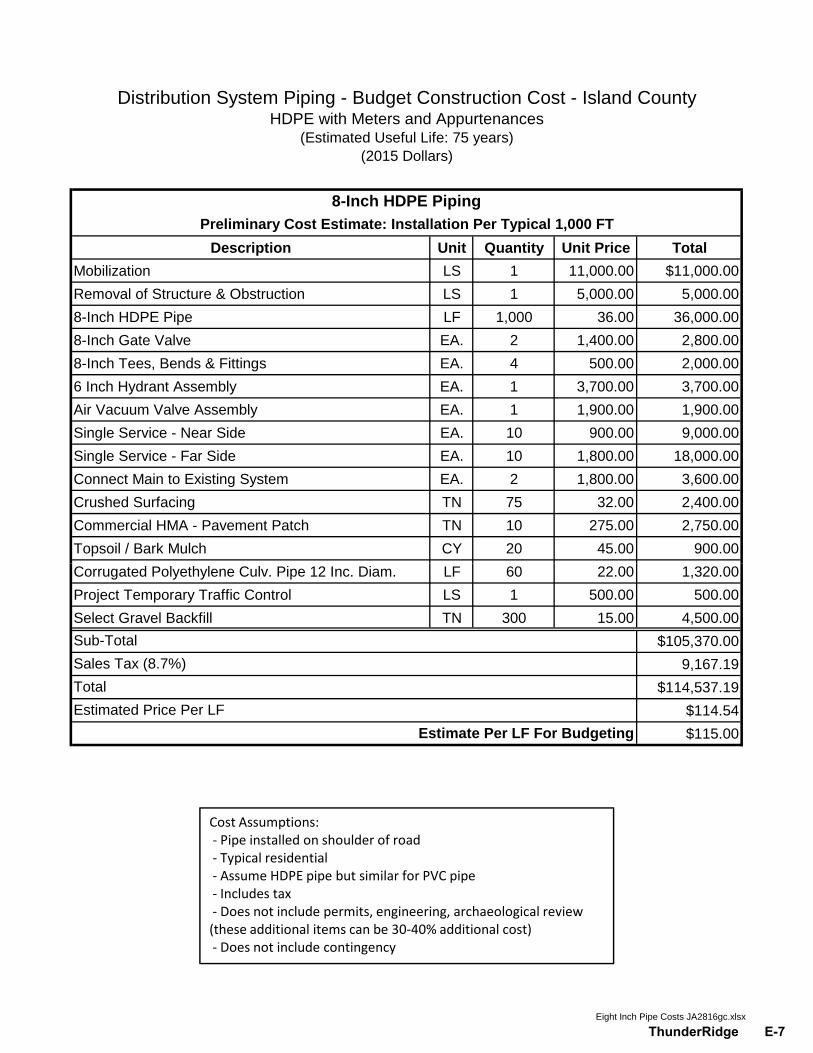
Description Unit Quantity Unit Price Total
Mobilization LS 1 11,000.00 $11,000.00Removal of Structure & Obstruction LS 1 5,000.00 5,000.008-Inch HDPE Pipe LF 1,000 36.00 36,000.008-Inch Gate Valve EA. 2 1,400.00 2,800.008-Inch Tees, Bends & Fittings EA. 4 500.00 2,000.006 Inch Hydrant Assembly EA. 1 3,700.00 3,700.00Air Vacuum Valve Assembly EA. 1 1,900.00 1,900.00Single Service - Near Side EA. 10 900.00 9,000.00Single Service - Far Side EA. 10 1,800.00 18,000.00Connect Main to Existing System EA. 2 1,800.00 3,600.00Crushed Surfacing TN 75 32.00 2,400.00Commercial HMA - Pavement Patch TN 10 275.00 2,750.00Topsoil / Bark Mulch CY 20 45.00 900.00
8-Inch HDPE Piping
Preliminary Cost Estimate: Installation Per Typical 1,000 FT
Distribution System Piping - Budget Construction Cost - Island CountyHDPE with Meters and Appurtenances
(Estimated Useful Life: 75 years)(2015 Dollars)
Corrugated Polyethylene Culv. Pipe 12 Inc. Diam. LF 60 22.00 1,320.00Project Temporary Traffic Control LS 1 500.00 500.00Select Gravel Backfill TN 300 15.00 4,500.00
$105,370.009,167.19
$114,537.19$114.54$115.00
Estimated Price Per LFEstimate Per LF For Budgeting
Sub-TotalSales Tax (8.7%)Total
Cost Assumptions:‐ Pipe installed on shoulder of road‐ Typical residential‐ Assume HDPE pipe but similar for PVC pipe‐ Includes tax‐ Does not include permits, engineering, archaeological review (these additional items can be 30‐40% additional cost)‐ Does not include contingency
Eight Inch Pipe Costs JA2816gc.xlsx
ThunderRidge E-7

Description Unit Quantity Unit Price Total
Mobilization LS 1 10,000.00 $10,000.00Removal of Structure & Obstruction LS 1 5,000.00 5,000.006-Inch HDPE Pipe LF 1,000 28.00 28,000.006-Inch Gate Valve EA. 2 900.00 1,800.006-Inch Tees, Bends & Fittings EA. 4 500.00 2,000.006 Inch Hydrant Assembly EA. 1 3,700.00 3,700.00Air Vacuum Valve Assembly EA. 1 1,900.00 1,900.00Single Service - Near Side EA. 10 900.00 9,000.00Single Service - Far Side EA. 10 1,800.00 18,000.00Connect Main to Existing System EA. 2 1,800.00 3,600.00Crushed Surfacing TN 75 32.00 2,400.00Commercial HMA - Pavement Patch TN 10 275.00 2,750.00Topsoil / Bark Mulch CY 20 45.00 900.00
6-Inch HDPE Piping
Preliminary Cost Estimate: Installation Per Typical 1,000 FT
Distribution System Piping - Budget Construction Cost - Island CountyHDPE with Meters and Appurtenances
(Estimated Useful Life: 75 years)(2015 Dollars)
Corrugated Polyethylene Culv. Pipe 12 Inc. Diam. LF 60 22.00 1,320.00Project Temporary Traffic Control LS 1 500.00 500.00Select Gravel Backfill TN 300 15.00 4,500.00
$95,370.008,297.19
$103,667.19$103.67$105.00
Estimated Price Per LFEstimate Per LF For Budgeting
Sub-TotalSales Tax (8.7%)Total
Cost Assumptions:‐ Pipe installed on shoulder of road‐ Typical residential‐ Assume HDPE pipe but similar for PVC pipe‐ Includes tax‐ Does not include permits, engineering, archaeological review (these additional items can be 30‐40% additional cost)‐ Does not include contingency
Six Inch Pipe Costs JA2816gc.xlsx
ThunderRidge E-8

$30,000
$40,000
$50,000
$60,000
nstalled CostBack‐up Gen
erator
Budget Installation Cost ‐Island County (2015 Dollars)
Estimated
Useful Life: 15 Years
$0
$10,000
$20,000
010
20
30
40
50
60
70
I
Capacity (kW)Cost Assumptions:
‐Installed and tested, in place, on concrete pad
‐Includes both diesel and propane fueled
gen
erators
‐Includes automatic transfer switch
‐Includes tax
‐Includes purchase of fuel tank
‐Includes some site work
‐Does not include contingency
ThunderRidge E-9