Embed Size (px)
Citation preview
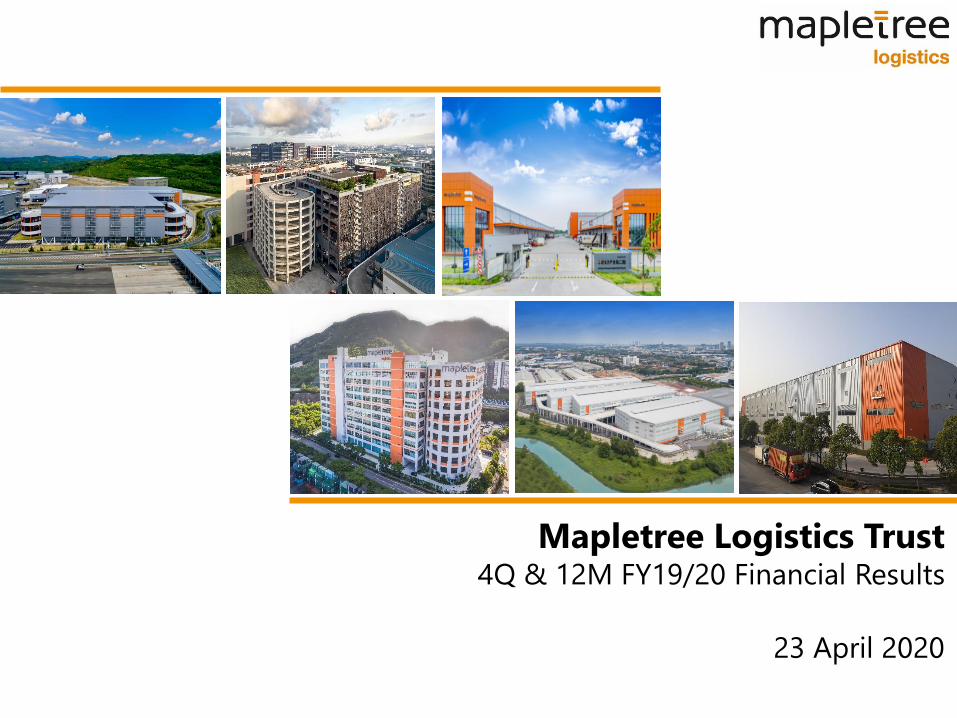
Mapletree Logistics Trust4Q & 12M FY19/20 Financial Results
23 April 2020
Disclaimer
1
This presentation shall be read in conjunction with Mapletree Logistics Trust’s financial results for the Fourth Quarter and
Financial Year FY2019/20 in the SGXNET announcement dated 23 April 2020.
This presentation is for information purposes only and does not constitute an invitation or offer to acquire, purchase or
subscribe for units in Mapletree Logistics Trust (“MLT”, and units in MLT, “Units”), nor should it or any part of it form the
basis of, or be relied upon in any connection with, any contract or commitment whatsoever. The value of Units and the
income derived from them may fall as well as rise. Units are not obligations of, deposits in, or guaranteed by, the
Manager or any of its affiliates. An investment in Units is subject to investment risks, including the possible loss of the
principal amount invested. Investors have no right to request the Manager to redeem their Units while the Units are
listed. It is intended that Unitholders may only deal in their Units through trading on the SGX-ST. Listing of the Units on
the SGX-ST does not guarantee a liquid market for the Units. The past performance of the Units and Mapletree
Logistics Trust Management Ltd. (the “Manager”) is not indicative of the future performance of MLT and the Manager.
Predictions, projections or forecasts of the economy or economic trends of the markets which are targeted by MLT are
not necessarily indicative of the future or likely performance of MLT.
This presentation may also contain forward-looking statements that involve risks and uncertainties. Actual future
performance, outcomes and results may differ materially from those expressed in forward-looking statements as a
result of a number of risks, uncertainties and assumptions. Representative examples of these factors include (without
limitation) general industry and economic conditions, interest rate trends, cost of capital and capital availability,
competition from similar developments, shifts in expected levels of property rental income, changes in operating
expenses, including employee wages, benefits and training, property expenses and governmental and public policy
changes and the continued availability of financing in the amounts and the terms necessary to support future business.
You are cautioned not to place undue reliance on these forward looking statements, which are based on current view of
management on future events. In addition, any discrepancies in the tables, graphs and charts between the listed
amounts and totals thereof are due to rounding. Figures shown as totals in tables, graphs and charts may not be an
arithmetic aggregation of the figures that precede them.

Agenda
2
Key Highlights
Financial Review
Capital Management
Portfolio Review
Outlook
Key Highlights
3
4Q FY19/20 Amount Distributable to Unitholders of S$77.8 million (+6.2% y-o-y)
and DPU of 2.048 cents (+1.2% y-o-y)
Gross revenue increased 5.5% to S$128.1 million and NPI grew 9.3% to S$114.7
million
Improved results mainly driven by higher contributions from existing properties and
accretive acquisitions in FY19/20, partly offset by the absence of contribution from six
properties divested in FY19/20
FY19/20 DPU increased by 2.5% y-o-y to 8.142 cents
FY19/20 amount distributable to Unitholders rose 11.7% y-o-y to S$301.7 million
Resilient Portfolio
Portfolio occupancy improved to 98.0% from 97.7% in 3Q FY19/20
Well-staggered lease expiry profile with WALE (by NLA) of 4.3 years
Average rental reversion for leases renewed or replaced in 4Q FY19/20 was 2.0%,
mainly due to Hong Kong, Malaysia and Vietnam
Key Highlights
4
Active Portfolio Rejuvenation in FY19/20
Acquired 9 modern specifications logistics facilities in Malaysia, Vietnam, China (50%
interest), South Korea and Japan with total value of S$752.9 million
Entered into A$18.4 million (S$16.7 million) forward purchase agreement to acquire a
modern logistics property in Melbourne, Australia
Recycled capital amounting to S$251 million from the divestment of five properties
in Japan and one property in China
Proactive Capital Management
77% of total debt is hedged into fixed rates and 82% of income stream for the next
12 months has been hedged
Well-staggered debt maturity profile with an average debt duration of 4.1 years and
a gearing ratio of 39.3% as at 31 Mar 2020
No refinancing risks for FY20/21: S$242 million debt due (6% of total debt) vs more
than S$700 million available committed credit facilities

5
Financial Review
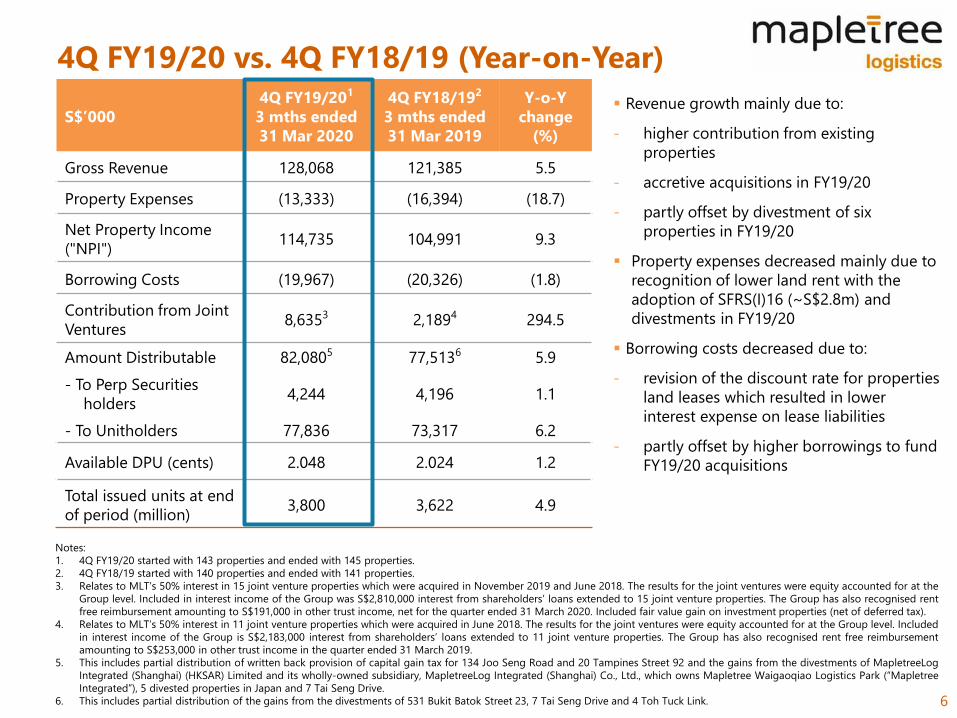
4Q FY19/20 vs. 4Q FY18/19 (Year-on-Year)
6
S$’000
4Q FY19/201
3 mths ended
31 Mar 2020
4Q FY18/192
3 mths ended
31 Mar 2019
Y-o-Y
change
(%)
Gross Revenue 128,068 121,385 5.5
Property Expenses (13,333) (16,394) (18.7)
Net Property Income
("NPI")114,735 104,991 9.3
Borrowing Costs (19,967) (20,326) (1.8)
Contribution from Joint
Ventures8,6353 2,1894 294.5
Amount Distributable 82,0805 77,5136 5.9
- To Perp Securities
holders4,244 4,196 1.1
- To Unitholders 77,836 73,317 6.2
Available DPU (cents) 2.048 2.024 1.2
Total issued units at end
of period (million)3,800 3,622 4.9
Notes:
1. 4Q FY19/20 started with 143 properties and ended with 145 properties.
2. 4Q FY18/19 started with 140 properties and ended with 141 properties.
3. Relates to MLT’s 50% interest in 15 joint venture properties which were acquired in November 2019 and June 2018. The results for the joint ventures were equity accounted for at the
Group level. Included in interest income of the Group was S$2,810,000 interest from shareholders’ loans extended to 15 joint venture properties. The Group has also recognised rent
free reimbursement amounting to S$191,000 in other trust income, net for the quarter ended 31 March 2020. Included fair value gain on investment properties (net of deferred tax).
4. Relates to MLT’s 50% interest in 11 joint venture properties which were acquired in June 2018. The results for the joint ventures were equity accounted for at the Group level. Included
in interest income of the Group is S$2,183,000 interest from shareholders’ loans extended to 11 joint venture properties. The Group has also recognised rent free reimbursement
amounting to S$253,000 in other trust income in the quarter ended 31 March 2019.
5. This includes partial distribution of written back provision of capital gain tax for 134 Joo Seng Road and 20 Tampines Street 92 and the gains from the divestments of MapletreeLog
Integrated (Shanghai) (HKSAR) Limited and its wholly-owned subsidiary, MapletreeLog Integrated (Shanghai) Co., Ltd., which owns Mapletree Waigaoqiao Logistics Park (“Mapletree
Integrated”), 5 divested properties in Japan and 7 Tai Seng Drive.
6. This includes partial distribution of the gains from the divestments of 531 Bukit Batok Street 23, 7 Tai Seng Drive and 4 Toh Tuck Link.
Revenue growth mainly due to:
- higher contribution from existing
properties
- accretive acquisitions in FY19/20
- partly offset by divestment of six
properties in FY19/20
Property expenses decreased mainly due to
recognition of lower land rent with the
adoption of SFRS(I)16 (~S$2.8m) and
divestments in FY19/20
Borrowing costs decreased due to:
- revision of the discount rate for properties
land leases which resulted in lower
interest expense on lease liabilities
- partly offset by higher borrowings to fund
FY19/20 acquisitions
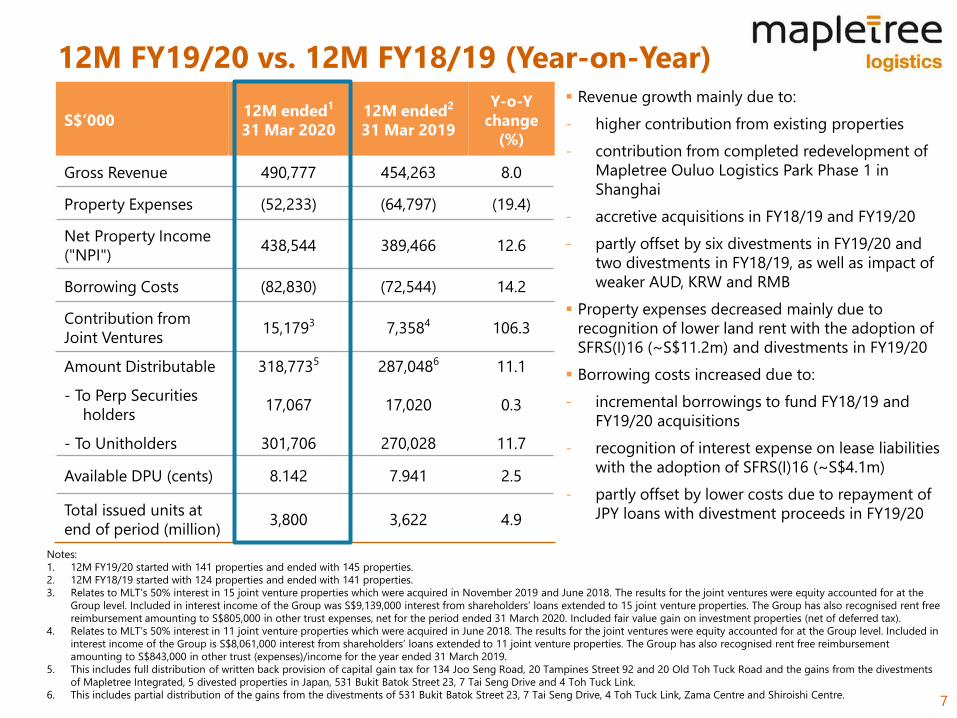
12M FY19/20 vs. 12M FY18/19 (Year-on-Year)
7
S$’00012M ended1
31 Mar 2020
12M ended2
31 Mar 2019
Y-o-Y
change
(%)
Gross Revenue 490,777 454,263 8.0
Property Expenses (52,233) (64,797) (19.4)
Net Property Income
("NPI")438,544 389,466 12.6
Borrowing Costs (82,830) (72,544) 14.2
Contribution from
Joint Ventures15,1793 7,3584 106.3
Amount Distributable 318,7735 287,0486 11.1
- To Perp Securities
holders17,067 17,020 0.3
- To Unitholders 301,706 270,028 11.7
Available DPU (cents) 8.142 7.941 2.5
Total issued units at
end of period (million)3,800 3,622 4.9
Notes:
1. 12M FY19/20 started with 141 properties and ended with 145 properties.
2. 12M FY18/19 started with 124 properties and ended with 141 properties.
3. Relates to MLT’s 50% interest in 15 joint venture properties which were acquired in November 2019 and June 2018. The results for the joint ventures were equity accounted for at the
Group level. Included in interest income of the Group was S$9,139,000 interest from shareholders’ loans extended to 15 joint venture properties. The Group has also recognised rent free
reimbursement amounting to S$805,000 in other trust expenses, net for the period ended 31 March 2020. Included fair value gain on investment properties (net of deferred tax).
4. Relates to MLT’s 50% interest in 11 joint venture properties which were acquired in June 2018. The results for the joint ventures were equity accounted for at the Group level. Included in
interest income of the Group is S$8,061,000 interest from shareholders’ loans extended to 11 joint venture properties. The Group has also recognised rent free reimbursement
amounting to S$843,000 in other trust (expenses)/income for the year ended 31 March 2019.
5. This includes full distribution of written back provision of capital gain tax for 134 Joo Seng Road, 20 Tampines Street 92 and 20 Old Toh Tuck Road and the gains from the divestments
of Mapletree Integrated, 5 divested properties in Japan, 531 Bukit Batok Street 23, 7 Tai Seng Drive and 4 Toh Tuck Link.
6. This includes partial distribution of the gains from the divestments of 531 Bukit Batok Street 23, 7 Tai Seng Drive, 4 Toh Tuck Link, Zama Centre and Shiroishi Centre.
Revenue growth mainly due to:
- higher contribution from existing properties
- contribution from completed redevelopment of
Mapletree Ouluo Logistics Park Phase 1 in
Shanghai
- accretive acquisitions in FY18/19 and FY19/20
- partly offset by six divestments in FY19/20 and
two divestments in FY18/19, as well as impact of
weaker AUD, KRW and RMB
Property expenses decreased mainly due to
recognition of lower land rent with the adoption of
SFRS(I)16 (~S$11.2m) and divestments in FY19/20
Borrowing costs increased due to:
- incremental borrowings to fund FY18/19 and
FY19/20 acquisitions
- recognition of interest expense on lease liabilities
with the adoption of SFRS(I)16 (~S$4.1m)
- partly offset by lower costs due to repayment of
JPY loans with divestment proceeds in FY19/20
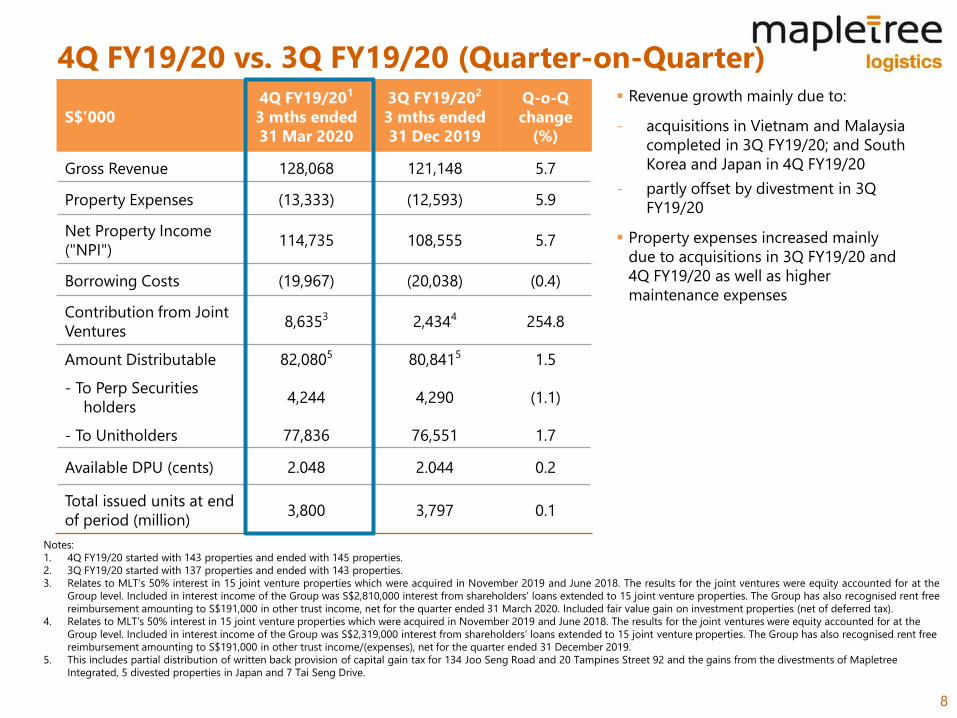
4Q FY19/20 vs. 3Q FY19/20 (Quarter-on-Quarter)
8
S$’000
4Q FY19/201
3 mths ended
31 Mar 2020
3Q FY19/202
3 mths ended
31 Dec 2019
Q-o-Q
change
(%)
Gross Revenue 128,068 121,148 5.7
Property Expenses (13,333) (12,593) 5.9
Net Property Income
("NPI")114,735 108,555 5.7
Borrowing Costs (19,967) (20,038) (0.4)
Contribution from Joint
Ventures8,6353 2,4344 254.8
Amount Distributable 82,0805 80,8415 1.5
- To Perp Securities
holders4,244 4,290 (1.1)
- To Unitholders 77,836 76,551 1.7
Available DPU (cents) 2.048 2.044 0.2
Total issued units at end
of period (million)3,800 3,797 0.1
Notes:
1. 4Q FY19/20 started with 143 properties and ended with 145 properties.
2. 3Q FY19/20 started with 137 properties and ended with 143 properties.
3. Relates to MLT’s 50% interest in 15 joint venture properties which were acquired in November 2019 and June 2018. The results for the joint ventures were equity accounted for at the
Group level. Included in interest income of the Group was S$2,810,000 interest from shareholders’ loans extended to 15 joint venture properties. The Group has also recognised rent free
reimbursement amounting to S$191,000 in other trust income, net for the quarter ended 31 March 2020. Included fair value gain on investment properties (net of deferred tax).
4. Relates to MLT’s 50% interest in 15 joint venture properties which were acquired in November 2019 and June 2018. The results for the joint ventures were equity accounted for at the
Group level. Included in interest income of the Group was S$2,319,000 interest from shareholders’ loans extended to 15 joint venture properties. The Group has also recognised rent free
reimbursement amounting to S$191,000 in other trust income/(expenses), net for the quarter ended 31 December 2019.
5. This includes partial distribution of written back provision of capital gain tax for 134 Joo Seng Road and 20 Tampines Street 92 and the gains from the divestments of Mapletree
Integrated, 5 divested properties in Japan and 7 Tai Seng Drive.
Revenue growth mainly due to:
- acquisitions in Vietnam and Malaysia
completed in 3Q FY19/20; and South
Korea and Japan in 4Q FY19/20
- partly offset by divestment in 3Q
FY19/20
Property expenses increased mainly
due to acquisitions in 3Q FY19/20 and
4Q FY19/20 as well as higher
maintenance expenses
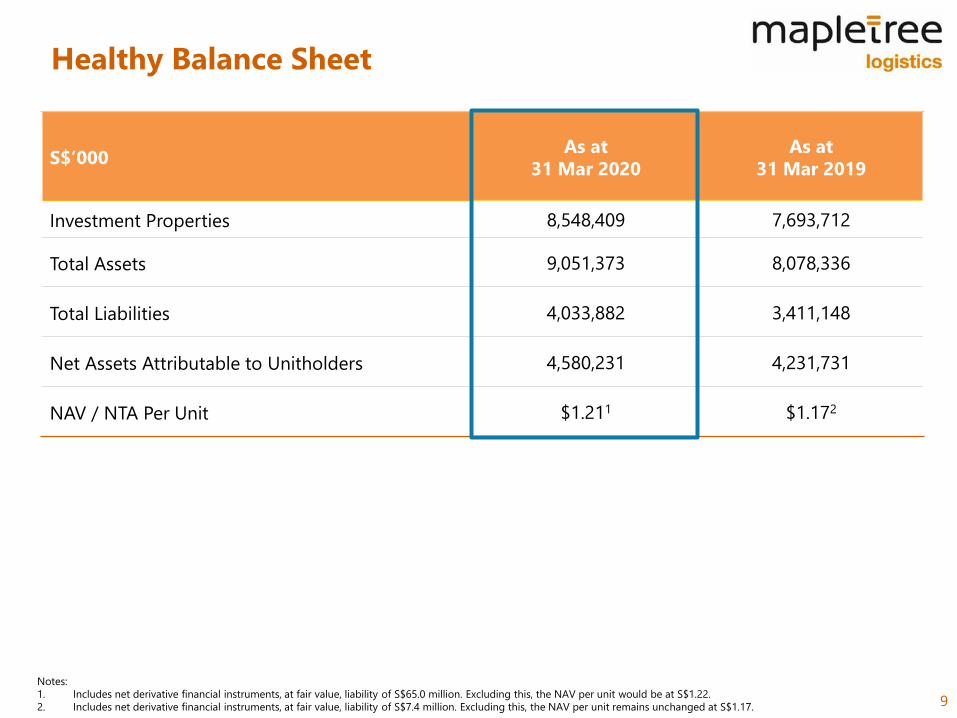
Healthy Balance Sheet
9
S$’000 As at
31 Mar 2020
As at
31 Mar 2019
Investment Properties 8,548,409 7,693,712
Total Assets 9,051,373 8,078,336
Total Liabilities 4,033,882 3,411,148
Net Assets Attributable to Unitholders 4,580,231 4,231,731
NAV / NTA Per Unit $1.211 $1.172
Notes:
1. Includes net derivative financial instruments, at fair value, liability of S$65.0 million. Excluding this, the NAV per unit would be at S$1.22.
2. Includes net derivative financial instruments, at fair value, liability of S$7.4 million. Excluding this, the NAV per unit remains unchanged at S$1.17.
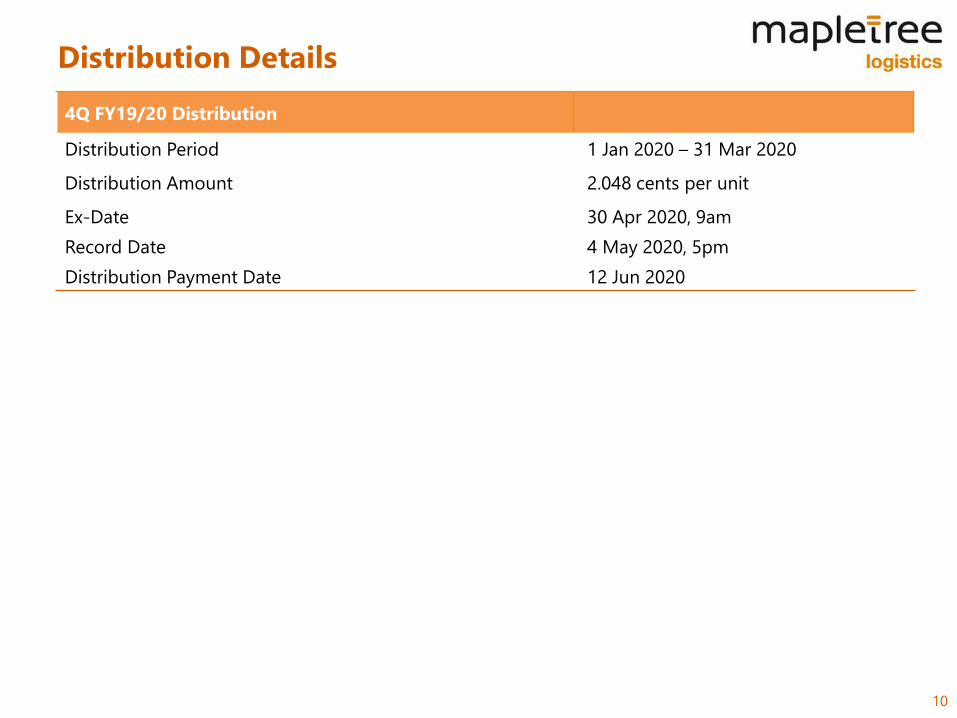
Distribution Details
10
4Q FY19/20 Distribution
Distribution Period 1 Jan 2020 – 31 Mar 2020
Distribution Amount 2.048 cents per unit
Ex-Date 30 Apr 2020, 9am
Record Date 4 May 2020, 5pm
Distribution Payment Date 12 Jun 2020

11
Capital Management
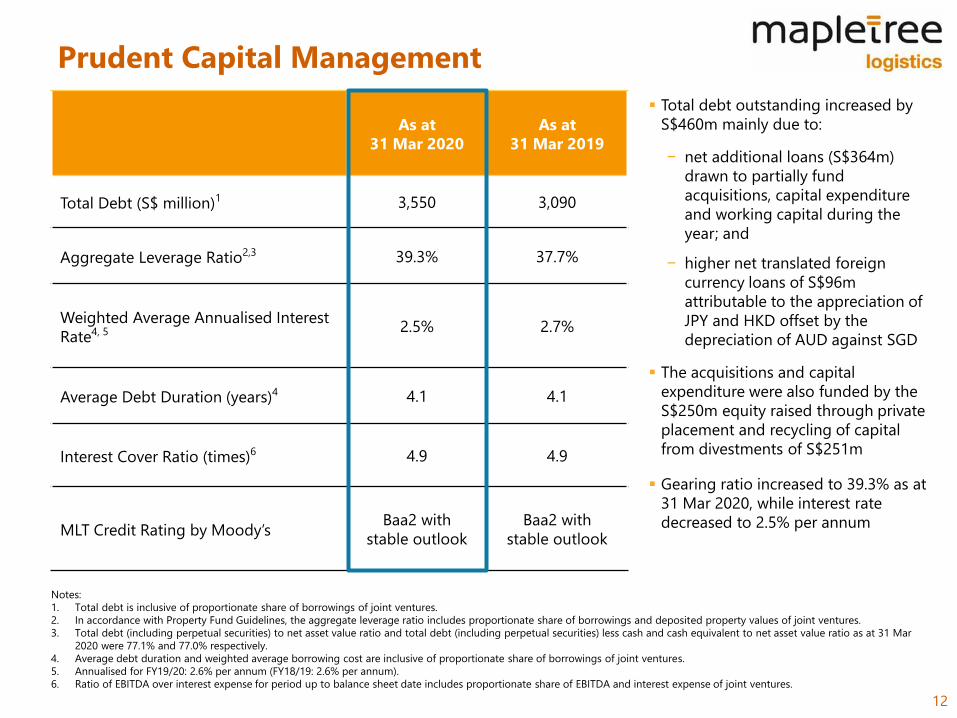
Prudent Capital Management
12
As at
31 Mar 2020
As at
31 Mar 2019
Total Debt (S$ million)1 3,550 3,090
Aggregate Leverage Ratio2,3 39.3% 37.7%
Weighted Average Annualised Interest
Rate4, 5 2.5% 2.7%
Average Debt Duration (years)4 4.1 4.1
Interest Cover Ratio (times)6 4.9 4.9
MLT Credit Rating by Moody’sBaa2 with
stable outlook
Baa2 with
stable outlook
Notes:
1. Total debt is inclusive of proportionate share of borrowings of joint ventures.
2. In accordance with Property Fund Guidelines, the aggregate leverage ratio includes proportionate share of borrowings and deposited property values of joint ventures.
3. Total debt (including perpetual securities) to net asset value ratio and total debt (including perpetual securities) less cash and cash equivalent to net asset value ratio as at 31 Mar
2020 were 77.1% and 77.0% respectively.
4. Average debt duration and weighted average borrowing cost are inclusive of proportionate share of borrowings of joint ventures.
5. Annualised for FY19/20: 2.6% per annum (FY18/19: 2.6% per annum).
6. Ratio of EBITDA over interest expense for period up to balance sheet date includes proportionate share of EBITDA and interest expense of joint ventures.
Total debt outstanding increased by
S$460m mainly due to:
− net additional loans (S$364m)
drawn to partially fund
acquisitions, capital expenditure
and working capital during the
year; and
− higher net translated foreign
currency loans of S$96m
attributable to the appreciation of
JPY and HKD offset by the
depreciation of AUD against SGD
The acquisitions and capital
expenditure were also funded by the
S$250m equity raised through private
placement and recycling of capital
from divestments of S$251m
Gearing ratio increased to 39.3% as at
31 Mar 2020, while interest rate
decreased to 2.5% per annum

Well-Staggered Debt Maturity Profile
13
Sufficient available committed credit facilities of over S$700m to refinance S$242m or 6% of total debt
due in the coming financial year
Debt maturity profile remains well staggered with an average debt duration of 4.1 years
Total Debt: S$3,550 million
6%
4%
16%
21%
20%
15% 15%
3%
0
100
200
300
400
500
600
700
800
FY20/21 FY21/22 FY22/23 FY23/24 FY24/25 FY25/26 FY26/27 FY27/28
S$mil
JPY KRW SGD MYR USD AUD HKD CNY
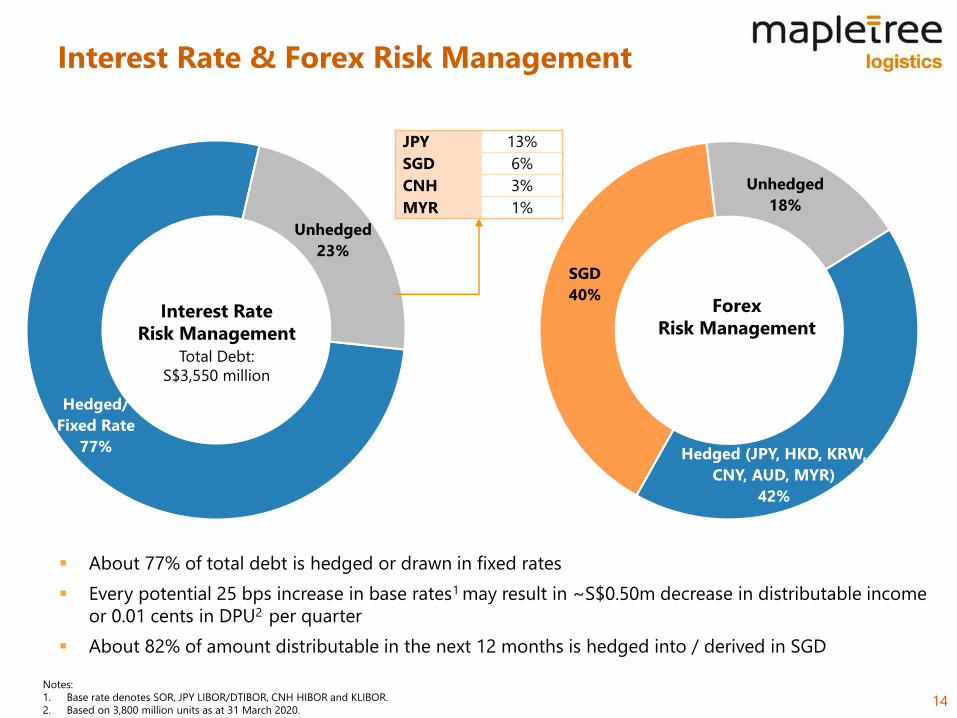
Interest Rate & Forex Risk Management
14
Hedged (JPY, HKD, KRW,
CNY, AUD, MYR)
42%
SGD
40%
Unhedged
18%
Hedged/
Fixed Rate
77%
Unhedged
23%
Interest Rate
Risk Management
JPY 13%
SGD 6%
CNH 3%
MYR 1%
Total Debt:
S$3,550 million
Forex
Risk Management
About 77% of total debt is hedged or drawn in fixed rates
Every potential 25 bps increase in base rates1 may result in ~S$0.50m decrease in distributable income
or 0.01 cents in DPU2 per quarter
About 82% of amount distributable in the next 12 months is hedged into / derived in SGD
Notes:
1. Base rate denotes SOR, JPY LIBOR/DTIBOR, CNH HIBOR and KLIBOR.
2. Based on 3,800 million units as at 31 March 2020.
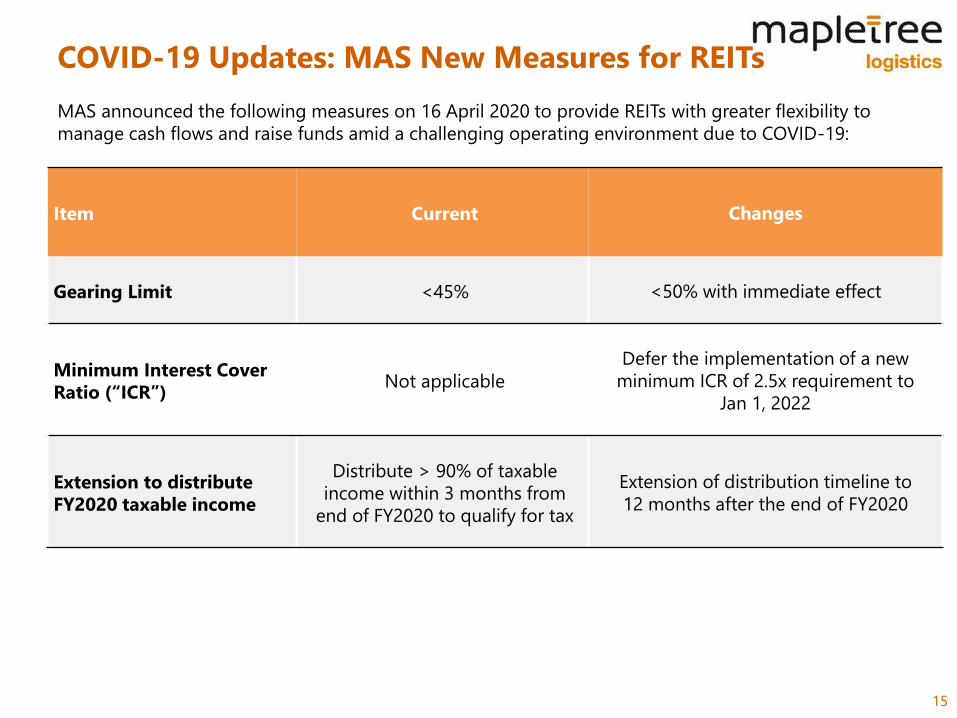
COVID-19 Updates: MAS New Measures for REITs
15
MAS announced the following measures on 16 April 2020 to provide REITs with greater flexibility to
manage cash flows and raise funds amid a challenging operating environment due to COVID-19:
Item Current Changes
Gearing Limit <45% <50% with immediate effect
Minimum Interest Cover
Ratio (“ICR”)Not applicable
Defer the implementation of a new
minimum ICR of 2.5x requirement to
Jan 1, 2022
Extension to distribute
FY2020 taxable income
Distribute > 90% of taxable
income within 3 months from
end of FY2020 to qualify for tax
Extension of distribution timeline to
12 months after the end of FY2020

16
Portfolio Review
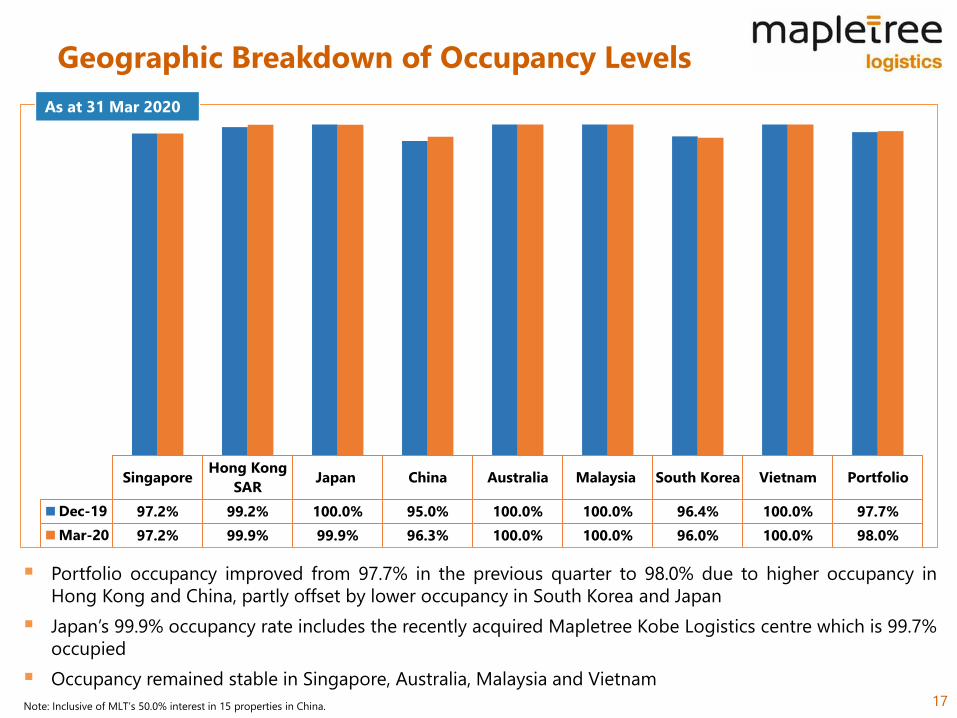
Geographic Breakdown of Occupancy Levels
17
As at 31 Mar 2020
Note: Inclusive of MLT’s 50.0% interest in 15 properties in China.
Portfolio occupancy improved from 97.7% in the previous quarter to 98.0% due to higher occupancy in
Hong Kong and China, partly offset by lower occupancy in South Korea and Japan
Japan’s 99.9% occupancy rate includes the recently acquired Mapletree Kobe Logistics centre which is 99.7%
occupied
Occupancy remained stable in Singapore, Australia, Malaysia and Vietnam
SingaporeHong Kong
SARJapan China Australia Malaysia South Korea Vietnam Portfolio
Dec-19 97.2% 99.2% 100.0% 95.0% 100.0% 100.0% 96.4% 100.0% 97.7%
Mar-20 97.2% 99.9% 99.9% 96.3% 100.0% 100.0% 96.0% 100.0% 98.0%
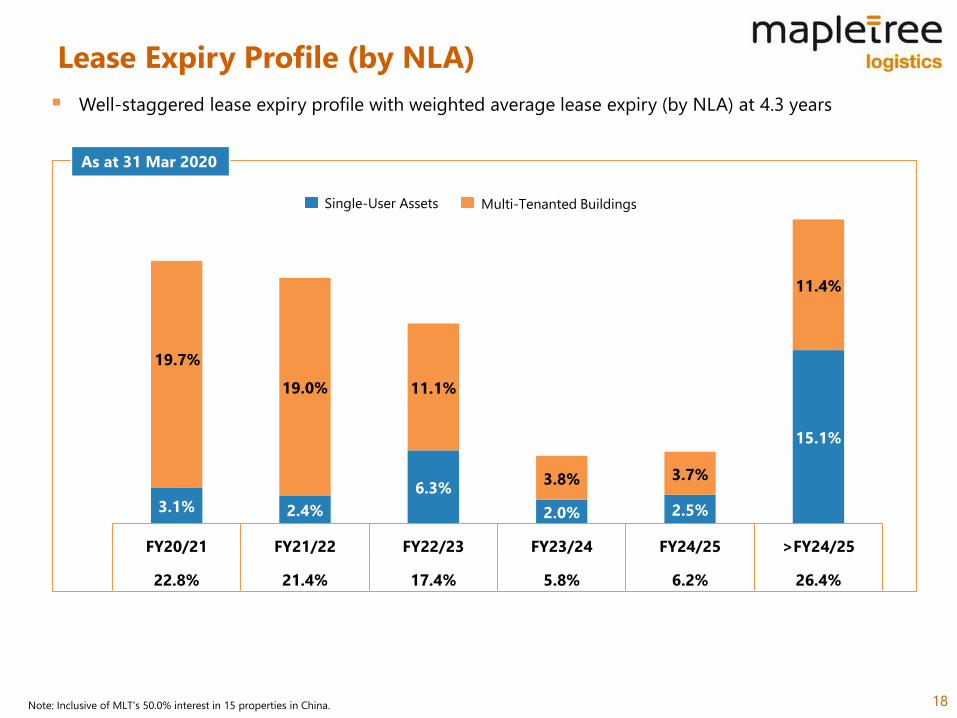
3.1% 2.4%
6.3%
2.0% 2.5%
15.1%
19.7%
19.0% 11.1%
3.8% 3.7%
11.4%
FY20/21 FY21/22 FY22/23 FY23/24 FY24/25 >FY24/25
22.8% 21.4% 17.4% 5.8% 6.2% 26.4%
Single-User Assets
Lease Expiry Profile (by NLA)
18
Multi-Tenanted Buildings
As at 31 Mar 2020
Well-staggered lease expiry profile with weighted average lease expiry (by NLA) at 4.3 years
Note: Inclusive of MLT’s 50.0% interest in 15 properties in China.
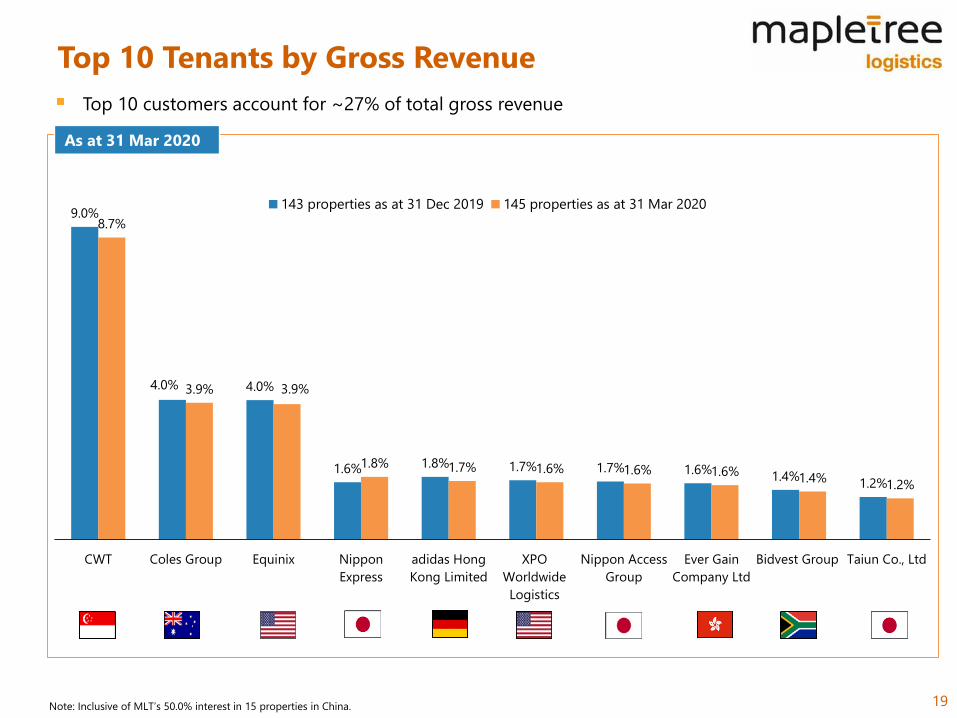
9.0%
4.0% 4.0%
1.6% 1.8% 1.7% 1.7% 1.6%1.4%
1.2%
8.7%
3.9% 3.9%
1.8% 1.7% 1.6% 1.6% 1.6%1.4%
1.2%
CWT Coles Group Equinix Nippon
Express
adidas Hong
Kong Limited
XPO
Worldwide
Logistics
Nippon Access
Group
Ever Gain
Company Ltd
Bidvest Group Taiun Co., Ltd
143 properties as at 31 Dec 2019 145 properties as at 31 Mar 2020
Top 10 Tenants by Gross Revenue
19
Top 10 customers account for ~27% of total gross revenue
As at 31 Mar 2020
Note: Inclusive of MLT’s 50.0% interest in 15 properties in China.
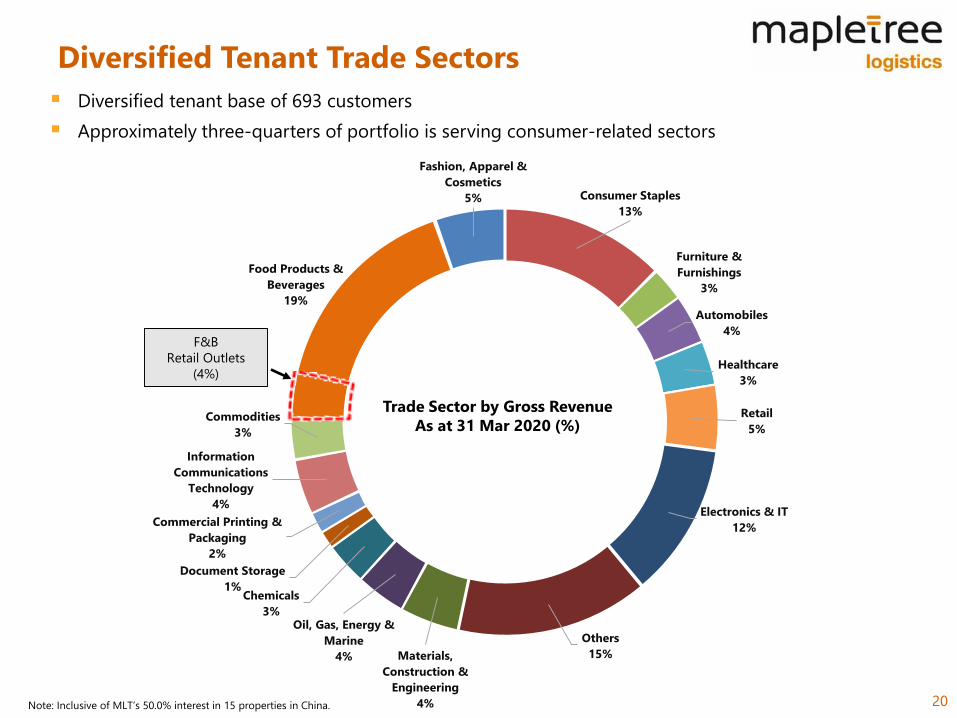
Fashion, Apparel &
Cosmetics
5% Consumer Staples
13%
Furniture &
Furnishings
3%
Automobiles
4%
Healthcare
3%
Retail
5%
Electronics & IT
12%
Others
15%Materials,
Construction &
Engineering
4%
Oil, Gas, Energy &
Marine
4%
Chemicals
3%
Document Storage
1%
Commercial Printing &
Packaging
2%
Information
Communications
Technology
4%
Commodities
3%
Food Products &
Beverages
19%
Trade Sector by Gross Revenue
As at 31 Mar 2020 (%)
Diversified Tenant Trade Sectors
20
Diversified tenant base of 693 customers
Approximately three-quarters of portfolio is serving consumer-related sectors
Note: Inclusive of MLT’s 50.0% interest in 15 properties in China.
F&B
Retail Outlets
(4%)
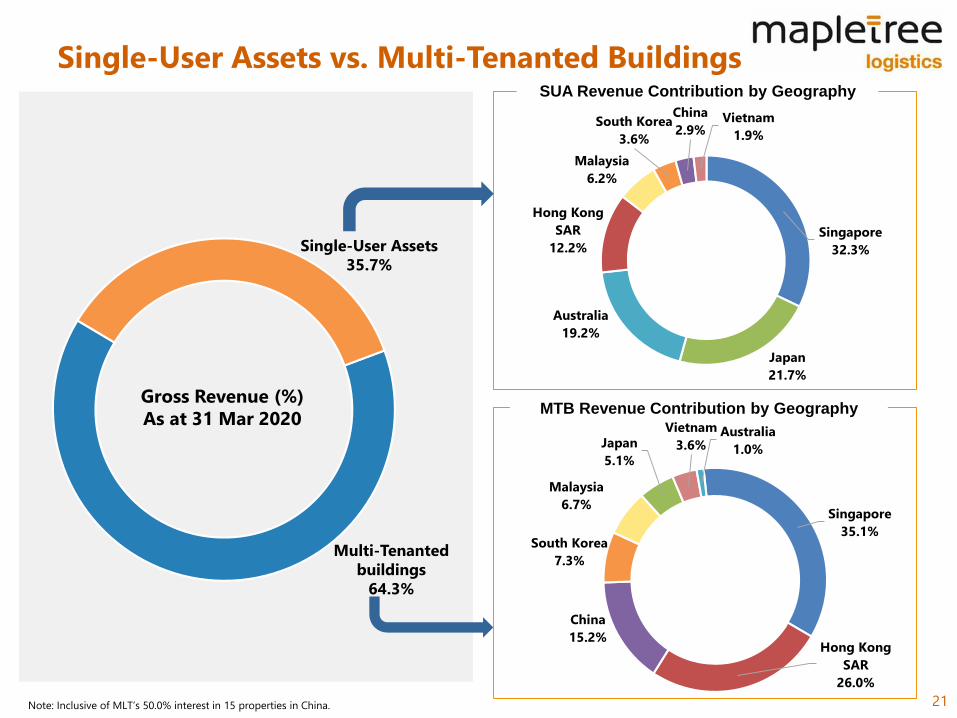
Single-User Assets vs. Multi-Tenanted Buildings
21
SUA Revenue Contribution by Geography
MTB Revenue Contribution by Geography
Single-User Assets
35.7%
Multi-Tenanted
buildings
64.3%
Note: Inclusive of MLT’s 50.0% interest in 15 properties in China.
Singapore
32.3%
Japan
21.7%
Australia
19.2%
Hong Kong
SAR
12.2%
Malaysia
6.2%
South Korea
3.6%
China
2.9%Vietnam
1.9%
Singapore
35.1%
Hong Kong
SAR
26.0%
China
15.2%
South Korea
7.3%
Malaysia
6.7%
Japan
5.1%
Vietnam
3.6%Australia
1.0%
Gross Revenue (%)
As at 31 Mar 2020
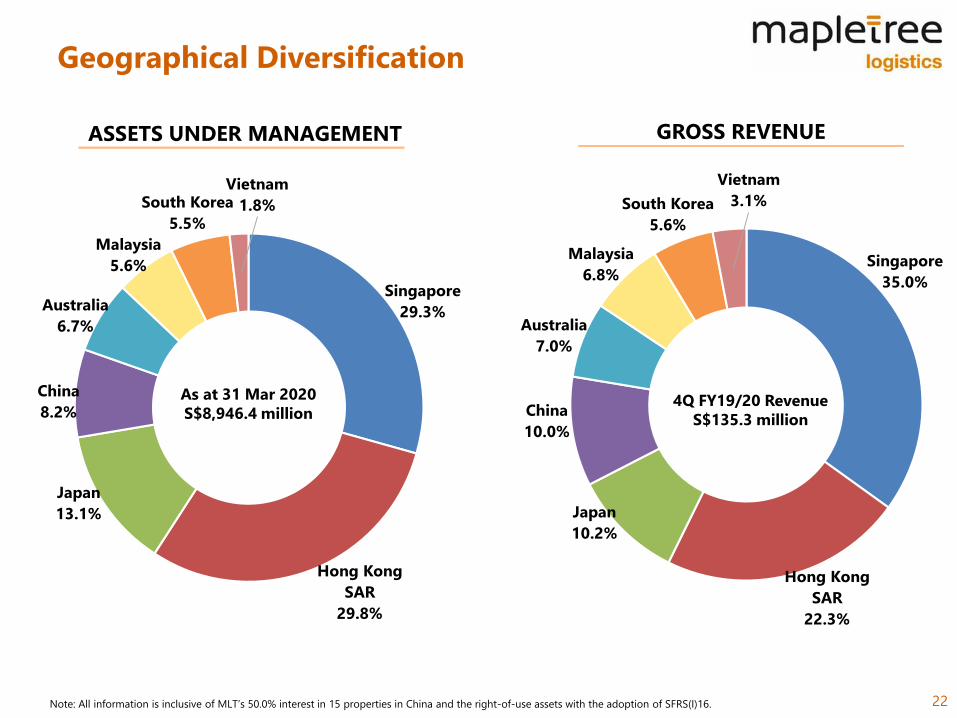
Singapore
35.0%
Hong Kong
SAR
22.3%
Japan
10.2%
China
10.0%
Australia
7.0%
Malaysia
6.8%
South Korea
5.6%
Vietnam
3.1%
Singapore
29.3%
Hong Kong
SAR
29.8%
Japan
13.1%
China
8.2%
Australia
6.7%
Malaysia
5.6%
South Korea
5.5%
Vietnam
1.8%
Geographical Diversification
22
ASSETS UNDER MANAGEMENT GROSS REVENUE
Note: All information is inclusive of MLT’s 50.0% interest in 15 properties in China and the right-of-use assets with the adoption of SFRS(I)16.
As at 31 Mar 2020
S$8,946.4 million 4Q FY19/20 Revenue
S$135.3 million

23
Investment Review
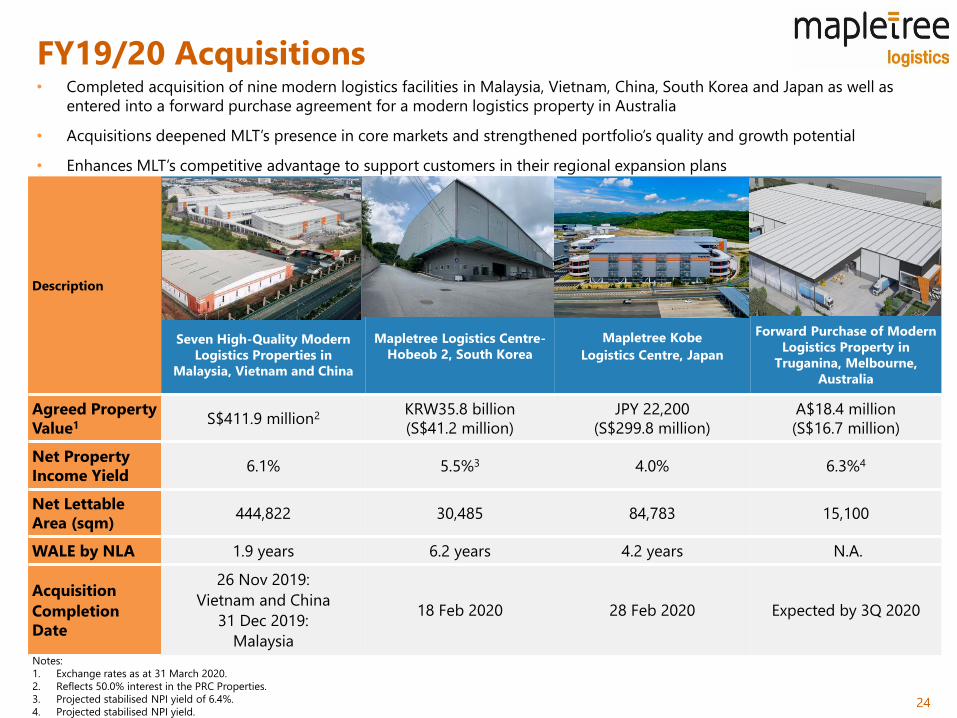
FY19/20 Acquisitions
24
Description
Seven High-Quality Modern
Logistics Properties in
Malaysia, Vietnam and China
Mapletree Logistics Centre-
Hobeob 2, South Korea
Mapletree Kobe
Logistics Centre, Japan
Forward Purchase of Modern
Logistics Property in
Truganina, Melbourne,
Australia
Agreed Property
Value1 S$411.9 million2 KRW35.8 billion
(S$41.2 million)
JPY 22,200
(S$299.8 million)
A$18.4 million
(S$16.7 million)
Net Property
Income Yield6.1% 5.5%3 4.0% 6.3%4
Net Lettable
Area (sqm) 444,822 30,485 84,783 15,100
WALE by NLA 1.9 years 6.2 years 4.2 years N.A.
Acquisition
Completion
Date
26 Nov 2019:
Vietnam and China
31 Dec 2019:
Malaysia
18 Feb 2020 28 Feb 2020 Expected by 3Q 2020
Notes:
1. Exchange rates as at 31 March 2020.
2. Reflects 50.0% interest in the PRC Properties.
3. Projected stabilised NPI yield of 6.4%.
4. Projected stabilised NPI yield.
• Completed acquisition of nine modern logistics facilities in Malaysia, Vietnam, China, South Korea and Japan as well as
entered into a forward purchase agreement for a modern logistics property in Australia
• Acquisitions deepened MLT’s presence in core markets and strengthened portfolio’s quality and growth potential
• Enhances MLT’s competitive advantage to support customers in their regional expansion plans
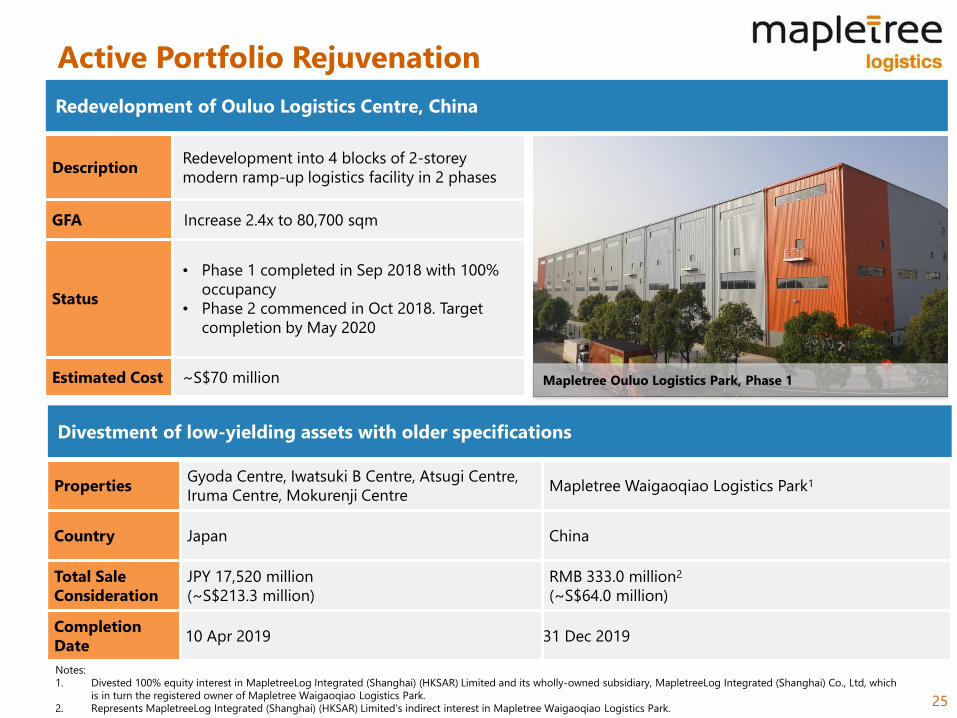
Active Portfolio Rejuvenation
25
Redevelopment of Ouluo Logistics Centre, China
DescriptionRedevelopment into 4 blocks of 2-storey
modern ramp-up logistics facility in 2 phases
GFA Increase 2.4x to 80,700 sqm
Status
• Phase 1 completed in Sep 2018 with 100%
occupancy
• Phase 2 commenced in Oct 2018. Target
completion by May 2020
Estimated Cost ~S$70 million
Divestment of low-yielding assets with older specifications
PropertiesGyoda Centre, Iwatsuki B Centre, Atsugi Centre,
Iruma Centre, Mokurenji CentreMapletree Waigaoqiao Logistics Park1
Country Japan China
Total Sale
Consideration
JPY 17,520 million
(~S$213.3 million)
RMB 333.0 million2
(~S$64.0 million)
Completion
Date10 Apr 2019 31 Dec 2019
Mapletree Ouluo Logistics Park, Phase 1
Notes:
1. Divested 100% equity interest in MapletreeLog Integrated (Shanghai) (HKSAR) Limited and its wholly-owned subsidiary, MapletreeLog Integrated (Shanghai) Co., Ltd, which
is in turn the registered owner of Mapletree Waigaoqiao Logistics Park.
2. Represents MapletreeLog Integrated (Shanghai) (HKSAR) Limited’s indirect interest in Mapletree Waigaoqiao Logistics Park.

Portfolio Valuation
26
Country
Valuation as at
31 Mar 2020
Valuation as at
31 Mar 2019Cap rates
No. of
PropertiesLocal Currency
No. of
PropertiesLocal Currency As at 31 Mar 2020 As at 31 Mar 2019
Singapore 52 SGD 2,499 mil1 52 SGD 2,504 mil 5.25% - 7.00% 5.25% - 7.00%
Hong Kong,
SAR9 HKD 14,975 mil 9 HKD 14,324 mil 3.75% - 4.60% 3.75% - 4.60%
Japan 17 JPY 86,605 mil 20 JPY 77,674 mil 4.20% - 5.90% 4.70% - 5.90%
China 8 CNY 1,695 mil 9 CNY 1,768 mil 5.25% - 6.50% 5.25% - 6.50%
Australia 10 AUD 662 mil 10 AUD 650 mil 4.75% - 7.50% 5.25% - 8.25%
Malaysia 15 MYR 1,523 mil 14 MYR 678 mil 6.50% - 8.00%2 6.50% - 8.00%
South Korea 13 KRW 425,751 mil 12 KRW 383,501 mil 5.50% - 6.90% 5.75% - 7.00%
Vietnam 6 VND 2,672,200 mil 4 VND 1,765,250 mil 9.00% - 9.75% 9.50% - 10.00%
Sub-Total 130 SGD 8,429.2 mil 130 SGD 7,693.7 mil
Joint Venture Properties in China
Valuation as at
31 Mar 2020
Valuation as at
31 Mar 2019Cap rates
As at 31 Mar 2020 As at 31 Mar 2019
11 properties
acquired in FY18/19CNY 3,036 mil CNY 2,907 mil 5.25%-6.50% 6.25% - 6.50%
4 properties acquired in
FY19/20CNY 951 mil N.A. 5.00%-5.50% N.A.
MLT’s 50.0% Interest in
Joint Venture Properties
in China
SGD 398.0 mil SGD 293.7 mil
MLT’s Total Portfolio SGD 8,827.2 mil SGD 7,987.4 mil
Note:
1. Excludes right-of-use (ROU) assets of S$119.2 million
2. Excludes Mapletree Logistics Hub - Shah Alam of which valuation was based on the cost approach and discounted cash flow method.
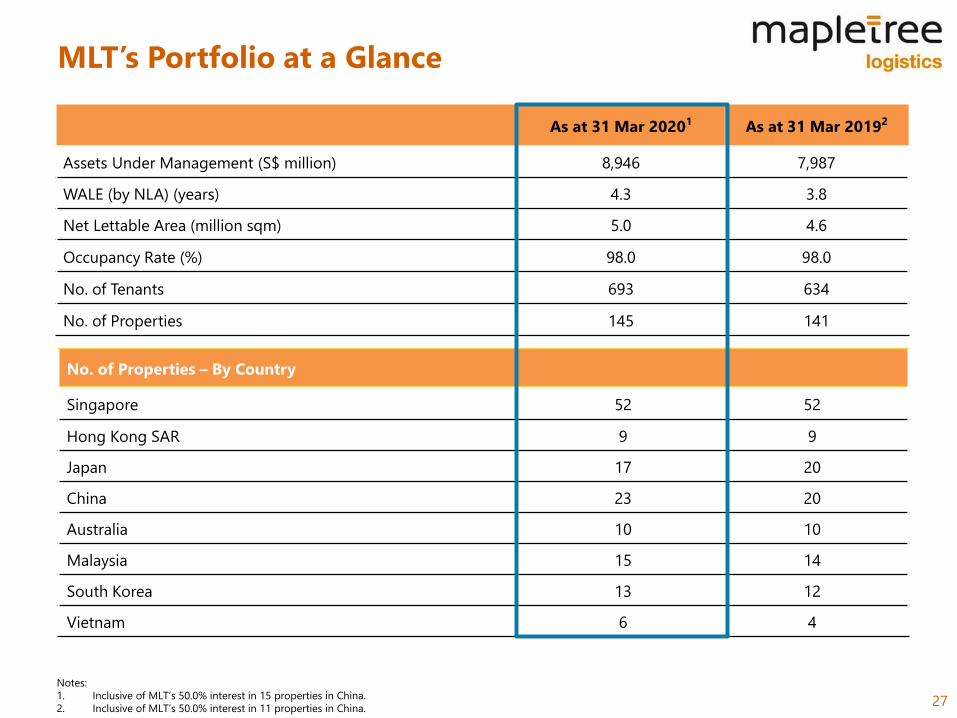
MLT’s Portfolio at a Glance
27
As at 31 Mar 20201 As at 31 Mar 20192
Assets Under Management (S$ million) 8,946 7,987
WALE (by NLA) (years) 4.3 3.8
Net Lettable Area (million sqm) 5.0 4.6
Occupancy Rate (%) 98.0 98.0
No. of Tenants 693 634
No. of Properties 145 141
No. of Properties – By Country
Singapore 52 52
Hong Kong SAR 9 9
Japan 17 20
China 23 20
Australia 10 10
Malaysia 15 14
South Korea 13 12
Vietnam 6 4
Notes:
1. Inclusive of MLT’s 50.0% interest in 15 properties in China.
2. Inclusive of MLT’s 50.0% interest in 11 properties in China.

28
Outlook
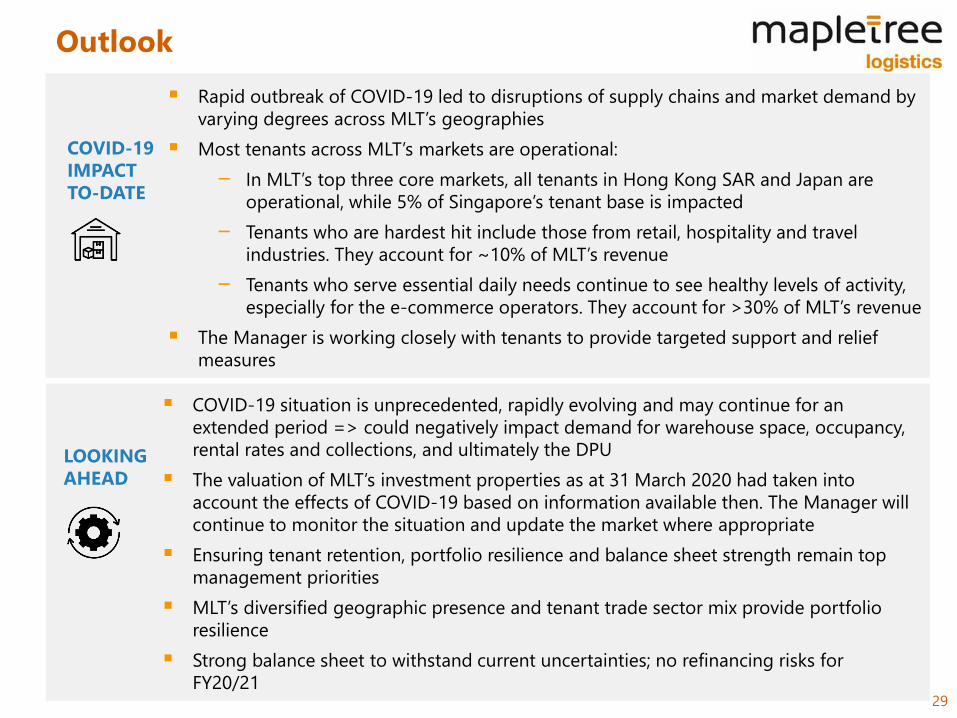
Outlook
29
COVID-19
IMPACT
TO-DATE
Rapid outbreak of COVID-19 led to disruptions of supply chains and market demand by
varying degrees across MLT’s geographies
Most tenants across MLT’s markets are operational:
− In MLT’s top three core markets, all tenants in Hong Kong SAR and Japan are
operational, while 5% of Singapore’s tenant base is impacted
− Tenants who are hardest hit include those from retail, hospitality and travel
industries. They account for ~10% of MLT’s revenue
− Tenants who serve essential daily needs continue to see healthy levels of activity,
especially for the e-commerce operators. They account for >30% of MLT’s revenue
The Manager is working closely with tenants to provide targeted support and relief
measures
LOOKING
AHEAD
COVID-19 situation is unprecedented, rapidly evolving and may continue for an
extended period => could negatively impact demand for warehouse space, occupancy,
rental rates and collections, and ultimately the DPU
The valuation of MLT’s investment properties as at 31 March 2020 had taken into
account the effects of COVID-19 based on information available then. The Manager will
continue to monitor the situation and update the market where appropriate
Ensuring tenant retention, portfolio resilience and balance sheet strength remain top
management priorities
MLT’s diversified geographic presence and tenant trade sector mix provide portfolio
resilience
Strong balance sheet to withstand current uncertainties; no refinancing risks for
FY20/21

30
Appendix
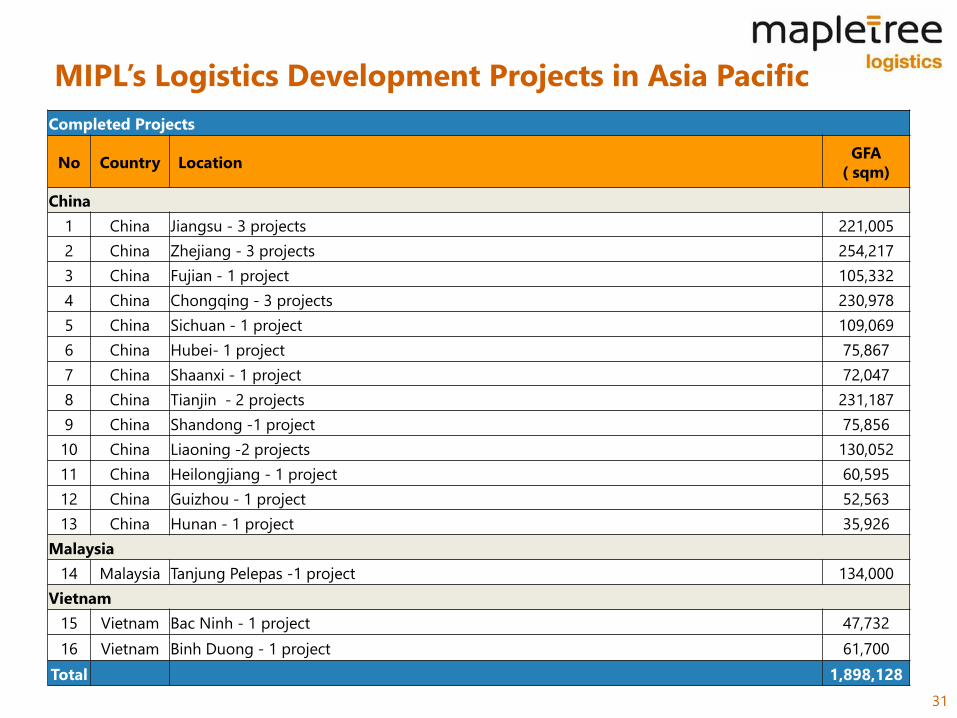
MIPL’s Logistics Development Projects in Asia Pacific
31
Completed Projects
No Country LocationGFA
( sqm)
China
1 China Jiangsu - 3 projects 221,005
2 China Zhejiang - 3 projects 254,217
3 China Fujian - 1 project 105,332
4 China Chongqing - 3 projects 230,978
5 China Sichuan - 1 project 109,069
6 China Hubei- 1 project 75,867
7 China Shaanxi - 1 project 72,047
8 China Tianjin - 2 projects 231,187
9 China Shandong -1 project 75,856
10 China Liaoning -2 projects 130,052
11 China Heilongjiang - 1 project 60,595
12 China Guizhou - 1 project 52,563
13 China Hunan - 1 project 35,926
Malaysia
14 Malaysia Tanjung Pelepas -1 project 134,000
Vietnam
15 Vietnam Bac Ninh - 1 project 47,732
16 Vietnam Binh Duong - 1 project 61,700
Total 1,898,128
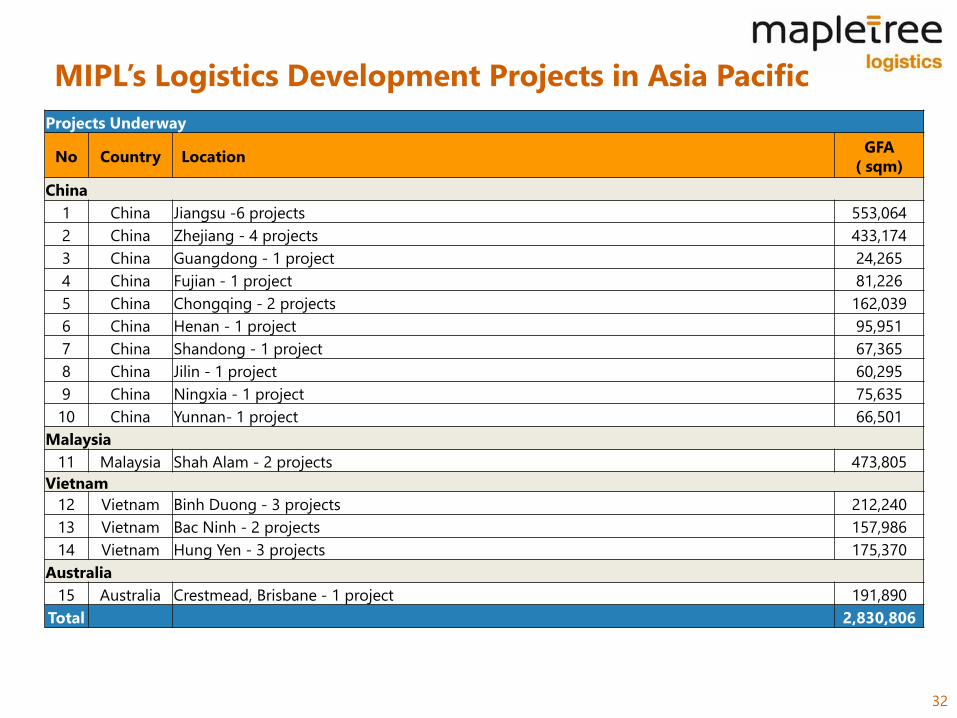
MIPL’s Logistics Development Projects in Asia Pacific
32
Projects Underway
No Country LocationGFA
( sqm)
China
1 China Jiangsu -6 projects 553,064
2 China Zhejiang - 4 projects 433,174
3 China Guangdong - 1 project 24,265
4 China Fujian - 1 project 81,226
5 China Chongqing - 2 projects 162,039
6 China Henan - 1 project 95,951
7 China Shandong - 1 project 67,365
8 China Jilin - 1 project 60,295
9 China Ningxia - 1 project 75,635
10 China Yunnan- 1 project 66,501
Malaysia
11 Malaysia Shah Alam - 2 projects 473,805
Vietnam
12 Vietnam Binh Duong - 3 projects 212,240
13 Vietnam Bac Ninh - 2 projects 157,986
14 Vietnam Hung Yen - 3 projects 175,370
Australia
15 Australia Crestmead, Brisbane - 1 project 191,890
Total 2,830,806
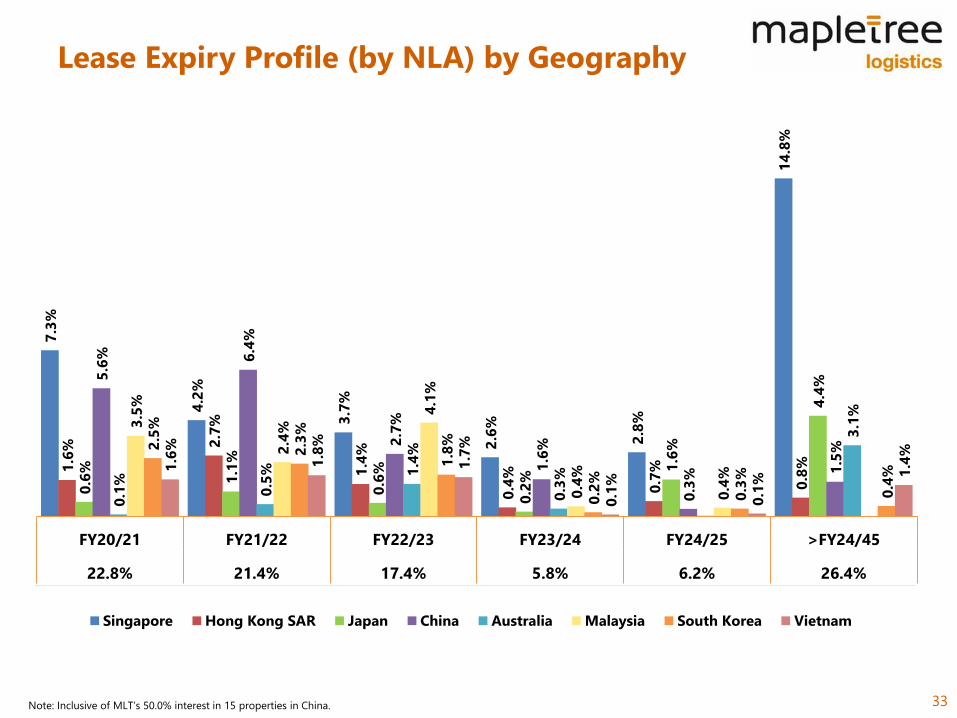
Lease Expiry Profile (by NLA) by Geography
33Note: Inclusive of MLT’s 50.0% interest in 15 properties in China.
7.3
%
4.2
%
3.7
%
2.6
%
2.8
%
14
.8%
1.6
% 2.7
%
1.4
%
0.4
%
0.7
%
0.8
%
0.6
%
1.1
%
0.6
%
0.2
%
1.6
%
4.4
%5.6
% 6.4
%
2.7
%
1.6
%
0.3
% 1.5
%
0.1
%
0.5
% 1.4
%
0.3
%
3.1
%
3.5
%
2.4
%
4.1
%
0.4
%
0.4
%
2.5
%
2.3
%
1.8
%
0.2
%
0.3
%
0.4
%1.6
%
1.8
%
1.7
%
0.1
%
0.1
%
1.4
%
FY20/21 FY21/22 FY22/23 FY23/24 FY24/25 >FY24/45
22.8% 21.4% 17.4% 5.8% 6.2% 26.4%
Singapore Hong Kong SAR Japan China Australia Malaysia South Korea Vietnam
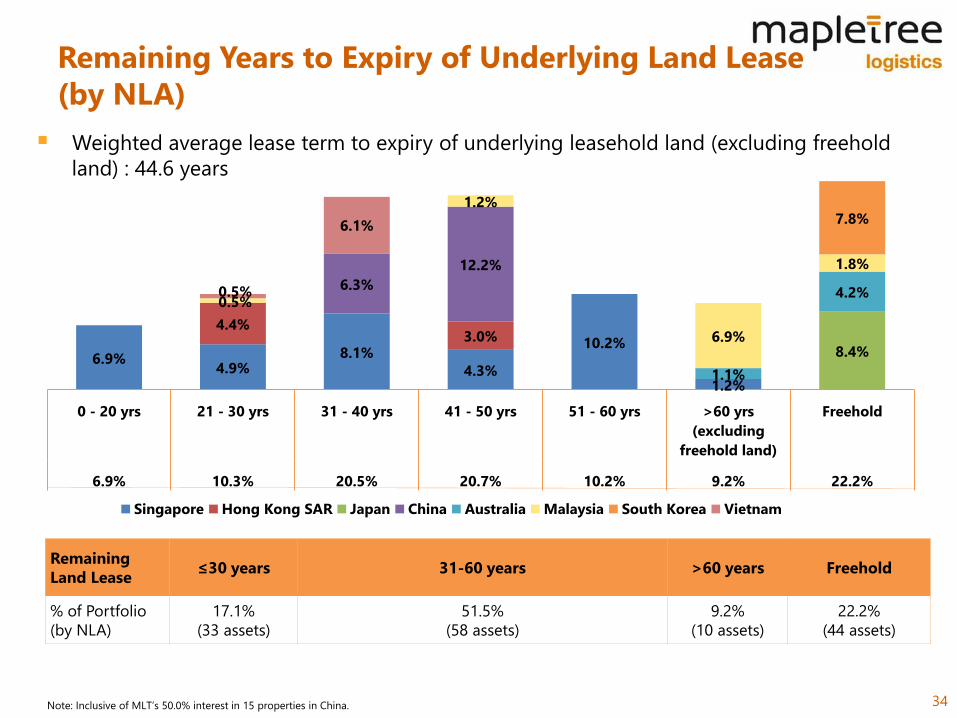
Remaining Years to Expiry of Underlying Land Lease
(by NLA)
34
Remaining
Land Lease≤30 years 31-60 years >60 years Freehold
% of Portfolio
(by NLA)
17.1%
(33 assets)
51.5%
(58 assets)
9.2%
(10 assets)
22.2%
(44 assets)
Weighted average lease term to expiry of underlying leasehold land (excluding freehold
land) : 44.6 years
Note: Inclusive of MLT’s 50.0% interest in 15 properties in China.
6.9%4.9%
8.1%
4.3%
10.2%
1.2%
4.4%3.0%
8.4%
6.3%
12.2%
1.1%
4.2%0.5%
1.2%
6.9%
1.8%
7.8%
0.5%
6.1%
0 - 20 yrs 21 - 30 yrs 31 - 40 yrs 41 - 50 yrs 51 - 60 yrs >60 yrs
(excluding
freehold land)
Freehold
6.9% 10.3% 20.5% 20.7% 10.2% 9.2% 22.2%
Singapore Hong Kong SAR Japan China Australia Malaysia South Korea Vietnam