Embed Size (px)
Citation preview
22nd Annual ABA Real Estate Survey Report
May 2015
aba.com 1-800-BANKERS1
aba.com 1-800-BANKERS
Contents
Acknowledgements 3
REAL ESTATE LENDING SURVEY
Summary of Key Survey Findings 5
Survey Participant Profile 6
Loan Production 8
Loan Destination 14
Mortgage Products and Features 23
Regulatory Impact 33
Vendor Information and Compliance Concerns 41
Mortgage Market Outlook and Concerns 44
TILA/RESPA INTEGRATION DISCLOSURE SURVEY
Survey Methodology 46
Survey Results 47
2
aba.com 1-800-BANKERS
Staff Contributors:
Bob Davis, Executive Vice President, American Bankers Association
Rod Alba, SVP, Sr. Regulatory Counsel, American Bankers Association
Joe Pigg, SVP, Sr. Counsel, American Bankers Association
Krista Shonk, VP, Sr. Regulatory Counsel, American Bankers Association
Debbie Whiteside, SVP Mortgage Solutions, American Bankers Association
Alex Maroulis-Cronmiller, VP, American Bankers Association
Ashley Gunn, Senior Banking Analyst, American Bankers Association
Acknowledgements
The American Bankers Association extends its appreciation to the bankers who contributed essential
information to the 22nd edition of the Real Estate Lending Survey. Their participation in this
extensive study, despite already heavy reporting burdens, ensured the success of this research project.
Michael Mazur, Senior Manager, American Bankers Association
Data Processing and Analysis provided by:
3
aba.com 1-800-BANKERS
REAL ESTATE LENDING SURVEY
4
aba.com 1-800-BANKERS
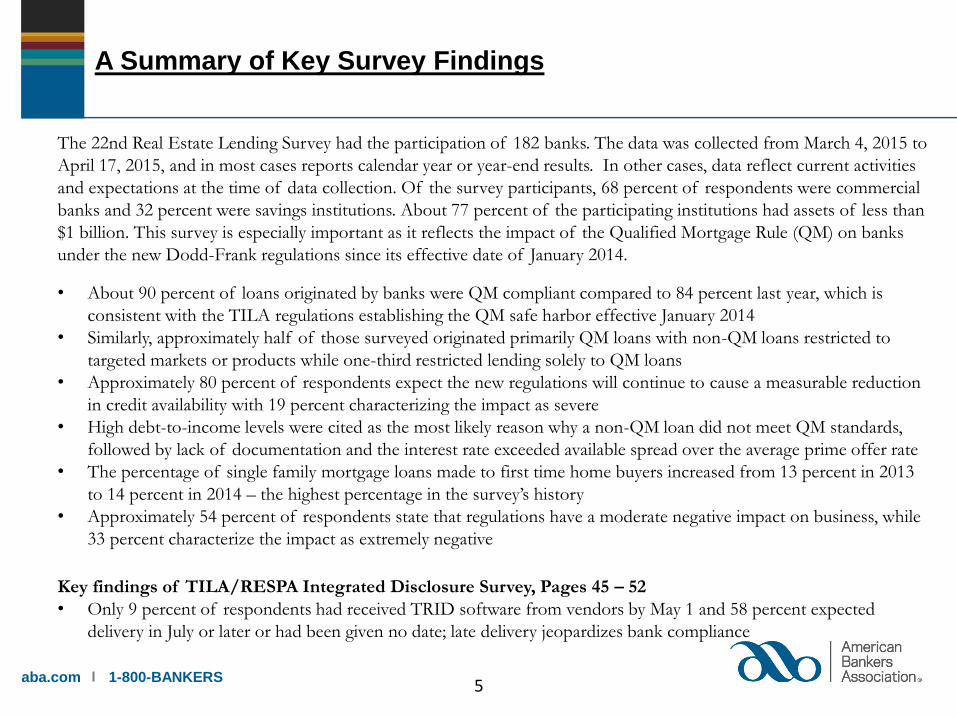
The 22nd Real Estate Lending Survey had the participation of 182 banks. The data was collected from March 4, 2015 to
April 17, 2015, and in most cases reports calendar year or year-end results. In other cases, data reflect current activities
and expectations at the time of data collection. Of the survey participants, 68 percent of respondents were commercial
banks and 32 percent were savings institutions. About 77 percent of the participating institutions had assets of less than
$1 billion. This survey is especially important as it reflects the impact of the Qualified Mortgage Rule (QM) on banks
under the new Dodd-Frank regulations since its effective date of January 2014.
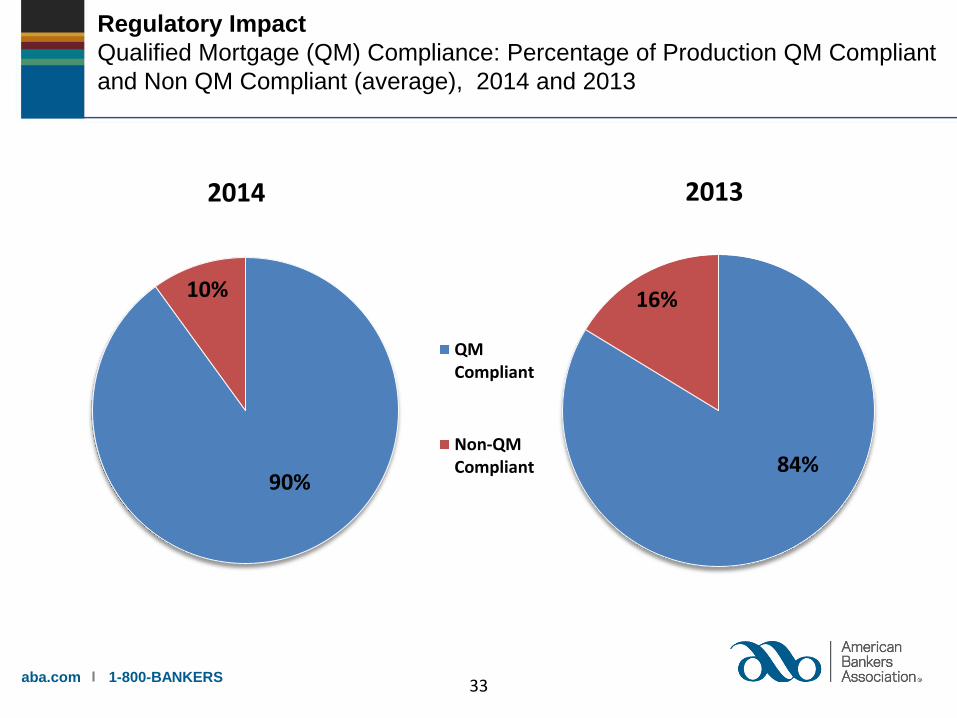
• About 90 percent of loans originated by banks were QM compliant compared to 84 percent last year, which is
consistent with the TILA regulations establishing the QM safe harbor effective January 2014
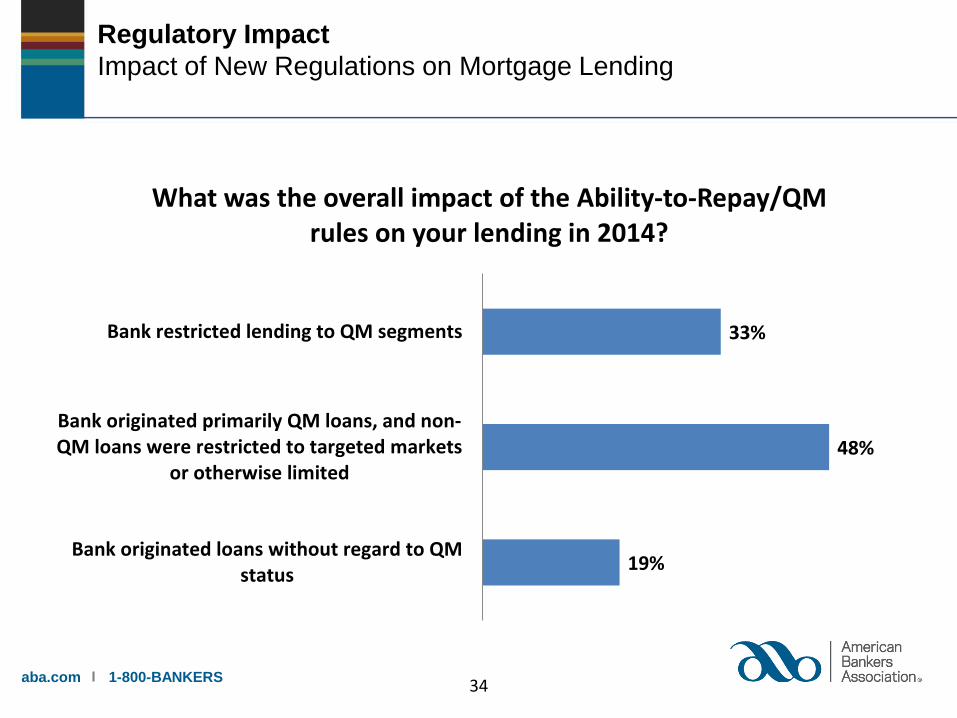
• Similarly, approximately half of those surveyed originated primarily QM loans with non-QM loans restricted to
targeted markets or products while one-third restricted lending solely to QM loans
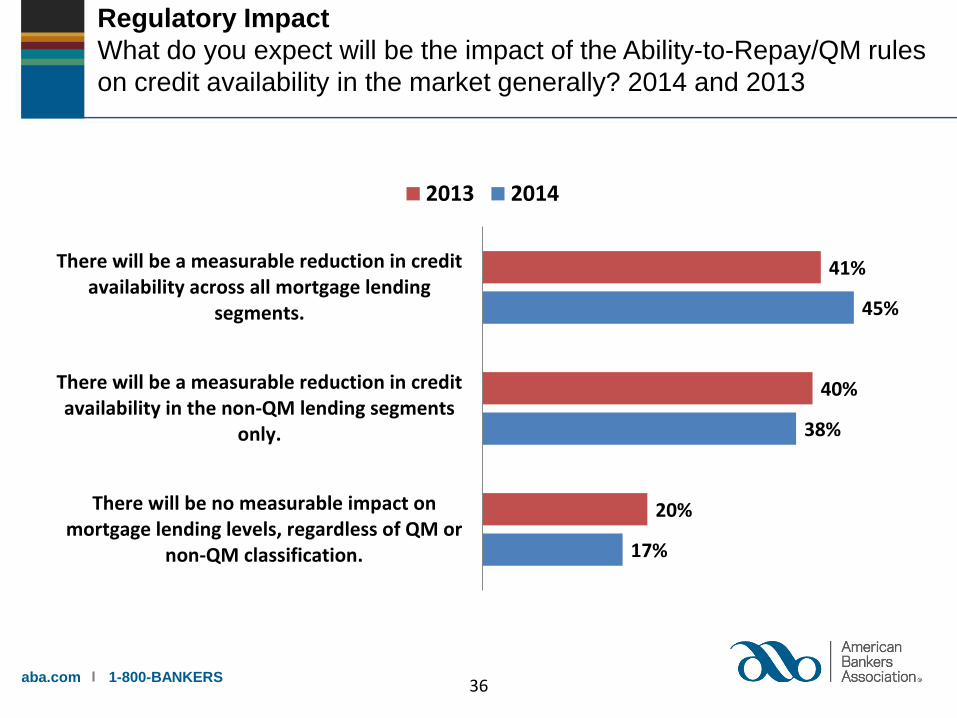
• Approximately 80 percent of respondents expect the new regulations will continue to cause a measurable reduction
in credit availability with 19 percent characterizing the impact as severe
• High debt-to-income levels were cited as the most likely reason why a non-QM loan did not meet QM standards,
followed by lack of documentation and the interest rate exceeded available spread over the average prime offer rate
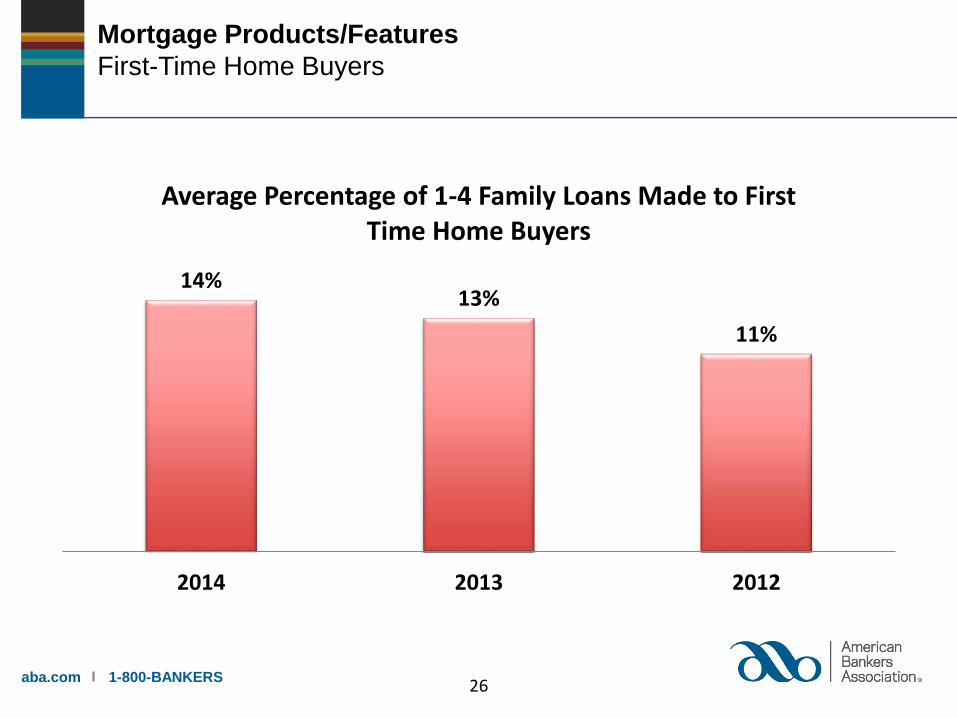
• The percentage of single family mortgage loans made to first time home buyers increased from 13 percent in 2013
to 14 percent in 2014 – the highest percentage in the survey’s history
• Approximately 54 percent of respondents state that regulations have a moderate negative impact on business, while
33 percent characterize the impact as extremely negative
Key findings of TILA/RESPA Integrated Disclosure Survey, Pages 45 – 52
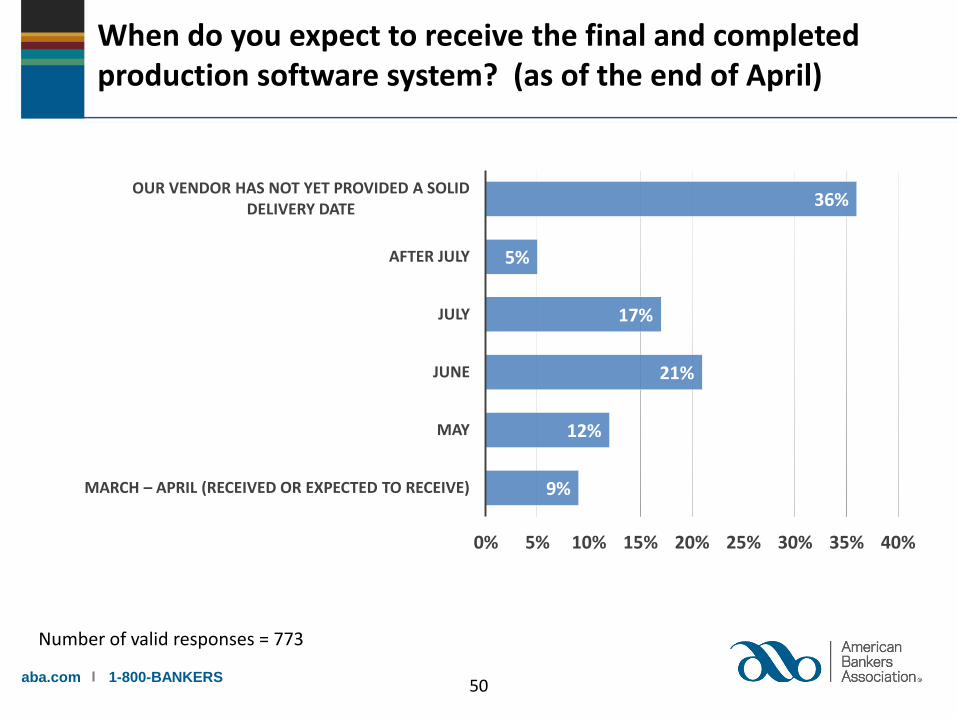
• Only 9 percent of respondents had received TRID software from vendors by May 1 and 58 percent expected
delivery in July or later or had been given no date; late delivery jeopardizes bank compliance
A Summary of Key Survey Findings
5
aba.com 1-800-BANKERS
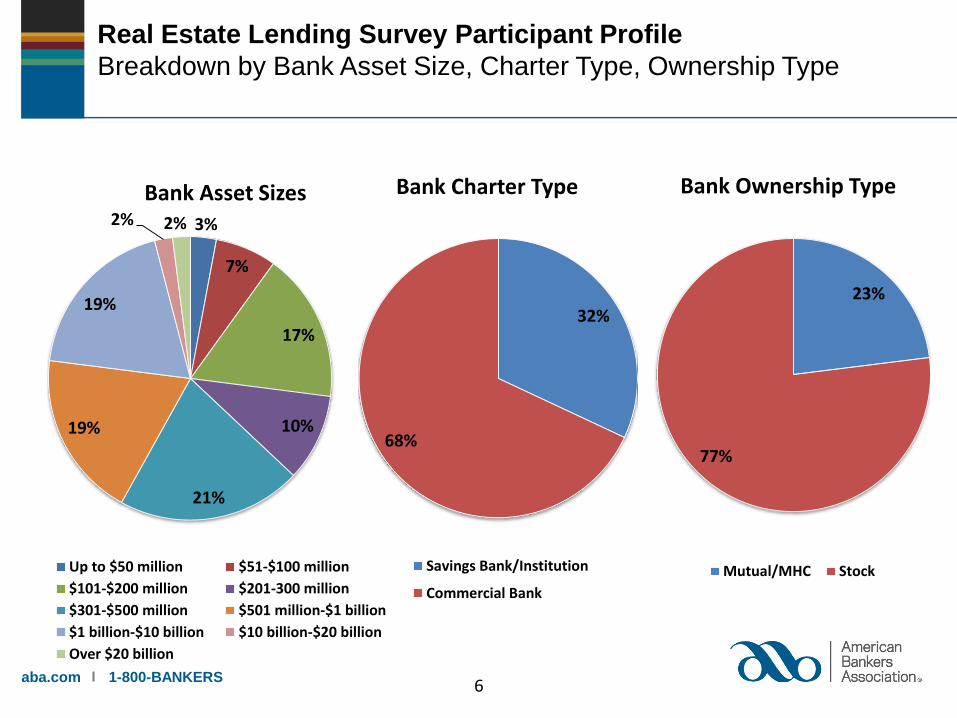
3%
7%
17%
10%
21%
19%
19%
2% 2%
Bank Asset Sizes
Up to $50 million $51-$100 million
$101-$200 million $201-300 million
$301-$500 million $501 million-$1 billion
$1 billion-$10 billion $10 billion-$20 billion
Over $20 billion
32%
68%
Bank Charter Type
Savings Bank/Institution
Commercial Bank
23%
77%
Bank Ownership Type
Mutual/MHC Stock
Real Estate Lending Survey Participant Profile
Breakdown by Bank Asset Size, Charter Type, Ownership Type
6
aba.com 1-800-BANKERS
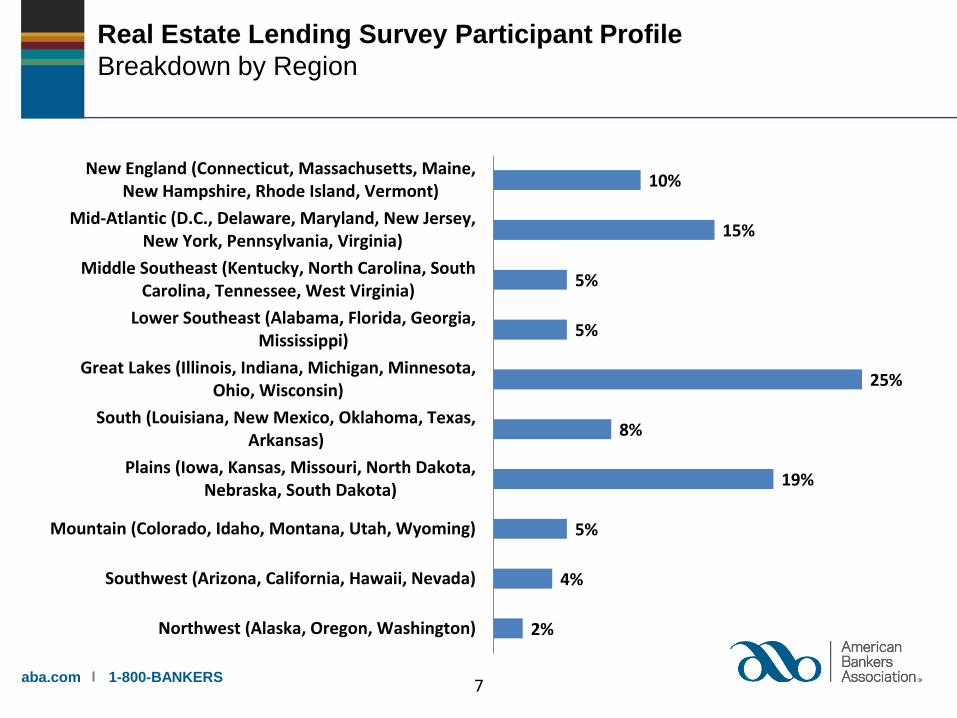
Real Estate Lending Survey Participant Profile
Breakdown by Region
2%
4%
5%
19%
8%
25%
5%
5%
15%
10%
Northwest (Alaska, Oregon, Washington)
Southwest (Arizona, California, Hawaii, Nevada)
Mountain (Colorado, Idaho, Montana, Utah, Wyoming)
Plains (Iowa, Kansas, Missouri, North Dakota,Nebraska, South Dakota)
South (Louisiana, New Mexico, Oklahoma, Texas,Arkansas)
Great Lakes (Illinois, Indiana, Michigan, Minnesota,Ohio, Wisconsin)
Lower Southeast (Alabama, Florida, Georgia,Mississippi)
Middle Southeast (Kentucky, North Carolina, SouthCarolina, Tennessee, West Virginia)
Mid-Atlantic (D.C., Delaware, Maryland, New Jersey,New York, Pennsylvania, Virginia)
New England (Connecticut, Massachusetts, Maine,New Hampshire, Rhode Island, Vermont)
7
aba.com 1-800-BANKERS
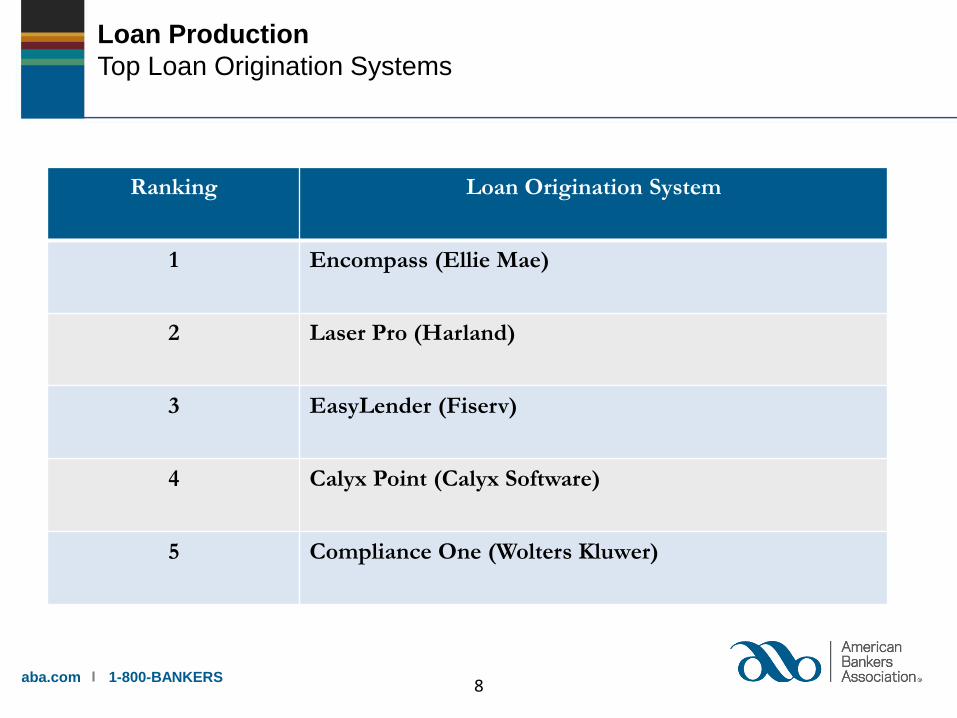
Loan Production
Top Loan Origination Systems
Ranking Loan Origination System
1 Encompass (Ellie Mae)
2 Laser Pro (Harland)
3 EasyLender (Fiserv)
4 Calyx Point (Calyx Software)
5 Compliance One (Wolters Kluwer)
8
aba.com 1-800-BANKERS
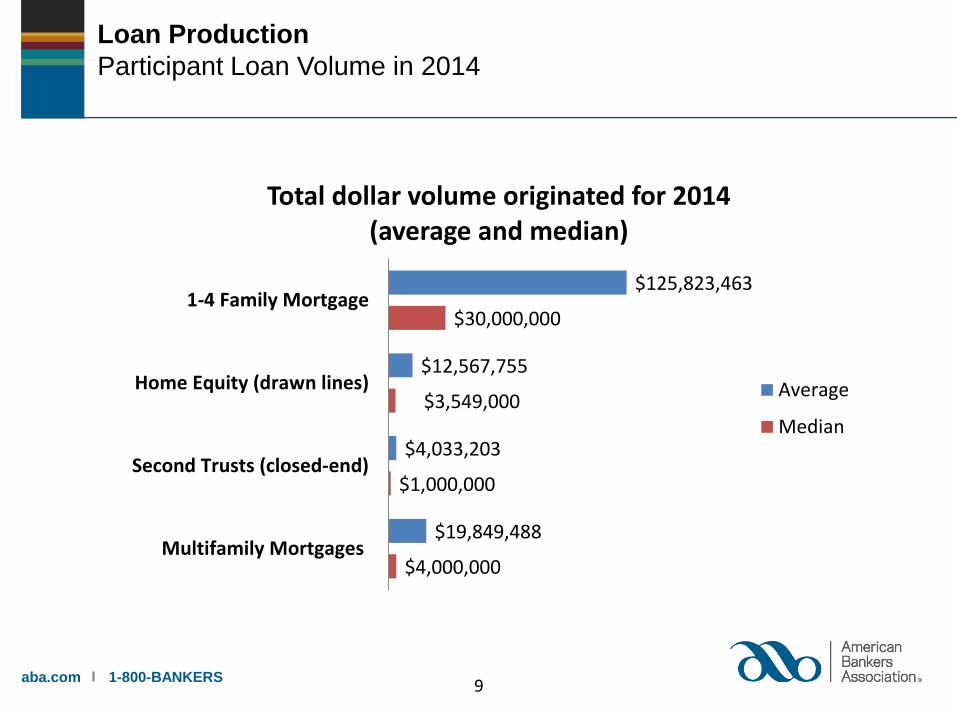
Loan Production
Participant Loan Volume in 2014
$125,823,463
$12,567,755
$4,033,203
$19,849,488
$30,000,000
$3,549,000
$1,000,000
$4,000,000
1-4 Family Mortgage
Home Equity (drawn lines)
Second Trusts (closed-end)
Multifamily Mortgages
Total dollar volume originated for 2014 (average and median)
Average
Median
9
aba.com 1-800-BANKERS
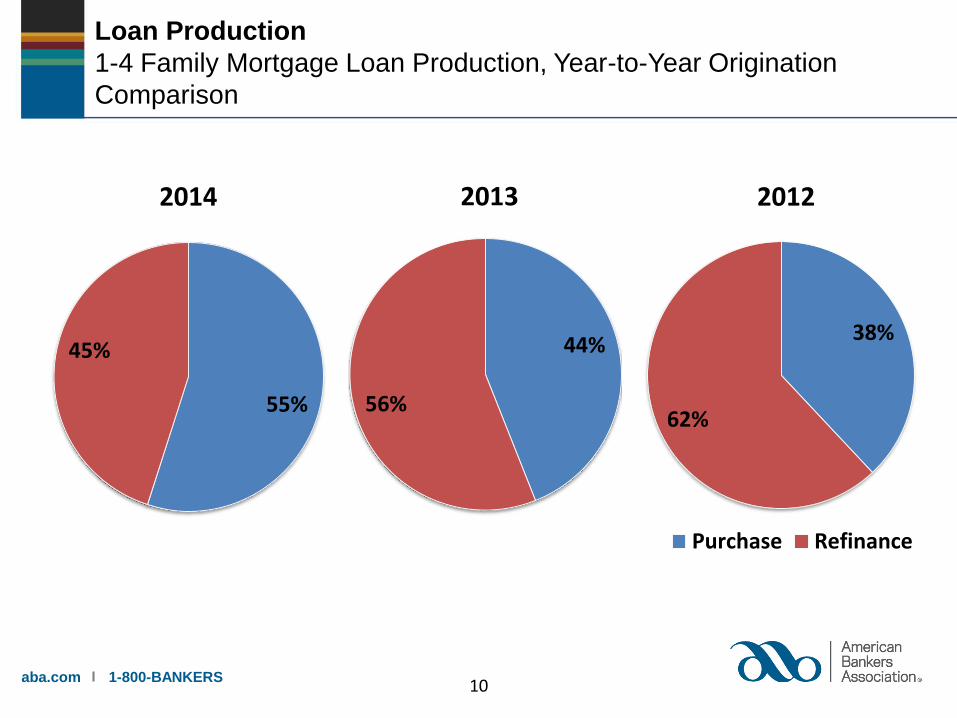
Loan Production
1-4 Family Mortgage Loan Production, Year-to-Year Origination
Comparison
38%
62%
2012
Purchase Refinance
55%
45%
2014
44%
56%
2013
10
aba.com 1-800-BANKERS
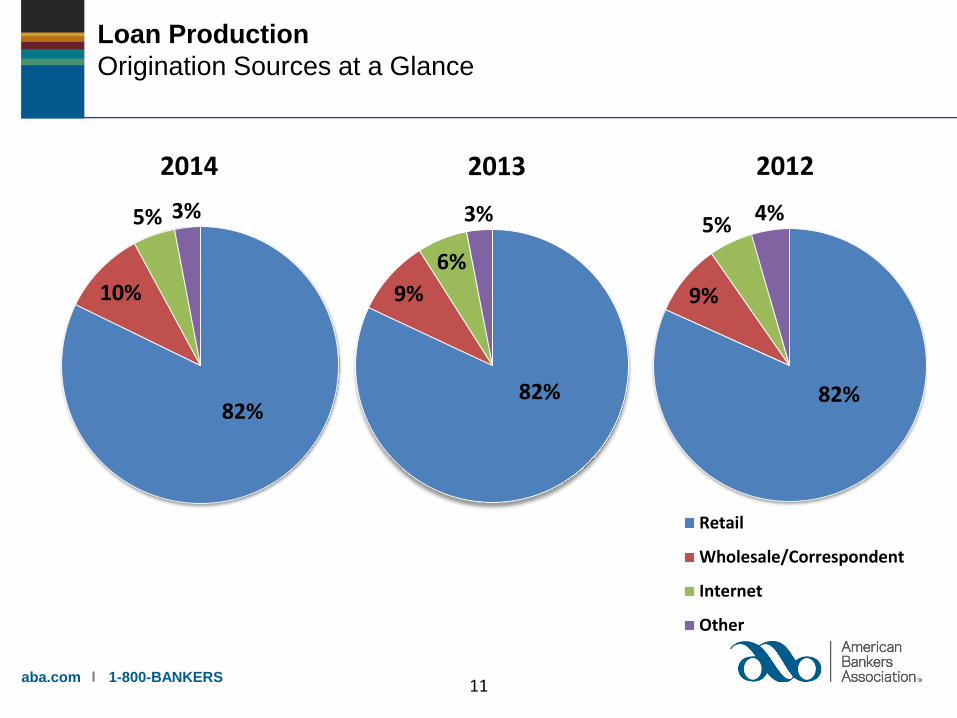
Loan Production
Origination Sources at a Glance
82%
9%
5% 4%
2012
Retail
Wholesale/Correspondent
Internet
Other
82%
10%
5% 3%
2014
82%
9%
6%
3%
2013
11
aba.com 1-800-BANKERS
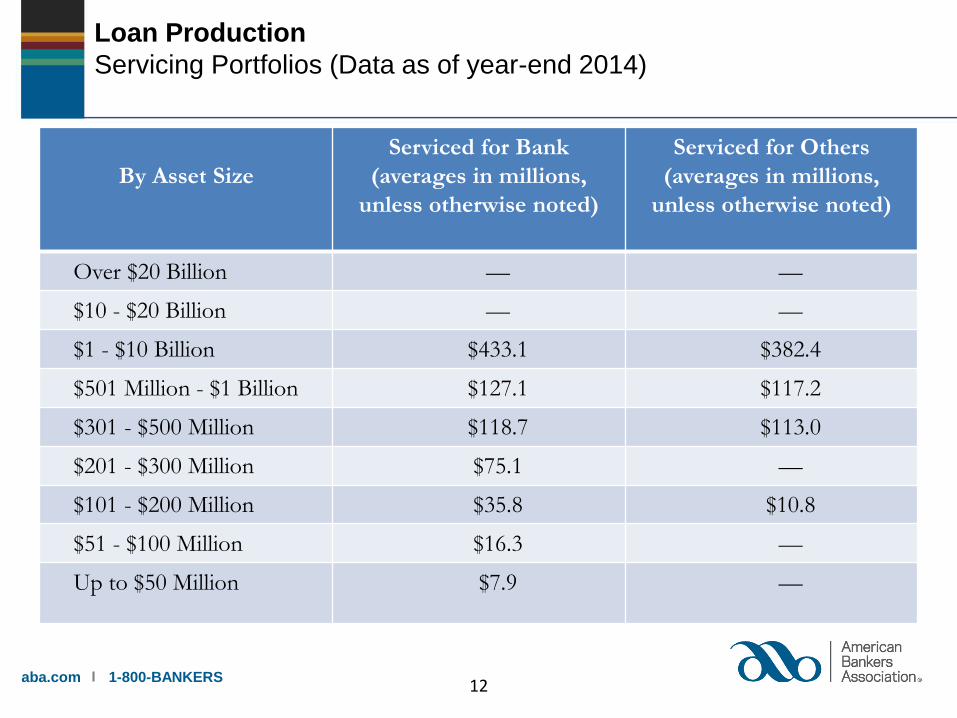
By Asset Size
Serviced for Bank
(averages in millions,
unless otherwise noted)
Serviced for Others
(averages in millions,
unless otherwise noted)
Over $20 Billion — —
$10 - $20 Billion — —
$1 - $10 Billion $433.1 $382.4
$501 Million - $1 Billion $127.1 $117.2
$301 - $500 Million $118.7 $113.0
$201 - $300 Million $75.1 —
$101 - $200 Million $35.8 $10.8
$51 - $100 Million $16.3 —
Up to $50 Million $7.9 —
Loan Production
Servicing Portfolios (Data as of year-end 2014)
12
aba.com 1-800-BANKERS
Loan Production
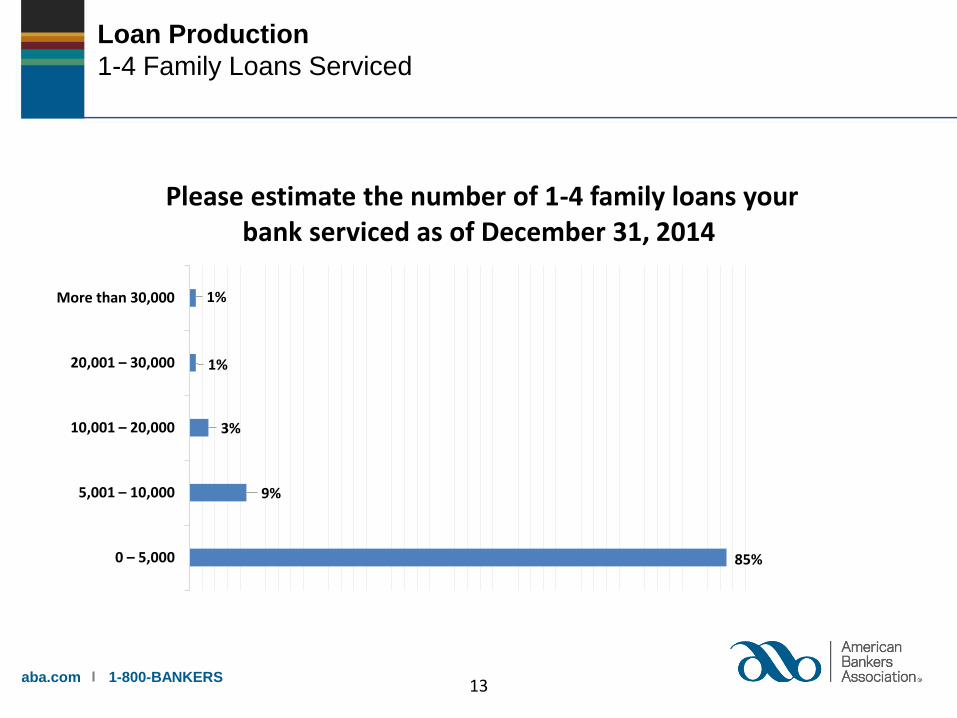
1-4 Family Loans Serviced
85%
9%
3%
1%
1%
0 – 5,000
5,001 – 10,000
10,001 – 20,000
20,001 – 30,000
More than 30,000
Please estimate the number of 1-4 family loans your bank serviced as of December 31, 2014
13
aba.com 1-800-BANKERS
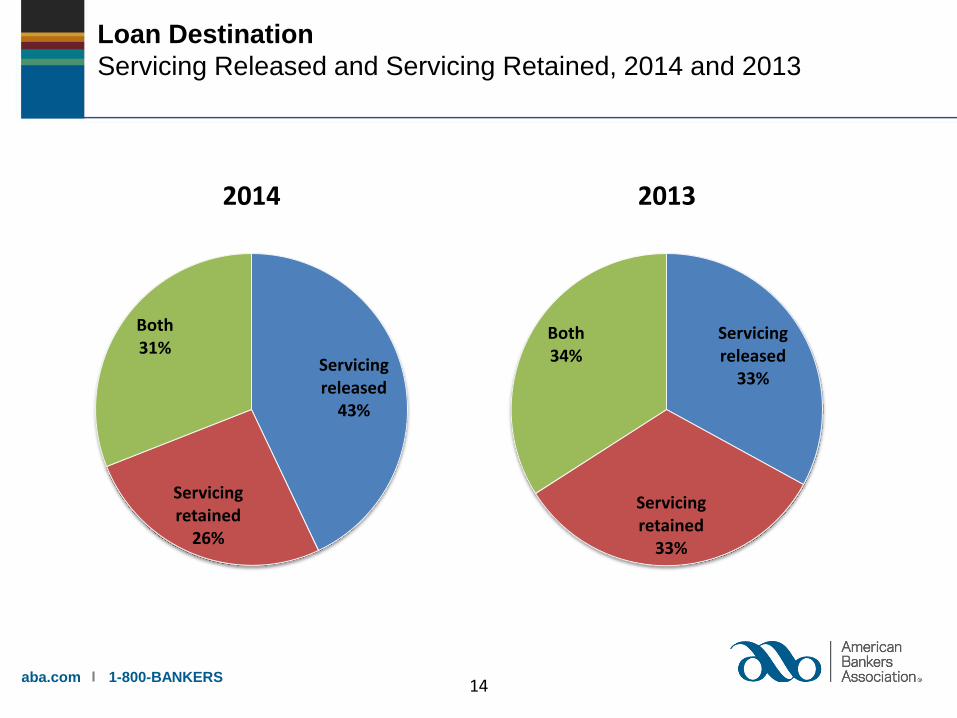
Loan Destination
Servicing Released and Servicing Retained, 2014 and 2013
Servicing released
43%
Servicing retained
26%
Both31%
2014
14
Servicing released
33%
Servicing retained
33%
Both34%
2013
aba.com 1-800-BANKERS
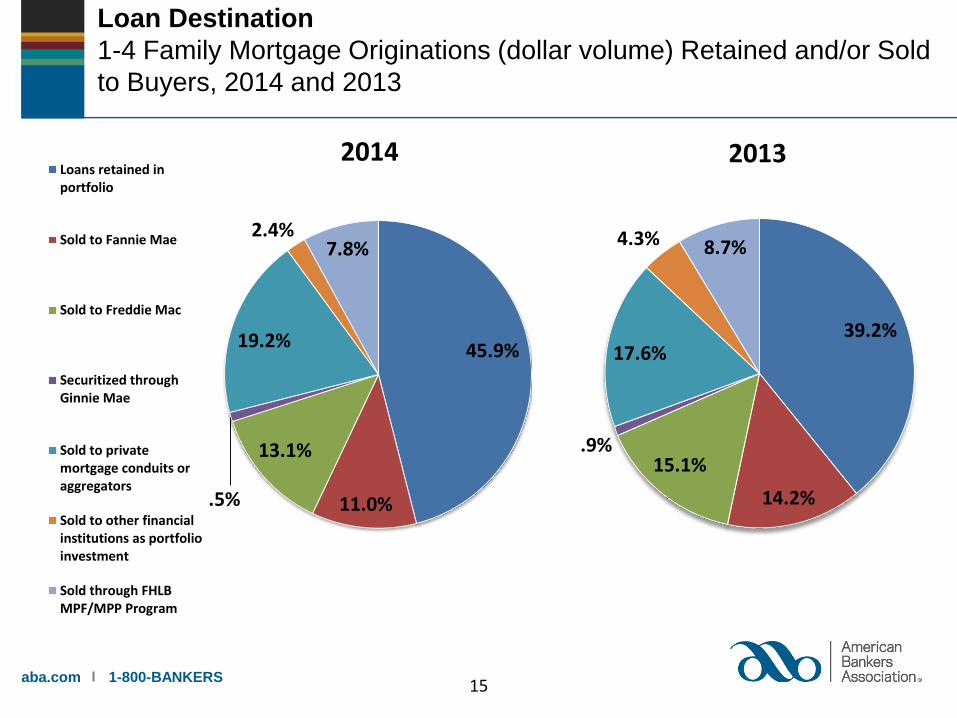
Loan Destination
1-4 Family Mortgage Originations (dollar volume) Retained and/or Sold
to Buyers, 2014 and 2013
45.9%
11.0%
13.1%
.5%
19.2%
2.4%7.8%
2014Loans retained inportfolio
Sold to Fannie Mae
Sold to Freddie Mac
Securitized throughGinnie Mae
Sold to privatemortgage conduits oraggregators
Sold to other financialinstitutions as portfolioinvestment
Sold through FHLBMPF/MPP Program
39.2%
14.2%
15.1%.9%
17.6%
4.3% 8.7%
2013
15
aba.com 1-800-BANKERS
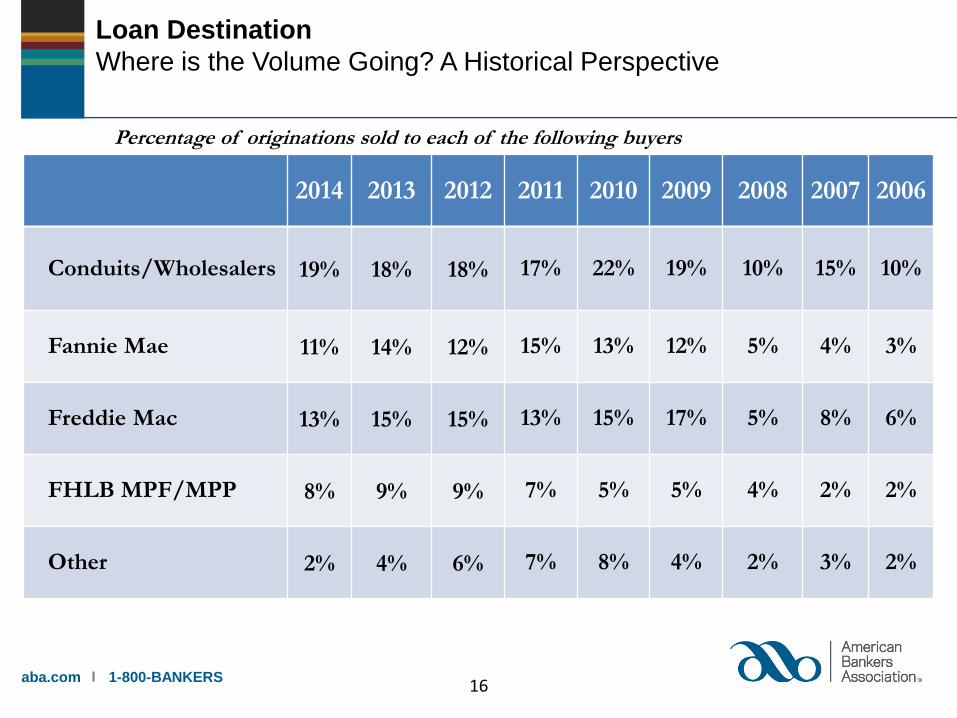
Loan Destination
Where is the Volume Going? A Historical Perspective
2014 2013 2012 2011 2010 2009 2008 2007 2006
Conduits/Wholesalers 19% 18% 18% 17% 22% 19% 10% 15% 10%
Fannie Mae 11% 14% 12% 15% 13% 12% 5% 4% 3%
Freddie Mac 13% 15% 15% 13% 15% 17% 5% 8% 6%
FHLB MPF/MPP 8% 9% 9% 7% 5% 5% 4% 2% 2%
Other 2% 4% 6% 7% 8% 4% 2% 3% 2%
Percentage of originations sold to each of the following buyers
16
aba.com 1-800-BANKERS
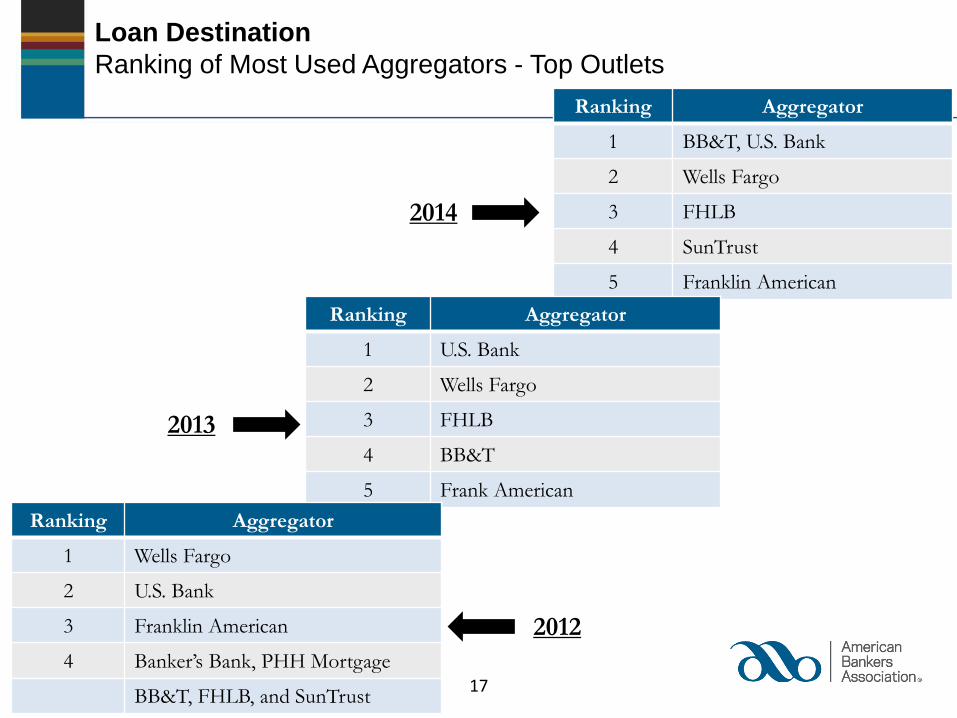
Ranking Aggregator
1 BB&T, U.S. Bank
2 Wells Fargo
3 FHLB
4 SunTrust
5 Franklin American
Loan Destination
Ranking of Most Used Aggregators - Top Outlets
Ranking Aggregator
1 U.S. Bank
2 Wells Fargo
3 FHLB
4 BB&T
5 Frank American
Ranking Aggregator
1 Wells Fargo
2 U.S. Bank
3 Franklin American
4 Banker’s Bank, PHH Mortgage
BB&T, FHLB, and SunTrust
2013
2012
2014
17
aba.com 1-800-BANKERS
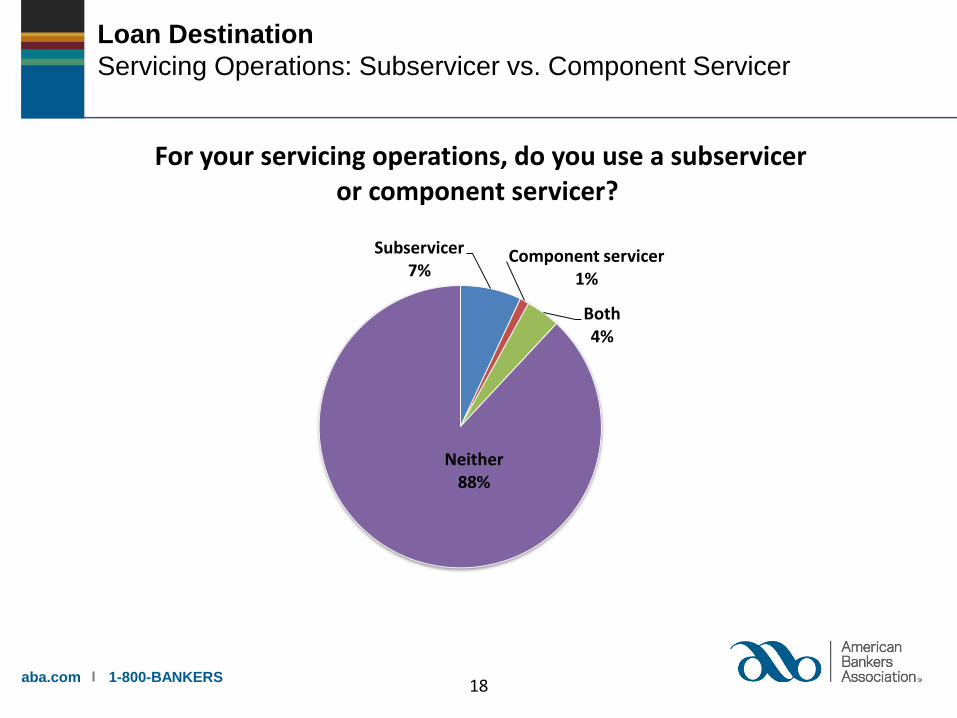
Loan Destination
Servicing Operations: Subservicer vs. Component Servicer
Subservicer7%
Component servicer1%
Both4%
Neither88%
For your servicing operations, do you use a subservicer or component servicer?
18
aba.com 1-800-BANKERS
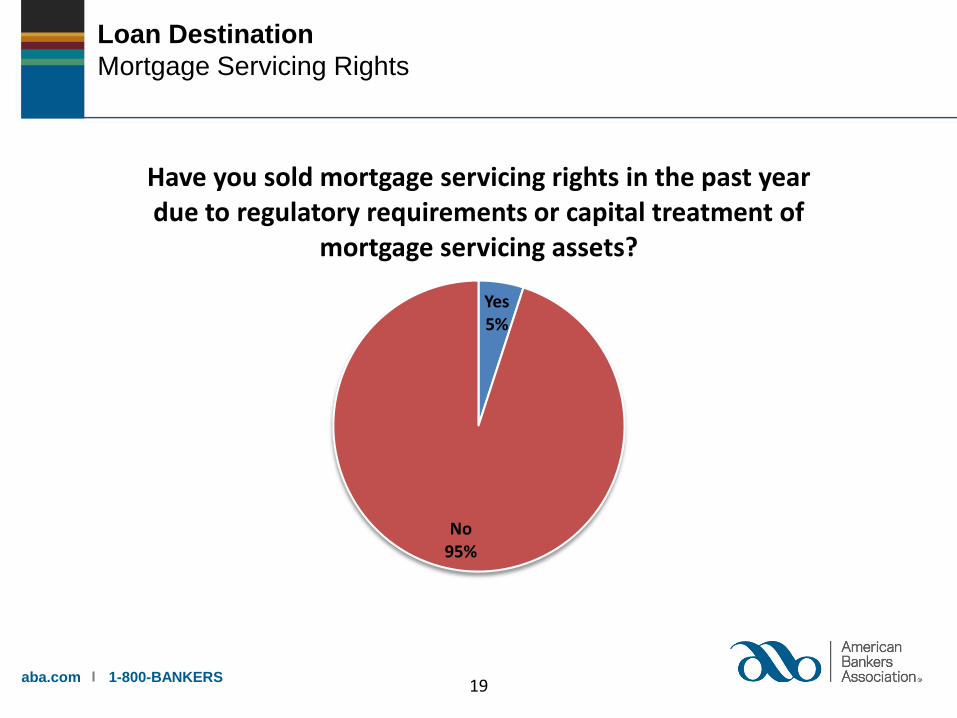
Loan Destination
Mortgage Servicing Rights
Yes5%
No95%
Have you sold mortgage servicing rights in the past year due to regulatory requirements or capital treatment of
mortgage servicing assets?
19
aba.com 1-800-BANKERS
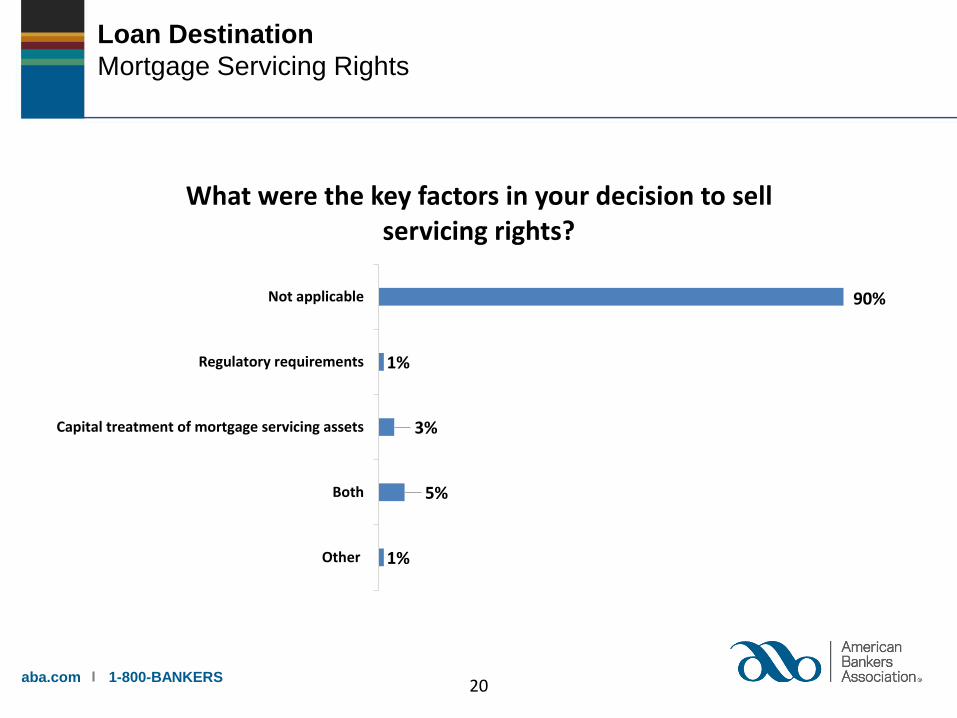
Loan Destination
Mortgage Servicing Rights
90%
1%
3%
5%
1%
Not applicable
Regulatory requirements
Capital treatment of mortgage servicing assets
Both
Other
What were the key factors in your decision to sell servicing rights?
20
aba.com 1-800-BANKERS
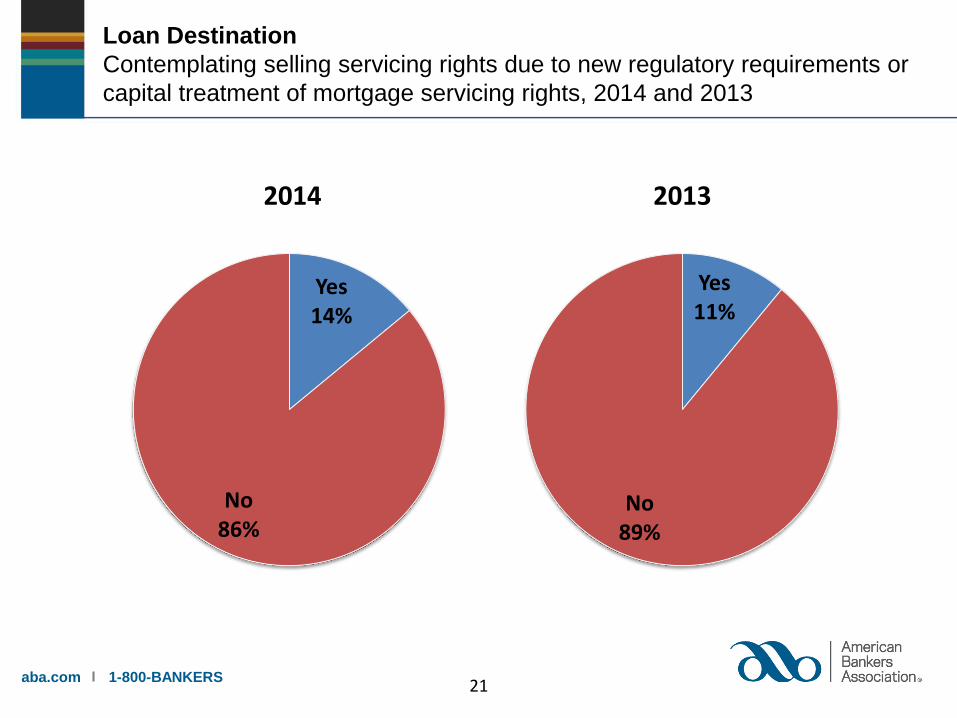
Loan Destination
Contemplating selling servicing rights due to new regulatory requirements or
capital treatment of mortgage servicing rights, 2014 and 2013
Yes14%
No86%
2014
21
Yes11%
No89%
2013
aba.com 1-800-BANKERS
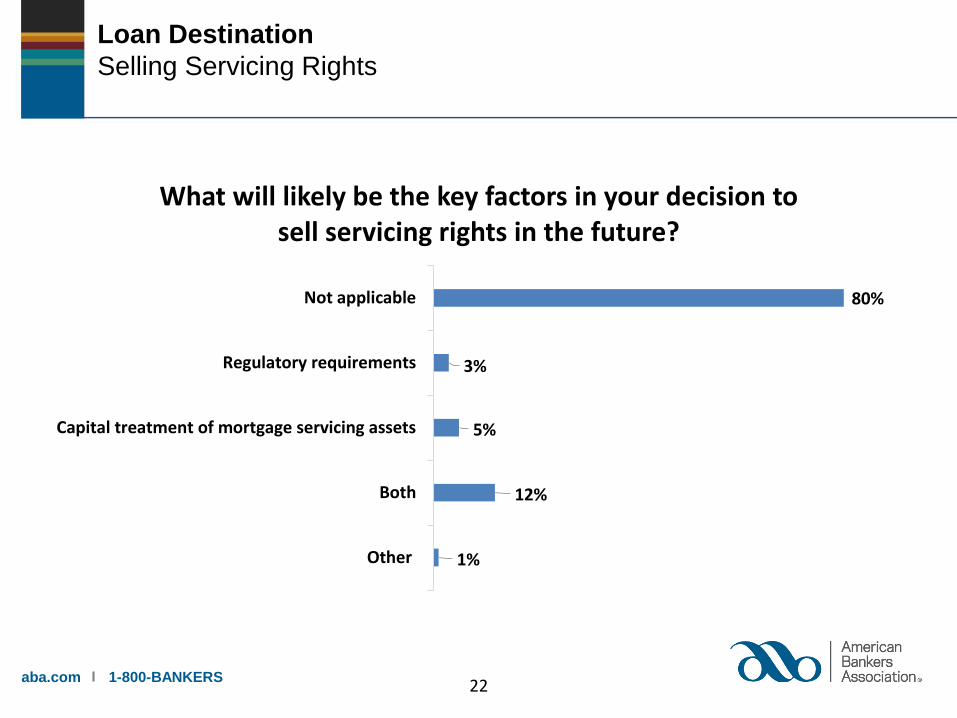
Loan Destination
Selling Servicing Rights
80%
3%
5%
12%
1%
Not applicable
Regulatory requirements
Capital treatment of mortgage servicing assets
Both
Other
What will likely be the key factors in your decision to sell servicing rights in the future?
22
aba.com 1-800-BANKERS
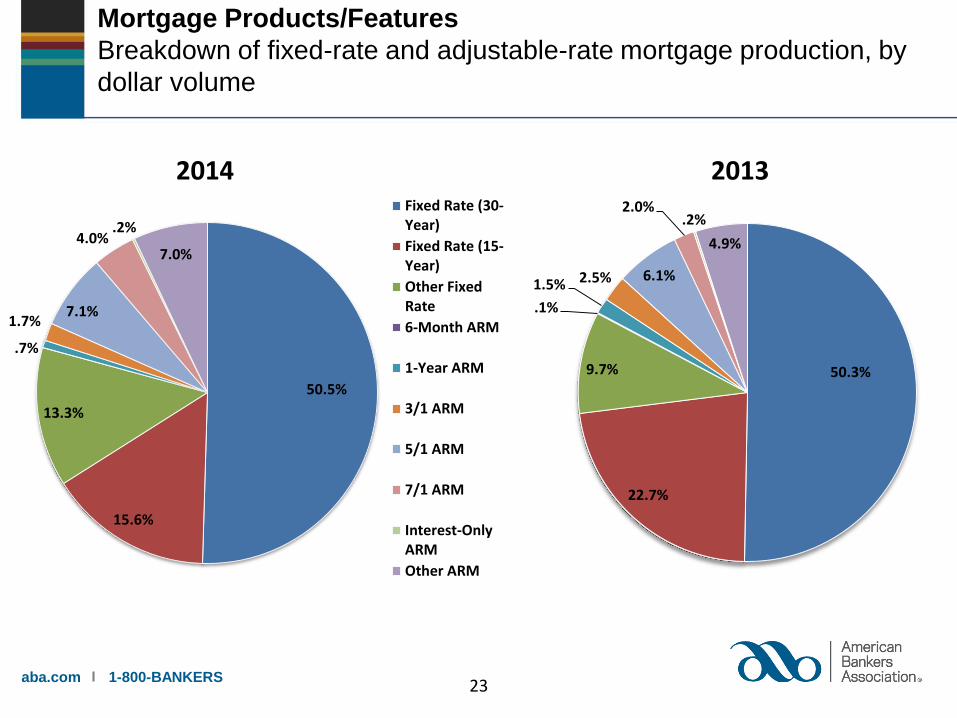
Mortgage Products/Features
Breakdown of fixed-rate and adjustable-rate mortgage production, by
dollar volume
50.5%
15.6%
13.3%
.7%
1.7%7.1%
4.0%.2%
7.0%
2014Fixed Rate (30-Year)
Fixed Rate (15-Year)
Other FixedRate
6-Month ARM
1-Year ARM
3/1 ARM
5/1 ARM
7/1 ARM
Interest-OnlyARM
Other ARM
50.3%
22.7%
9.7%
.1%
1.5% 2.5% 6.1%
2.0%.2%
4.9%
2013
23
aba.com 1-800-BANKERS
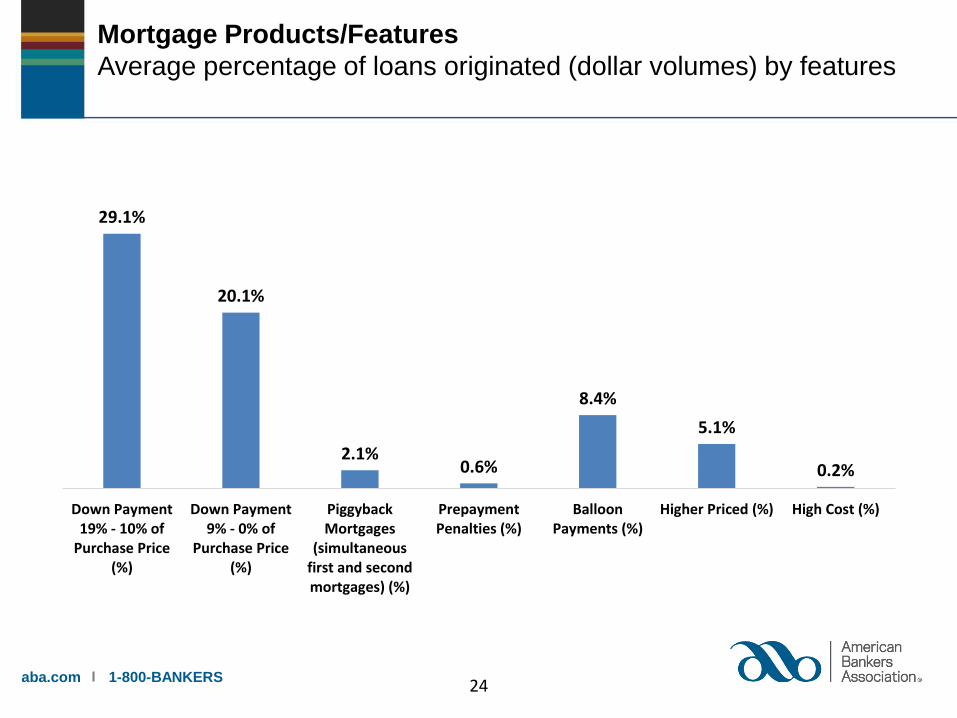
Mortgage Products/Features
Average percentage of loans originated (dollar volumes) by features
24
29.1%
20.1%
2.1%0.6%
8.4%
5.1%
0.2%
Down Payment19% - 10% of
Purchase Price(%)
Down Payment9% - 0% of
Purchase Price(%)
PiggybackMortgages
(simultaneousfirst and secondmortgages) (%)
PrepaymentPenalties (%)
BalloonPayments (%)
Higher Priced (%) High Cost (%)
aba.com 1-800-BANKERS
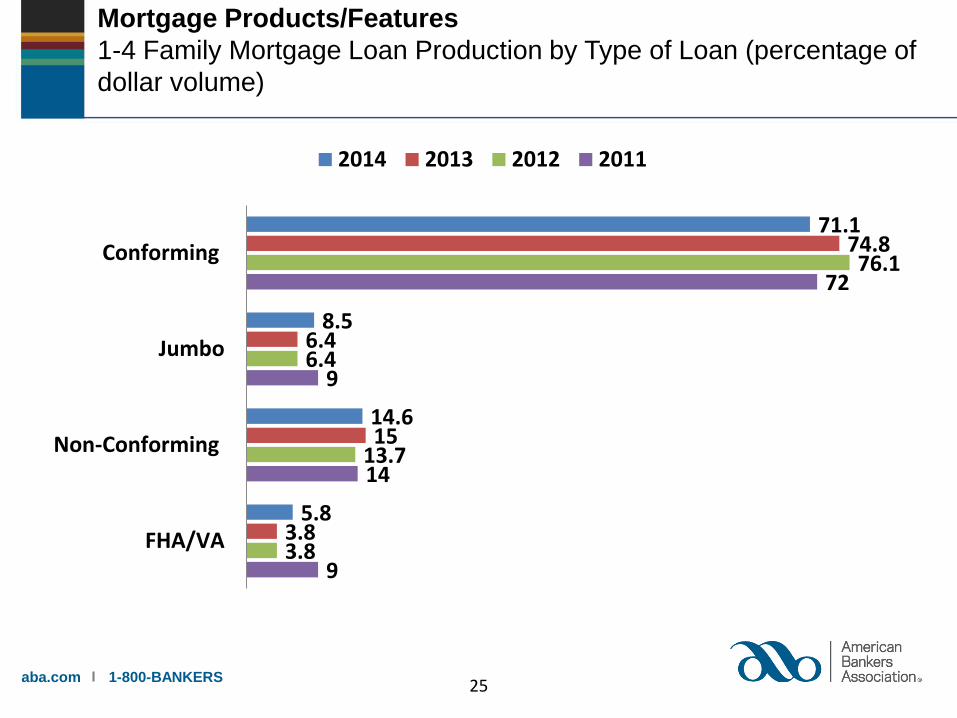
71.1
8.5
14.6
5.8
74.8
6.4
15
3.8
76.1
6.4
13.7
3.8
72
9
14
9
Conforming
Jumbo
Non-Conforming
FHA/VA
2014 2013 2012 2011
Mortgage Products/Features
1-4 Family Mortgage Loan Production by Type of Loan (percentage of
dollar volume)
25
aba.com 1-800-BANKERS
Mortgage Products/Features
First-Time Home Buyers
14%13%
11%
2014 2013 2012
Average Percentage of 1-4 Family Loans Made to First Time Home Buyers
26
aba.com 1-800-BANKERS
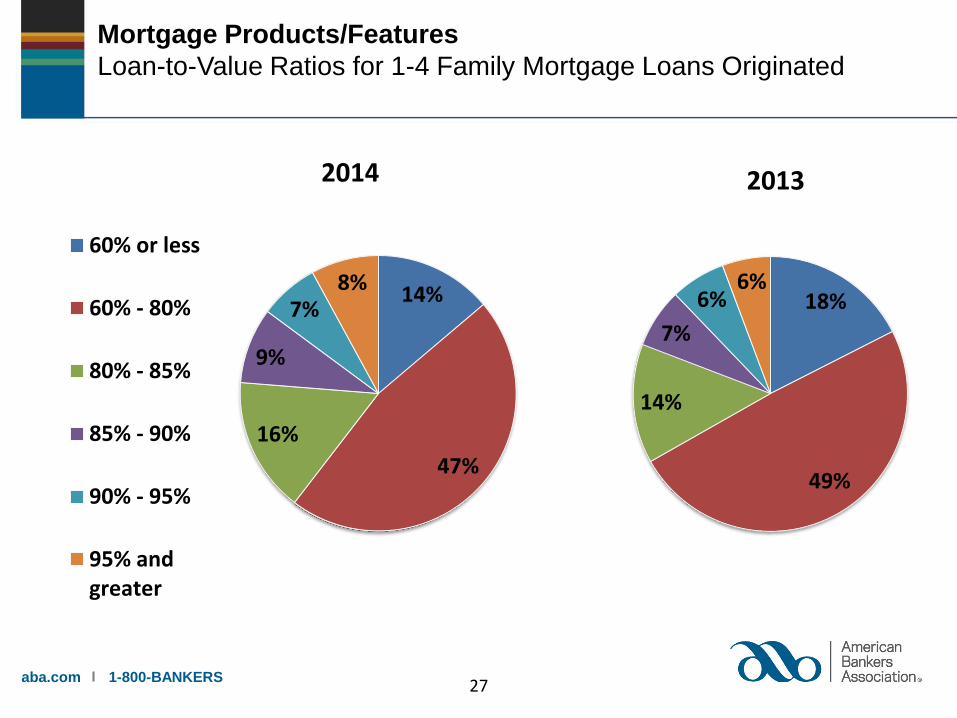
Mortgage Products/Features
Loan-to-Value Ratios for 1-4 Family Mortgage Loans Originated
14%
47%
16%
9%
7%8%
2014
60% or less
60% - 80%
80% - 85%
85% - 90%
90% - 95%
95% andgreater
18%
49%
14%
7%
6%6%
2013
27
aba.com 1-800-BANKERS
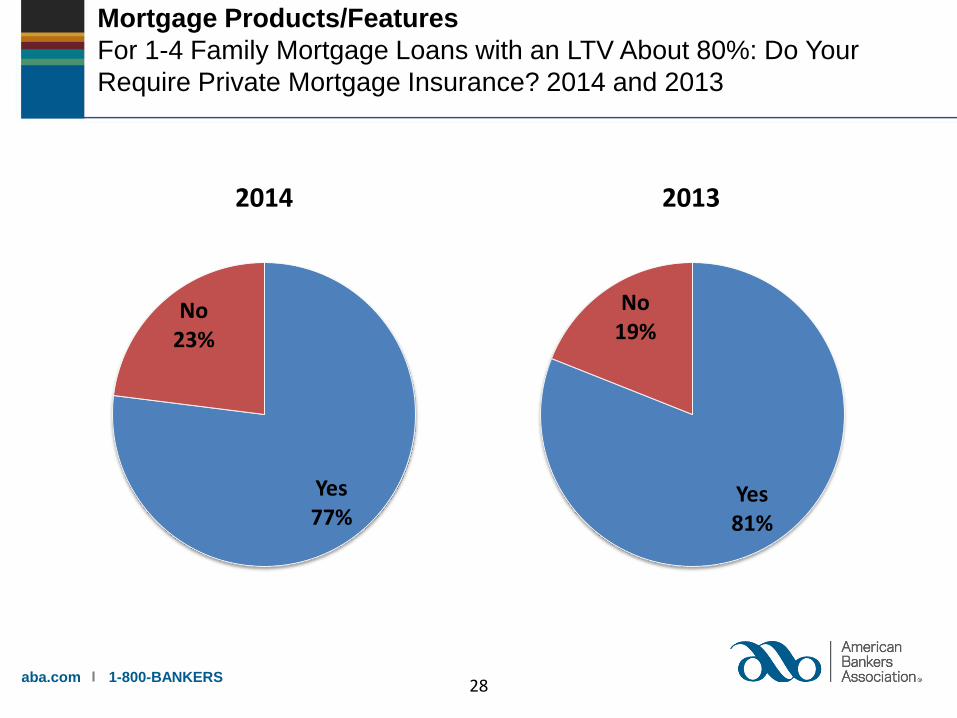
Mortgage Products/Features
For 1-4 Family Mortgage Loans with an LTV About 80%: Do Your
Require Private Mortgage Insurance? 2014 and 2013
Yes77%
No23%
2014
28
Yes81%
No19%
2013
aba.com 1-800-BANKERS
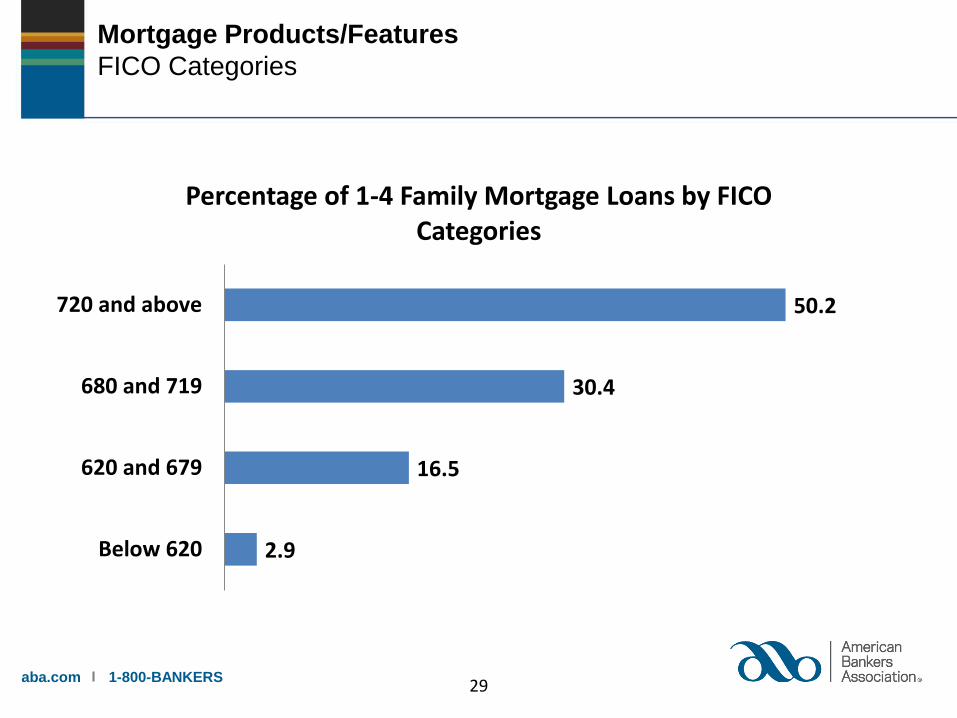
Mortgage Products/Features
FICO Categories
2.9
16.5
30.4
50.2
Below 620
620 and 679
680 and 719
720 and above
Percentage of 1-4 Family Mortgage Loans by FICO Categories
29
aba.com 1-800-BANKERS
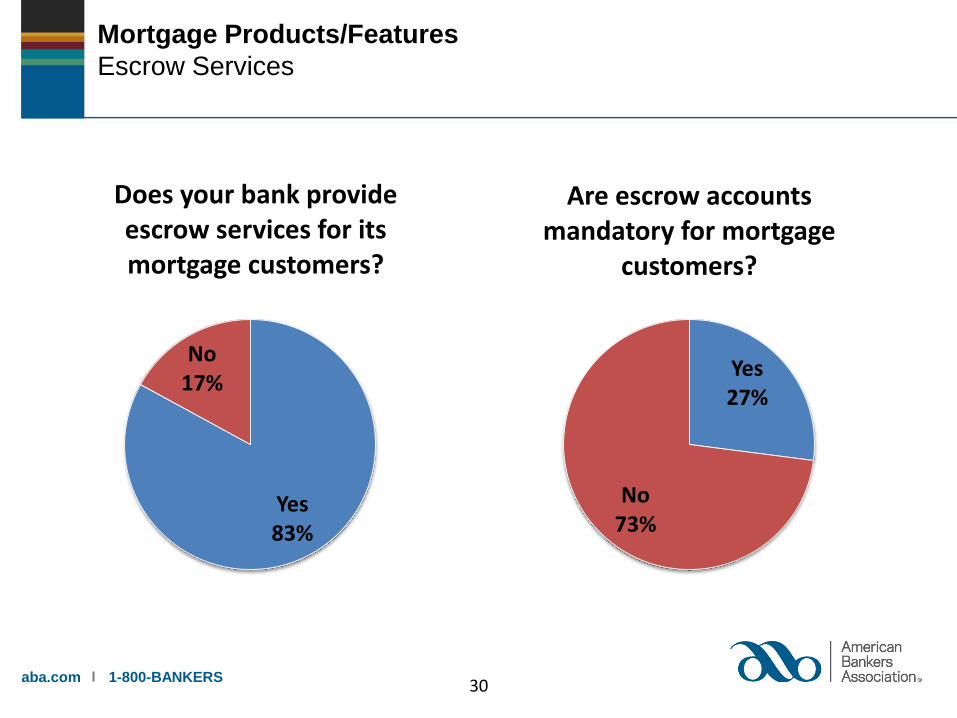
Yes83%
No17%
Does your bank provide escrow services for its mortgage customers?
Yes27%
No73%
Are escrow accounts mandatory for mortgage
customers?
Mortgage Products/Features
Escrow Services
30
aba.com 1-800-BANKERS
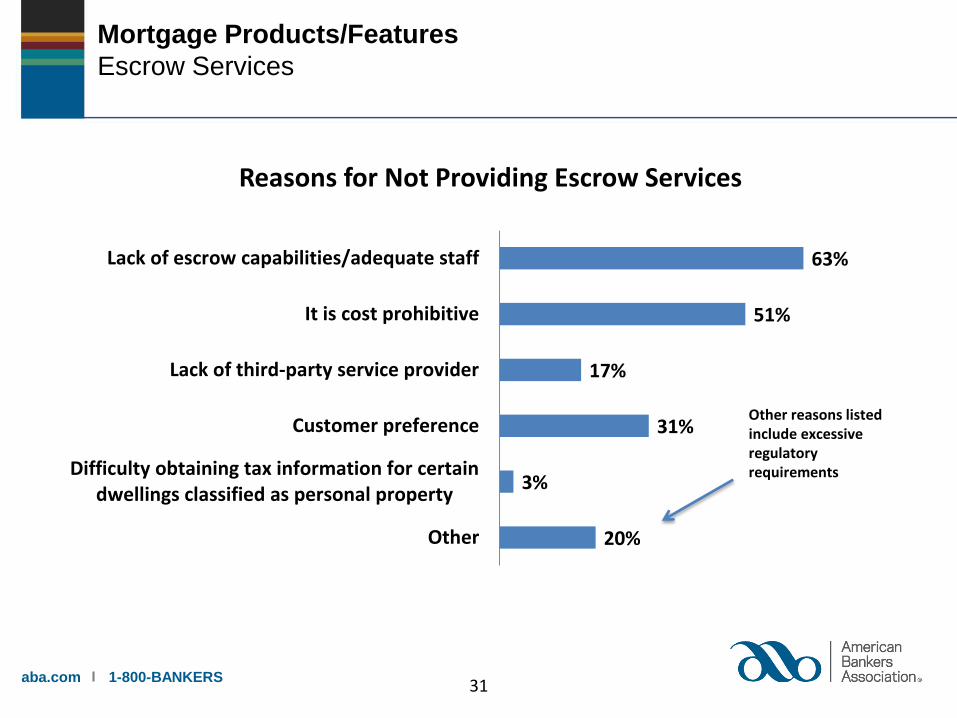
63%
51%
17%
31%
3%
20%
Lack of escrow capabilities/adequate staff
It is cost prohibitive
Lack of third-party service provider
Customer preference
Difficulty obtaining tax information for certaindwellings classified as personal property
Other
Reasons for Not Providing Escrow Services
Other reasons listed include excessive regulatory requirements
Mortgage Products/Features
Escrow Services
31
aba.com 1-800-BANKERS
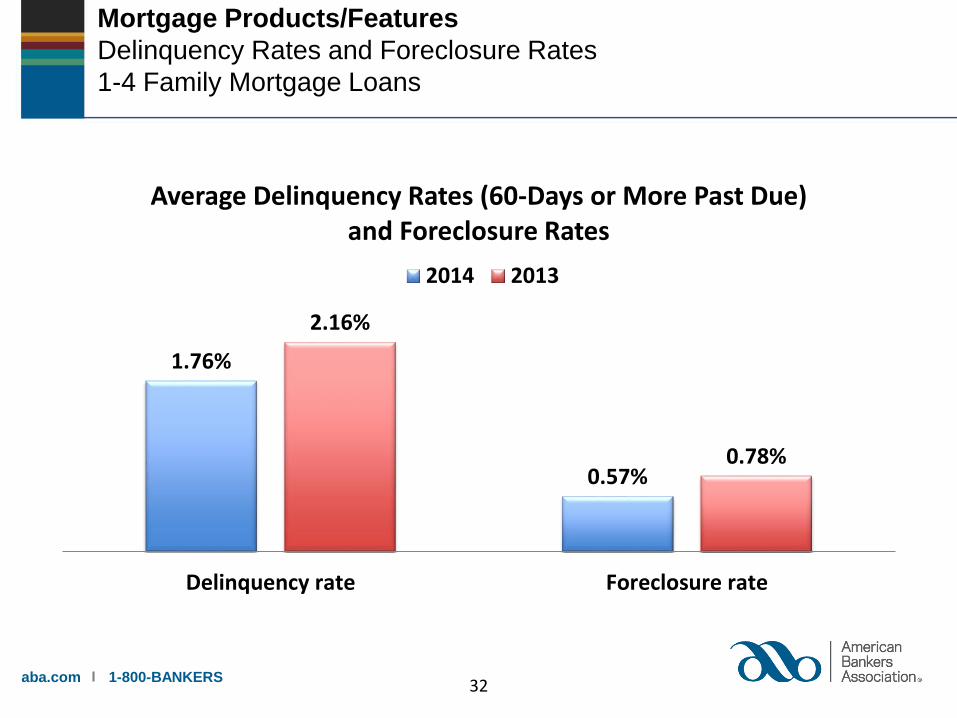
Mortgage Products/Features
Delinquency Rates and Foreclosure Rates
1-4 Family Mortgage Loans
1.76%
0.57%
2.16%
0.78%
Delinquency rate Foreclosure rate
Average Delinquency Rates (60-Days or More Past Due) and Foreclosure Rates
2014 2013
32
aba.com 1-800-BANKERS
Regulatory Impact
Qualified Mortgage (QM) Compliance: Percentage of Production QM Compliant
and Non QM Compliant (average), 2014 and 2013
90%
10%
2014
QMCompliant
Non-QMCompliant
33
84%
16%
2013
aba.com 1-800-BANKERS
Regulatory Impact
Impact of New Regulations on Mortgage Lending
33%
48%
19%
Bank restricted lending to QM segments
Bank originated primarily QM loans, and non-QM loans were restricted to targeted markets
or otherwise limited
Bank originated loans without regard to QMstatus
What was the overall impact of the Ability-to-Repay/QM rules on your lending in 2014?
34
aba.com 1-800-BANKERS
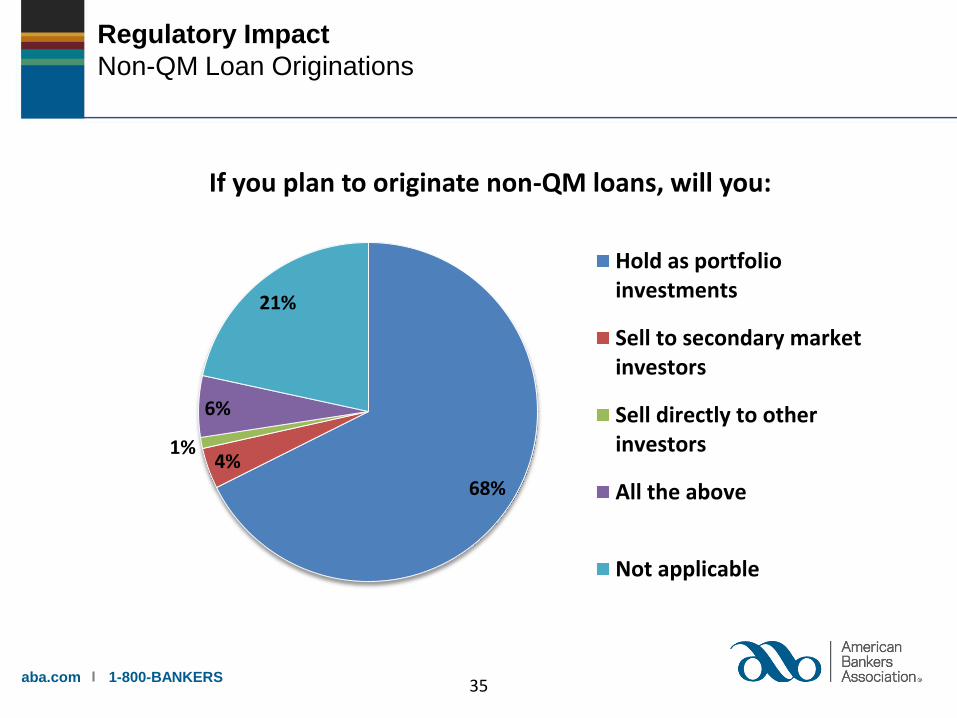
68%
4%1%
6%
21%
If you plan to originate non-QM loans, will you:
Hold as portfolioinvestments
Sell to secondary marketinvestors
Sell directly to otherinvestors
All the above
Not applicable
Regulatory Impact
Non-QM Loan Originations
35
aba.com 1-800-BANKERS
17%
38%
45%
20%
40%
41%
There will be no measurable impact onmortgage lending levels, regardless of QM or
non-QM classification.
There will be a measurable reduction in creditavailability in the non-QM lending segments
only.
There will be a measurable reduction in creditavailability across all mortgage lending
segments.
2013 2014
Regulatory Impact
What do you expect will be the impact of the Ability-to-Repay/QM rules
on credit availability in the market generally? 2014 and 2013
36
aba.com 1-800-BANKERS
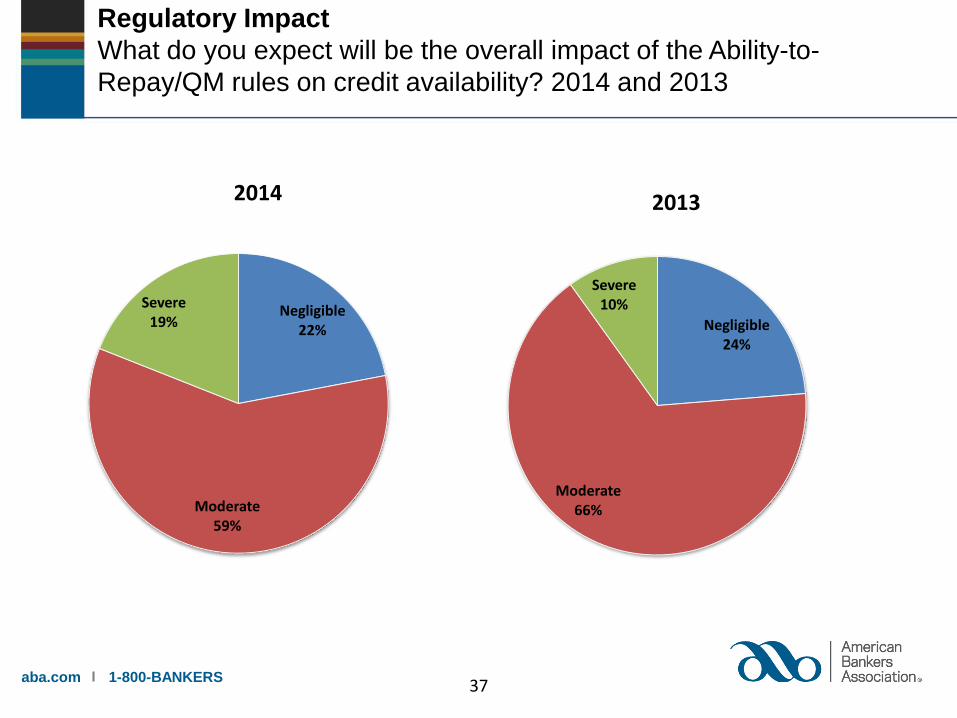
Negligible22%
Moderate59%
Severe19%
2014
Regulatory Impact
What do you expect will be the overall impact of the Ability-to-
Repay/QM rules on credit availability? 2014 and 2013
37
Negligible24%
Moderate66%
Severe10%
2013
aba.com 1-800-BANKERS
Regulatory Impact
Reasons for Non-QM Loans Not Meeting QM Standards
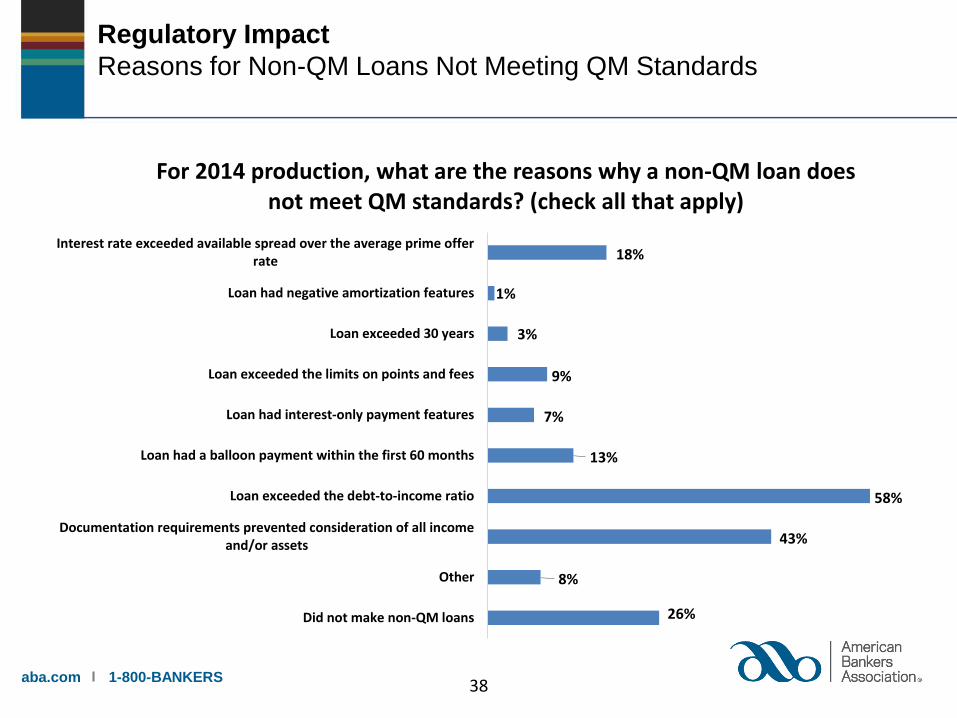
18%
1%
3%
9%
7%
13%
58%
43%
8%
26%
Interest rate exceeded available spread over the average prime offerrate
Loan had negative amortization features
Loan exceeded 30 years
Loan exceeded the limits on points and fees
Loan had interest-only payment features
Loan had a balloon payment within the first 60 months
Loan exceeded the debt-to-income ratio
Documentation requirements prevented consideration of all incomeand/or assets
Other
Did not make non-QM loans
For 2014 production, what are the reasons why a non-QM loan does not meet QM standards? (check all that apply)
38
aba.com 1-800-BANKERS
Regulatory Impact
Reason For a Non-QM Loan Not Meeting QM Standards
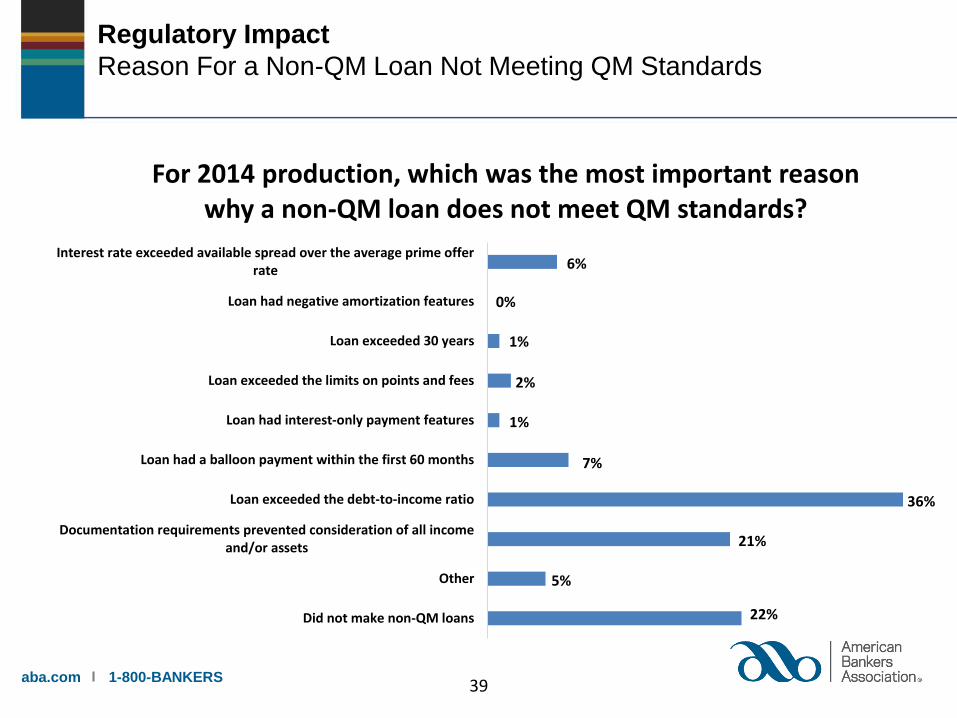
6%
0%
1%
2%
1%
7%
36%
21%
5%
22%
Interest rate exceeded available spread over the average prime offerrate
Loan had negative amortization features
Loan exceeded 30 years
Loan exceeded the limits on points and fees
Loan had interest-only payment features
Loan had a balloon payment within the first 60 months
Loan exceeded the debt-to-income ratio
Documentation requirements prevented consideration of all incomeand/or assets
Other
Did not make non-QM loans
For 2014 production, which was the most important reason why a non-QM loan does not meet QM standards?
39
aba.com 1-800-BANKERS
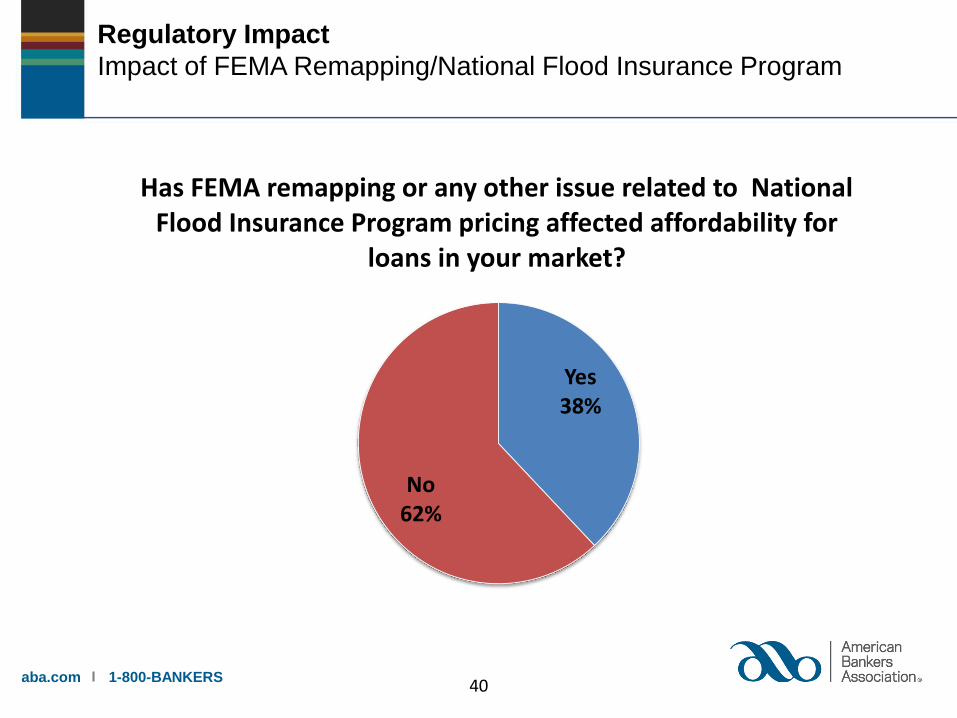
Yes38%
No62%
Has FEMA remapping or any other issue related to National Flood Insurance Program pricing affected affordability for
loans in your market?
Regulatory Impact
Impact of FEMA Remapping/National Flood Insurance Program
40
aba.com 1-800-BANKERS
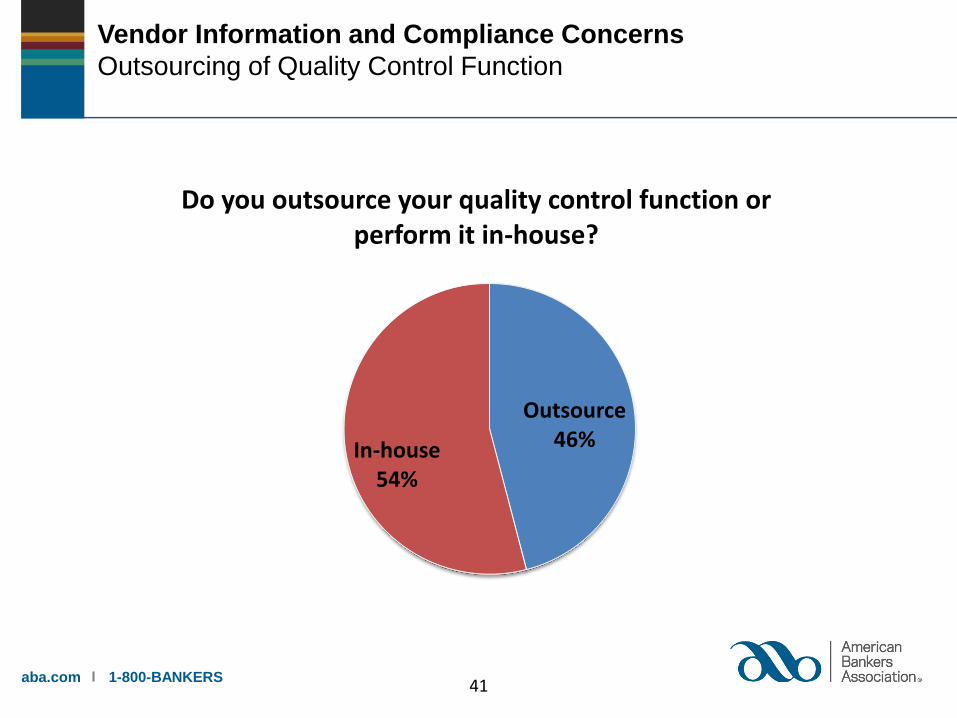
Outsource46%In-house
54%
Do you outsource your quality control function or perform it in-house?
Vendor Information and Compliance Concerns
Outsourcing of Quality Control Function
41
aba.com 1-800-BANKERS
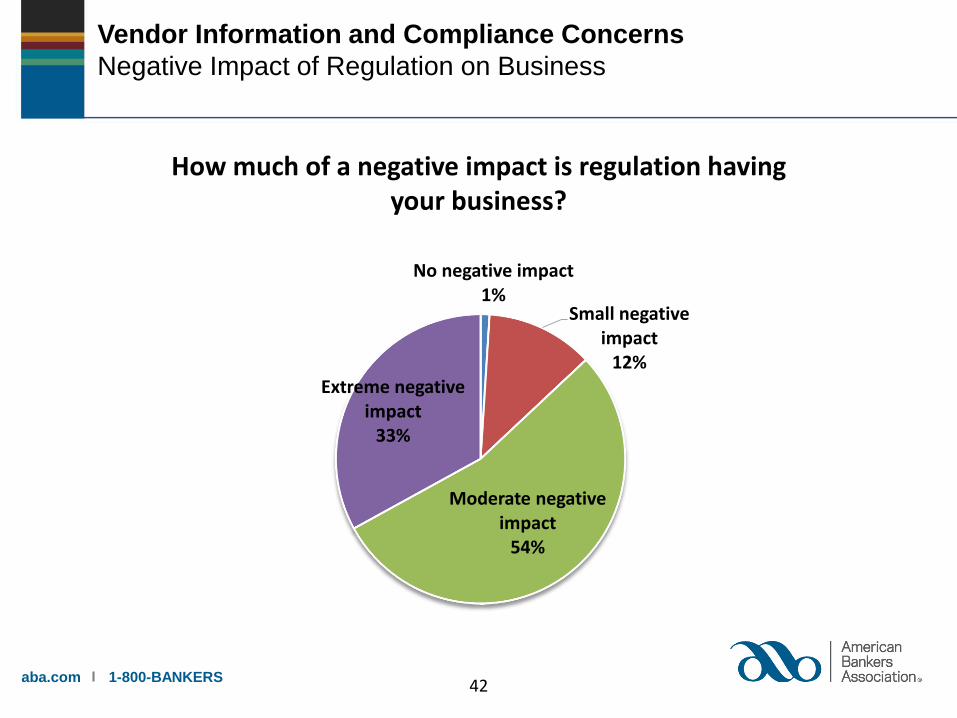
Vendor Information and Compliance Concerns
Negative Impact of Regulation on Business
No negative impact1%
Small negative impact
12%
Moderate negative impact
54%
Extreme negative impact
33%
42
How much of a negative impact is regulation having your business?
aba.com 1-800-BANKERS
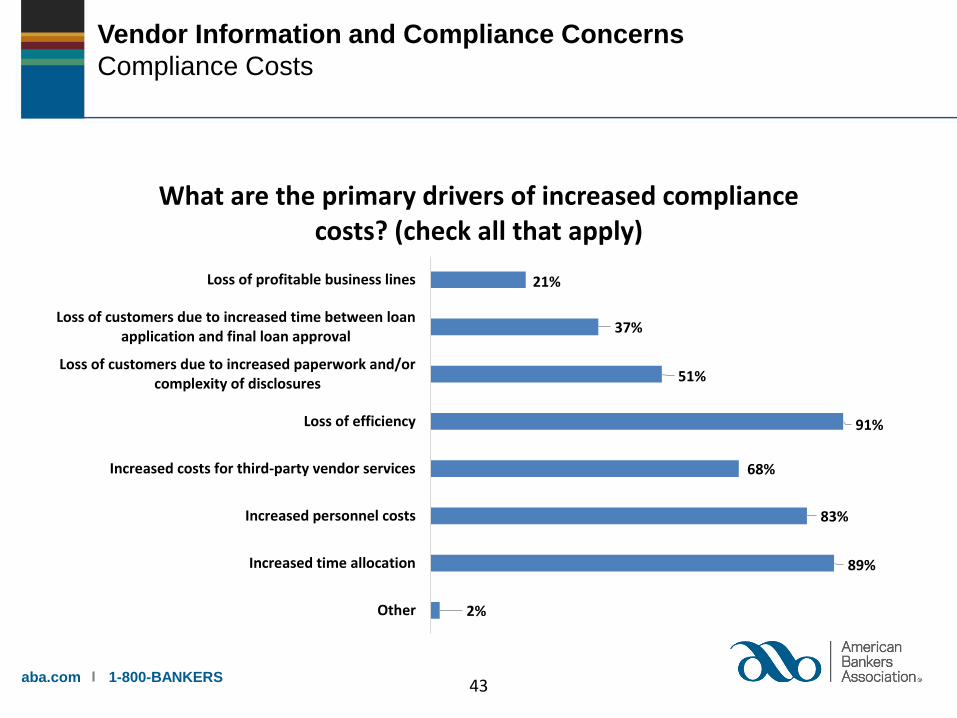
Vendor Information and Compliance Concerns
Compliance Costs
21%
37%
51%
91%
68%
83%
89%
2%
Loss of profitable business lines
Loss of customers due to increased time between loanapplication and final loan approval
Loss of customers due to increased paperwork and/orcomplexity of disclosures
Loss of efficiency
Increased costs for third-party vendor services
Increased personnel costs
Increased time allocation
Other
What are the primary drivers of increased compliance costs? (check all that apply)
43
aba.com 1-800-BANKERS
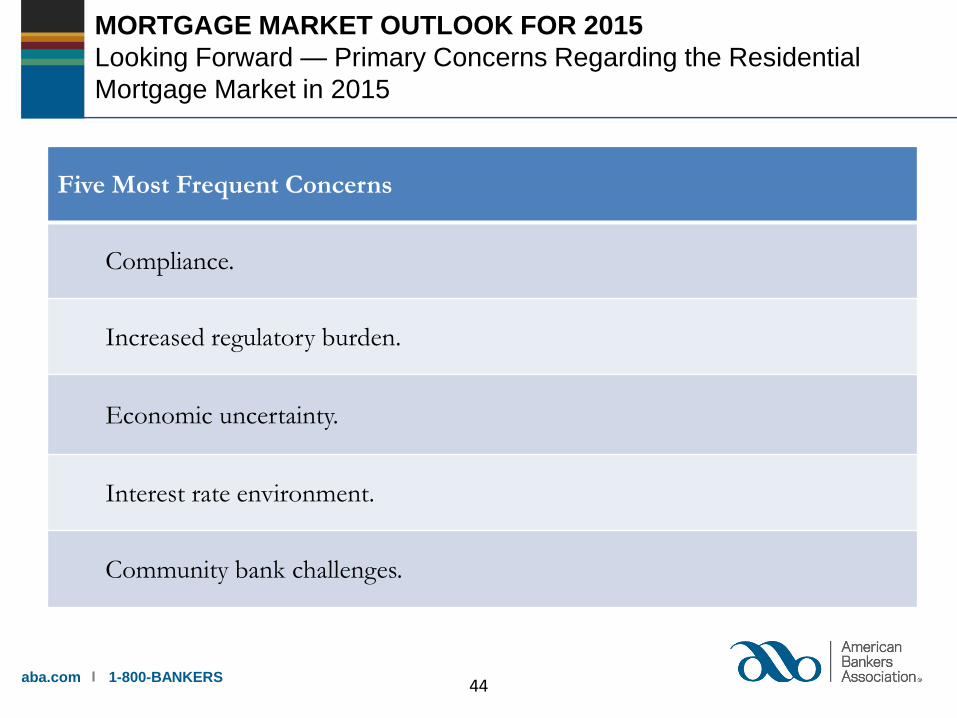
MORTGAGE MARKET OUTLOOK FOR 2015
Looking Forward — Primary Concerns Regarding the Residential
Mortgage Market in 2015
Five Most Frequent Concerns
Compliance.
Increased regulatory burden.
Economic uncertainty.
Interest rate environment.
Community bank challenges.
44
aba.com 1-800-BANKERS
TILA/RESPA INTEGRATED
DISCLOSURE SURVEY
45
aba.com 1-800-BANKERS
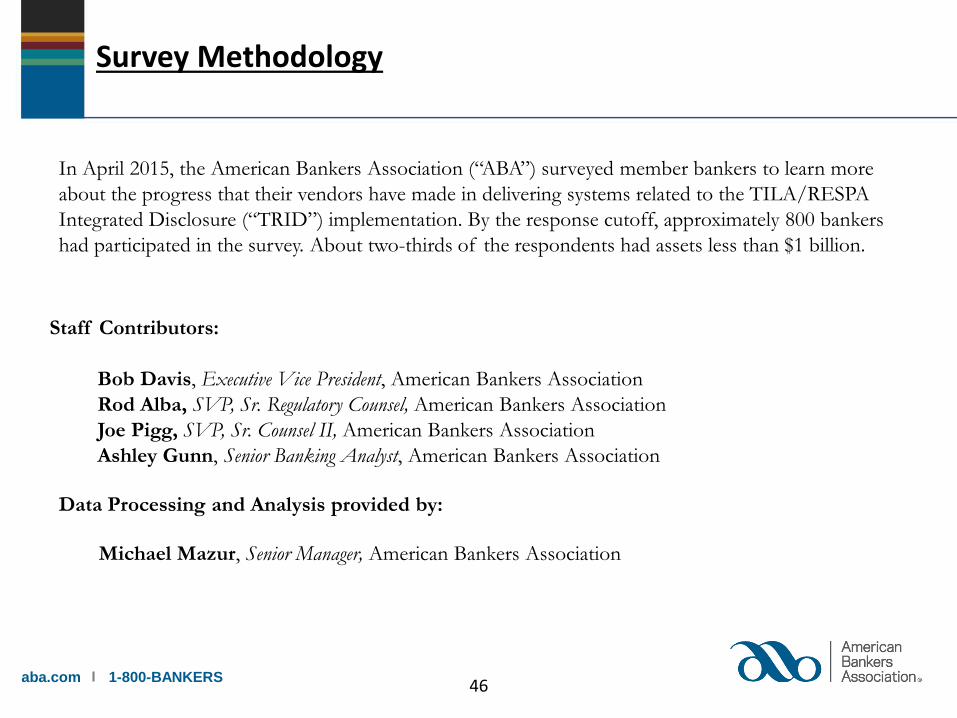
Staff Contributors:
Bob Davis, Executive Vice President, American Bankers Association
Rod Alba, SVP, Sr. Regulatory Counsel, American Bankers Association
Joe Pigg, SVP, Sr. Counsel II, American Bankers Association
Ashley Gunn, Senior Banking Analyst, American Bankers Association
Survey Methodology
In April 2015, the American Bankers Association (“ABA”) surveyed member bankers to learn more
about the progress that their vendors have made in delivering systems related to the TILA/RESPA
Integrated Disclosure (“TRID”) implementation. By the response cutoff, approximately 800 bankers
had participated in the survey. About two-thirds of the respondents had assets less than $1 billion.
Michael Mazur, Senior Manager, American Bankers Association
Data Processing and Analysis provided by:
46
aba.com 1-800-BANKERS
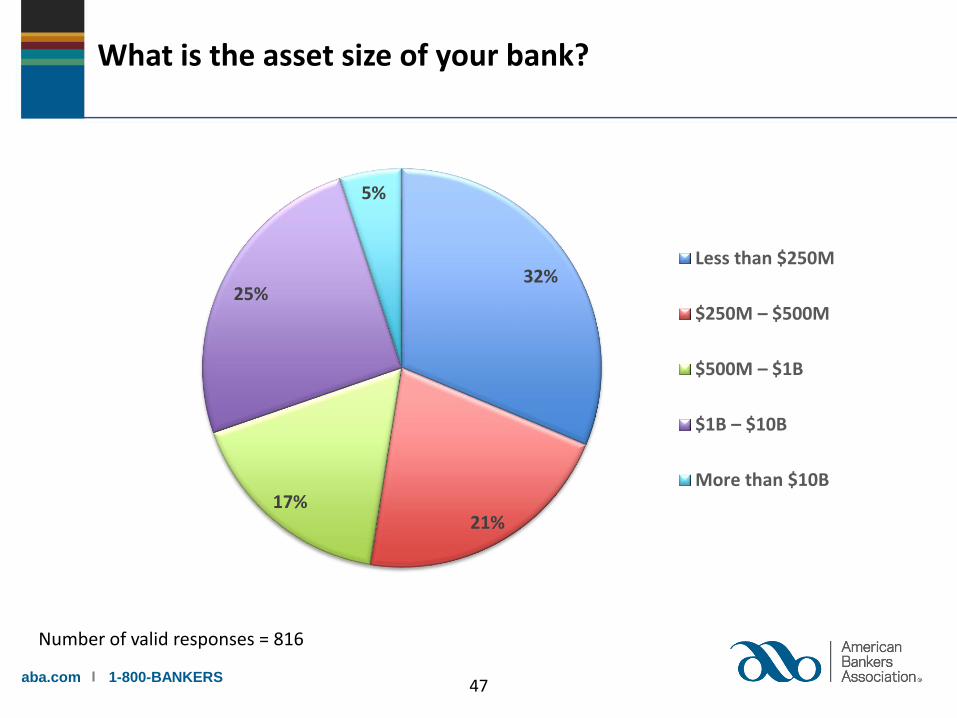
What is the asset size of your bank?
Number of valid responses = 816
32%
21%17%
25%
5%
Less than $250M
$250M – $500M
$500M – $1B
$1B – $10B
More than $10B
47
aba.com 1-800-BANKERS
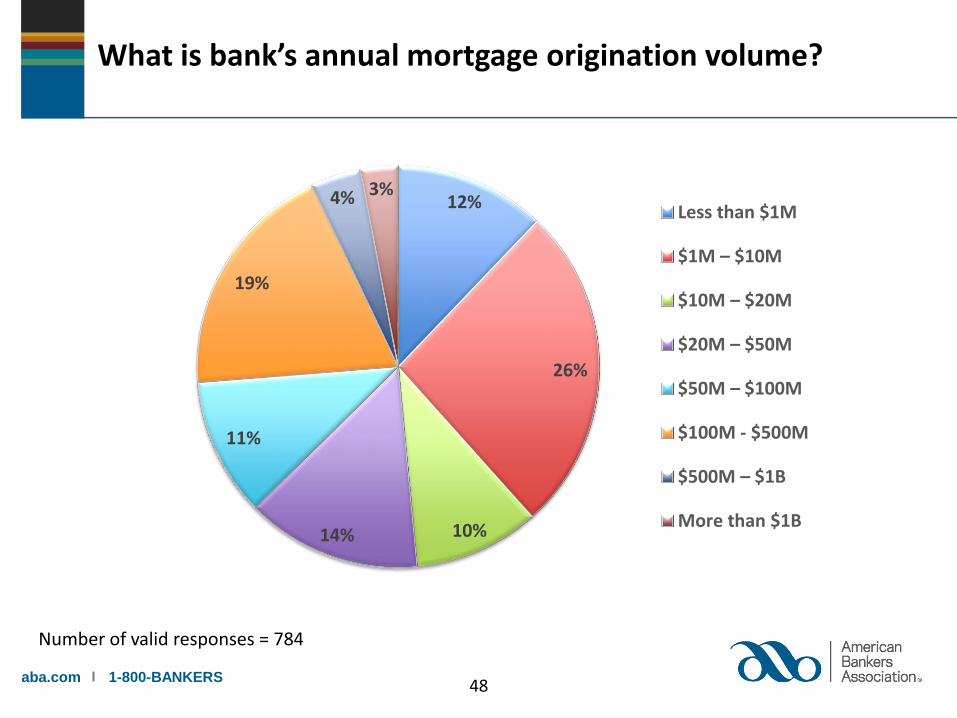
What is bank’s annual mortgage origination volume?
12%
26%
10%14%
11%
19%
4% 3%Less than $1M
$1M – $10M
$10M – $20M
$20M – $50M
$50M – $100M
$100M - $500M
$500M – $1B
More than $1B
Number of valid responses = 784
48
aba.com 1-800-BANKERS
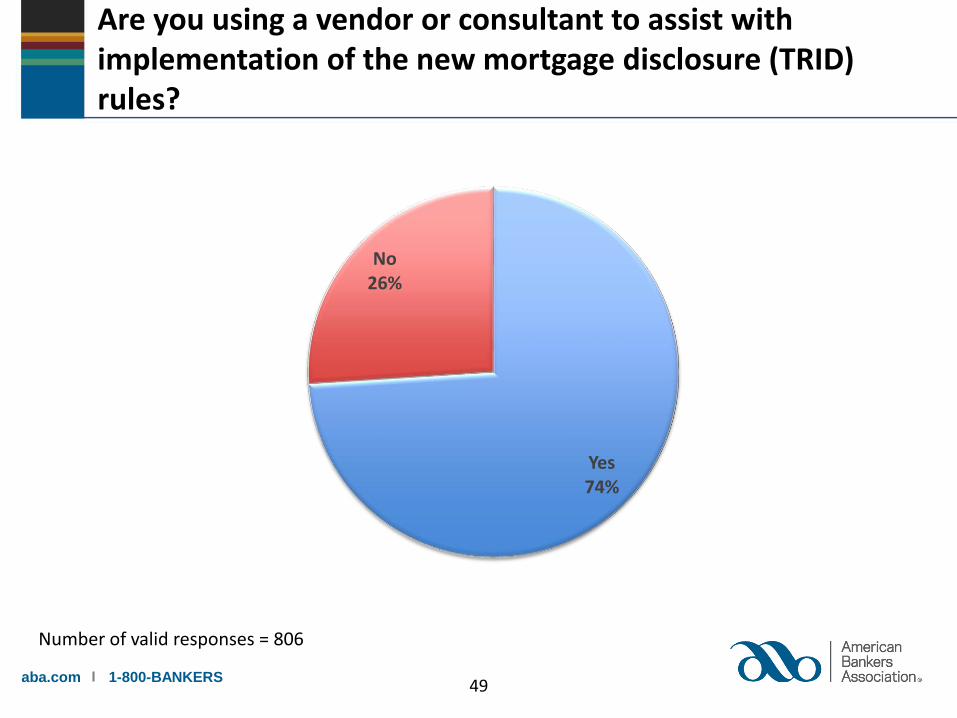
Are you using a vendor or consultant to assist with implementation of the new mortgage disclosure (TRID) rules?
Yes74%
No26%
Number of valid responses = 806
49
aba.com 1-800-BANKERS
When do you expect to receive the final and completed production software system? (as of the end of April)
Number of valid responses = 773
9%
12%
21%
17%
5%
36%
0% 5% 10% 15% 20% 25% 30% 35% 40%
MARCH – APRIL (RECEIVED OR EXPECTED TO RECEIVE)
MAY
JUNE
JULY
AFTER JULY
OUR VENDOR HAS NOT YET PROVIDED A SOLID DELIVERY DATE
50
aba.com 1-800-BANKERS
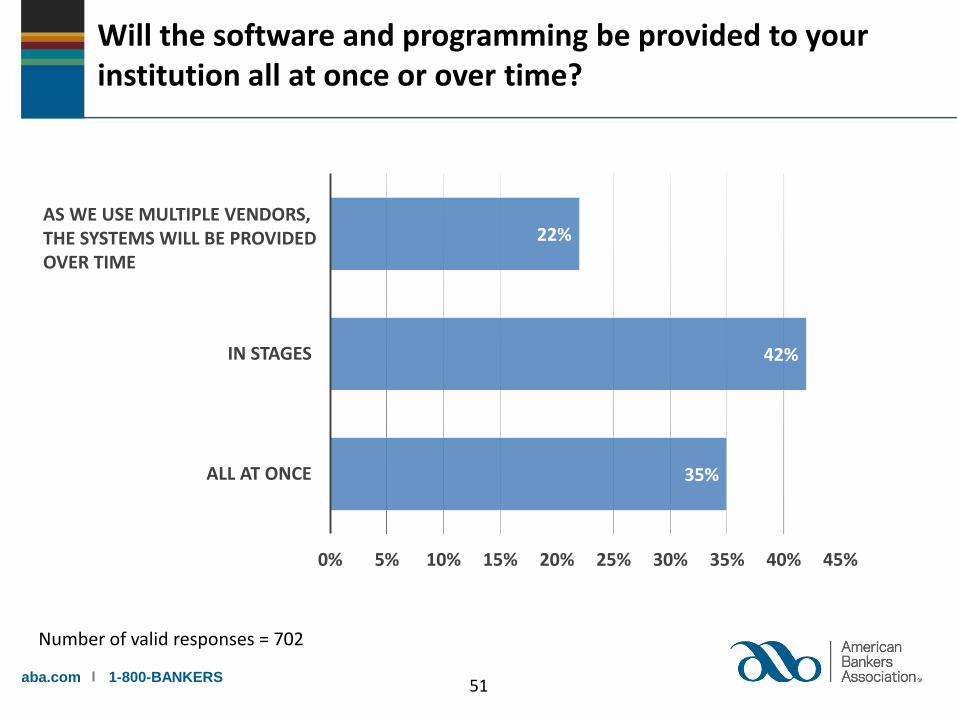
Will the software and programming be provided to your institution all at once or over time?
35%
42%
22%
0% 5% 10% 15% 20% 25% 30% 35% 40% 45%
ALL AT ONCE
IN STAGES
WE USE MULTIPLE VENDORS
Number of valid responses = 702
AS WE USE MULTIPLE VENDORS, THE SYSTEMS WILL BE PROVIDED OVER TIME
51
aba.com 1-800-BANKERS
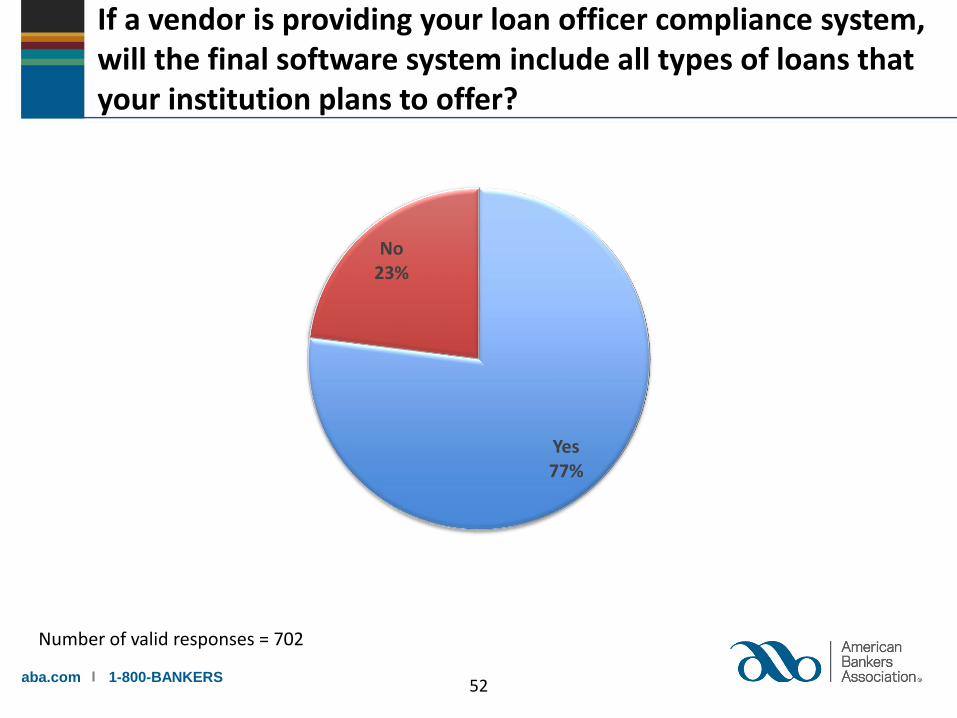
If a vendor is providing your loan officer compliance system, will the final software system include all types of loans that your institution plans to offer?
Yes77%
No23%
Number of valid responses = 702
52
aba.com 1-800-BANKERS
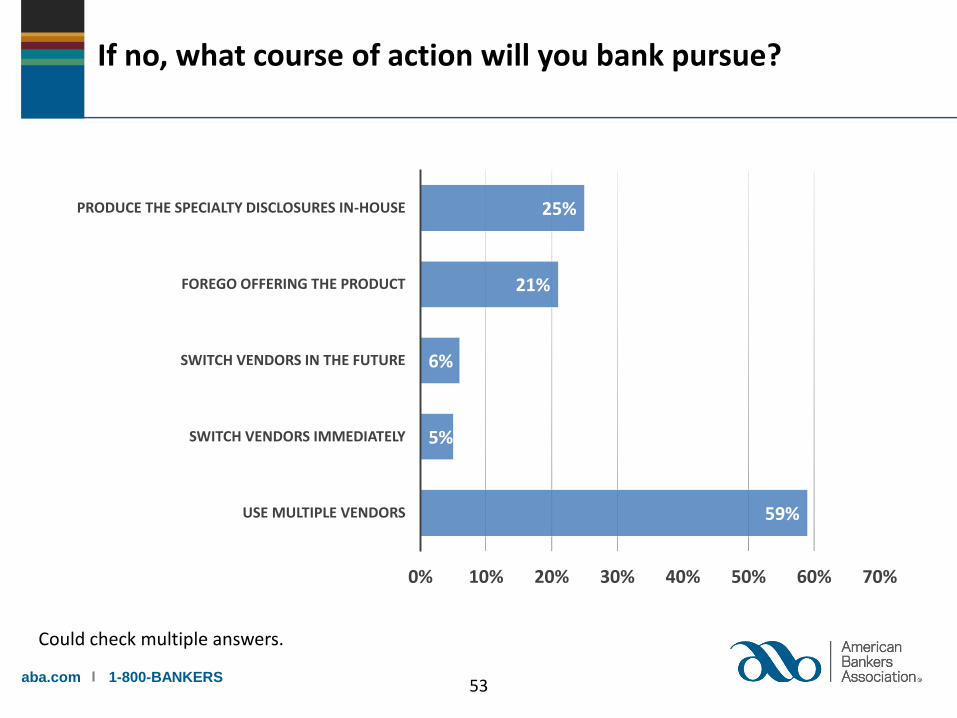
If no, what course of action will you bank pursue?
59%
5%
6%
21%
25%
0% 10% 20% 30% 40% 50% 60% 70%
USE MULTIPLE VENDORS
SWITCH VENDORS IMMEDIATELY
SWITCH VENDORS IN THE FUTURE
FOREGO OFFERING THE PRODUCT
PRODUCE THE SPECIALTY DISCLOSURES IN-HOUSE
Could check multiple answers.
53