Embed Size (px)
Citation preview

228 North Lynnhaven Road Virginia Beach, Virginia 23452
Developed, Leased and Managed By:
The Breeden Company
560 Lynnhaven Parkway Virginia Beach, Virginia 23452
Phone:757.486.1000 Fax:757.463.9164 Website: www.thebreedencompany.com

Over 230,000 potential customers within a five (5) mile radius.
Strong accessibility from Interstate 264, Lynnhaven Parkway, and Virginia Beach Boulevard.
Private store front entrances with ample parking in this “park like” setting.
B-2 zoning allowing restaurants, retail, and office users.
The Breeden Company develops, leases, and manages its properties and is locally operated. We take pride in our properties and constantly monitor all details because we have a vested interest.
WHY CHOOSE YORKTOWN COMMERCE
CENTER?

Center Location: Yorktown Commerce Center
228 North Lynnhaven Road Virginia Beach, Virginia 23452 Size: 31,000 Square Feet Rental Rate: Price is Negotiable Net of Taxes and Insurance Estimated CAM, Taxes & Insurance: $0.86 Per Square Foot - In Line Space Available: Suite 103-104 - 1,000 SF Suite 107 - 600 SF Suite 116 - 1,000 SF Suite 117 - 1,000 SF
LEASING

Suite# Tenant
101 Donald E. Lee, Jr. & Associates - Attorney At Law 102 Salon Chatta 103 - 104 AVAILABLE 1,000 SF 105 Masaja 106 Age Advantage Senior Care Services 107 AVAILABLE 600 SF 108 - 109 Ludlow Group 110 Beach Therapy & Consulting 112 Old Dominion Security 114 Ocean Air 115 Lynnhaven Chiropractic 116 AVAILABLE 1,000 SF 117 AVAILABLE 1,000 SF 117A Anna’s Place Day Spa & Studios 118 - 119 Miracle Tabernacle 120 Construction Accounting Inc./ D & D Appraisers, Inc. 121 Makeup By Kim Porter 122 - 123 Elevate Performing Arts Center 124 Tomstone Animation Art Gallery & Studios 125 - 126 Breakfast at Tomstone 127 - 130 Success Studio 131 PG Thomasson Funeral Services
YORKTOWN COMMERCE CENTER


% Change 2014-2019
% Change 2010-2014
% Change 2000-2010
% Change 2014-2019
% Change 2010-2014
% Change 2000-2010
DemographicReports (949)365-0125www.demographicreports.com
0.8%5.6% -4.0%
4.4%
10,482 89,482
4.3%239,411
225,2231.9%
2000 Census 9,928 93,215 223,397
VIRGINIA BEACH, VA: 228 NORTH LYNNHAVEN RD SITE LOCATED AT 36.84193, 76.07031 Yorktown Commerce Center
Population
1 MI RING 3 MI RING 5 MI RING
2010 Census1.5% 1.8%
Demographic Comparison Report Page 1 of 402/24/2014
2014 Estimate 10,644 91,070 229,393
2019 Projection 4.4%
11,106 95,058
2019 Projection 4,775 38,236Households
5.3% 5.2% 5.2%96,505
88,1514.0%
91,716
84,335
4.1%
2000 Census
2014 Estimate 4,535 36,338
4,134 34,865
3.8%2010 Census 4,371 34,914
5.7% 0.1% 4.5%
Age, total population 10,644 91,070 229,3936.8%
5 to 9 years 636 6.0% 5,553 6.1% 14,062 6.1%under 5 years 732 6.9% 6,185 6.8% 15,536
6.2%
28,969 12.6%
6.1% 14,107 6.1%
16.7%18,45638,414
7,342 8.1%
13,923 6.1%15 to 19 years 581 5.5%
8.0%20 to 24 years 870 8.2%5,529
10 to 14 years 598 5.6% 5,631
25 to 34 years12.5%1,404 13.2% 11,36235 to 44 years16.5%
14.1% 12,346
1,917 18.0% 15,023
2.2%
45 to 64 years 1,221 23.6% 10,426 23.7%
117,592
Median Age1,230 1.1%
65 to 84 years 464 9.0% 11,030
13.6%
85 years and over
5,461 47,039
35 - 44 years
3.9%
Median Age
20 - 34 years
Age, male population< 19 years 25.6% 11,623
45 to 54 years 1,504 13.4%30,769
2000/2010 Census ; ACS Survey
636 11.6% 5,983 12.7% 14,269
Median Age 40.5 41.7 41.8
444
Source: Scan/US 2014 Estimates (Jan 1)
2,544
5837.2 39.6
1.1%
27,70628,151 23.9%
23.6%
25.7%
1.0%
40.7
26.4% 29,477111,804
26,4239.9%
29,164 26.1%26.4%
12.9%
4,530 10.3%
11.3%705 6.6% 6,952 7.6% 16,600 7.2%
1,132
1.6% 3,774 1.6%
11.1% 25,911
8,699 3.8%154 1.4%
38.8 40.51,433
5,182 44,035
23.6%
1,396 26.9% 11,360706 13.6% 5,631
25.8%1,329
65 to 84 years 12.1%
12.2% 14,59635 - 44 years1,415 25.9% 30,257
12.4%
85 years and over 96 1.8% 989 2.1%
20 - 34 years< 19 years
12,038 25.6%
1,391 25.5% 11,005 23.4%698 12.8% 5,731
1,218 22.3% 11,275 24.0%
45 to 64 years
Age, female population
12.8% 14,373
39.2
85 years and over
65 to 74 years55 to 64 years 10.6% 10,118
75 to 84 years 395 3.7% 3,561

Family Income (families)under $10,000
Average non-family incomeMedian non-family income
DemographicReports (949)365-0125www.demographicreports.com
$55,106
$92,571$226.6
$81,249
30,815
Aggregate family income ($mil)
12,0401,746
$2,135.7$87,897
$5,637.7
$77,437
2000/2010 Census; ACS Survey
6.6%
2.8%
6.3%8.0%
$250,000 and over
$95.7 $663.5
Average family income
Non-Family Income (non-families)
Median family income
Aggregate non-family income ($mil)$54,814
$70,059
$46,824 $47,420
$200,000 - $249,999
1.2%
10.0% 2,469278
67 2.4% 567210
$30,000 - $34,999$35,000 - $39,999$40,000 - $49,999
2.2%
$100,000 - $124,999$125,000 - $149,999$150,000 - $199,999
395 3,522$75,000 - $99,999
7.5%
$60,000 - $74,999
5,093
10.2%
1,945
62
702297
3.1%98 3.5%
2,478
3,924
716
3425.9%
12.3%
14.2%454
165
160
902 3.7%
1,5315.7%
772.3%
14.5%
5.7%
5,919
3.4%2.0%
3.9%
4.3%
2,5522,7013,3803,908
8,521
6.5%10.9%
9.3%
2.4%
2.9%2.8%
3,575
16.3%
1,378
1,033
2.2%
1.2% 1.7%
1,706
2.9%
707
3.7%
2.9%
$68,906
6.6%5.3%
13.4%
1,76460,901
12,246
6,0741,792
$81,100
8,3004,880
5.9%
2.8%
13.8%
6.3%
$7,438.2
1,8132,282
12,299
3,136
9.0%13.4%
13.3% 5,028
85
$77,032$67,196
603
268
2,246
1,024$2,799.2
5,132
5.0%
14.1%8.6%
4.1%
1.8%
11.1%9.5%
9,9923,466
12.9%470
under $10,000$10,000 - $14,999
590370
2.7%2.4%
3.2%
587
2.3%
3.2%
4.9%
3,12113.0%
4,535
7.2%4,0432,434
1,081 3.0%3.9%
4.1%130144
224328
4.1%1,486
1,476873983
105
6.7%
91,71636,338
2.9%
1,408186143
$15,000 - $19,999$20,000 - $24,999$25,000 - $29,999
$150,000 - $199,999$200,000 - $249,999$250,000 and overAggregate Household Income ($mil)Average Household Income
$35,000 - $39,999$40,000 - $49,999
10.4%$50,000 - $59,999
$100,000 - $124,999
Median Household Income
654
$322.3
82 1.8%1.9%
$71,068
$25,000 - $29,999 87
$60,000 - $74,999$75,000 - $99,999
$30,000 - $34,999
$15,000 - $19,999
2,789
$10,000 - $14,9993350
$125,000 - $149,999 204
$59,883
$20,000 - $24,999
Demographic Comparison Report Page 2 of 402/24/2014
$323.9 $2,809.6 $7,485.7$30,430 $30,852 $32,633
1 MI RING 3 MI RING 5 MI RING
Total Aggregate Income ($mil)
VIRGINIA BEACH, VA: 228 NORTH LYNNHAVEN RD SITE LOCATED AT 36.84193, 76.07031 Yorktown Commerce Center
1.6% 1,130 1.9%54 1.9% 398
8.2%4.5%
24,298
1.8%
8.4%
10.7%
3.3%
2.2%2.8%2.9%
13.7%
9.2%5.3%
16.1% 15.2%
10.2%
2.9%
8,359
2,002
6,4963,990
5,5783,245
9,261
1,356
Source: Scan/US 2014 Estimates (Jan 1)
Per Capita Income
Household Income (households)
$50,000 - $59,999 244 8.7% 2,242 9.2% 5,483 9.0%
523
1,524 2.5%4.5%
$58,430
$79,883
$1,800.5
2,729
$49,470
Vehicles in owner householdsVehicles in renter households
DemographicReports (949)365-0125www.demographicreports.com
0.4% 937
8.3%
260 3.1% 2,548 3.6% 6,190
8.9%
14,576
15,99819.2%
19.2%
3574.1% 12,377 5.4%
0.2%0.2%
18.4% 44,074
Not in labor force
Female Population, Age 16+Employed
983.5%1502.3%
Unemployed
In armed forces
Not in labor force
Average vehicles per household
61.7%5,048
61.4%2,641
Vehicles Available (households)
1,702Households with no vehiclesHouseholds with 1 vehicleHouseholds with 2 vehiclesHouseholds with 3+ vehicles
4,535
Unemployed
4,300
21.3%
68,261
1,820
3.6% 1,449
40.1%32.7%42.0%
37.5%
7,729
In armed forces
Employed
Graduate/professional degree
2,649Employed
21.0%
110380833
In armed forces
1,411
Not in labor force
46,265
Source: Scan/US 2014 Estimates (Jan 1)2000/2010 Census; ACS Survey
68.5%38.3%
1.9 1.91.8Total vehicles available
3,133
8,181
11,882
31.5%53,57432.2%21,996
38,49815,25120.2%
67.8%
169,812
116,238
18,49718.6%842
164
621
758
5,2908,272
7201,316
0.3%
1,7981,874
7.1%
5.8%
6,884
26.1%
2,061 19.4% 16,744AsianHawaiian/Pacific Islander
3,695154
Male Population, Age 16+
Associate degreeBachelor's degree
36814 0.1%
3.5%
58819.1%
Labor Force (persons 16+ yrs)Total Population, Age 16+
Unemployed
No high school dipoloma
5,804
7,582
57,848
394
8.5%
34
White
1 MI RING 3 MI RING
Black
588
6.4%
5,133
American Indian/AK NativeOther/multiple races
Hispanic Origin
Education (persons 25+)
5 MI RING
VIRGINIA BEACH, VA: 228 NORTH LYNNHAVEN RD SITE LOCATED AT 36.84193, 76.07031 Yorktown Commerce Center
Demographic Comparison Report Page 3 of 402/24/2014
7,542
Population by Race/Ethnicity 10,644 91,070 229,393
68.5%70.9% 70.6%64,270 157,045
18,328
3,972
478
9.6%
2,244 27.1% 21,015
29,254
42,37770,049
5.8%
2.8%
10,64152,205
84,32966.7%
26.9%10.2%
20,748 62.0%
64.0%
10.5%
8.5% 5,92011,114
0.4%
8.0%
35.5%1.9%
9.9%20.0%
23.4%
62.4%
24.5%
6.4%
29.7%
59.2%3.4%
23.8%
146,079
8.0%
26.7%
3.5%
11.0%
3.6%10.6%
60.5%
14,398
106,798175,834
11,74635,746
8,9173,050
52,606
38,937
36,338
7,955
24.3%
19,75610.5%
60.7%
6.1%
15,57914,043
3,14054,19291,505
3.6%
13,060583
36,58821,629
30.0%4,109
3.7%3,526
42.0%30,899
1,7241.6%35.7% 32,449
4.1%33.7%
91,716
High school diplomaCollege, no diploma
4.0% 3,739
32.8%
1,232
1,316
27.2%
5.9%
10.5%6,059
33,461
59.1%

DemographicReports (949)365-0125www.demographicreports.com
$1,050Median Contract Rent $984 $1,025
$307,294Average Contract Rent $864 $902 $935Median Home Value $272,324 $291,288
Housing Value (2010)Average Home Value
1 person
75 - 84 years
29.8%
85+ years
65 - 74 years
Household Size (households)
2 persons
$274,054
680
25 - 34 years
2,789 24,298
35 - 44 years
Age of Householder (households)
17,0507,788
Families1,883
43.1%with childrenMarried couples
with children
with children1,746
697
460
55 - 64 years
VIRGINIA BEACH, VA: 228 NORTH LYNNHAVEN RD SITE LOCATED AT 36.84193, 76.07031 Yorktown Commerce Center
1 MI RING 3 MI RING
Male householder, no wife 7.5%
70.2%45.7%
Group Quarters
Average household size
Average family size
Average non-family size
135
812
1.291,746
2.96
Household Type
2.48
5 MI RING
1.3112,040
36,338 91,716
3.06
1.31
3.06
43,144
906
114
2,750
216
67.5%60,901
Demographic Comparison Report Page 4 of 402/24/2014
Households
Families
Non-Families
24,298 60,901
2.47
30,815
4,535
2,789
2.32
19,671
33930,815
67.8%21.9%
7.1%
70.8%45.6%
57.8%
9,058
4,3462,510
67.6%
7.7% 1,824
15,889
5,773
22.2%52.8%24.4%
25.1%
6.3%
1.1%
814
28.8%
17
5.8%
22.1%6.3%
2.7%6.4%
17,382 19.0%16.5%
17.3%18,946
11.9% 10,313 11.2%15,132
20.7%
2,456
Female householder, no husbandwith children
1.2%
16.3%
17.1%45 - 54 years
58.7%
12,040
6.6%
1461.0%
1,0705,4053,617 66.9%
5,777
13,361
7,358< 25 years
20.2%
Non-Families
6.9%1,352 11,898
3,252311 8,145 8.9%32.2%29,51432.7%
30,991
8.9%
2000/2010 Census; ACS Survey
12,1549,024
1,5681,304 22,988
33.8%34.6% 33.4%
60.9%95.8%
Owner-occupied2,008 44.3% 14,405 39.7% 35,893 39.1%
4,068 4.2%160 3.4% 1,159
Source: Scan/US 2014 Estimates (Jan 1)
60.3%
6,864 18.9%5,911
55,824
95,78596.9% 91,717
3.1%
$293,983 $308,768
37,482
Renter-occupied
Occupied 4,536 96.6% 36,3232,528 55.7% 21,918
24.8%
6,20117.9%
888
4,3352,342
2.4%
15.4%
2,4151,004
880 19.4%
2.1%
10.3%
6.7%
Vacant
96
468263
306
Total Housing Units 4,696
3-4 persons5+ persons

DemographicReports (949)365-0125www.demographicreports.com
40 9.7%
0 0.0%Agricultural services 2 100.0% 31 100.0% 72 100.0%Agricultural production 0 0.0% 0 0.0%
53.4% 562 48.9%242
Agriculture 2 0.3% 31 0.6% 72 0.7%
12.9%6 8.3% 24 5.3%
14866 14.6%107 9.3%
1.2% 48 1.1%39.3%37.8% 4,288
7.8% 338 7.9%
50 12.1% 244
413 51.9% 1,8657 1.7% 23
146
115 27.8% 372
67 16.2% 543
32 17222.3%
24.7%102 365 19.0%81619.6%19.9% 957
1,244
10 0.9%113
7 1.5%
10.5%
29.0%
9.8%
Source: InfoGroup, Scan/US 2013 Estimates
36 7.9%
13.0%0 0.0% 5
59
19
1,149
4.2%
165 14.4%
16.4%88 2.3%
72 9.0% 453 9.2%
11.3%13.1% 48329.1%
9.4%9.2% 402
3.2%2
4.8%10
0.4%
46 22.2% 310 16.8% 6241.9%0 0.0% 36
39 3.4%
7 3.4% 59 3.2% 122
0.7%13 0.7%
203 5.4%
0.7%278
87 4.7%0.4% 26
16.4%367 19.8% 700 18.5%283 15.3% 621
40.0%
36.5%687 37.1% 1,383
81.4%
1,850 37.5% 3,794 34.7%
76.0% 166
Manufacturing 16 2.0% 104 2.1%2 12.5% 5 4.8%
79
General manufacturingLight manufacturingManufacturing, <10 employees
25.0%
2043.9%8
Page 1 of 202/24/2014
4,928 10,918
VIRGINIA BEACH, VA: 228 NORTH LYNNHAVEN RD SITE LOCATED AT 36.84193, 76.07031 Yorktown Commerce Center
Total Establishments
Establishments by Type
5 MI RING
Business Comparison Report
796
1 MI RING 3 MI RING
Hotels/motelsTheaters/retail amusements
0.4%Industrial 83 10.4% 624 12.7%
0 0.0% 3 0.5% 6
104
Mining
40 804
WarehousingGeneral industrial
12.9%1,411
3 3.6%
3
8.4%
Heavy manufacturing
Automotive repair services
ConstructionConstruction, <10 employeesHigh-tech/researchTrans/comm/utilitiesWholesale/industrial
Public administrationChurchesOther, not elsewhere classified
Equipment rentalWholesale/commercialGeneral commercial
OfficesBusiness and corporate administrationFinance/ins/real estateFinance/ins/real estate, <10 employeesProfessional servicesBusiness servicesGeneral officeMedical services
Schools and collegesLibraries
Other
Outdoor recreation/amusement parks 15.3%110.0%0
0.0%
Museums/art galleries/gardensHospitals/medical services 2.8%2
06.9%5
10
0
50.0%3616.7%12
7.7%
1.0%21.0%
17 20.5%
3 3.6%
7
48.2%
19.3%40
62.5%10
26.0%207Commercial37.7%78Retail trade
Restaurants/barsPersonal/rental/repair services
1.8%9 25
10.6%22
90
20
41
3.2%
1.9%
3.8%
16 15.4% 20 9.8%
53
4 3.8%
140 9.9%
6.8%
10 4.9%
7.4%6.6%
57.0%
13.0%34 96
14.4% 183
1.4%
12.0%
3.6%
65 10.4%
5.4%
362 58.0%

DemographicReports (949)365-0125www.demographicreports.com
100.0%
Agriculture 12 0.1% 343 0.6% 684 0.6%Agricultural production 0 0.0% 0 0.0% 0 0.0%
847
2,130
Agricultural services 12 100.0% 343 100.0% 684
98
60.1%
Other, not elsewhere classified
Public administrationChurches
8.9%
1,363
1,409
19,5104,561
1,202
480
324 7.1%29.9%
General officeMedical services
Schools and colleges
0.2%
189 1.1%11.4%
21.0%
Business & corporate administrationFinance/ins/real estateFinance/ins/real estate, <10 employeesProfessional servicesBusiness services
General manufacturingLight manufacturingManufacturing, <10 employees
Wholesale/commercial
Commercial
Wholesale/industrialWarehousingGeneral industrial
Heavy manufacturing
10.0% 11,898 10.0%10 0.2% 24 0.2%
5,487Employees by Type
IndustrialMining 0 0.0%
13.5%1,378
6.5%
44,846
48.0%
3,618
8.9%
20.6%5.5%
20.0%
8,2975,760
4.1%710
23.0%
Source: InfoGroup, Scan/US 2013 Estimates
239 5.2% 1,502 7.7% 3,907 8.7%
0313
17.4%30
1,003
84 6.0% 373
5 MI RING
3,985
9,582
9,2202,461
21.4%
37.7%14.0%18.5% 6,286
35.7%Offices
6.6%
Business Comparison Report Page 2 of 202/24/2014
10,218 54,653 118,907Total Employees
VIRGINIA BEACH, VA: 228 NORTH LYNNHAVEN RD SITE LOCATED AT 36.84193, 76.07031 Yorktown Commerce Center
1 MI RING 3 MI RING
Theaters/retail amusementsEquipment rental 20 0.8%
General commercial
Retail tradeRestaurants/barsPersonal/rental/repair servicesAutomotive repair servicesHotels/motels 12
0.3%
0 0.0%
44.6%
40385 3.2%144
28.8% 442
0.5%
1,69725.7%64.6%
2,4568.5%
45.8%16.9%
13
1.7%17.8% 15.1%467
0.5%
354170164
3,066
0.8%0.8%
214ConstructionConstruction, <10 employeesHigh-tech/researchTrans/comm/utilities
15.5%7.5%
2,189943
Manufacturing
95 6.9%
10410
84
68.4%245
1,674991
2.0%
39,785
0.7% 726
46.7%
2,696642
37.0%
614
24.2%
1.4%
1.0%
14.5%
13.9%
23.1%
1.6%
290
3.5%74.2%
4,420
2.4%
13.3%
7.9%
89
56
233
0.6%
2.3% 6.1%3,312
1,591
40
6.0%
9,4584,890
68
299
20,240
158173
2,625
236
0.7%
11520108
14.8%
257 0.6%
41.6%33.5%
324 0.8%
8981.8%
3,087
1.9%
44.1%
4.5%
30.5%18.1%
162606
2,753535
5.1%4.2%39.9%
4.5%
5,2432,285 19.2%
3.7%
9.0%
26.4%12.0%
15.8%
7525,890
7.8%
468
16,565
2.3%
61.0%10.6%
11,286 28.4%
0.0%
1,015
2.5%
1,461
546
10.5%
1,106
0 0.0% 144280
9.3%
5.7%4,496
3,899
3,074
1,975
Other
407 1,815
Libraries
13.8%19.9% 1,925
17,272
9,405
Hospitals/medical servicesMuseums/art galleries/gardens 0
62
38
Outdoor recreation/amusement parks
14.5%
8.5%14.4%
12.3%
2.7%0.0%
10.5%33.4%
5.4%17.6%
17.1%
2,4804.4%
7.0% 987
Household textilesFurnitureFloor coveringsMajor appliancesSmall appliances/housewaresMiscellaneous household equipment
DemographicReports (949)365-0125www.demographicreports.com
Boys, 2 to 15 yrs
Men & boysMen, 16 yrs and over
$1,935 11.2%
$672
Utilities/fuels/public services
77.8%
$112
0.7%$13
$966 49.9%
24.9%
Source: Scan/US 2014 Estimates (Jan 1)
$84
$608 83.7%$723
$118 16.4%$604
$118 16.3%
40.3%83.6%
$659 40.2% $726
$1,792 3.4%
$689
22.0% $3943.4%
3.9%
22.0%
$689
$1,794
40.5%21.2%
$394
21.3%$8378.7%78.8% $310$310
$745 7.9%
11.4%
$4,010 22.8%
$14 0.7%$140.7%
5.8%5.8% $117$116
$1,994 11.4% $2,021
$3,576 37.7% $3,545
11.5%
24.5% $498 24.7%7.3% $147 7.3%$146
$489
7.9%
7.3%
50.2%50.1% $1,014
37.2%
$230
23.1%7.2% $1,279
$754
$1,299 25.2% $1,314 25.1%$2,877 55.0%$5,233
54.2%
20.1% $1,042 19.9%
12.4%$6,602
$424
$17,484 32.7%
58.2%
$352 0.7%
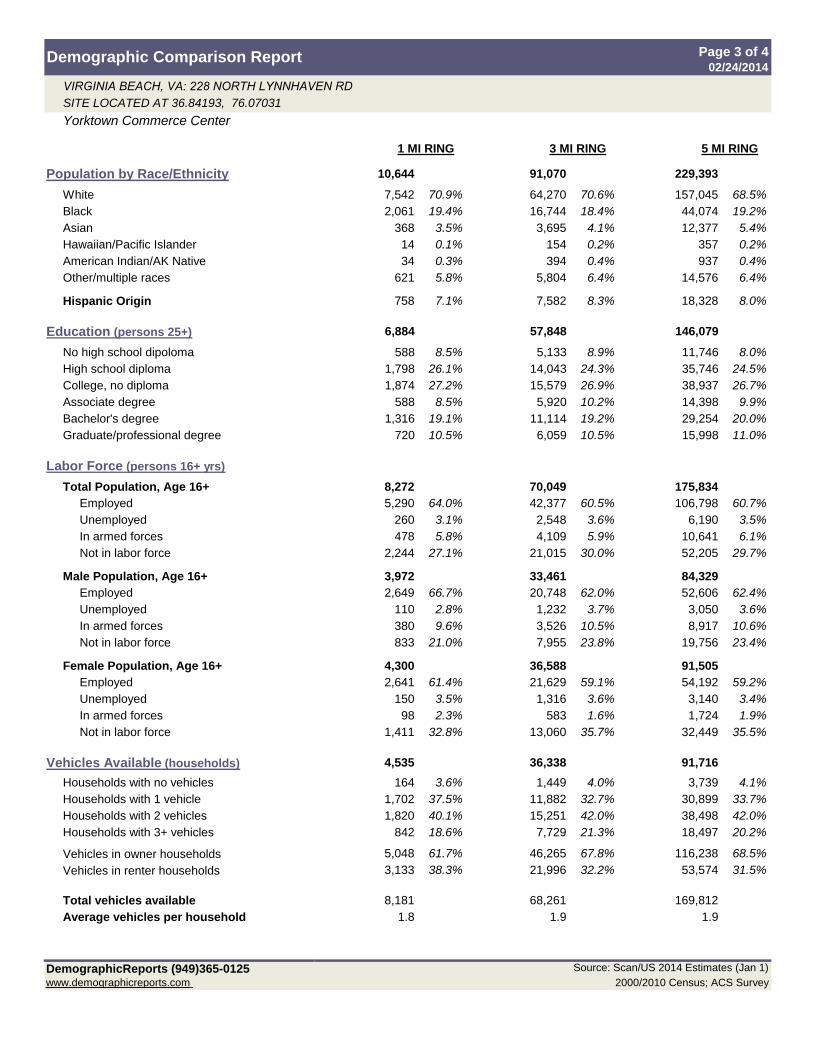
Consumer Spending Comparison Report Page 1 of 202/24/2014
Households
Average Household income
1 MI RING 3 MI RING 5 MI RING
VIRGINIA BEACH, VA: 228 NORTH LYNNHAVEN RD SITE LOCATED AT 36.84193, 76.07031 Yorktown Commerce Center
Average Annual Spending by Category
Food at home
Average Annual Household Spending
Renter householdsOwner households
4,5352,5272,008
$71,068$50,232
36,33821,93314,405
$77,032$53,430
91,71655,82335,893
$81,100$53,412
Fruits/vegetables
13.3% $511$3,577 58.8% $3,889 58.4% $3,839
10.5%$407 $403
Cereals/bakery productsMeats/poultry/fish/eggsDairy products
Other food at home
Housing
13.3%
Food $6,085 12.1% $6,655 12.5%
$677
22.7% $870
$627
22.7%$813$374
$882
Shelter
Alcoholic beverages
Food away from home
13.4%
41.2%
$519
$2,765
$478
$1,387$685
10.5%
$2,508
17.5%
$4,031
11.5%
16.6%
Maintenance/repairs/insuranceRented dwellingsOther lodging
Household furnishings & equipment
Household operationsHousekeeping supplies
Apparel
19.6%$893
3.9%
23.4%
11.5%
$9,483
55.7%24.7%
8.3%
$2,82248.7%54.4%
54.7%
$1,039
$9995.8%
$229
$1,253
Women, 16 yrs and overGirls, 2 to 15 yrs
Women & girls
Tobacco products $341
$4,023
$1,638
$2,541$1,125
$773
Owned dwellings Mortgage interest/charges Property taxes
$4,559$9,353
$359
$1,276 35.7%
0.7%
0.8%
0.7% $360
$424$384 0.8%
$10983.4%$550
7.1%$1,2203.9%
$80 22.2%$279
3.3%21.9%
$223
0.8%
32.9%$17,571$17,206 34.3%
$482$138 7.1%
$5,160 54.4%
43.0%$4,019
54.9%
41.8%
$9,535 54.3%
17.6%17.6%
22.7%
35.7%$2,762
35.7% $1,369
10.5%
41.6%

Other apparel
DemographicReports (949)365-0125www.demographicreports.com
782
25.5%1,102
25.3%16.4%16.2% 480
92.0%8.0%
4.2%
37.8%
6,2645,760
504
Cash contributions
6,164
Education
Personal insurance & pensions 10.9%91.8%
8.2%
1.3%
739
11.7%
467
1.3%
1.8%
1.3% 698
Source: Scan/US 2014 Estimates (Jan 1)
86 0.2% 98 0.2% 97 0.2%
4.2%
1.9%997
20.8%
$50,232 $53,430 $53,412
$1,638 $1,794 $1,792
20.4%13.2% 238
1,101 38.2%
2,218
365 365236
20.4%13.3%
Page 2 of 202/24/2014
1 MI RING 3 MI RING 5 MI RING
InsuranceRental/leasing/other 322
2,219
441,602
Other vehicles
8,495Vehicle purchases
Consumer Spending Comparison Report
Average Annual Spending by Category
Children under 2 yrs
Gasoline & motor oil
VIRGINIA BEACH, VA: 228 NORTH LYNNHAVEN RD SITE LOCATED AT 36.84193, 76.07031 Yorktown Commerce Center
Apparel (cont'd)
12.9%211
2,757
1,700
16.9%38.2%
46
Health InsuranceMedical servicesDrugsMedical supplies 150
15.6%
6.7%1,9443,369
131
57.7% 2,169867769
44.5%14.5%
719675988
2,883
717
2,813 5.6%
25.5%
581
734
19.8%556
9,079
44.4%30.4%
14.7%
708
14.9%
16.7%17.0%39.1%
1,7701,682
57.5%
587 15.5%
2,377243
26.2%
3,773
350
392
1,065
2,918597
57.3%23.2%
573857
4648.1%47.9%
1.3% 1.3%
2,698
30.3%44.8%
2,33310.2%
1,036347
4.3%
241
402
7.1% 6.9%3,699
4.0%
20.5%
148 4.0%15.5%
2,12123.0%
5.4%20.2%
5.5%
776 1.5%
4.1%
11.5%
1.5%1.5%
Pensions/social security
748
2,058 2,242
Miscellaneous
Life/other personal insurance5,049 92.2% 5,661
425 7.8% 502
4.5%
30.2%
26.1%10.3%
30.4%
5,474
16.1%
867
632
454
1.7%
703
975
69 3.9%70 3.9%
50.6%39.1%
50.8%3,5481,802
8,9353,498
38.6%
22.8%
Transportation
Cars and trucks, newCars and trucks, used
10.6%
49.3%
3,2481,602
1.3%
49.3%
23430.4%
3.9%525
Other vehicle expensesFinance chargesMaintenance and repairs
4.0%66
4.5%
26.1%
31.1%
Footwear 340
Reading
2,643
Public & other transportation
Health care
Entertainment
Audio/visual equipment/servicesPets/toys/playground equipment
Personal care products and services
381
Fees and admissions
Other entertainment supplies
1,087

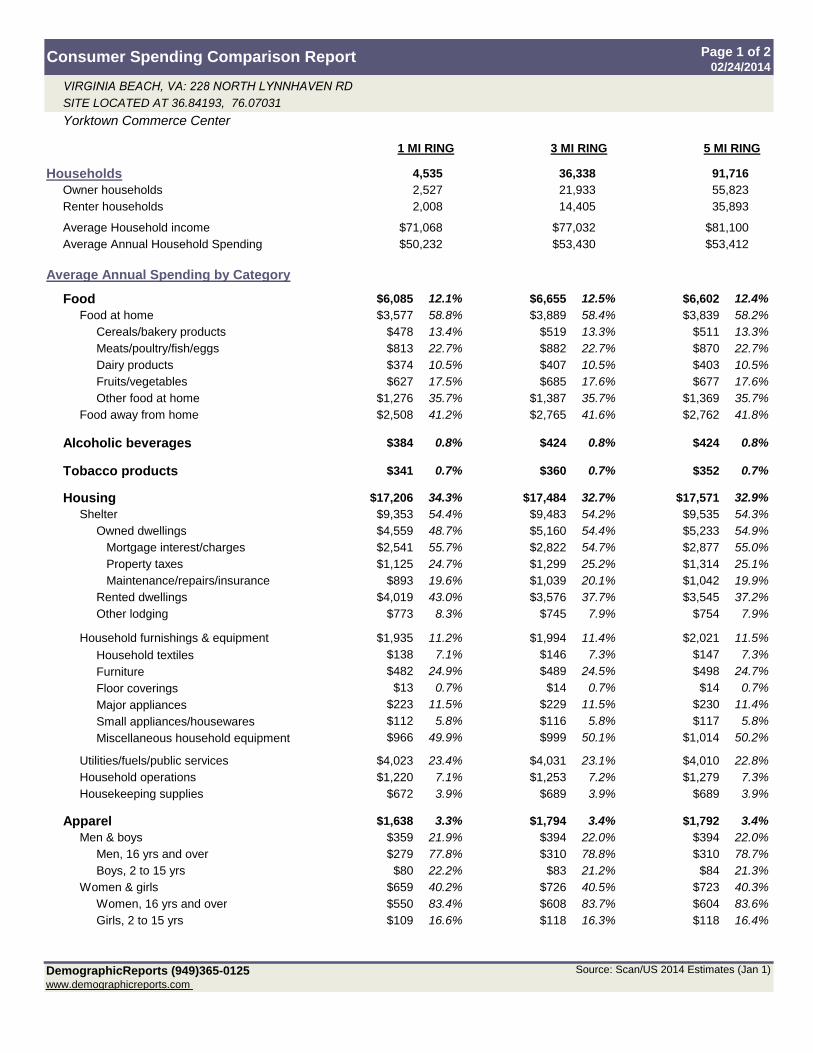
Virginia Beach, VA: 2014 Population
© 2
014
Scan
/US,
Inc.
All
righ
ts r
eser
ved.
02/24/2014DemographicReports.com (949)365-0125

Virginia Beach, VA: 2014 Average Household Income
© 2
014
Scan
/US,
Inc.
All
righ
ts r
eser
ved.
02/24/2014DemographicReports.com (949)365-0125

Virginia Beach, VA: 2013 Employees
© 2
014
Scan
/US,
Inc.
All
righ
ts r
eser
ved.
02/24/2014DemographicReports.com (949)365-0125

Virginia Beach, VA: 2014 Average Annual Spending
© 2
014
Scan
/US,
Inc.
All
righ
ts r
eser
ved.
02/24/2014DemographicReports.com (949)365-0125


![Simpson Gardens Open House Oct 2012[1] - Master Gardeners of Northern Virginia · 2012-10-12 · Arlington office of Virginia Cooperative Extension (703) 228-6400/TDD/PC 1-800-1120](https://img.pdfslide.us/doc/110x75/5f7be6ab2981752302708cfb/simpson-gardens-open-house-oct-20121-master-gardeners-of-northern-virginia-2012-10-12.jpg)