Embed Size (px)
Citation preview
1
Apr
il 20
21UC
C - M
arke
t Per
form
ance
Rep
ort

2
Apr
il 20
21UC
C - M
arke
t Per
form
ance
Rep
ort
The information and figures contained herein were obtained from licensees’ submissions to the Commission and other sources available to the Commission. It is intended to provide the communications market overview to:
1. The industry,2. Prospective entrants,3. Government,4. Academia and other stakeholders.
UCC does not give any warranty and may not be liable for the interpretation arising from its use or misuse.
Legal Disclaimer

3
Apr
il 20
21UC
C - M
arke
t Per
form
ance
Rep
ort
This is a review of the industry performance, trends and key developments for the quarter starting January to March 2021. The report covers:
1. Outlook of the Global Telecom Market Place2. Uganda Highlights in the Telecom Industry3. Service access4. Traffic and Usage5. Industry Revenues6. Post and Courier Services
Introduction

4
Apr
il 20
21UC
C - M
arke
t Per
form
ance
Rep
ort
Continued Rise of Social Media Applications
1Q21 yet again saw increased digitisation and dependence on online messaging channels associal distancing and remote work remained deeply engrained in the workplace and socialrelationships as what came to be known as a COVID third wave continued throughout Europe and theAmericas.
At the end of March 2021, Social media giants continued posting record new accounts during the period.
Facebook reported an active account base of 2.74 Billion users closely followed by 2.3 Billion YouTubeaccounts. It can therefore be implied that almost 4 out of every 10 persons globally have a socialmedia account.Social media indeed continues to have an inescapable presence in our everyday lives.
In the world of Peer to Peer messaging applications, WhatsApp Messenger posted 2 Billion activeusers while Asian chat powerhouse WeChat/Weixin reported an estimated 1.2 Billion active users atthe end of March 2021.
On the other hand, image and video sharing applications such as TikTok, Instagram and Snap Chatreported a combined user base of 2.4 billion accounts at the end of the review period.
Audio based online chat forums
Relatedly, there was continued growth in subscriptions for Clubhouse, an audio chat social mediaapplication launched at the peak of the global Corona lockdowns. This is very much similar to live audiodebates and political talk shows of the Mid 2000’s popularly known as “Bimeeza” but with a much bigger global audience and reach.
Clubhouse active accounts have grown to more than 2 million at the end of March 2021.Part of thisgrowth has been fuelled by celebrity endorsements and appearances like Tesla CEO Elon Musk’sappearance on The Good Times Show as well as Robin Hood CEO Vlad Tenev’s discussion onGameStop Shares on Clubhouse. Celebrities like Oprah Winfrey, Drake and Kevin Hart maintain anactive presence on the platform.
Global Outlook
4 out of every10 persons globallyhave a social media
account

5
Apr
il 20
21UC
C - M
arke
t Per
form
ance
Rep
ort
Business Communication and Remote Working Applications
Zoom and Microsoft Teams (MS) Teams continue to dominate the remote working market accountingfor 445 million active accounts. In terms of users, Microsoft Teams posted 145 million daily active usersin 1Q21 compared to Zoom’s estimated 300 million.
So prevalent have Zoom and Teams meeting and conferencing applications grown that they havebecome the go-to learning platforms even at elementary schools in the global south.
Online Privacy vulnerabilities
The increased dependency on Over-the-Top Applications and other social media applications has notcome without challenges as more people get online. At the beginning of the quarter, personal data formore than 500 million Facebook accounts was compromised and leaked online by a group of hackers.More than 32 million of the leaked accounts were apparently for users from the USA while the rest weredistributed across more than 100 countries.
Allegedly, Clubhouse and LinkedIn applications also faced data scraping breaches from third partyapplications.
6
Apr
il 20
21UC
C - M
arke
t Per
form
ance
Rep
ort
The increase in data hacking presents newregulatory challenges globally and on the continent at a time when millions of first time users are getting onboarded ontosocial media and remote working platforms.
Consent Solicitation for third party data sharing Whatsapp – Facebook Data Share Consent
At the beginning of 1Q21, P2P messaging application WhatsApp notified its more than 2 Billion usersthat it would be sharing some of its customer data largely profile identifiers like mobile numbers withits parent company Facebook.
This accept or leave terms update was to take effect on 8th February 2021 but was pushed to 2Q21following widespread complaints from consumers and privacy advocates.
The move has also seen double digit monthly growth in downloads of other peer to peer messaging applications like Signal and Telegram apparently on account of strong privacy ethos.
7
Apr
il 20
21UC
C - M
arke
t Per
form
ance
Rep
ort
Apple
In a strategic shift from Whatsapp and Facebook, towards the end of 1Q21 global software and hardware giant Apple announced its intent to solicit for active consent from its customers for the sharing of their data to third party applications. This is a major shift from current practice where data sharing consent is assumed until one actively opts out.
This fundamental change has not gone without objection from major OTT providers who have in-part argued that the new restrictions are a move a move by OS and Hard- ware vendors to anticompetitively exclude them from some consumers. Further, they argued that it is not that the applications are collecting any more data than they have previously been collecting.
Global handset shipments
Global handset shipments continued to grow with market analysts projecting a 7.7% year on year growth in smartphone shipments during 1Q21.
5G is expected to be the biggest growth driver for developed markets whereas the strong demand for 4G phones following the pandemic will drive demand in emerging markets.
Growth in Mobile Financial Services
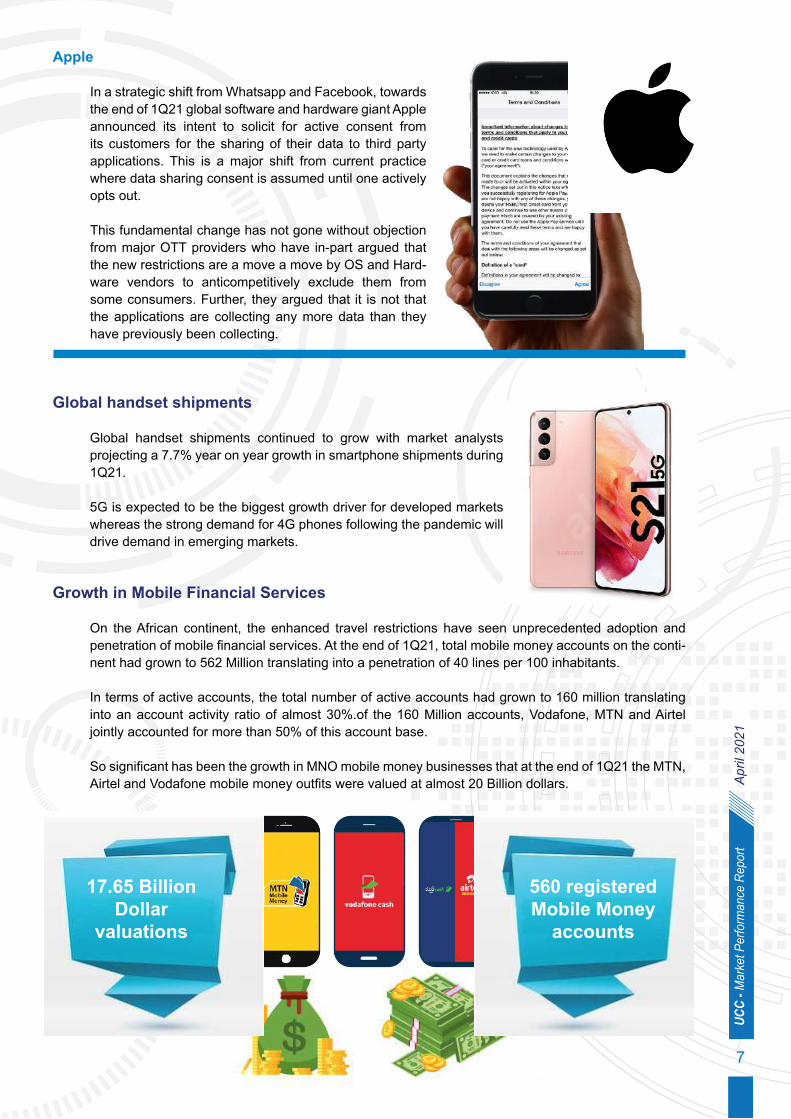
On the African continent, the enhanced travel restrictions have seen unprecedented adoption and penetration of mobile financial services. At the end of 1Q21, total mobile money accounts on the conti- nent had grown to 562 Million translating into a penetration of 40 lines per 100 inhabitants.
In terms of active accounts, the total number of active accounts had grown to 160 million translating into an account activity ratio of almost 30%.of the 160 Million accounts, Vodafone, MTN and Airtel jointly accounted for more than 50% of this account base.
So significant has been the growth in MNO mobile money businesses that at the end of 1Q21 the MTN, Airtel and Vodafone mobile money outfits were valued at almost 20 Billion dollars.
17.65 BillionDollar
valuations
560 registeredMobile Money
accounts

8
Apr
il 20
21UC
C - M
arke
t Per
form
ance
Rep
ort
Domestic Highlights

9
Apr
il 20
21UC
C - M
arke
t Per
form
ance
Rep
ort
Multimedia and the Scientific Election Season
Restricted movements and Social Distancing protocols occasioned by the pandemic mandated that the 2021 national and local council elections (in 1Q21) largely played out on electronic communica- tions platforms.
For the first time in the Uganda electoral history, the use of electronic media channels outpaced traditional mass rallies and the use of print campaign material.The shift in campaign strategies provided a welcome boost to not only small regional media outlets but also created a new breed of social media political strategists and influencers.
In January 2021, most broadcasters (TV and Radio) registered bookings and sponsorships for more than 95% of primetime broadcast slots by candidates and their agents.
On the digital front, Presidential candidates garnered tens of thousands of followers in the short campaign season. So rapid was the media presence of presidential candidates that most of them got “verified” by various social media platforms at the end of the campaign season.
The season also brought with it the first use of live online broadcasts as different political actors reached out to the electorate over social media channels.
10
Apr
il 20
21UC
C - M
arke
t Per
form
ance
Rep
ort
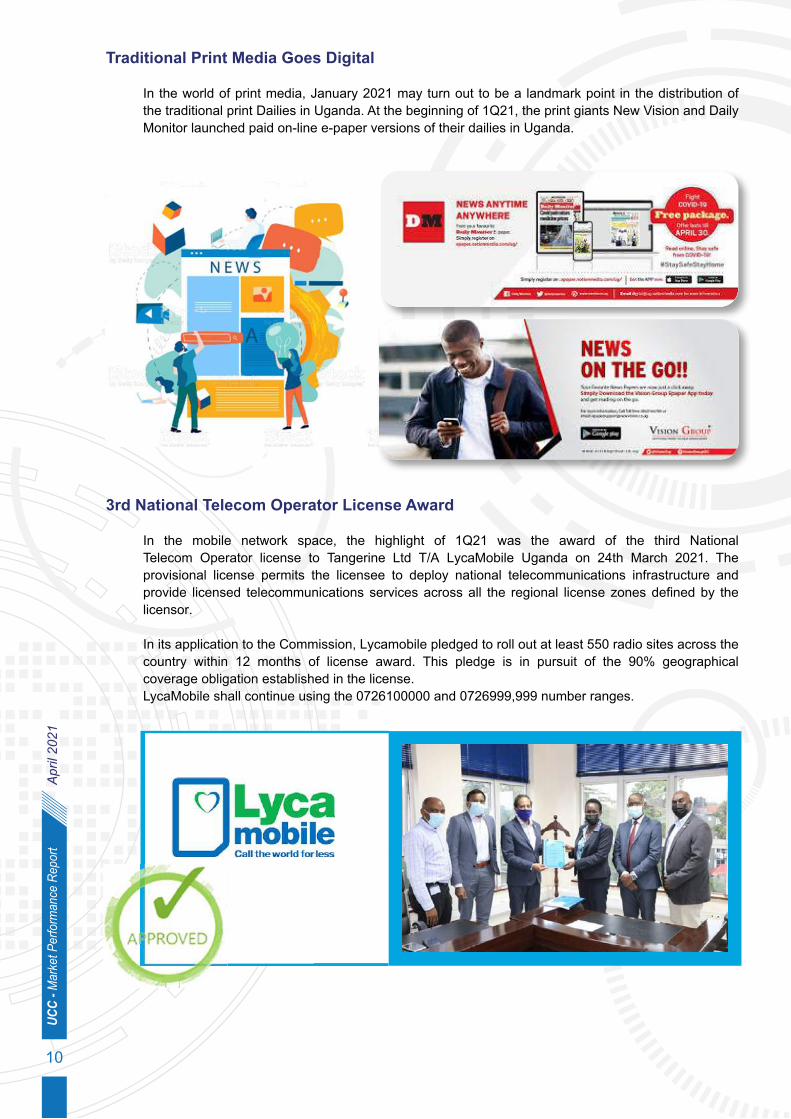
3rd National Telecom Operator License Award
In the mobile network space, the highlight of 1Q21 was the award of the third National Telecom Operator license to Tangerine Ltd T/A LycaMobile Uganda on 24th March 2021. The provisional license permits the licensee to deploy national telecommunications infrastructure and provide licensed telecommunications services across all the regional license zones defined by the licensor.
In its application to the Commission, Lycamobile pledged to roll out at least 550 radio sites across the country within 12 months of license award. This pledge is in pursuit of the 90% geographical coverage obligation established in the license.LycaMobile shall continue using the 0726100000 and 0726999,999 number ranges.
Traditional Print Media Goes Digital
In the world of print media, January 2021 may turn out to be a landmark point in the distribution of the traditional print Dailies in Uganda. At the beginning of 1Q21, the print giants New Vision and Daily Monitor launched paid on-line e-paper versions of their dailies in Uganda.

11
Apr
il 20
21UC
C - M
arke
t Per
form
ance
Rep
ort
Separation of Airtel and MTN Mobile Money Units
During 1Q21 Airtel Mobile Commerce Ltd the subsidiary of Airtel Africa Group and Airtel Uganda Limited the licensed NTO were issued with a no objection to separate Digital Financial Services (DFS) from Airtel’s Cellular Network Operations.
Relatedly, MTN Mobile Money Uganda Limited part of the MTN Group was issued with a no objection towards the separation of MTN Digital Finance and Cellular Operations.
These no objections are in partial fulfilment of new regulatory obligations instituted by the National Payments Systems Act 2020 and the Uganda Communications Pricing and Accounting Regulations 2019.
Under the new dispensation the mobile money and the cellular operations unit will file access agreements between the two entities for the Commission’s appraisal of potential consumer and competition challenges posed by the partnership. This is in line with the UCC’s Access and Interconnect regulations of 2019

12
Apr
il 20
21UC
C - M
arke
t Per
form
ance
Rep
ort
Service Access

13
Apr
il 20
21UC
C - M
arke
t Per
form
ance
Rep
ort
Telephone Subscriptions
The industry posted a net account addition of 590,000 mobile and fixed subscriptions. Total Revenue Earning Customers (REC) grew from 27.7 million in December 2020 to 28.3 million accounts at the end of March 2021.
This is the first time that total accounts have crossed the 28 million mark since the pre-Covid peak of March 2020. This growth in subscriptions realised in the period January to March 2021 resulted into 2% quarter-on-growth which is the lowest growth recorded in the last 2 quarters.
The recovery in subscriptions resulted in a penetration of almost 7 lines for every 10 individuals in Uganda.
Subscriptions crossed28 million
Penetration Stands at 7 linesfor every 10 Ugandans
FIXED MOBILE TOTALSUBSCRIPTIONS PENETRATION CHANGE
3Q20 88,932
4Q20 90,774
1Q21 97,187
26,437,348
27,688,987
28,272,047
26,526,280
27,779,761
28,369,234
5%
2%
64%
67%
67%
Mobile and fixed telephone subscriptions
14
Apr
il 20
21UC
C - M
arke
t Per
form
ance
Rep
ort
Broadband subscriptions
As of March 2021, broadband cellular subscriptions stand at 21.5 million, with an observed net addition of 120,000 new subscriptions.
While the quarterly net additions have not matched the more than 1 million subscriptions posted in 4Q20, this is still noteworthy growth given the internet and social media restrictions during the period as well as the traditional network churns which usually follow the December peaks..Fixed and mobile internet Subscriptions
Network connected devices and terminals
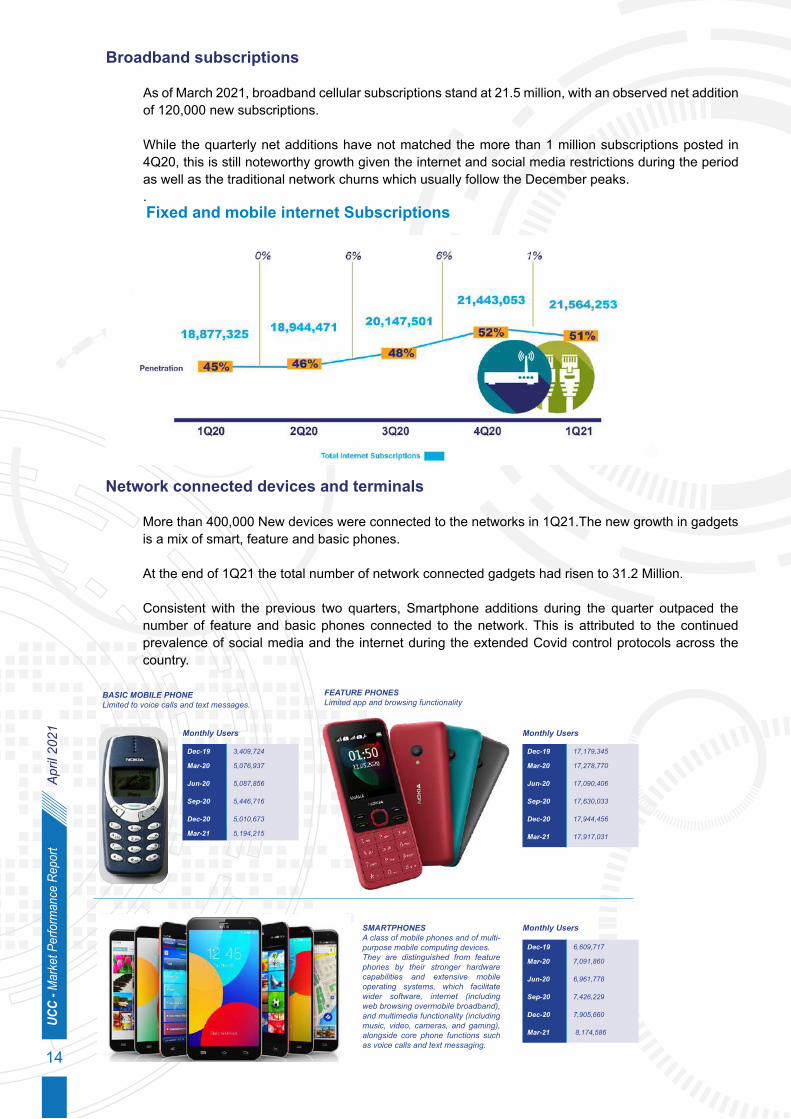
More than 400,000 New devices were connected to the networks in 1Q21.The new growth in gadgets is a mix of smart, feature and basic phones.
At the end of 1Q21 the total number of network connected gadgets had risen to 31.2 Million.
Consistent with the previous two quarters, Smartphone additions during the quarter outpaced the number of feature and basic phones connected to the network. This is attributed to the continued prevalence of social media and the internet during the extended Covid control protocols across the country.
FEATURE PHONES Limited app and browsing functionality
SMARTPHONESA class of mobile phones and of multi-purpose mobile computing devices. They are distinguished from feature phones by their stronger hardware capabilities and extensive mobile operating systems, which facilitate wider software, internet (including web browsing overmobile broadband), and multimedia functionality (including music, video, cameras, and gaming), alongside core phone functions such as voice calls and text messaging.
BASIC MOBILE PHONELimited to voice calls and text messages.
Dec-19 3,409,724
Mar-20 5,076,937
Jun-20 5,087,856
Sep-20 5,446,716
Dec-20 5,010,673
Mar-21 5,194,215
Dec-19 17,179,345
Mar-20 17,278,770
Jun-20 17,090,406
Sep-20 17,630,033
Dec-20 17,944,456
Mar-21 17,917,031
Dec-19 6,609,717
Mar-20 7,091,860
Jun-20 6,961,778
Sep-20 7,426,229
Dec-20 7,905,660
Mar-21 8,174,586
Monthly UsersMonthly Users
Monthly Users
15
Apr
il 20
21UC
C - M
arke
t Per
form
ance
Rep
ort
Over 200,000 smartphones were added within the quarter growing from 7.9 Million smartphones in December 2020 to 8.1 million in March 2021.
Network connected basic phones recovered from an 8% drop in 4Q20 to post a 4% growth in 1Q 21. At the end of March 2021, the total number of basic phones connected to the networks stood at 17.9 million gadgets.
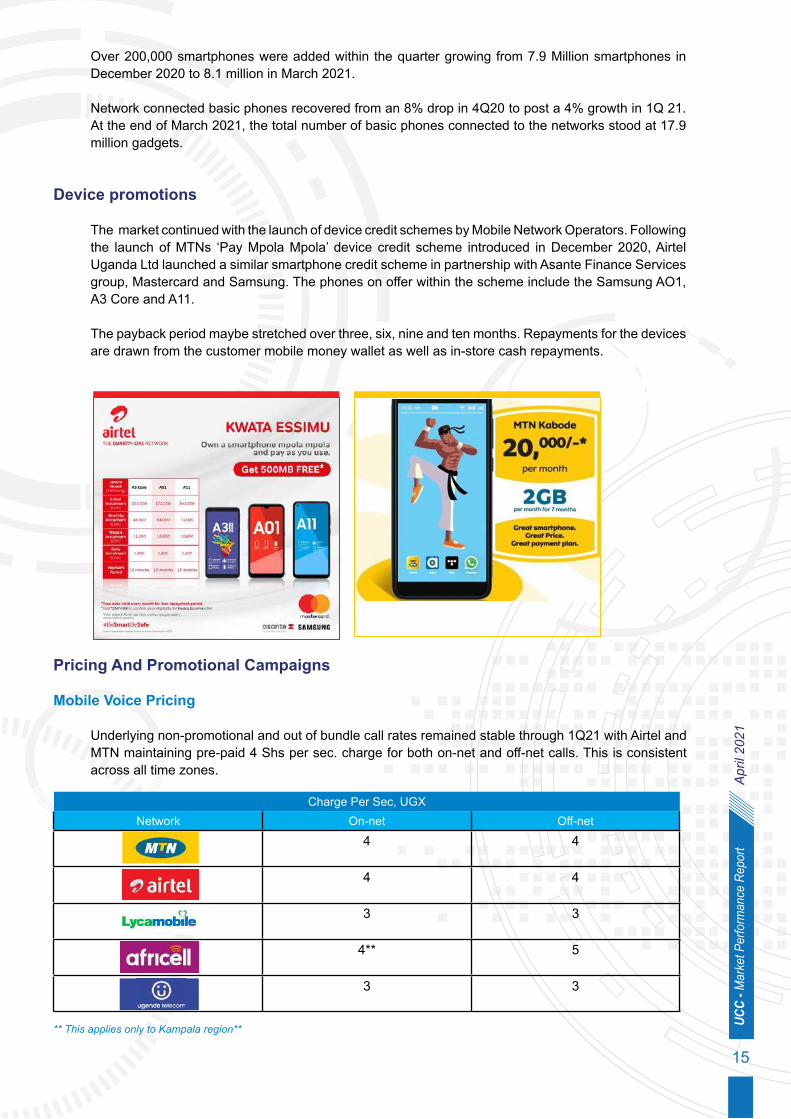
Device promotions
The market continued with the launch of device credit schemes by Mobile Network Operators. Following the launch of MTNs ‘Pay Mpola Mpola’ device credit scheme introduced in December 2020, Airtel Uganda Ltd launched a similar smartphone credit scheme in partnership with Asante Finance Services group, Mastercard and Samsung. The phones on offer within the scheme include the Samsung AO1, A3 Core and A11.
The payback period maybe stretched over three, six, nine and ten months. Repayments for the devices are drawn from the customer mobile money wallet as well as in-store cash repayments.
Pricing And Promotional Campaigns Mobile Voice Pricing
Underlying non-promotional and out of bundle call rates remained stable through 1Q21 with Airtel and MTN maintaining pre-paid 4 Shs per sec. charge for both on-net and off-net calls. This is consistent across all time zones.
Charge Per Sec, UGXNetwork On-net Off-net
4 4
4 4
3 3
4** 5
3 3
** This applies only to Kampala region**

16
Apr
il 20
21UC
C - M
arke
t Per
form
ance
Rep
ort
Mobile Data Pricing
The pricing of retail mobile data services remains bundle-led with all licensees maintaining capacity bundle offers rather than Kb and speed-based billing offers. Prior to March 2021 these had definite validity periods and were supplemented with mid and end week special tariff plans.
The mid and end week special offers are further supplemented with behavioural and usage-based offers by the two leading mobile data providers MTN and Airtel dubbed “My Paka Paka” and “My Pakalast” respectively.
17
Apr
il 20
21UC
C - M
arke
t Per
form
ance
Rep
ort
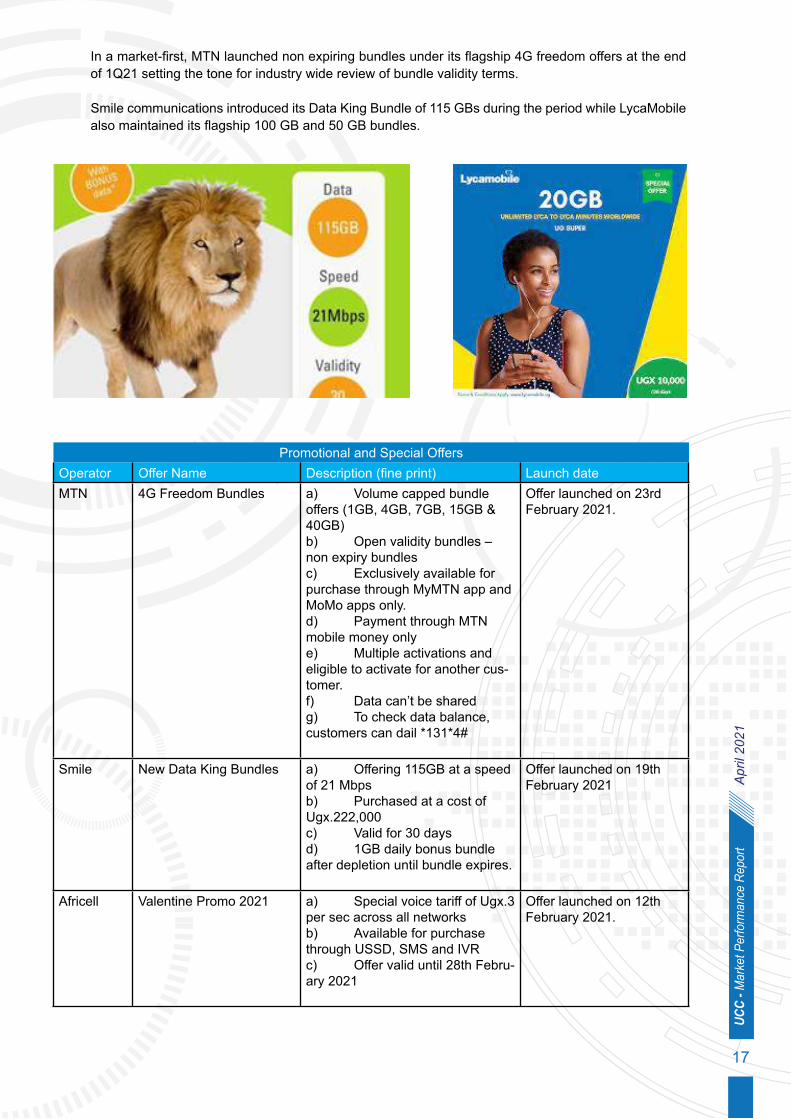
In a market-first, MTN launched non expiring bundles under its flagship 4G freedom offers at the end of 1Q21 setting the tone for industry wide review of bundle validity terms.
Smile communications introduced its Data King Bundle of 115 GBs during the period while LycaMobile also maintained its flagship 100 GB and 50 GB bundles.
Promotional and Special OffersOperator Offer Name Description (fine print) Launch dateMTN 4G Freedom Bundles a) Volume capped bundle
offers (1GB, 4GB, 7GB, 15GB & 40GB)b) Open validity bundles – non expiry bundlesc) Exclusively available for purchase through MyMTN app and MoMo apps only.d) Payment through MTN mobile money onlye) Multiple activations and eligible to activate for another cus-tomer.f) Data can’t be sharedg) To check data balance, customers can dail *131*4#
Offer launched on 23rd February 2021.
Smile New Data King Bundles a) Offering 115GB at a speed of 21 Mbps b) Purchased at a cost of Ugx.222,000c) Valid for 30 days d) 1GB daily bonus bundle after depletion until bundle expires.
Offer launched on 19th February 2021
Africell Valentine Promo 2021 a) Special voice tariff of Ugx.3 per sec across all networksb) Available for purchase through USSD, SMS and IVRc) Offer valid until 28th Febru-ary 2021
Offer launched on 12th February 2021.
18
Apr
il 20
21UC
C - M
arke
t Per
form
ance
Rep
ort
Multichoice DSTV Pearl Magic prime channel
a) Channel accessible on DSTV channel 148b) Exclusively available on DSTV compact, Compact plus and premium packages.
Channel launched on 8th February 2021.
Multichoice Go TV decoder dubbed Tumbiza GoTV
a) Reduction in GoTV de-corder price to Ugx.69,000 from Ugx.89,000.b) Inclusive of full GoTV kit (decoder and antenna)c) One-month subscription of GoTV plus packaged) Offer valid up to 31st March 2021.
Offer launched n 1st Feb-ruary 2021.
Multichoice Go TV decoder offer a) Reduction in GoTV de-corder price to Ugx.39,000 from Ugx.69,000.
Offer launched n 1st March 2021.
StarTimes Decoder Easter Promotion a) Reduction in antenna de-coder price to Ugx.39,000b) Dish decoder at 99,000c) Permits subscribers to pay for 2-month subscription on Nova, Basic and Smart Bouquets and up-graded to the next higher bouquet for two months.d) Customers on Classic and Super Bouquet are offered addi-tional 10 days of access.
Offer launched on 1st March 2021.
The tariff plans in the communications sector varies according to the market segments. Comparative price plans may be accessed at the UCC Accredited Price Comparison website at;
www.Kompare.ug

19
Apr
il 20
21UC
C - M
arke
t Per
form
ance
Rep
ort
Mobile Money Accounts
Following a clean up of MNO mobile money account registers, the number of active mobile money accounts was revised downwards from 22.5 million accounts to 20.3 million accounts at the end of March 2021.
This represents 66% of the 30.5 million registered mobile money accounts by the MNOs. The 66% account registration-activity conversion rate doubles the African average of 30% account activity.
On a year-on-year comparison more than 5 million new accounts were registered between March 2020 and March 2021. This growth was largely fuelled by significant fee waivers, increased merchant acceptance and limited movements at the height of the pandemic.
Agent Network
Agent access points have grown by 8% from 235,790 at the end of December 2020 to 254,930 at the end of March 2021.
Important to note in this space has been the increased agent interoperabili-ty, especially in the CBD. Presently, many mobile money agents have added Bank Agency services to their service portfolio.
Registered Mobile Money Wallets Ac�ve Mobile Money Wallets Ac�vity Ra�o
30,000,000
29,000,000
28,000,000
27,000,000
26,000,000
25,000,000
24,000,000
23,000,000
22,000,000
21,000,000
20,000,000
19,000,000
18,000,000
17,000,000
16,000,000
15,000,000
30,546,414
20,298,604
27,720,859
22,433,554
1Q213Q20 4Q20
28,045,909
22,522,205
66%81% 80%
Mobile Moneyactivity ratios for
Uganda and Africa
Mobile Money Activity Ratio
28% 66%
20
Apr
il 20
21UC
C - M
arke
t Per
form
ance
Rep
ort
Traffic and Usage
21
Apr
il 20
21UC
C - M
arke
t Per
form
ance
Rep
ort
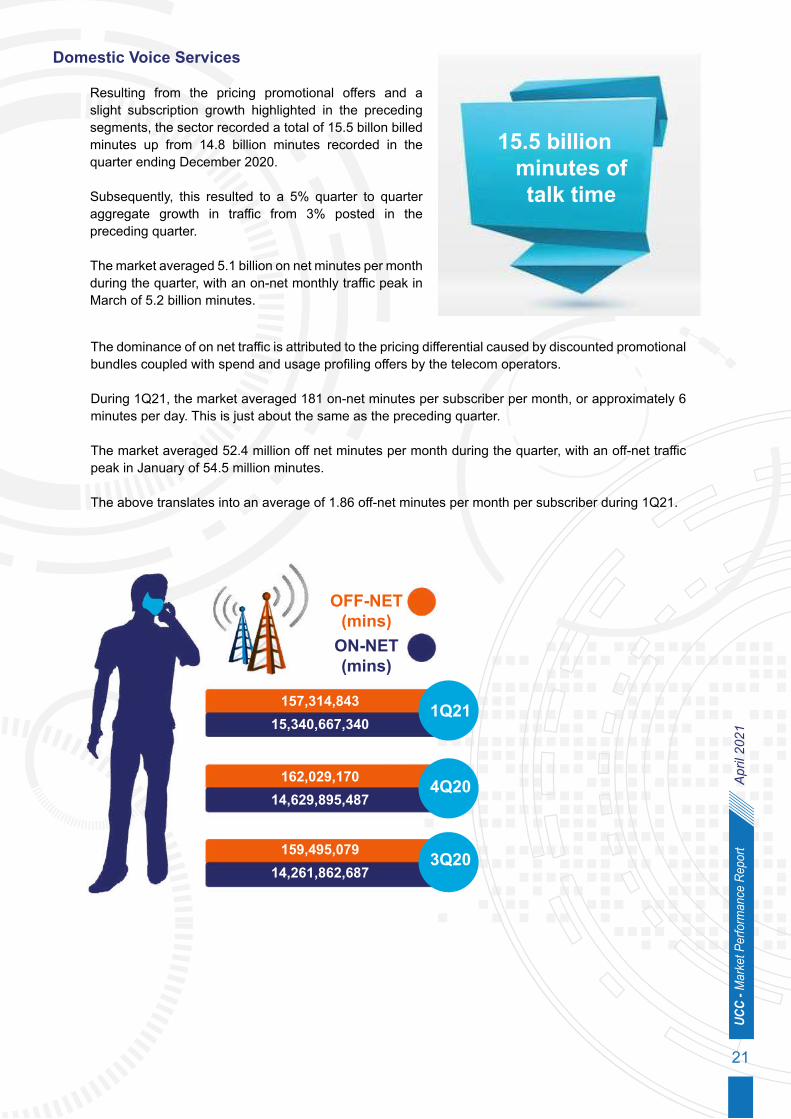
The dominance of on net traffic is attributed to the pricing differential caused by discounted promotional bundles coupled with spend and usage profiling offers by the telecom operators.
During 1Q21, the market averaged 181 on-net minutes per subscriber per month, or approximately 6 minutes per day. This is just about the same as the preceding quarter.
The market averaged 52.4 million off net minutes per month during the quarter, with an off-net traffic peak in January of 54.5 million minutes.
The above translates into an average of 1.86 off-net minutes per month per subscriber during 1Q21.
Domestic Voice Services
Resulting from the pricing promotional offers and a slight subscription growth highlighted in the preceding segments, the sector recorded a total of 15.5 billon billed minutes up from 14.8 billion minutes recorded in the quarter ending December 2020.
Subsequently, this resulted to a 5% quarter to quarter aggregate growth in traffic from 3% posted in the preceding quarter.
The market averaged 5.1 billion on net minutes per month during the quarter, with an on-net monthly traffic peak in March of 5.2 billion minutes.
15.5 billion minutes of talk time
OFF-NET(mins)
ON-NET(mins)
157,314,843
162,029,170
159,495,079
15,340,667,340
14,629,895,487
14,261,862,687
1Q21
4Q20
3Q20

22
Apr
il 20
21UC
C - M
arke
t Per
form
ance
Rep
ort
Broadband Traffic
Broadband usage and consumption during 1Q21 was largely driven by political campaign messagingand work from home demand. During 1Q21, a total of 58 Billion MBs were downloaded in Uganda.While this is an 18% drop from the record downloads of 4Q20, it represents an almost 20% growthbetween 1Q20 and 1Q21.
International Voice Traffic
Total international outgoing traffic posted a strong recovery with 49.6 million minutes in 1Q21, a 19% rise from 41.6 million minutes in 4Q20.
This positive gain is largely attributed to the ‘scientific’ elections during the quarter, which shifted customers into traditional voice services. There was a 45% rise in traffic terminating to ONA states and a 30% rise in traffic terminating to other countries during the period. This again provides strong evidence for the impact of OTTs on traditional voice and SMS segments.
As observed in previous quarters, Northern Corridor partner states remain the top destination for international calls with over 70% share of total international traffic.
1Q20 49,005,577,421 MBs
1Q21 58,399,527,311 MBs
4Q20 41,697,996
1Q21 49,610,441
International Outbound (Mins)

23
Apr
il 20
21UC
C - M
arke
t Per
form
ance
Rep
ort
Unstructured Supplementary Service Data (USSD)
USSD sessions have been growing at an average of 10% between 1Q20 and 1Q21. 1Q21 posted 7.6 Billion USSD sessions in comparison to the 5.3 Billion USSD sessions posted in 1Q20. The total number of sessions averaged 2.5 billion per month during the quarter. The quarterly peak was realised in March 2021 with a total of 2.7 billion USSD sessions.The growth observed in mobile financial services is positively correlated to the increase in USSD sessions. This is exhibited by an extra 2.2 billion sessions in comparison to 1Q20.
1Q217,6B 1Q20
5,4B
*000#*000#
Roaming Service
1Q21 saw a 10% increase in the total number of inbound roamers (Foreigners roaming on Ugandan networks) compared to 1Q20. At the end of March 2021, the number of inbound roamers was at 919,382 compared to 838,920 in 1Q20. Of these, 66% are from ONA countries.
Similarly, the number of outbound roamers (Ugandans roaming in Foreign Networks) stood at 771,905, which is indicative of an 11% increase compared to 1Q20.
Ugandansroaming in
Foreign Networkswere 771,905
24
Apr
il 20
21UC
C - M
arke
t Per
form
ance
Rep
ort
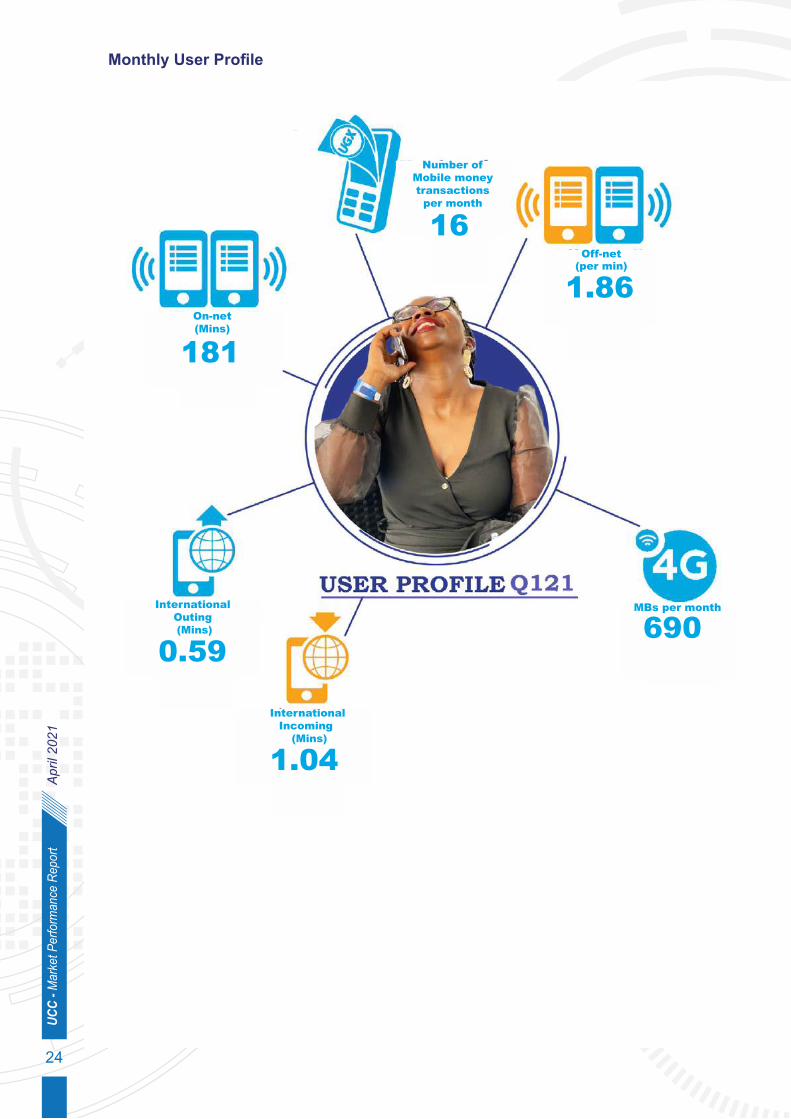
NUMBER OF MOBILE MONEY TRABSACTION PER MONTH
Number of Mobile money transactions
per month
16Off-net
(per min)
1.86
InternationalIncoming
(Mins)
1.04
InternationalOuting (Mins)
0.59
On-net (Mins)
181
MBs per month
690

25
Apr
il 20
21UC
C - M
arke
t Per
form
ance
Rep
ort
Industry Revenues
26
Apr
il 20
21UC
C - M
arke
t Per
form
ance
Rep
ort
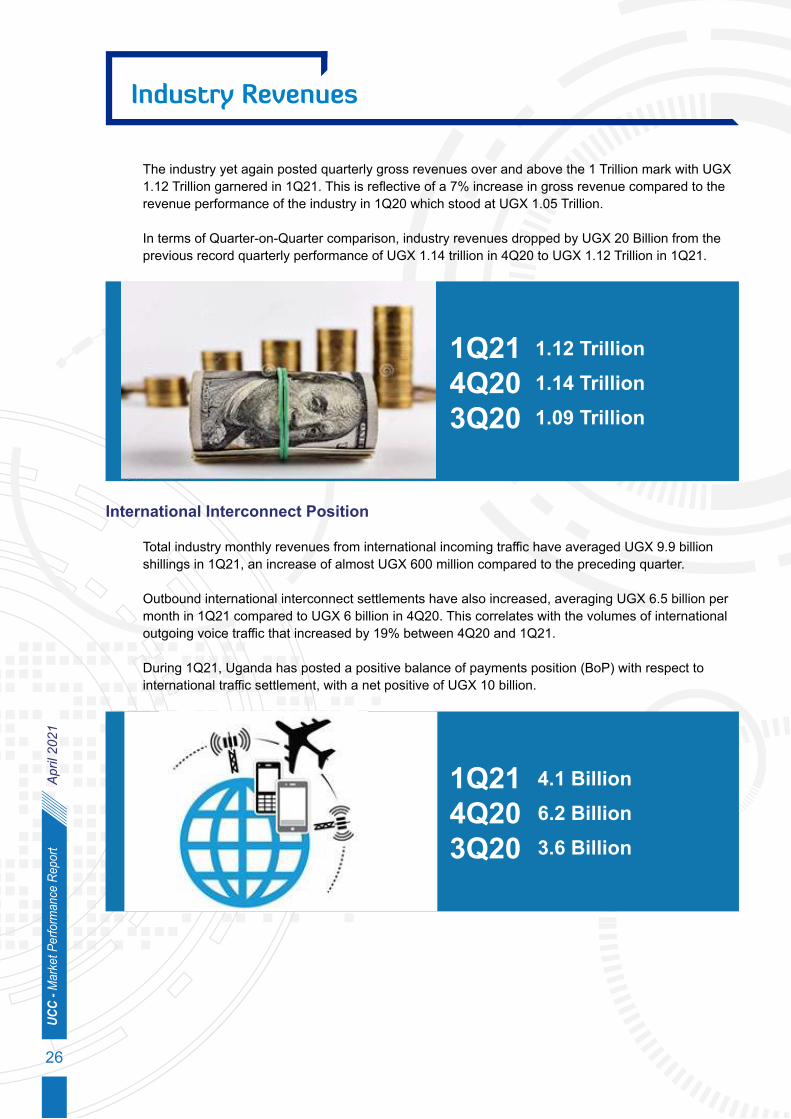
International Interconnect Position
Total industry monthly revenues from international incoming traffic have averaged UGX 9.9 billionshillings in 1Q21, an increase of almost UGX 600 million compared to the preceding quarter.
Outbound international interconnect settlements have also increased, averaging UGX 6.5 billion permonth in 1Q21 compared to UGX 6 billion in 4Q20. This correlates with the volumes of internationaloutgoing voice traffic that increased by 19% between 4Q20 and 1Q21.
During 1Q21, Uganda has posted a positive balance of payments position (BoP) with respect tointernational traffic settlement, with a net positive of UGX 10 billion.
The industry yet again posted quarterly gross revenues over and above the 1 Trillion mark with UGX1.12 Trillion garnered in 1Q21. This is reflective of a 7% increase in gross revenue compared to therevenue performance of the industry in 1Q20 which stood at UGX 1.05 Trillion.
In terms of Quarter-on-Quarter comparison, industry revenues dropped by UGX 20 Billion from theprevious record quarterly performance of UGX 1.14 trillion in 4Q20 to UGX 1.12 Trillion in 1Q21.
1Q214Q203Q20
1Q214Q203Q20
1.12 Trillion 1.14 Trillion 1.09 Trillion
4.1 Billion 6.2 Billion 3.6 Billion
Industry Revenues

27
Apr
il 20
21UC
C - M
arke
t Per
form
ance
Rep
ort
Industry Revenues
Post And Courier Services

28
Apr
il 20
21UC
C - M
arke
t Per
form
ance
Rep
ort
The first quarter results of the aforementioned operators only infer that the adoption of the latest mobile technologies is playing a big role in the growth of e-commerce, with local and foreign businesses adapting to new business models to stay aoat.
This has created new opportunities for posts and courier encouraging them to evolve services and business models to adapt to new possibilities. As a result, the post and courier sector in Uganda has evolved to a tune of 33 licensees as of March 2021. Over 60% of these operators are Domestic license holders.
These operators use several pickup/drop off centres for the delivery and processing of mail. In the quarter under review, the total number of pickup/drop off centres increased from 483 in 4Q20 to 571 in 1Q21.
Order Fulfilment And The Courier Space
Restricted travel movements amidst the slow resumption of business across the world have continued to provide growth opportunities in the order fullment unit of the post and courier industry.
In 1Q21 a number of last mile order fullment providers like Aramex, Fedex, UPS (Freight in Time) and DHL posted record revenues on account of in country last mile delivery services. DHL in particular recorded a quarterly turnover of Eur 18,860 Million compared to Eur. 15,464 Million realised in 1Q20.
Pan African Operator Jumia on the other hand posted Eur. 20.2 million in 1Q21 compared to Eur. 19.1 Million realised in 1Q20..
License Category Domestic InternationalRegional Inter-City Diplomatic Post Office (DPO) National Operator
Number 20 54211
29
Apr
il 20
21UC
C - M
arke
t Per
form
ance
Rep
ort
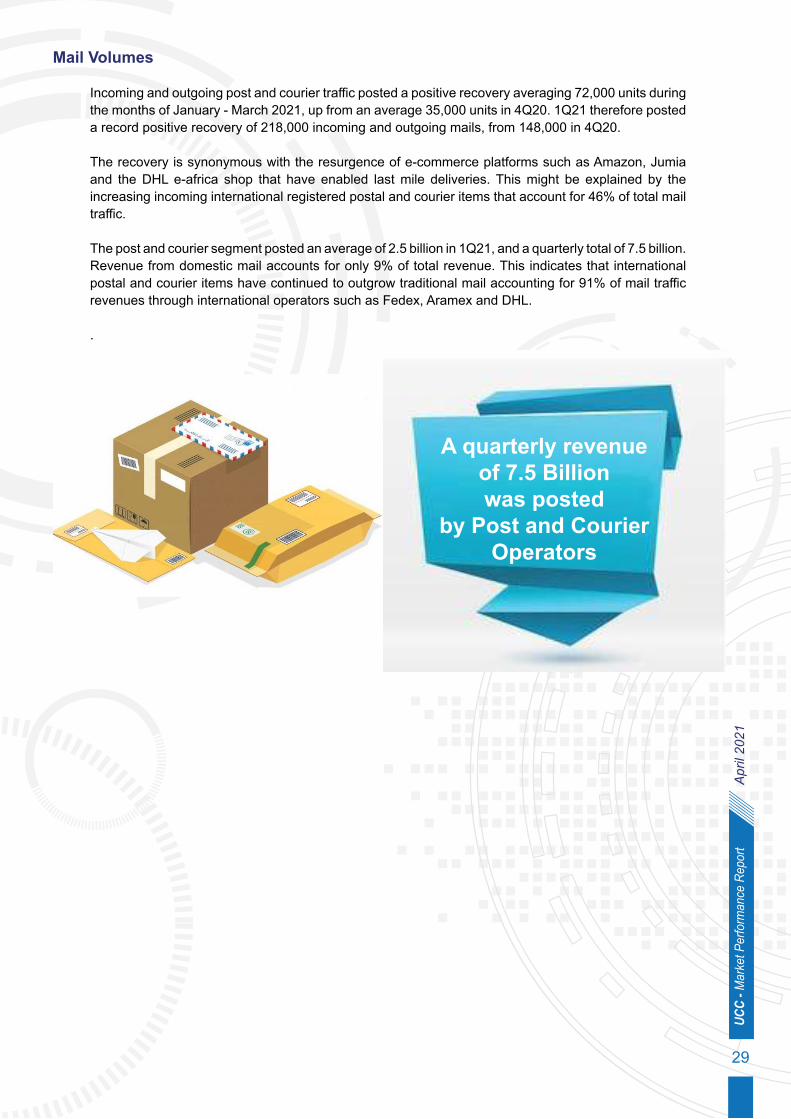
Mail Volumes
Incoming and outgoing post and courier traffic posted a positive recovery averaging 72,000 units during the months of January - March 2021, up from an average 35,000 units in 4Q20. 1Q21 therefore posted a record positive recovery of 218,000 incoming and outgoing mails, from 148,000 in 4Q20.
The recovery is synonymous with the resurgence of e-commerce platforms such as Amazon, Jumia and the DHL e-africa shop that have enabled last mile deliveries. This might be explained by the increasing incoming international registered postal and courier items that account for 46% of total mail traffic.
The post and courier segment posted an average of 2.5 billion in 1Q21, and a quarterly total of 7.5 billion. Revenue from domestic mail accounts for only 9% of total revenue. This indicates that international postal and courier items have continued to outgrow traditional mail accounting for 91% of mail traffic revenues through international operators such as Fedex, Aramex and DHL.
.
A quarterly revenueof 7.5 Billionwas posted
by Post and CourierOperators
Number 20 54211

30
Apr
il 20
21UC
C - M
arke
t Per
form
ance
Rep
ort