Embed Size (px)
Citation preview
2/20/2015
GG AMD!
Kenney Chiu, Aaron Foster, and Tarriq Handrajh SILICON VALLEY SHORTS
Kerrisdale Capital Investment Case Study

1
Interacting with someone on a tablet in real-time gives people the power to capture the brilliance
of synchronous communication and self-expression unlike any other technology offered in the
world. This raw computing power, which houses the most sophisticated central processing units,
allows us to express ourselves through innovation and creativity. From the first transistor
invented in 1948 to modern day speeds of multi-core processing technology, this technology
gives the power to revolutionize the way we communicate, create unique interactions, and power
global productivity. In the heart of the Silicon Valley, Advanced Micro Devices (AMD) is the
forefront of this power to reach faster processing speeds at our fingertips. They supply
microprocessor and graphic semiconductors that are used in computers and related products. As
with AMD’s current CEO, Lisa Su, it’s all about developing technology and delivering
something that could not have been done before. And upon being appointed as the new CEO in
October, 2014, AMD continues to develop their near-term vision and strategy within their strong
points of delivering affordable products and innovations through processing technologies.
However, we believe that AMD will go bankrupt within the next five years based on AMD’s
semiconductor competitive landscape, company z-score, and lack of innovative leadership.
Owing to this recent leadership change, however, AMD is continually falling short of
technological innovation which is evident in their bottom-line. With sales decreasing as much as
3% year over year, the company’s near-term vision takes into account of their lagging
technologies with no room to gain market share. And with a declining personal computer market
in conjunction with the declining demand of supplying components to modern gaming systems,
the company still believes in beating the market with their overarching strategy to out-play their

2
semiconductor competitor Intel Corporation. This causes AMD to lose their competitiveness by
trying to match the quality of its competitor while having conflicting strategies to be a cost-
leader and product differentiator. However, in contrary, AMD is being beat at their own game of
innovation while striving to achieve a market advantage. This is making it more difficult for
AMD because revenues has been declining faster than costs to produce and deliver their
products. Not to mention their heavily levered debt balance, it’s like watching a start-up trying to
compete with a multinational conglomerate. The comparison between these two similar
companies causes an unrealistic view that is working against AMD year over year.
Over the past decade, AMD has failed to enter into one of the fastest growing segments in
today’s technology. Their lack of presence in the smartphone market gave other competitors like
Intel Corporation to take advantage of this market opportunity. With more than 283 million
android, 33 million iPhone, 8 million windows, and 1 million BlackBerry units’ ships worldwide
in Q3 2014, AMD has little to no presence to gain market share. To be quite blunt, AMD is
missing out in one of the fastest growing segments in technology. Meanwhile, the company’s
competitors have geared up to meet the rising demand for semiconductors in the smartphone
market. The tablet and smartphone markets are PC-adjacent markets and the appeal gained in
one has been used to effectively penetrate into the other market. While AMD’s competitors have
been taking advantage of the situation, the company has not yet entered the smartphone market.
Smartphones and tablets have been gaining computing power in the market and is gaining wide
Competitive Landscape

3
appeal. Amid such environment, lack of presence in the smartphone market is a competitive
disadvantage for AMD and will kill their global brand.
An important concerning topic about AMD is their very small niche market within the
semiconductor industry. It’s like comparing the size of Earth to the whole universe. AMD’s top
five customers accounted approximately for 54% of its net revenue in FY2013. On a more
descriptive basis, five customers accounted for approximately 58% of the net revenues of the
company’s computing solutions segment and five customers accounted for 70% of the net
revenue of it graphics segments. In addition, Hewlett-Packard accounts for more than 10% of
AMD’s consolidated net revenues. In addition, if that didn’t surprise any investors enough, AMD
expects to continue on a relatively small number of customers for a significant portion of its sales
in the coming years. Hence, AMD’s ability to maintain strong relationships with its current
customers and maintain current market share will play a major role in its future success.
However, this will unlikely happen since the historical cash flows indicate otherwise.
Another main point to address is their decline in the company’s topline growth. The personal
computer market has been declining over the past few years, with the increasing usage of tablets
and smartphones. The declining trend is expected to decline from 314.2 million units in 2013 to
305.1 million units in 2017, representing a change of 1% form now to 2020. During this same
period, the shipments in the mature markets are expected to decline at 2%. Though these
emerging markets are expected to grow from 182.1 million shipment units in 2014 to 183.3
shipment units in 2017, this increase would not offset the overall decline in the PC shipments.

4
Pulling it all together, this decline in the personal computer market would lead to a decline in the
demand for microprocessors, embedded processors and chipsets designed, developed and
manufactured for the personal computer market. AMD depends on personal computers for a
significant portion of its revenues. Thus, it will affect the demand for the company’s products
and negatively impact the financial position of the company.
Within the competitive landscape sits two main competitors. Intel Corporation dominates the
microprocessor market by their market share, margins, and significant market resources.
Whereas NVidia Corporation holds a competitive advantage in the video processing industry by
implementing cutting-edge technologies, integrated graphic chips, and market superiority. These
two competitors combined, however, supply significant financial capital to target AMD’s
customers and its segments with special incentives. In addition, this aggressive behaviors have
impacted future results in AMD’s ability to lower unit sales and profit margins for AMD’s
products which has adversely impacted its business operations. As a result, the competitive
positioning in these industry leaders has been able to set the industry standard for quality and
performance between customers and business associates.
Despite market trends towards specialization, AMD is looking in the wrong place to expand and
grow within the graphics and semiconductor industry. From the overwhelming financial
marketing advantages by NVidia and Intel to the matured market atmosphere, the chipmaker
should look to their leadership as a way for future innovations. Current CEO, Lisa Su, isn’t
making any progress to establish any sort of expertise in her willingness to guide the company.

5
For example, their 19% decline of sales from 2011 to 2013 increases their likelihood of further
themselves into solvency.
Developed by Professor Edward Altman of NYU, a company’s z-score is a weighted average of
five financial ratios, and is a key indicator of corporate financial health. The 5 financial ratios
that are considered in the z-score model include: Working Capital to Total Assets, Retained
Earnings to Total Assets, Earnings before Interest and Tax to Total Assets (EBIT), Market
Capitalization to Total Liabilities and finally Revenue to Total Assets.
As AMD operates in two different segments of the processor industry and competes with Intel
and NVidia, the leaders in the CPU and GPU segments of the market respectively, a comparison
of their component ratios of the z-score becomes necessary. As each component of the z-score is
explained for AMD it will be compared to the corresponding component for Intel and NVidia in
order to set a benchmark, against which we can measure AMD.
The Working Capital to Total Assets ratio reveals to investors the level of corporate distress. If a
firm has a negative or low Working Capital to Total Assets ratio it will have difficulty meeting
its short-term obligations due to an insufficient level of Current Assets. Working Capital is
defined as Current Assets minus Current Liabilities. In the case of AMD we find that their
Working Capital to Total Asset ratio is .3440 for the 2014 fiscal year. During the same time
Altman’s Z-Score

6
period Intel and NVidia’s Working Capital to Total Asset ratios are .1273 and .6689
respectively.
By calculating the Retained Earnings to Total Assets ratio, a better understanding of the firm’s
degree of leverage can be obtained. Firms that use leverage instead of retained earnings to
finance capital expenditures will have a low Retained Earnings to Total Assets ratio. The lower a
firms Retained Earnings to Total Assets ratio the less likely it will be able to withstand a period
of losses. Assessing AMD’s Retained Earnings to Total Asset ratio, which is -1.76 for the 2014
fiscal year, it becomes clear that AMD is using an extremely high level of debt to finance its
operations and new projects. Intel and NVidia have far superior Retained Earnings to Total
Assets ratios of .0797 and .0549 respectively.
EBIT to Total Assets is the third of the five financial ratios that comprise Altman’s z-score. This
ratio sheds light on a firm’s ability to derive profit from its assets before accounting for tax and
interest. During the fiscal year of 2014, AMD’s EBIT to Total Asset ratio was a paltry -.0411,
which underscores AMD’s inability to convert investments into operating income. With EBIT to
Total Asset ratios of .1668 and .1054 respectively Intel and NVidia once again outperform AMD
which is struggling just to maintain a positive level of operating income.
The Market Capitalization to Total Liabilities ratio reflects the amount that a firm’s market value
would decrease before liabilities exceed assets on the balance sheet. This duration of Market
Capitalization can be seen as the markets confidence, or lack thereof in a firms financial
situation. For the fiscal year ending 2014 AMD’s Market Capitalization to Total Liabilities was

7
.6703, which reflects investor’s bearish outlook on the stock. By contrast Intel and NVidia have
Market Capitalization to Total Liabilities ratio is 4.48 and 4.34 respectively, making clear
investors preference and significantly stronger confidence in both Intel and NVidia.
Finally the Revenue to Total Assets ratio informs investors as to how well a firm’s management
team is managing its assets and how efficient it is using those assets to generate sales and grow
its market share. A firm that is unable to increase market share or generate sales will produce a
low or declining Revenue to Total Asset ratio. AMD’s Revenue to Total Assets for the 2014
fiscal year was 1.46. Intel’s Revenue to Total Assets was .6075 over the same period, while
NVidia maintained a Revenue to Total Assets ratio of .6501.
On the z-score scale, any score of 2.99 and above is considered safe. In between the range from
1.81 to 2.99 is labeled a grey area where a firm is not in immediate danger of insolvency, but is
heading in that direction. Any score below a 1.81 means that a firm is in distress and has high
chance of going bankrupt in the near future. After calculating the five necessary ratios and
applying the correct weightings to each ratio, AMD received a z-score of -.3290, indicating that
AMD is current deeply distressed and further signaling that insolvency is all but inevitable.
Intel’s z-score was 4.11 and NVidia received a score of 5.17.
Additionally AMD has about one billion dollars in cash, and with a negative free cash flow of
$400 million and an annual interest expense of $175 million, AMD will exhaust its cash reserves
in a relatively short time.

8
With major turnover of leadership throughout many years, AMD’s current CEO has little to no
experience in comparison to other top chief executive officer management roles. Lisa’s Su’s
overall strategy is to move into a wide variety of applications in devices, such as PCs, cars, and
gaming consoles. The only specific products that Ms. Su discusses in her interview with Fortune
500 magazine is the iMac 5K display and gaming consoles. However she fails to mention their
major role within the micro-processing industry. Just as important as the future, it’s also
interesting to note the company’s confidence level within this highly competitive market. With a
strategic vision to “focus on entirely new markets and competitive spaces,” they have done
nothing to change their ongoing battles with NVidia and Intel. The company is unable to capture
their niche market by providing APU units to be more “energy efficient” and cost effective.
Instead, people resort to Intel Corporation because their products outpace the performance
standards for customers and businesses alike.
The gaming console segment may make it appear as though AMD is able to lock down two
stable customers such as Microsoft Xbox One and Sony PlayStation 4. In contrary, however,
AMD’s hopes are that both console manufacturers will consistently order AMD’s processors.
But the reality of the matter is that gaming is moving towards mobile devices, where Apple and
Samsung are currently dominating the mobile device market. There is no opportunity for AMD
to take market share in the mobile devices market with Samsung manufacturing their own
processors. And with Apple designed their own processors, such as the A4 chip that is
manufactured by Samsung, it becomes an unrealistic market for AMD to enter. With AMD
Lacking Leadership

9
unaware of the fact that this market is dominated by other larger competitors, they are unwilling
to realize their niche market within the gaming industry.
Aside from the strategic decisions with product segmentation and market share, the company
also struggles to retain internal unity. With an approval rating of 63% for Lisa Su according to
glassdoor.com, employees of the company are often unpleased with the corporate culture.
Company layoffs, frequent upper-management turnover, resource constraints, and revolving
strategic plans are just a few of the struggles employees are facing in the company. Likewise, the
company itself is just as confused as the public whenever the company announces their
disappointing balance sheets every quarter. Coupled with a corporate problem and leadership
dependability, no wonder shareholders are constantly looking at other options for the future.
With an engineering background and leadership experience in IBM and Freescale
Semiconductor, Lisa Su is the current AMD CEO trying to turnaround a declining company.
However, our research shows that, in contrary, the turnaround may be too much to muscle down.
With our research on the current market conditions, financial analysis through the z-score
approach, and strategic initiatives by top-level management, we believe that this company will
go bankrupt within the next 5 years. Additionally, looking at the company from the 10-k’s,
interviews, press conferences, and news headlines allows us to realize that the company has
unsolved issues that have plagued the country for many years following the technology boom.
Things like employee turnover, negative z-scores, mediocre products, and poor niche market
Conclusion

10
penetration lead us to conclude that the game AMD is in is about to end for them as they are
running out of lives to continue. Good game Advanced Micro Devices (GG AMD)!

11
Advanced Micro Devices Incorporated. Fiscal Year-End Annual Report. 10-k . Delaware:
Securites Exchange Commission, 2012-2014. Document.
Altman, Edward I. Predicting Financial Distress of Companies: Revisiting the Z-Score and Zeta
Models. n.d. PDF. 9 February 2015.
BloomBerg. Advanced Micro Devices Company Snapshot. n.d. Website. 20 February 2015.
FactSet. 20 February 2015.
Glassdoor. AMD Reviews. n.d. Website. 19 February 2014.
GuruFocus. A Bankrupty analysis of AMD, Groupon, and RadioShack. 27 May 2014. Website.
19 February 2015.
IDC Corporate USA. Smartphone OS Market Share, Q3 2014. n.d. Website. 17 February 2014.
Intel Corporation. Fiscal Year-End Annual Report. 10-k. Delaware: Securities and Exchange
Commission, 2012-2014. Document.
Knight, Sean D. AMD President and CEO Rory Read Steps Down, Dr. Lisa Su Replaces Him. 8
October 2014. Website. 19 February 2015.
Lev-Ram, Michael. Exclusive: Fortune 500's newest woman CEO talks about her first 90 days
on the job. 8 January 2015. Website. 19 February 2015 .
MarketLine. "Company Profile: Advanced Micro Devices, Inc." 2014. PDF.
Nvidia Corporation. Fiscal Year-End Annual Report. 10-k. Delware: Securites and Exchange
Commission, 2012-2014. Document.
References

12
Owano, Nancy. AMD reveals plans for 25x efficiency gains by 2020 . 1 January 2014. Website.
17 February 2014.
13
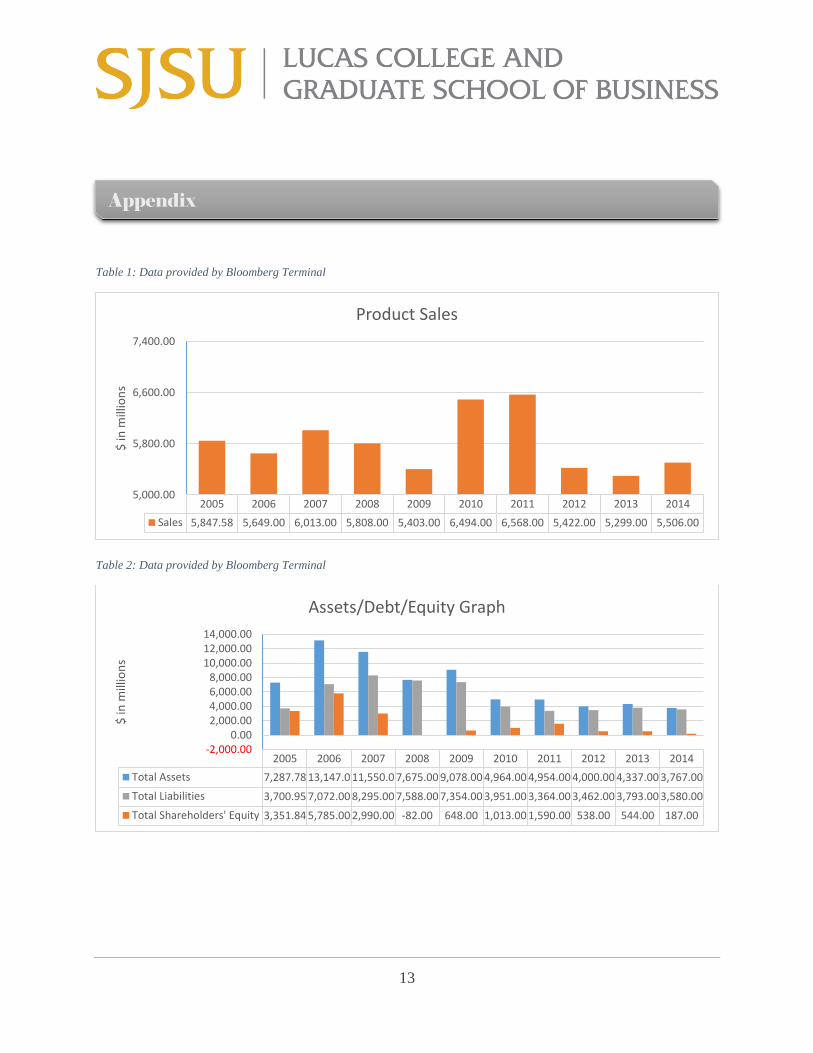
Table 1: Data provided by Bloomberg Terminal
Table 2: Data provided by Bloomberg Terminal
2005 2006 2007 2008 2009 2010 2011 2012 2013 2014
Sales 5,847.58 5,649.00 6,013.00 5,808.00 5,403.00 6,494.00 6,568.00 5,422.00 5,299.00 5,506.00
5,000.00
5,800.00
6,600.00
7,400.00
$ in
mill
ion
s
Product Sales
2005 2006 2007 2008 2009 2010 2011 2012 2013 2014
Total Assets 7,287.78 13,147.0 11,550.0 7,675.00 9,078.00 4,964.00 4,954.00 4,000.00 4,337.00 3,767.00
Total Liabilities 3,700.95 7,072.00 8,295.00 7,588.00 7,354.00 3,951.00 3,364.00 3,462.00 3,793.00 3,580.00
Total Shareholders' Equity 3,351.84 5,785.00 2,990.00 -82.00 648.00 1,013.00 1,590.00 538.00 544.00 187.00
-2,000.000.00
2,000.004,000.006,000.008,000.00
10,000.0012,000.0014,000.00
$ in
mill
ion
s
Assets/Debt/Equity Graph
Appendix

14
Table 3: Data provided by Advanced Micro Devices Annual 10-k
Table 4: Data provided by Bloomberg Terminal
Z-Score
2014 AMD -0.329036932
2014 INTC 4.115956357
2014 NVDA 5.178352644
-1
0
1
2
3
4
5
6
Z-Sc
ore
Altman's Z-Score
Profit Margin Asset Turnover Leverage Return on Equity
2011 -2.69% 1.3258 3.1157 -11.13%
2012 -21.82% 1.3555 7.4349 -219.89%
2013 -1.57% 1.2218 7.9724 -15.26%
-400.00%-200.00%
0.00%200.00%400.00%600.00%800.00%
1000.00%
Per
cen
tage
-/+
DuPont Analysis

15
Table 5: Data provided by Bloomberg Terminal
2005 2006 2007 2008 2009 2010 2011 2012 2013 2014
Free Cash Flow -30.32 -570.00 -1,995.0 -1,316.0 7.00 -560.00 132.00 -471.00 -232.00 -193.00
-2,400.00
-1,600.00
-800.00
0.00
800.00
$ in
mill
ion
s
Free Cash Flow