Embed Size (px)
Citation preview
1 Simultaneous Determination of 32 Antibiotics and 12 Pesticides in Sediment Using Ultrasonic-assisted Extraction and High
2 Performance Liquid Chromatography-tandem Mass Spectrometry
3
4 Meng Chen*, Qitong Yi, Jiajun Hong, Lemeng Zhang, Kunde Lin, Dongxing Yuan
5
6 College of the Environment and Ecology, Xiamen University, Xiamen, 361102, China
7
8 *Corresponding author: Meng Chen; Tel.: +86-592-2183127; E-mail: [email protected]
9
10
11 Supplementary data
12
13
14
15 Table S1: The physicochemical properties of the selected chemicals.
16 Table S2: Optimization results of SPE clean-up.
17 Table S3: Matrix effects and comparison of two quantification methods.
18 Figure S1: MRM chromatogram of target compounds and surrogates spiked in sediment extracts.
19
Electronic Supplementary Material (ESI) for Analytical Methods.This journal is © The Royal Society of Chemistry 2015
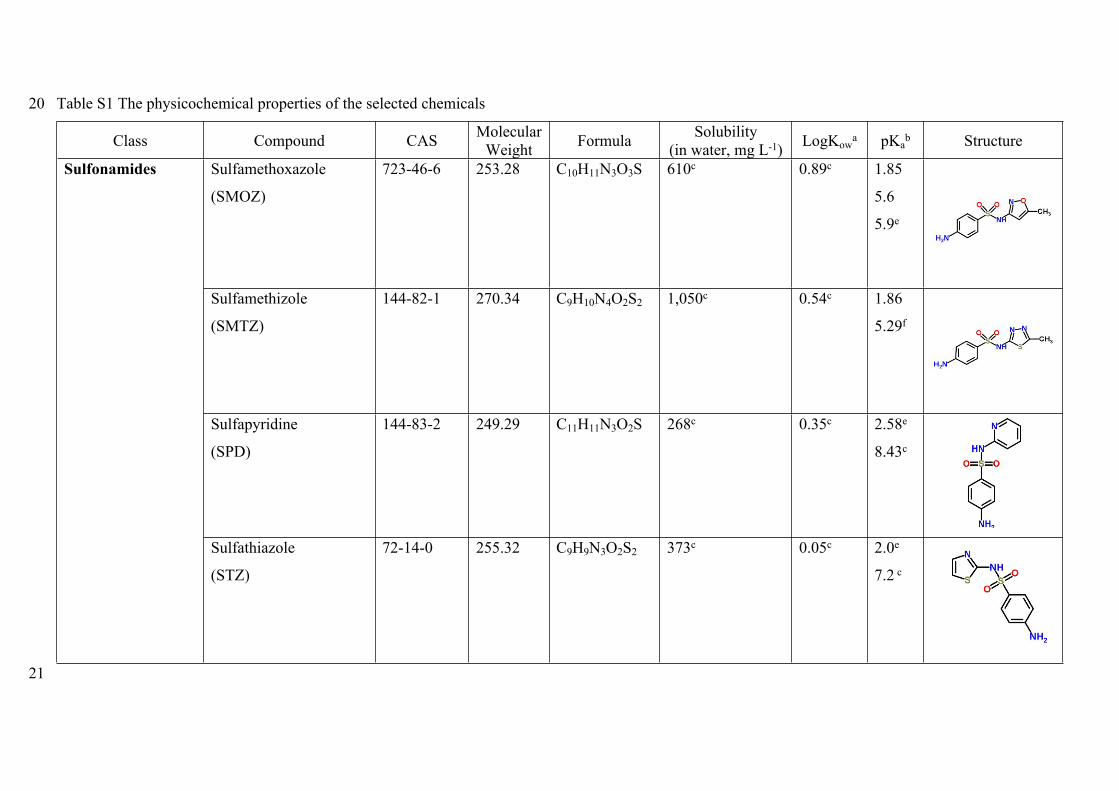
20 Table S1 The physicochemical properties of the selected chemicals
Class Compound CAS MolecularWeight Formula Solubility
(in water, mg L-1) LogKowa pKa
b Structure
Sulfamethoxazole
(SMOZ)
723-46-6 253.28 C10H11N3O3S 610c 0.89c 1.85
5.6
5.9e
Sulfamethizole
(SMTZ)
144-82-1 270.34 C9H10N4O2S2 1,050c 0.54c 1.86
5.29f
Sulfapyridine
(SPD)
144-83-2 249.29 C11H11N3O2S 268c 0.35c 2.58e
8.43c
Sulfonamides
Sulfathiazole
(STZ)
72-14-0 255.32 C9H9N3O2S2 373c 0.05c 2.0e
7.2 c
21
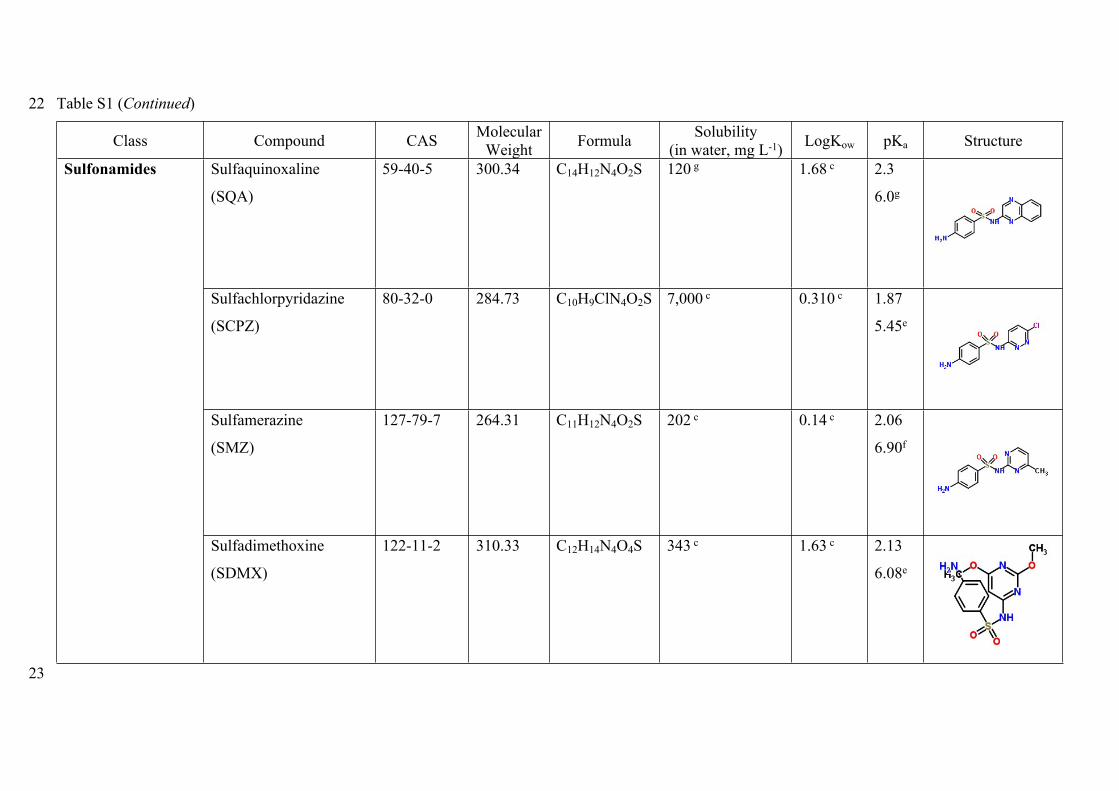
22 Table S1 (Continued)
Class Compound CAS MolecularWeight Formula Solubility
(in water, mg L-1) LogKow pKa Structure
Sulfaquinoxaline
(SQA)
59-40-5 300.34 C14H12N4O2S 120 g 1.68 c 2.3
6.0g
Sulfachlorpyridazine
(SCPZ)
80-32-0 284.73 C10H9ClN4O2S 7,000 c 0.310 c 1.87
5.45e
Sulfamerazine
(SMZ)
127-79-7 264.31 C11H12N4O2S 202 c 0.14 c 2.06
6.90f
Sulfonamides
Sulfadimethoxine
(SDMX)
122-11-2 310.33 C12H14N4O4S 343 c 1.63 c 2.13
6.08e
23
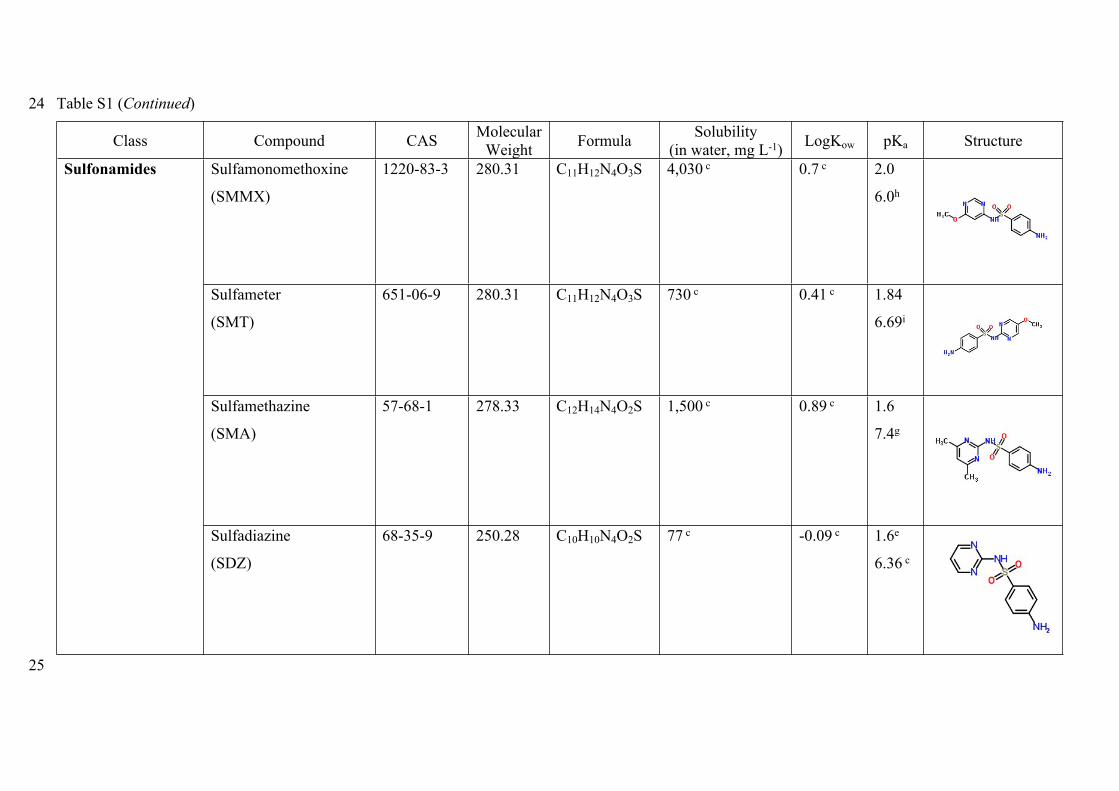
24 Table S1 (Continued)
Class Compound CAS MolecularWeight Formula Solubility
(in water, mg L-1) LogKow pKa Structure
Sulfamonomethoxine
(SMMX)
1220-83-3 280.31 C11H12N4O3S 4,030 c 0.7 c 2.0
6.0h
Sulfameter
(SMT)
651-06-9 280.31 C11H12N4O3S 730 c 0.41 c 1.84
6.69i
Sulfamethazine
(SMA)
57-68-1 278.33 C12H14N4O2S 1,500 c 0.89 c 1.6
7.4g
Sulfonamides
Sulfadiazine
(SDZ)
68-35-9 250.28 C10H10N4O2S 77 c -0.09 c 1.6e
6.36 c
25
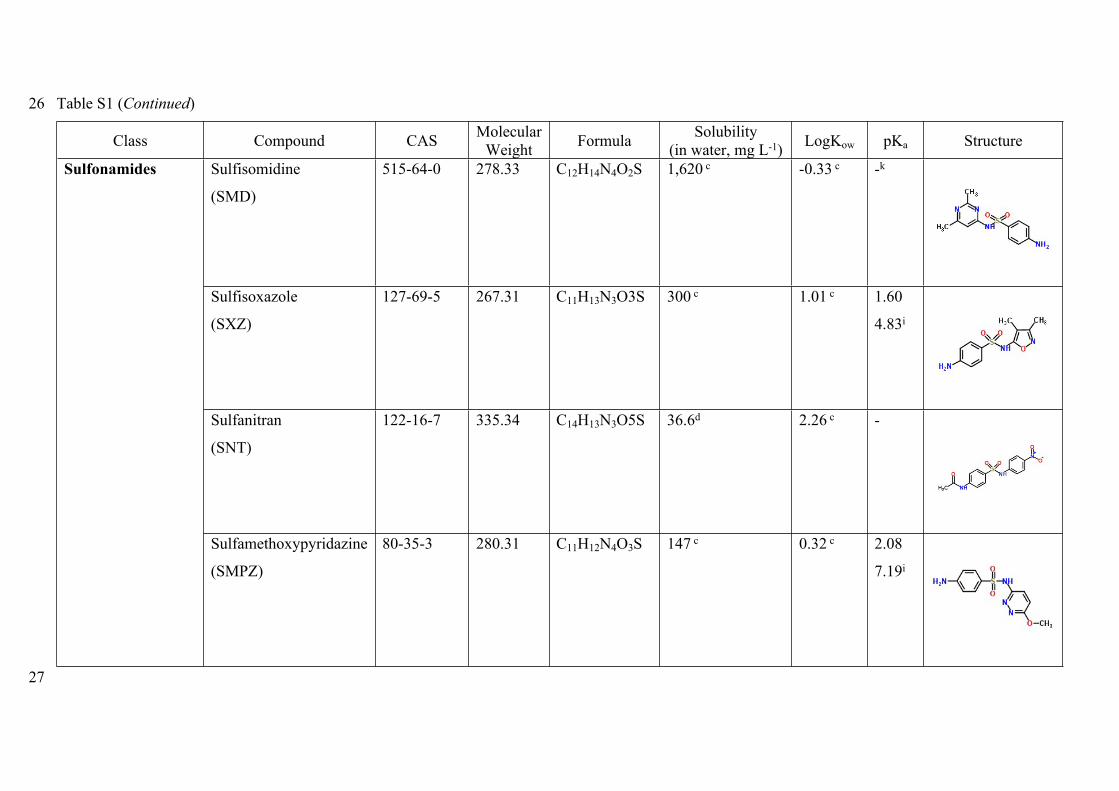
26 Table S1 (Continued)
Class Compound CAS MolecularWeight Formula Solubility
(in water, mg L-1) LogKow pKa Structure
Sulfisomidine
(SMD)
515-64-0 278.33 C12H14N4O2S 1,620 c -0.33 c -k
Sulfisoxazole
(SXZ)
127-69-5 267.31 C11H13N3O3S 300 c 1.01 c 1.60
4.83i
Sulfanitran
(SNT)
122-16-7 335.34 C14H13N3O5S 36.6d 2.26 c -
Sulfonamides
Sulfamethoxypyridazine
(SMPZ)
80-35-3 280.31 C11H12N4O3S 147 c 0.32 c 2.08
7.19i
27
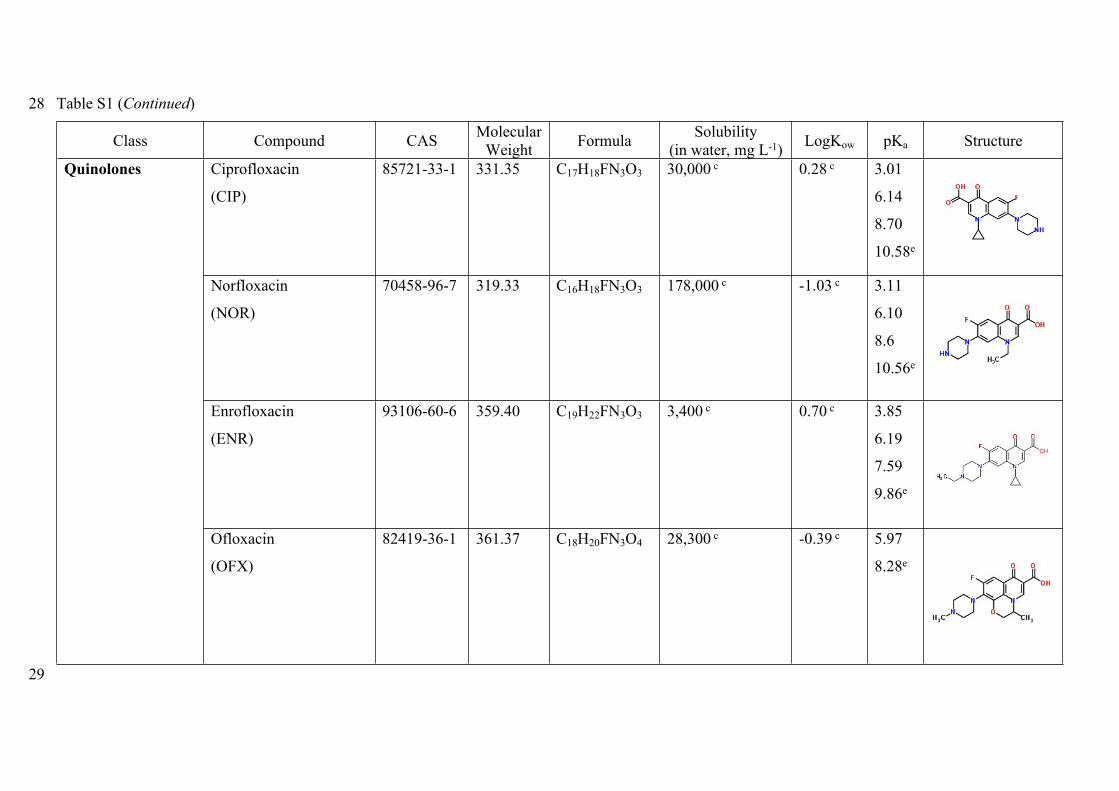
28 Table S1 (Continued)
Class Compound CAS MolecularWeight Formula Solubility
(in water, mg L-1) LogKow pKa Structure
Ciprofloxacin
(CIP)
85721-33-1 331.35 C17H18FN3O3 30,000 c 0.28 c 3.01
6.14
8.70
10.58e
Norfloxacin
(NOR)
70458-96-7 319.33 C16H18FN3O3 178,000 c -1.03 c 3.11
6.10
8.6
10.56e
Enrofloxacin
(ENR)
93106-60-6 359.40 C19H22FN3O3 3,400 c 0.70 c 3.85
6.19
7.59
9.86e
Quinolones
Ofloxacin
(OFX)
82419-36-1 361.37 C18H20FN3O4 28,300 c -0.39 c 5.97
8.28e
29
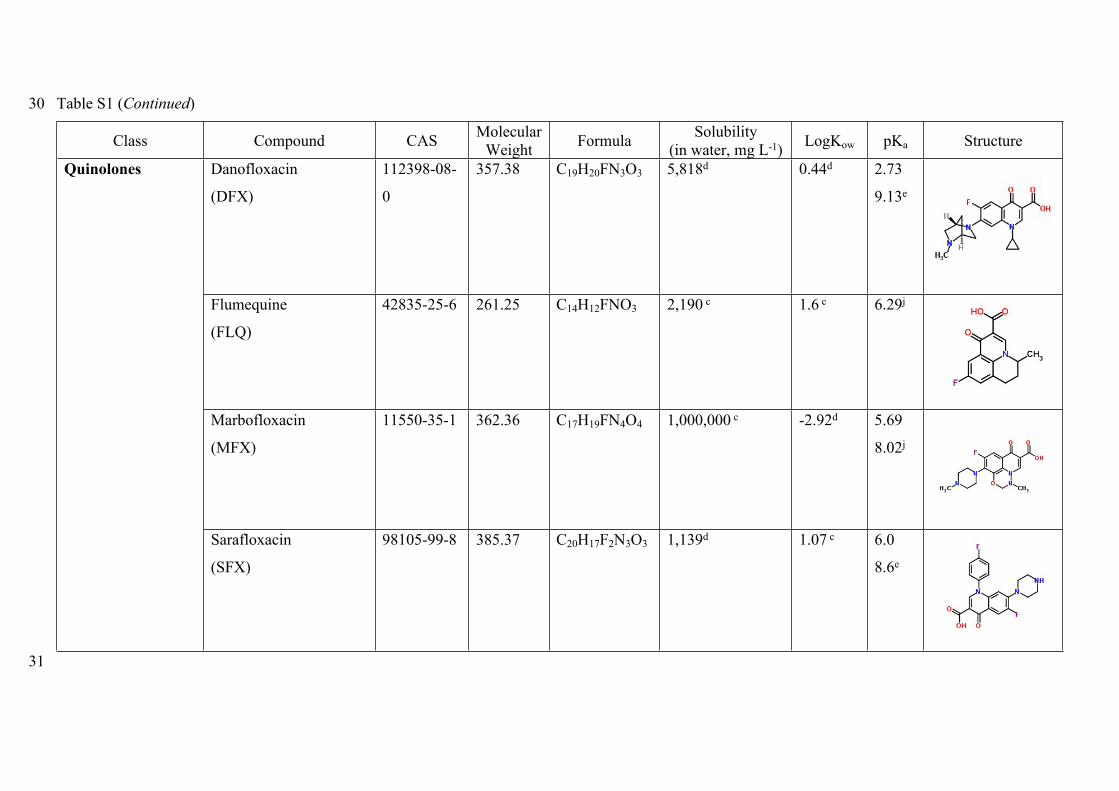
30 Table S1 (Continued)
Class Compound CAS MolecularWeight Formula Solubility
(in water, mg L-1) LogKow pKa Structure
Danofloxacin
(DFX)
112398-08-
0
357.38 C19H20FN3O3 5,818d 0.44d 2.73
9.13e
Flumequine
(FLQ)
42835-25-6 261.25 C14H12FNO3 2,190 c 1.6 c 6.29j
Marbofloxacin
(MFX)
11550-35-1 362.36 C17H19FN4O4 1,000,000 c -2.92d 5.69
8.02j
Quinolones
Sarafloxacin
(SFX)
98105-99-8 385.37 C20H17F2N3O3 1,139d 1.07 c 6.0
8.6e
31
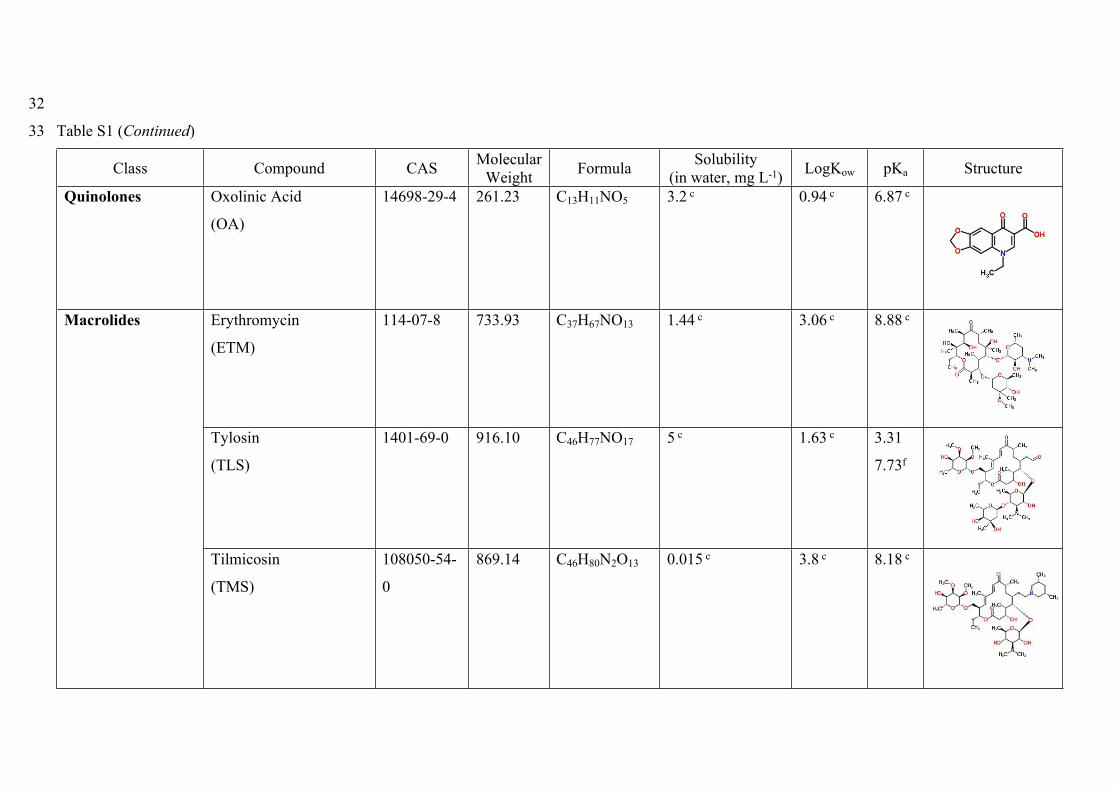
32
33 Table S1 (Continued)
Class Compound CAS MolecularWeight Formula Solubility
(in water, mg L-1) LogKow pKa Structure
Quinolones Oxolinic Acid
(OA)
14698-29-4 261.23 C13H11NO5 3.2 c 0.94 c 6.87 c
Erythromycin
(ETM)
114-07-8 733.93 C37H67NO13 1.44 c 3.06 c 8.88 c
Tylosin
(TLS)
1401-69-0 916.10 C46H77NO17 5 c 1.63 c 3.31
7.73f
Macrolides
Tilmicosin
(TMS)
108050-54-
0
869.14 C46H80N2O13 0.015 c 3.8 c 8.18 c
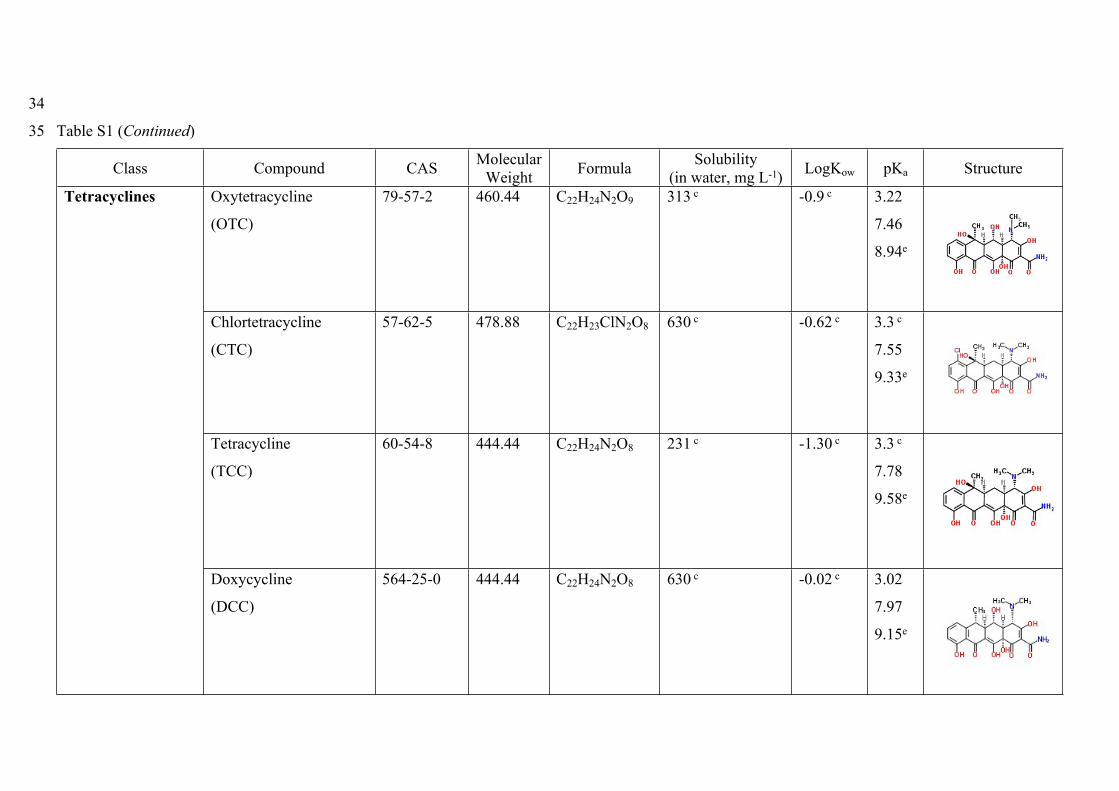
34
35 Table S1 (Continued)
Class Compound CAS MolecularWeight Formula Solubility
(in water, mg L-1) LogKow pKa Structure
Oxytetracycline
(OTC)
79-57-2 460.44 C22H24N2O9 313 c -0.9 c 3.22
7.46
8.94e
Chlortetracycline
(CTC)
57-62-5 478.88 C22H23ClN2O8 630 c -0.62 c 3.3 c
7.55
9.33e
Tetracycline
(TCC)
60-54-8 444.44 C22H24N2O8 231 c -1.30 c 3.3 c
7.78
9.58e
Tetracyclines
Doxycycline
(DCC)
564-25-0 444.44 C22H24N2O8 630 c -0.02 c 3.02
7.97
9.15e
36
37 Table S1 (Continued)
Class Compound CAS MolecularWeight Formula Solubility
(in water, mg L-1) LogKow pKa Structure
Prochloraz
(PCA)
67747-09-5 376.67 C15H16Cl3N3O
2
34 c 4.1 c 3.8 c
Difenoconazole
(DCZ)
119446-68-
3
406.27 C19H17Cl2N3O
3
15 c 4.3 c -
Triadimefon
(TMF)
43121-43-3 293.75 C14H16ClN3O2 71.5 c 2.77 c -
Azoles
Triadimenol
(TMN)
55219-65-3 295.77 C14H18ClN3O2 120 c 2.9 c -
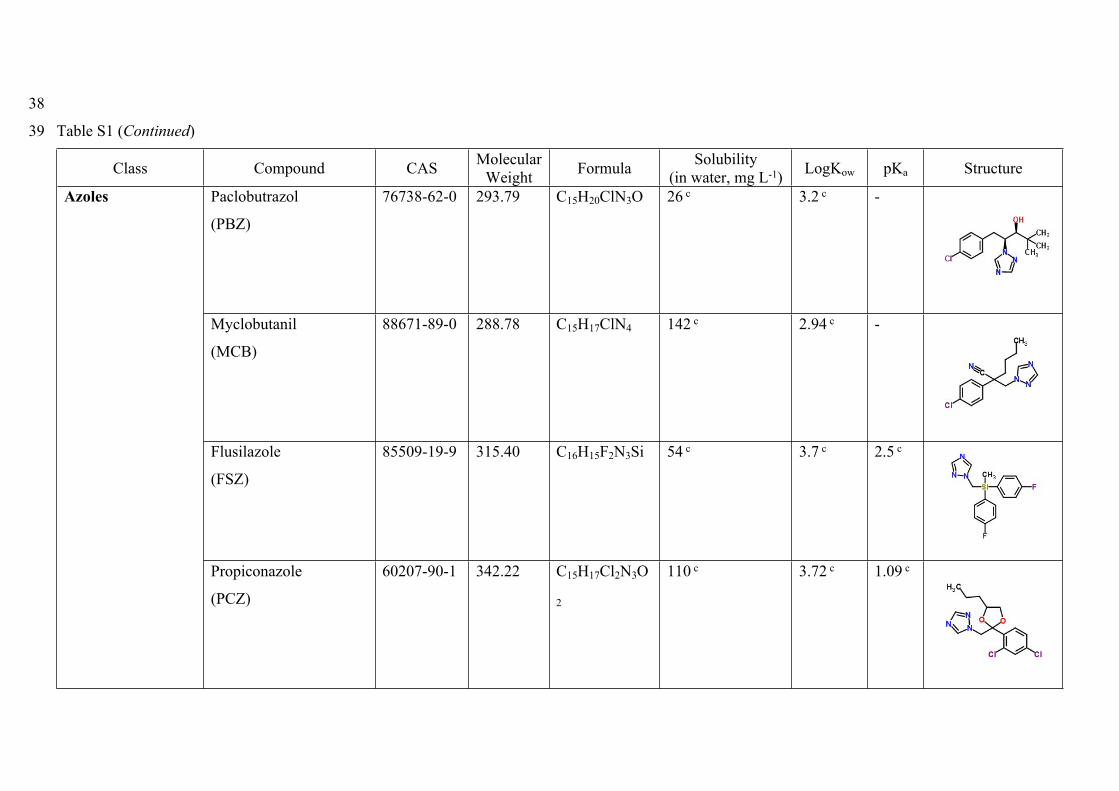
38
39 Table S1 (Continued)
Class Compound CAS MolecularWeight Formula Solubility
(in water, mg L-1) LogKow pKa Structure
Paclobutrazol
(PBZ)
76738-62-0 293.79 C15H20ClN3O 26 c 3.2 c -
Myclobutanil
(MCB)
88671-89-0 288.78 C15H17ClN4 142 c 2.94 c -
Flusilazole
(FSZ)
85509-19-9 315.40 C16H15F2N3Si 54 c 3.7 c 2.5 c
Azoles
Propiconazole
(PCZ)
60207-90-1 342.22 C15H17Cl2N3O
2
110 c 3.72 c 1.09 c

40
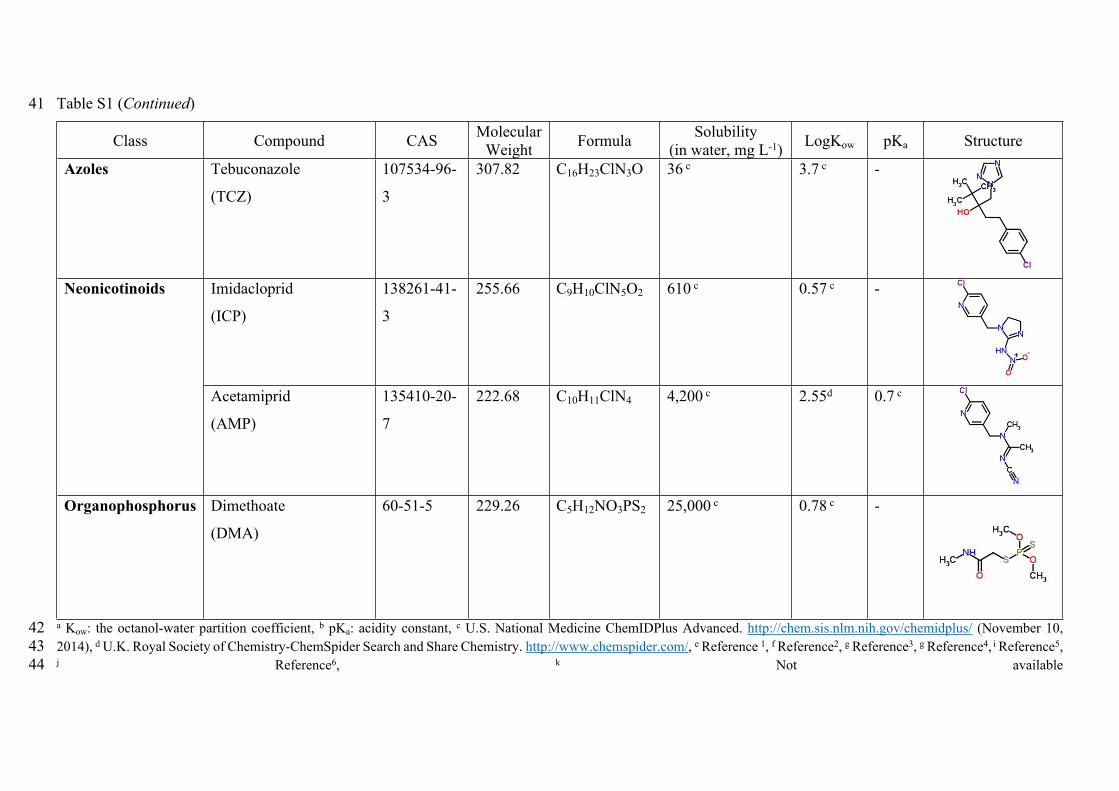
41 Table S1 (Continued)
Class Compound CAS MolecularWeight Formula Solubility
(in water, mg L-1) LogKow pKa Structure
Azoles Tebuconazole
(TCZ)
107534-96-
3
307.82 C16H23ClN3O 36 c 3.7 c -
Imidacloprid
(ICP)
138261-41-
3
255.66 C9H10ClN5O2 610 c 0.57 c -Neonicotinoids
Acetamiprid
(AMP)
135410-20-
7
222.68 C10H11ClN4 4,200 c 2.55d 0.7 c
Organophosphorus Dimethoate
(DMA)
60-51-5 229.26 C5H12NO3PS2 25,000 c 0.78 c -
42 a Kow: the octanol-water partition coefficient, b pKa: acidity constant, c U.S. National Medicine ChemIDPlus Advanced. http://chem.sis.nlm.nih.gov/chemidplus/ (November 10, 43 2014), d U.K. Royal Society of Chemistry-ChemSpider Search and Share Chemistry. http://www.chemspider.com/, e Reference 1, f Reference2, g Reference3, g Reference4, i Reference5, 44 j Reference6, k Not available
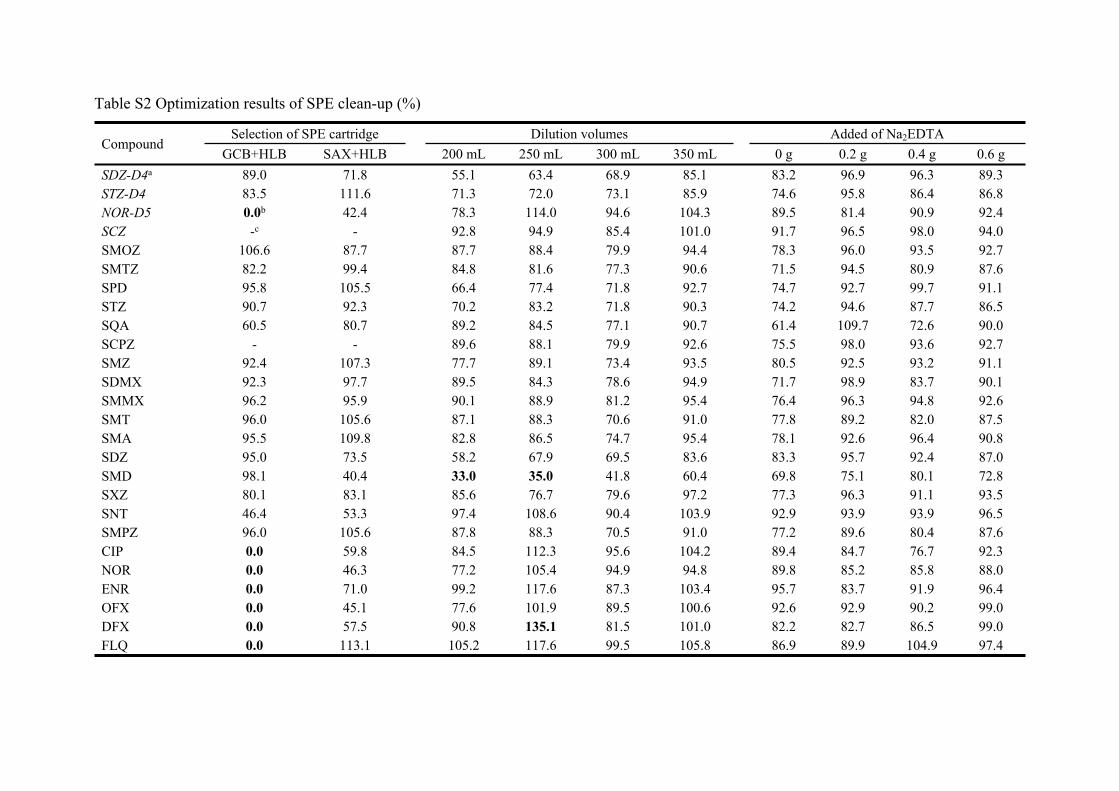
Table S2 Optimization results of SPE clean-up (%)
Selection of SPE cartridge Dilution volumes Added of Na2EDTACompound
GCB+HLB SAX+HLB 200 mL 250 mL 300 mL 350 mL 0 g 0.2 g 0.4 g 0.6 gSDZ-D4a 89.0 71.8 55.1 63.4 68.9 85.1 83.2 96.9 96.3 89.3STZ-D4 83.5 111.6 71.3 72.0 73.1 85.9 74.6 95.8 86.4 86.8NOR-D5 0.0b 42.4 78.3 114.0 94.6 104.3 89.5 81.4 90.9 92.4SCZ -c - 92.8 94.9 85.4 101.0 91.7 96.5 98.0 94.0SMOZ 106.6 87.7 87.7 88.4 79.9 94.4 78.3 96.0 93.5 92.7SMTZ 82.2 99.4 84.8 81.6 77.3 90.6 71.5 94.5 80.9 87.6SPD 95.8 105.5 66.4 77.4 71.8 92.7 74.7 92.7 99.7 91.1STZ 90.7 92.3 70.2 83.2 71.8 90.3 74.2 94.6 87.7 86.5SQA 60.5 80.7 89.2 84.5 77.1 90.7 61.4 109.7 72.6 90.0SCPZ - - 89.6 88.1 79.9 92.6 75.5 98.0 93.6 92.7SMZ 92.4 107.3 77.7 89.1 73.4 93.5 80.5 92.5 93.2 91.1SDMX 92.3 97.7 89.5 84.3 78.6 94.9 71.7 98.9 83.7 90.1SMMX 96.2 95.9 90.1 88.9 81.2 95.4 76.4 96.3 94.8 92.6SMT 96.0 105.6 87.1 88.3 70.6 91.0 77.8 89.2 82.0 87.5SMA 95.5 109.8 82.8 86.5 74.7 95.4 78.1 92.6 96.4 90.8SDZ 95.0 73.5 58.2 67.9 69.5 83.6 83.3 95.7 92.4 87.0SMD 98.1 40.4 33.0 35.0 41.8 60.4 69.8 75.1 80.1 72.8SXZ 80.1 83.1 85.6 76.7 79.6 97.2 77.3 96.3 91.1 93.5SNT 46.4 53.3 97.4 108.6 90.4 103.9 92.9 93.9 93.9 96.5SMPZ 96.0 105.6 87.8 88.3 70.5 91.0 77.2 89.6 80.4 87.6CIP 0.0 59.8 84.5 112.3 95.6 104.2 89.4 84.7 76.7 92.3NOR 0.0 46.3 77.2 105.4 94.9 94.8 89.8 85.2 85.8 88.0ENR 0.0 71.0 99.2 117.6 87.3 103.4 95.7 83.7 91.9 96.4OFX 0.0 45.1 77.6 101.9 89.5 100.6 92.6 92.9 90.2 99.0DFX 0.0 57.5 90.8 135.1 81.5 101.0 82.2 82.7 86.5 99.0FLQ 0.0 113.1 105.2 117.6 99.5 105.8 86.9 89.9 104.9 97.4
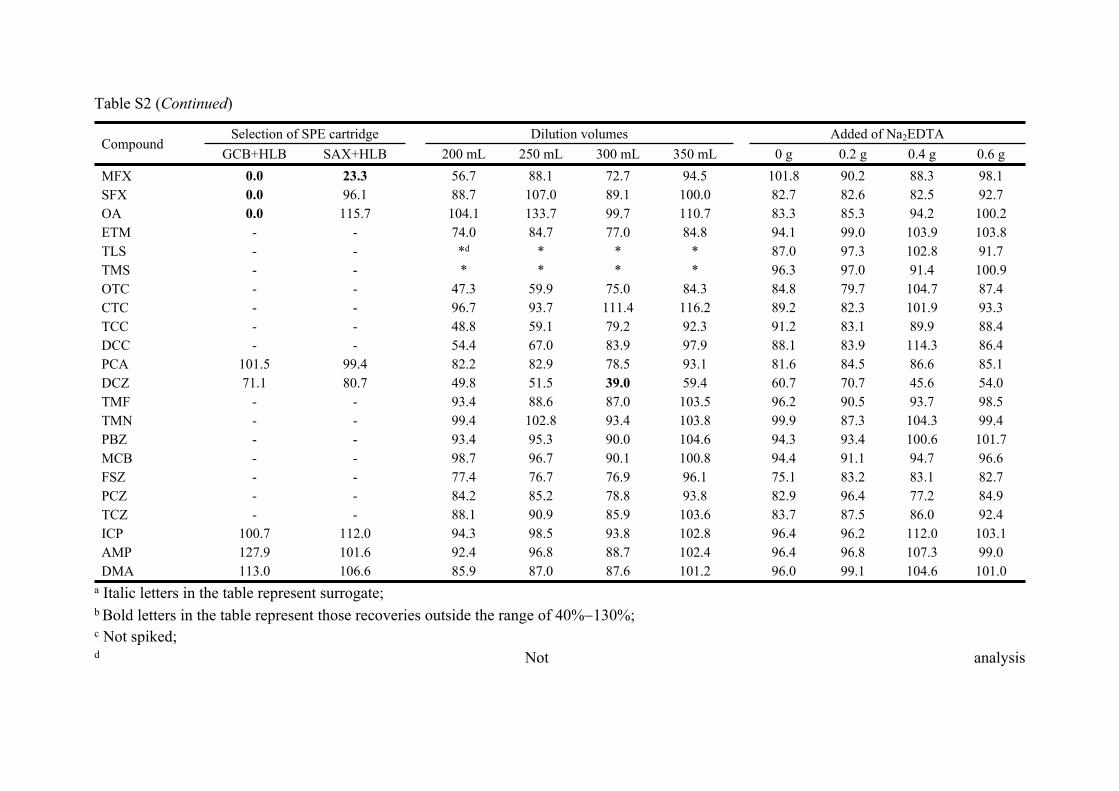
Table S2 (Continued)
Selection of SPE cartridge Dilution volumes Added of Na2EDTACompound
GCB+HLB SAX+HLB 200 mL 250 mL 300 mL 350 mL 0 g 0.2 g 0.4 g 0.6 gMFX 0.0 23.3 56.7 88.1 72.7 94.5 101.8 90.2 88.3 98.1SFX 0.0 96.1 88.7 107.0 89.1 100.0 82.7 82.6 82.5 92.7OA 0.0 115.7 104.1 133.7 99.7 110.7 83.3 85.3 94.2 100.2ETM - - 74.0 84.7 77.0 84.8 94.1 99.0 103.9 103.8TLS - - *d * * * 87.0 97.3 102.8 91.7TMS - - * * * * 96.3 97.0 91.4 100.9OTC - - 47.3 59.9 75.0 84.3 84.8 79.7 104.7 87.4CTC - - 96.7 93.7 111.4 116.2 89.2 82.3 101.9 93.3TCC - - 48.8 59.1 79.2 92.3 91.2 83.1 89.9 88.4DCC - - 54.4 67.0 83.9 97.9 88.1 83.9 114.3 86.4PCA 101.5 99.4 82.2 82.9 78.5 93.1 81.6 84.5 86.6 85.1DCZ 71.1 80.7 49.8 51.5 39.0 59.4 60.7 70.7 45.6 54.0TMF - - 93.4 88.6 87.0 103.5 96.2 90.5 93.7 98.5TMN - - 99.4 102.8 93.4 103.8 99.9 87.3 104.3 99.4PBZ - - 93.4 95.3 90.0 104.6 94.3 93.4 100.6 101.7MCB - - 98.7 96.7 90.1 100.8 94.4 91.1 94.7 96.6FSZ - - 77.4 76.7 76.9 96.1 75.1 83.2 83.1 82.7PCZ - - 84.2 85.2 78.8 93.8 82.9 96.4 77.2 84.9TCZ - - 88.1 90.9 85.9 103.6 83.7 87.5 86.0 92.4ICP 100.7 112.0 94.3 98.5 93.8 102.8 96.4 96.2 112.0 103.1AMP 127.9 101.6 92.4 96.8 88.7 102.4 96.4 96.8 107.3 99.0DMA 113.0 106.6 85.9 87.0 87.6 101.2 96.0 99.1 104.6 101.0
a Italic letters in the table represent surrogate;b Bold letters in the table represent those recoveries outside the range of 40%130%;c Not spiked;d Not analysis
Table S3 Matrix effects and comparison of two quantification methods
Recovery (%)Compound ME (%) Method of internal standard Method of matrix-matchedSDZ-D4a 67.7 70.2 78.0STZ-D4 61.7 61.3 79.2NOR-D5 60.0 67.7 58.0SCZ 84.6 147.6b 101.0SMOZ 60.1 96.9 83.2SMTZ 65.5 108.3 73.3SPD 42.7 57.7 77.3STZ 54.5 98.4 75.0SQA 45.6 38.5 73.1SCPZ 67.6 80.1 81.5SMZ 37.3 64.5 80.7SDMX 43.9 53.1 82.3SMMX 74.6 81.7 81.4SMT 48.2 67.5 71.5SMA 45.4 79.6 81.4SDZ 57.8 80.6 77.1SMD 63.9 45.5 55.0SXZ 64.6 69.9 81.4SNT 47.5 157.6 102.6SMPZ 48.1 77.8 71.7CIP 53.0 92.7 52.9NOR 62.2 95.9 55.8ENR 66.4 82.9 47.8OFX 51.8 72.8 55.0DFX 62.0 87.6 53.8FLQ 66.5 119.5 88.3MFX 47.2 72.2 46.5SFX 63.3 105.9 57.3OA 48.8 89.1 77.8ETM 45.5 73.3 89.0TLS 98.5 135.6 82.5TMS 89.3 177.6 73.0OTC 294.4 614.3 72.4CTC 257.5 804.0 85.9TCC 156.7 459.1 73.4DCC 275.0 614.0 82.2PCA 61.4 52.6 86.5DCZ 78.5 49.5 73.9TMF 81.0 94.6 100.0TMN 56.5 68.6 101.9PBZ 75.0 96.5 100.2MCB 75.6 99.5 99.2FSZ 75.9 75.6 87.1PCZ 82.9 100.9 91.6TCZ 80.1 100.8 94.8ICP 68.4 105.8 97.4AMP 53.2 119.4 97.8DMA 42.1 87.8 100.3
a Italic letters in the table represent surrogate;b Bold letters in the table represent those recoveries outside the range of 40%130%
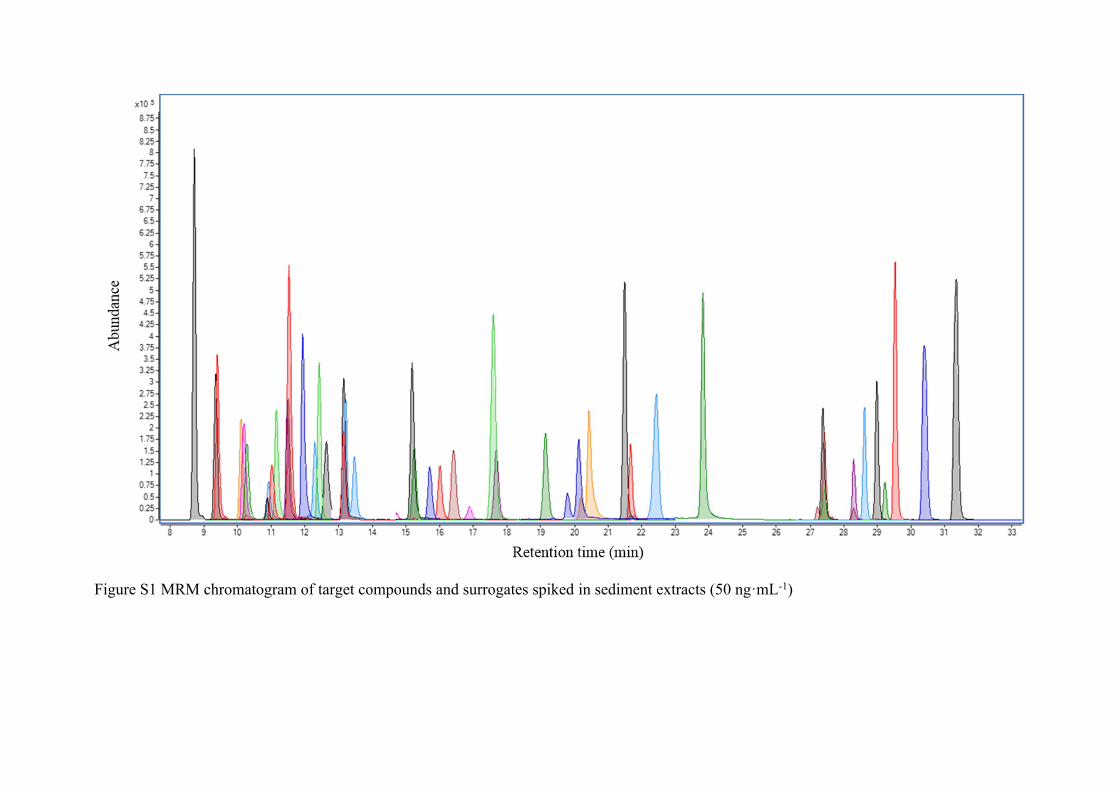
Figure S1 MRM chromatogram of target compounds and surrogates spiked in sediment extracts (50 ng·mL-1)
References
1 L.J. Zhou, G.G. Ying, S. Liu, J.L. Zhao, F. Chen, R.Q. Zhang, F.Q. Peng and Q.Q. Zhang, J. Chromatogr. A, 2012, 1244, 123-138.
2 E. Chamberlain and C. Adams, Water Res., 2006, 40, 2517-2526.
3 K. Chen and J.L. Zhou, Chemosphere, 2014, 95, 604-612.
4 S.F. Yang, C.F. Lin, A.Y.C. Lin and P.K. A. Hong, Water Res., 2011, 45, 3389-3397.
5 T. Li, Z.G. Shi, M.M. Zheng and Y.Q. Feng, J. Chromatogr. A, 2008, 1205, 163-170.
6 X. Van Doorslaer, J. Dewulf, H. Van Langenhove and K. Demeestere, Sci.Total Environ., 2014, 500–501, 250-269.


![Abatmsk.ru recipe for-pka-6-1-1vm-pka-10-1-1vm[1]](https://img.pdfslide.us/doc/110x75/55ceb30ebb61eb641e8b471d/abatmskru-recipe-for-pka-6-1-1vm-pka-10-1-1vm1.jpg)

![Casting Technology [ PDF 1.68 MB ]](https://img.pdfslide.us/doc/110x75/589af39e1a28ab23468bce4e/casting-technology-pdf-168-mb-.jpg)
![Abatmsk.ru recipe for-pka-6-1-1pm-pka-10-1-1pm[1]](https://img.pdfslide.us/doc/110x75/55d19cb7bb61eba25e8b4598/abatmskru-recipe-for-pka-6-1-1pm-pka-10-1-1pm1.jpg)
