Embed Size (px)
Citation preview
Improvedsystemefficienciesandtechnologyusherina
newerainoilanalysis.
21st Century Condition Monitoring
here are two primary forms of condition monitor-ing: oil analysis (OA) and vibration signature mon-itoring (VIB). Both have been around for a number of decades. OA (circa 1948) is listed fi rst because it preceded VIB (circa 1970) by roughly 20 years. However, VIB had a major advantage over OA from its inception* in the form of online monitoring ca-
pability. This obvious advantage resulted in VIB being imple-mented for industrial applications with much more intensity than OA.
OA didn’t reach online status until the outset of the 21st Century when sensors of varying types and capabilities be-gan to appear on (mostly) critical applications such as mili-tary and highly remote components.
thRee-tieRed oil analYsis sYsteMIn previous columns in TLT, we’ve focused on the notion of a three-tiered system for modern oil analysis:
• Tier1:Online (sensors in contact with the lube)
ON CONDITION MONITORINGJack Poley
T8 4 • S E P T E M B E R 2 0 1 1 T R I B O L O G Y & L U B R I C A T I O N T E C H N O L O G Y W W W . S T L E . O R G
* It may be argued that OA has two online aspects dating back to the beginning of the 20th century: lube pressure and lube temperature. While these are criti-cal pieces of information, they also are often representative of failures in progress that could not be fully mitigated, i.e., too little information, too late. More is needed, and earlier.
• Tier 2: Onsite (insightful testing where the machine is sited)
• Tier3:Offsite (traditional full-service laboratories).
I’ve maintained that the viability and synergy of all three tiers represented a paradigm shift in the OA and condition monitoring (CM) models. While OA always spanned more applications than VIB, the addition of online capabilities now implies that OA has caught, and likely surpassed, VIB as the primary CM tool for nearly any venue and application, particularly so with Tier 1 now in play.
Similar to VIB, OA became real-time while also maintain-ing its previous inherent advantages such as identifying oil quality issues that could lead to excessive wear and VIB. Of the two primary CM tools, OA is often more timely. VIB, however, is not suddenly obsolete, and it should be noted that new techniques are being explored and implemented in VIB monitoring, most notably in acoustic monitoring tech-nology. Nevertheless, OA seems to have the lead position, owing to its ability to identify potential trauma well in ad-vance of VIB (more often than not for most machinery set-tings).
Tier 2, however, also plays a vital role in terms of vetting Tier 1 triggers and alarms as CM practitioners are increas-
ingly demanding early warning. Being able to make some useful decisions without waiting for a Tier 3 result some-times means the difference between a save and a failure. Fur-ther, when Tier 1 is not employed, Tier 2 can play a more primary role in CM and preventive maintenance.
We can assume that OA and VIB will continue to make strides toward early trauma warning, and that having CM data sooner (rather than later) will, hereafter, be a continu-ing goal. There are, however, other paradigm shifts that will need to be taken into consideration, in addition to the desire to perform inspections closer to the machine.
PaRtiCle CountingWhile particle counting has been around for a long time, its efficacy has come under increased scrutiny of late because numbers of particles, heretofore detected, are being trapped by fine filtration systems. Fine filtration strategies are becoming increasingly preva-lent, and in numbers of different machinery component types. Particulate evidence lost is genuine cause for concern.
1. Finer filtration means that particle removal will be in-creasingly greater, clearly interfering with OA detec-tion capabilities with respect to particulates.
Figure 1. A graphical representation of particulate study methods.
Figure 2. Effective coverage for various particulate study methods.
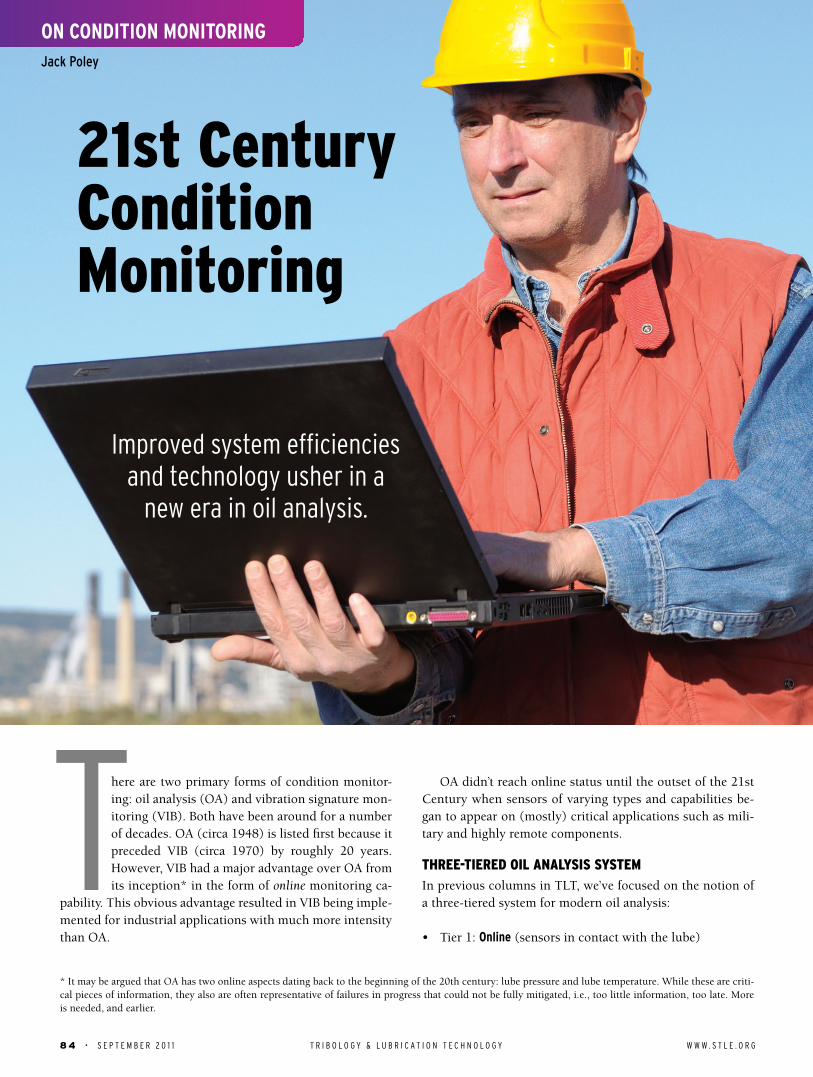
Figure1|A graphical representation of particulate study methods.
Testyourknowledge:Whatisthesinglemostimportantcharacteristicofanoil?(Answer:Viscosity) 8 5
• Well,iftheparticlesarenowbeingcapturedbythefilter in greater numbers, why not look at the filters themselves to see what and how much is being trapped? That’s exactly what’s beginning to hap-pen. The military has been a leader in developing this technology and, per usual, it will find its way to the private sector in due course. Filter Debris Analysis (FDA) is becoming a de facto term for the study of filter-trapped debris.
2. Clearly a significant change in a machine’s filtration scheme, with respect to targeted particle sizes and re-moval efficiency, requires a change in one’s approach to assessing particle levels:
• Levelsthatwereacceptablebeforearelikelynowtobe unacceptable.
• New limitsand trendingapproacheswillneed tobe determined.
• Wearmetals,thoughverysmall,willbeaffectedtosome extent.
• FDAwillbecomeincreasinglymoreuseful(reveal-ing) and important in the CM process.
3. There is the continuing issue of particle-size detection limitations, dependent on method.
• It ishighlyadvisable toselectat leastonetest tocomplement traditional spectrometric metals anal-ysis (SOA), wherein various wear, contaminant and additive metals are detected (Note: the severe particle size detection limitations of SOA are shown in Figures 1 and 2).
• The complementary test to parallel SOA can bechosen from a rather wide variety of methodolo-gies. While a sensor seems most appropriate on the surface, there are other ways of addressing large particulates (See Figures 1 and 2).
suMMaRY21st Century CM is well on its way to revealing more con-cepts and techniques than ever before, and it will be fun and challenging to watch and participate in its development. While a three-tiered testing system ushers in a new paradigm in the oil analysis arena, other techniques and technology will soon be coming to the forefront.
We’ll discuss these and other notions in future columns.
Jack Poley is managing partner of Condition Monitoring
International (CMI), Miami, consultants in fluid analysis. You
can reach him at [email protected]. For
more information about CMI, visit www.conditionmonitor-
ingintl.com.
8 6 • S E P T E M B E R 2 0 1 1 T R I B O L O G Y & L U B R I C A T I O N T E C H N O L O G Y W W W . S T L E . O R G
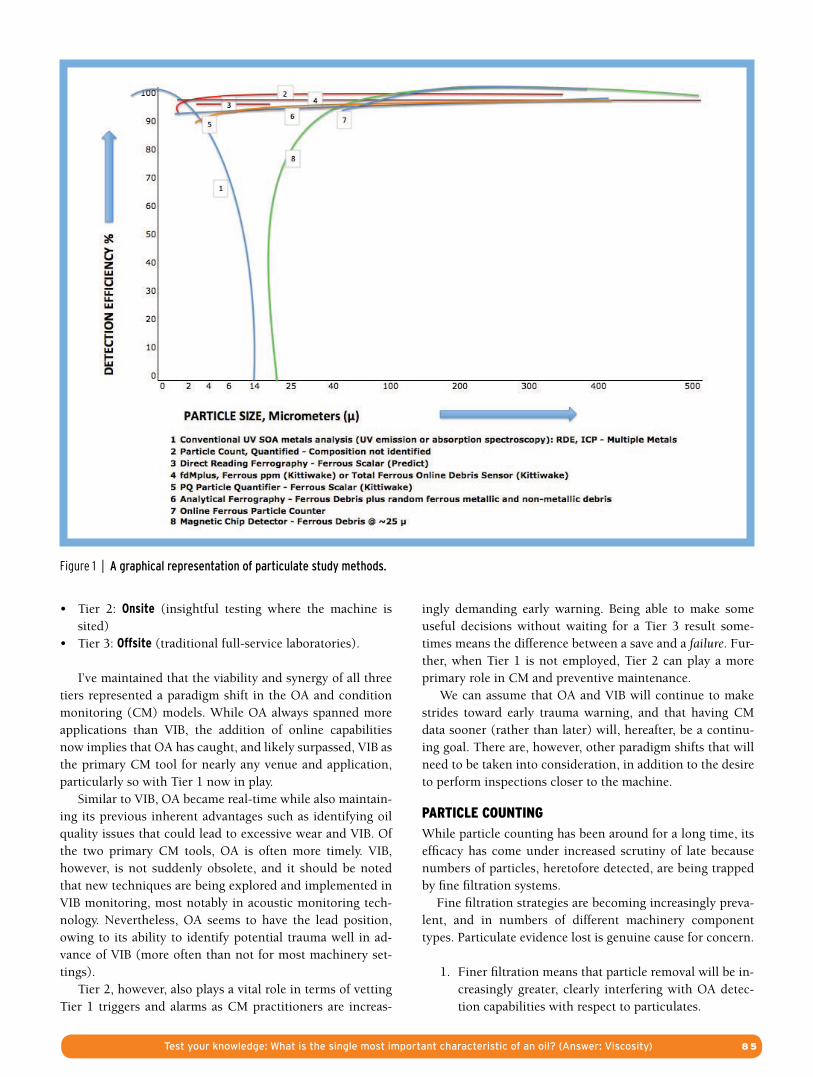
EFFECTIVE PARTICLE DETECTION, IDENTIFICATION AND QUANTIFICATION= Detection gap with indicated technique
1 UV Metals (SOA)
2 Particle Count
3 DR ferrography
4 fdMplus or Total Ferrous Debris Online Sensor
5 PQ Particle Quantifier
6 Laser Net Fines
7 Analytical Ferrography
8 Online Ferrous Particle Counter
9 Magnetic Chip Detector
0 2 4 6 14 25 40 100 200 300 400 500
1 Conventional UV SOA analysis (UV emission or absorption spectroscopy): RDE, ICP - Multiple Metals2 Particle Count, Quantified - Composition not identified3 Direct Reading Ferrography - Ferrous Scalar (Predict)4 fdMplus, Ferrous ppm (Kittiwake) or Total Ferrous Debris Sensor (Kittiwake)5 PQ Particle Quantifier - Ferrous Scalar (Kittiwake)6 LaserNetFines (LNF) (Spectro) - note: LNF also provides a standard ISO Particle Count (2), and other inspections7 Analytical Ferrography - Ferrous Debris plus random ferrous metallic and non-metallic debris8 Online Ferrous Particle Counter9 Magnetic Chip Detector - Ferrous Debris @ ~25 µ
PARTICLE SIZE, Micrometers (µ)
Vibration AnalysisCondition monitoring’searly warning system.
Q&AElements of a sound fluid-analysis program
23rd Century tribologistsWhat will they say about us?
When life hands you lemons…Make a better solvent
Oil and WaterWhat happens when they do mix?
tltT R I B O L O G Y & L U B R I C A T I O N T E C H N O L O G Y
SYSTEMS, STRATEGIES & RESEARCH FOR LUBRICATION PROFESSIONALS AN PUBLICATION | AUGUST 2011
Digital TLT: Sponsored by Münzing at www.stle.org.
Editor’s Note: For a deeper examination and comparison of oil analysis and vibration analysis, see the August issue of TLT (available digitally at www.stle.org.)
Figure2|Effective coverage for various particulate study methods.