Embed Size (px)
Citation preview

Acknowledgements/ Disclaimer The authors would like to thank the project manager at BEIS, Ian Drummond, and members of the BEIS statistical team, Sean Mattson and Frances Pottier, for their guidance during the research and comments on the draft of the report. We would also like to thank Professor Stephen Roper at Warwick Business School for his input into the survey. The findings and interpretations in this report are those of the authors and do not necessarily represent the view of BEIS.
1
Contents Acknowledgements/ Disclaimer _______________________________________________ 1
1. Executive summary _______________________________________________________ 5
Introduction _______________________________________________________________ 5
Profiles of businesses _______________________________________________________ 5
Business performance ______________________________________________________ 6
Exporting _________________________________________________________________ 7
Innovation ________________________________________________________________ 7
Access to external finance ___________________________________________________ 7
Major obstacles to the success of the business ___________________________________ 8
Business support __________________________________________________________ 8
Working with the public sector ________________________________________________ 9
Future plans ______________________________________________________________ 9
2. Introduction _____________________________________________________________ 10
Aims of the survey ________________________________________________________ 10
Survey method ___________________________________________________________ 11
Statistical confidence ______________________________________________________ 13
3. Profile of businesses _____________________________________________________ 15
Employer status (based on BPE 2016) _________________________________________ 15
Sector (based on BPE 2015) ________________________________________________ 15
Number of sites ___________________________________________________________ 17
Whether business premises are somebody’s home _______________________________ 17
Legal status _____________________________________________________________ 17
Registered charity status ___________________________________________________ 19
Number of owners/partners _________________________________________________ 19
Family-owned businesses __________________________________________________ 20
Women-led businesses ____________________________________________________ 20
MEG-led businesses _______________________________________________________ 21
4. Business performance ____________________________________________________ 22
Numbers employed compared with 12 months ago _______________________________ 22
Number of people expected to be employed in 12 months’ time _____________________ 23
Turnover now compared with 12 months previously ______________________________ 23
Expectations of turnover in 12 months’ time _____________________________________ 24
2
Profit ___________________________________________________________________ 25
5. Exporting _______________________________________________________________ 27
Whether sold goods or services outside of the UK in the last 12 months _______________ 27
Where exported to in the last 12 months _______________________________________ 28
Where imported from in the last 12 months _____________________________________ 28
Plans to increase exports/start exporting _______________________________________ 29
Whether have suitable goods/services for export _________________________________ 30
6. Innovation ______________________________________________________________ 32
New/significantly improved goods/services _____________________________________ 32
R&D tax credits ___________________________________________________________ 35
7. Access to external finance ________________________________________________ 36
Types of external finance currently being used __________________________________ 36
Whether sought external finance in the last 12 months ____________________________ 39
Reasons for applying for external finance ______________________________________ 41
Type of external finance sought ______________________________________________ 42
Success in obtaining external finance _________________________________________ 43
Amount of external finance obtained __________________________________________ 45
Reasons for not applying for external finance ___________________________________ 45
Credit granting and late payment _____________________________________________ 47
Receipt of credit __________________________________________________________ 48
Whether likely to approach external finance providers in the next three years __________ 48
8. Major obstacles to the success of the business _______________________________ 50
Major obstacles to the success of the business __________________________________ 50
Regulations ______________________________________________________________ 53
9. Business support ________________________________________________________ 54
Whether sought external information or advice in the last 12 months _________________ 54
Type of information or advice sought (England and Wales only) _____________________ 55
Where information and strategic advice was sought (England and Wales only) _________ 57
How information or advice was delivered (England and Wales only) __________________ 58
Amount of strategic advice received (England and Wales only) ______________________ 58
Paying for strategic advice (England and Wales only) _____________________________ 59
Un-met information and advice needs (England and Wales only) ____________________ 60
Awareness of organisations offering business support – England ____________________ 60
3

10. Working with the public sector ____________________________________________ 62
Whether worked for the public sector __________________________________________ 62
11. Future plans ___________________________________________________________ 63
Aiming to grow ___________________________________________________________ 63
Closure or transfer of the business in the next 5 years ____________________________ 64
Ways in which business plans to grow over the next three years_____________________ 65
4
Longitudinal Small Business Survey 2016: Businesses with no employees – cross-sectional report
1. Executive summary
Introduction
This report sets out the key findings from the Longitudinal Small Business Survey (LSBS), Year 2, a large-scale telephone survey of 9,248 owners and managers of SMEs, commissioned by the Department for Business, Energy and Industrial Strategy (BEIS). This survey is the latest in a series of annual and biennial Small Business Surveys (SBS) dating back to 2003. The survey on this occasion was conducted between August 2016 and January 2017 by BMG Research Ltd.
The Year 2 (2016) LSBS follows from the Year 1 (2015) LSBS, which was the largest SBS yet undertaken, comprising 15,502 interviews. The large majority of those interviewed in Year 2 (2016) LSBS had also been interviewed in Year 1 (2015) LSBS: 7,279 in total. The other 1,969 interviewed were ‘top-ups’, which were included to enable regional boosts, but also to represent new businesses, and to increase the sample size of the panel for further waves of the survey.
This report is cross-sectional, a snap shot of the state of SMEs in the latter half of 2016. It is based on 2,324 businesses with no employees, excluding owners and partners who do not count as employees. Within this most sub-group analysis is based upon whether the business is registered (i.e. registered with HMRC to pay VAT and/or PAYE), or unregistered. Comparisons are also made with SME employers, defined as having between 1 and 249 employees. A separate report for SME employers is also available.
Profiles of businesses
Based on government statistics1, upon which the survey’s weighting is based, 76 per cent of all UK businesses in 2016 had no employees. Fifty-five per cent were unregistered, and 21 per cent were registered.
The most populous sectors in 2016 for those with no employees were construction (20 per cent) and professional/scientific (15 per cent).
Ninety-four per cent of businesses with no employees operated from a single site.
Sixty per cent of businesses with no employees had a main work premises that was also their home, or the home of the business’s owner.
1 Business Population Estimates (BPE) 2016.
5
Longitudinal Small Business Survey 2016: Businesses with no employees – cross-sectional report
Fifty-eight per cent of businesses with no employees had sole proprietorship as their legal status, while 31 per cent were companies limited by shares (Ltd.). In comparison to the 2015 LSBS survey, the proportion of zero-employee Ltd. companies increased by three percentage points, with a corresponding three percentage decrease in the proportion of sole proprietorships.
Two per cent of businesses with no employees were registered charities.
Seventy-eight per cent of zero-employee businesses had just one owner.
Ninety-three per cent of businesses with no employees were defined as family-owned businesses, that is businesses majority owned by members of the same family, including businesses with just a single owner. This was two percentage points higher than in 2015.
Twenty-two per cent of businesses with no employees were majority-led by women, defined as controlled by a single woman or having a management team of which a majority were women.
Four per cent of businesses with no employees were minority ethnic group (MEG-led), defined as having a person from an ethnic minority in sole control of the business or having a management team with at least half of its members from an ethnic minority.
Business performance
Among panelists only, nine per cent of zero-employee businesses employed at least one person 12 months’ previously.
Ten per cent of businesses with no employees expected to employ at least one person in 12 months’ time. Nineteen per cent of these had employed somebody 12 months’ previously.
Twenty-six per cent of businesses with no employees had greater turnover (value of sales) than a year previously. Fifty per cent had approximately the same turnover and 22 per cent had lower turnover. These proportions were very similar to those seen in 2015.
Twenty-seven per cent of businesses with no employees expected turnover to increase in the next 12 months, 54 per cent thought it would remain roughly the same and 14 per cent thought it would be less. Compared to 2015, fewer zero-employee businesses thought that turnover would grow (down four percentage points), while the proportion that thought that it would remain the same was higher by the same margin.
Seventy-six per cent of businesses with no employees generated a profit or surplus in their last financial year, the same proportion as in 2015.
6
Longitudinal Small Business Survey 2016: Businesses with no employees – cross-sectional report
Exporting
Ten per cent of businesses with no employees had exported goods or services in the previous 12 months (four per cent goods, seven per cent services). This proportion was the same as in 2015.
Zero-employee businesses in the information/communication (22 per cent), professional/scientific (16 per cent) and administrative services (15 per cent) sectors were most likely to export services. Those in the wholesale/retail (18 per cent) and manufacturing (16 per cent) sectors were most likely to export goods.
Seventy-two per cent of zero-employee exporters exported to EU countries, while 67 per cent exported to the rest of the world. Twenty-nine per cent only export to the EU.
Twelve per cent of all zero-employee businesses import goods or services. Eight per cent import from the EU, while seven per cent import from non-EU countries.
Five per cent of businesses with no employees had not exported in the previous 12 months, but planned to export in future.
Including those that currently export, 28 per cent of businesses with no employees had goods or services suitable for export.
Innovation
Overall, 38 per cent of businesses with no employees had innovated in the last three years, be this the introduction of new or significantly improved goods or services, or the introduction of new or significantly improved processes. This proportion was eight percentage points less than the equivalent figure in 2015.
Twenty-six per cent of zero-employee businesses had introduced new or significantly improved goods or services in the last three years (12 per cent goods, 22 per cent services). This was eight percentage points less than the 2015 proportion.
Twelve per cent had introduced new or significantly improved processes in the last three years. This was four percentage points less than in 2015.
Access to external finance
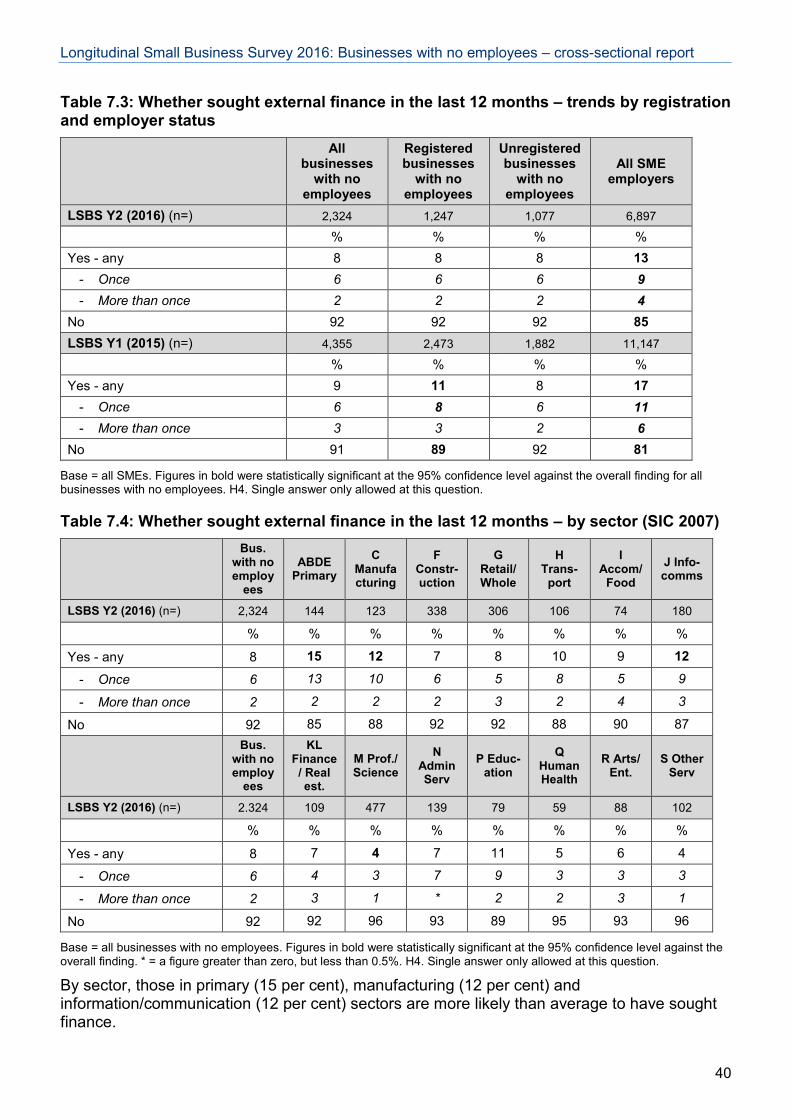
Eight per cent of businesses with no employees had sought external finance in the 12 months preceding interview, a similar proportion to that in 2015.
Of those that had applied for external finance in the previous 12 months, the reason for seeking it was to acquire working capital or for cash flow reasons for 70 per cent, and investment in the business for 27 per cent.
The most commonly sought types of external finance in the previous 12 months were bank loans (39 per cent), bank overdrafts (30 per cent) and government/local authority grants or schemes (14 per cent).
7
Longitudinal Small Business Survey 2016: Businesses with no employees – cross-sectional report
Sixty-three per cent of zero-employee businesses that applied for external finance obtained at least some of what they wanted. Twenty-six per cent did not obtain any, and for the remaining 11 per cent the decision was still pending. Based on those that applied, the proportion obtaining any finance was eight percentage points less than in 2015, and the proportion unable to obtain any finance was ten percentage points higher.
Nine per cent of businesses with no employees had a need for finance in the previous 12 months but did not apply for it.
Fourteen per cent of businesses with no employees said they would be likely to approach external finance providers in the next three years, the same proportion as in 2015.
Major obstacles to the success of the business
The main major obstacles to the success of the business were competition (43 per cent), regulations/red tape (29 per cent), late payment (24 per cent) and taxation (21 per cent). In general, zero-employee businesses had fewer obstacles than SME employers, and registered zero-employee businesses had more obstacles than the unregistered ones.
Business support
Fourteen per cent of businesses with no employees had sought external advice or information in the previous 12 months. This proportion was five percentage points less than in 2015.
In England and Wales2, seven per cent sought external strategic advice, and eight per cent sought external information.
In England and Wales, external strategic advice was mainly sought for business growth (26 per cent of those seeking it), financial advice for the general running of the business (18 per cent), to improve business efficiency or for marketing (both 17 per cent). Thirty-one per cent of those that sought strategic advice approached accountants, 25 per cent consultants, and 19 per cent business networks or trade associations.
In England and Wales, external information was mainly sought on taxation (19 per cent), financial advice for the general running of the business (13 per cent) and business growth (12 per cent). Information was most likely to have been sought from accountants (24 per cent) and business networks/trade associations (15 per cent).
In England and Wales, 70 per cent of external strategic advice, and 34 per cent of external information, was delivered face-to-face.
The proportion that received strategic advice for three or more days was 25 per cent.
Fifty-one per cent of businesses with no employees in England and Wales that used strategic advice paid for it, an increase of four percentage points on 2015. The mean average paid was just above £5,000.
2 Information and strategic advice were split out in England and Wales, but not in Scotland and Northern Ireland.
8
Longitudinal Small Business Survey 2016: Businesses with no employees – cross-sectional report
Three per cent of zero-employee businesses in England and Wales had opportunities, difficulties or important information or advice needs that they did not get external advice or support for in the previous 12 months.
Working with the public sector
Seventeen per cent of businesses with no employees had worked for the public sector in the previous 12 months.
Six per cent of businesses with no employees had expressed an interest in a public sector contract in the previous 12 months. Four per cent had bid for a contract in this period.
Future plans
Forty-four per cent of businesses with no employees aimed to grow the sales of their businesses over the next three years. This was three percentage points less than in 2015.
Thirteen per cent of businesses with no employees anticipated the closure of their business in the next five years, while a further five per cent anticipated the full transfer of ownership. These were similar proportions to those seen in 2015.
In terms of planned growth-related activities over the next three years, 35 per cent of zero-employee businesses planned to increase their skills, 25 per cent planned to develop and launch new products or services, and 23 per cent planned to introduce new working practices. These proportions were down five to seven percentage points on those observed in 2015.
Steve Lomax, Emma Parry, Paul Braidford, June Wiseman, BMG Research Ltd,
June 2017.
9
Longitudinal Small Business Survey 2016: Businesses with no employees – cross-sectional report
2. Introduction
Aims of the survey
This report sets out the key findings from the Longitudinal Small Business Survey (LSBS) Year 2, a large-scale telephone survey of 9,248 owners and managers of SMEs, commissioned by the Department for Business, Energy and Industrial Strategy (BEIS). This survey is the latest in a series of annual and biennial Small Business Surveys (SBS) dating back to 2003. The survey on this occasion was conducted between August 2016 and January 2017 by BMG Research Ltd.
The Year 2 (2016) LSBS follows from the Year 1 (2015) LSBS, which was the largest SBS yet undertaken, comprising 15,502 interviews. The main reason for this large sample size was to allow the survey to have a longitudinal tracking element, establishing a ‘panel’ of businesses that might be re-surveyed in subsequent years. This allows a detailed analysis of how combinations of factors affect business performance. Any panel will have an element of attrition, hence the need for a large sample size in Year 1 which should result in a robust sample size for the Year Four and Five analyses.
Therefore, the large majority of those interviewed in Year 2 (2016) LSBS had also been interviewed in Year 1 (2015) LSBS: 7,279 in total. The other 1,969 interviewed were ‘top-ups’. These were needed for the following reasons:
• To represent sections of the SME population that were not active in the Year 1 survey, i.e. businesses less than one year old
• To represent sectors in the raw data that may be under-represented due to business closure, or the difficulty of securing an interview (e.g. in cases where businesses work away from their main offices)
• To increase the sample size in Scotland and Northern Ireland, to allow for meaningful analysis on a nation basis
• To ensure a robust sample size for the Year Four and Five analyses
There are three main reports based on Year 2 (2016) LSBS:
• A cross-sectional report based on SME employers. A cross-sectional report is a snap shot of the state of SMEs at any particular stage in time, this time being the latter half of 2016
• A cross-sectional report based on businesses with no employees (this one)
• A longitudinal report based on those that were SME employers in Year 1 (2015) LSBS. This looks at the main changes that apply to the ‘panelists’ from year to year, and what appears to influence these changes
10
Longitudinal Small Business Survey 2016: Businesses with no employees – cross-sectional report
The main aim of the cross-sectional survey is to collect a range of information on small businesses. The survey measures:
• The characteristics of Small and Medium-sized Enterprises (SMEs3) such as their type (number of sites, number of owners, whether they have separate business premises etc.)
• The characteristics of their owners and leaders
• Recent turnover and employment growth
• Capabilities (in terms of their ability to innovate, export, train staff, etc.)
• Experience of accessing finance
• Use of business support
• Expectations of growing turnover and employment
• The major obstacles that prevent SMEs fulfilling their potential
Survey method
Of the 15,502 CATI4 interviews conducted in Year 1 (2015) LSBS, 12,943 (83 per cent) agreed to a follow-up interview. The objective here was very simple, get as many interviews as possible from these ‘panellists’ in Year 2 (2016) LSBS. 7,279 were interviewed between August 2016 and January 2017 (56 per cent response rate). Of these, 5,596 were SME employers, 27 had become large businesses with 250+ employees, and the remainder (1,656) were zero-employee businesses.
In addition to these, 1,969 boost interviews were conducted, for reasons explained above. 1,301 of these interviews were with SME employers, and 668 were with zero-employee businesses. This made the total sample size for zero-employee businesses in Year 2 (2016) LSBS 2,324.
The top-ups were sampled using a method consistent with Year 1 (2015) LSBS:
• Within each of the four UK nations the sample was stratified. Targets were set according to the size of enterprises and, within those targets, for sector (SIC 2007)
• The targets over-represented businesses with five to 249 employees substantially in comparison to their actual numbers within the business population
3 Defined here as having fewer than 250 employees. 4 Computer Assisted Telephone Interviews.
11
Longitudinal Small Business Survey 2016: Businesses with no employees – cross-sectional report
• For registered businesses, the Inter Departmental Business Register (IDBR) was used as the sample source. For unregistered businesses with zero employees, Dun & Bradstreet’s database was used. Dun & Bradstreet contacts were screened out if it was found that they either had employees on their payroll or paid VAT, as these would have duplicated contacts found within the IDBR
• The IDBR is a record of all UK enterprises that pay VAT or PAYE. As such it has around 2.45 million entries, compared with the estimate from BIS’ Business Population Estimates (BPE), that there are around 5.5 million enterprises in the UK. The difference in the figures is explained by the number of unregistered enterprises that do not pay VAT or PAYE, estimates of which come from the Labour Force Survey (LFS). This is the reason why Dun & Bradstreet was retained as the source for top-up businesses with no employees, as it contains records for both registered and unregistered businesses
• The targets within the sample stratification matrix were informed by the 2015 BPE5, the latest available at the time. However, survey findings were weighted to the 2016 BPE6 which had become available towards the end of fieldwork. The 2016 BPE was used for weighting as it more properly represented the IDBR contacts used for the survey, as well as providing a more up-to-date picture of UK small businesses than the 2015 BPE
• A review of the Year 1 (2015) LSBS questionnaire was undertaken through consultations with stakeholders before Year 2 (2016) LSBS. This resulted in a substantial number of alterations to existing questions from previous SBS’s, new question additions and deletions. The changes were informed by the requirement to balance stakeholders’ emergent needs with the desire to exploit the longitudinal power of the survey. The consultation was followed up by an extensive round of 15 cognitive tests and a ‘live’ pilot of 100 interviews of the adjusted 2016 questionnaire
Note on the report Please note that the findings presented in this report relate to businesses with no employees only - SME employers have been excluded from the dataset on which this report is based. This procedure is consistent with reporting of previous SBS’s. The overall sample size for businesses with no employees across the UK in 2016 (Year 2) was 2,324. A separate report relating to SME employers is also available.
Registered zero employee businesses are those that appear in the IDBR, i.e. they are registered for VAT, but not PAYE. Unregistered businesses are those that are not registered for VAT, and had no employees on their payroll at the time of the interview.
The changes made to LSBS in terms of questionnaire design mean that there are some limitations on time series comparisons that can be made. In this report, these are only presented where the changes made were unlikely to have made a material difference to comparability over time.
5 www.gov.uk/government/statistics/business-population-estimates-2015. The figures were drawn from a combination of the Inter Departmental Business Register (IDBR) which contains all businesses operating VAT or PAYE schemes or which were registered at Companies House and the household survey-based Labour Force Survey (LFS) which is the main source for estimating the number of the self-employed and very small businesses. 6 www.gov.uk/government/statistics/business-population-estimates-2016. Method of data collection as above.
12
Longitudinal Small Business Survey 2016: Businesses with no employees – cross-sectional report
Statistical confidence
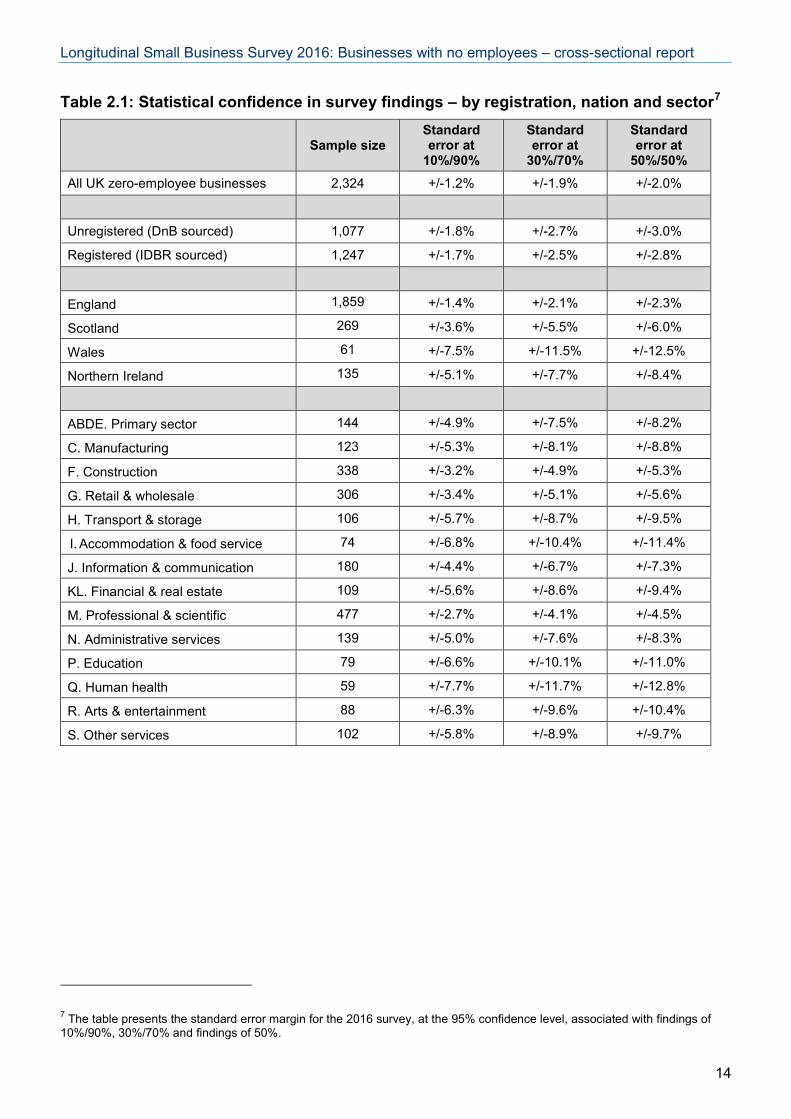
This overall sample is sufficiently large to allow reporting on findings with a high degree of statistical reliability. Most findings are reported in terms of differences between a sub-group (e.g. a particular employer status band or sector) and the overall finding. For example, a difference of just +/- 1.2% against the overall finding is statistically significant for findings in which 10% of businesses with no employees give one response and a difference of +/- 2.0% is statistically significant in cases where 50% of micro businesses give an answer. Table 2.1 overleaf shows the differences required between certain sub-groups and the overall total in order for findings to be statistically significant.
In the instances where comparisons can be made with the 2015 survey, at the overall level a difference of +/- 1.3% for a finding around 10/90% is enough to make it statistically significant, as is a difference of +/- 2.0% for a finding around 30/70% and as is a difference of +/- 2.2% for a finding around 50%.
Unless stated otherwise, all findings reported in bold in the tables were statistically significant, whether reported as a finding for a sub-group compared with the overall total, or as a Year 2 (2016) LSBS finding compared with Year 1 (2015) LSBS.
Please note that the figures in some tables may not add to 100 per cent due to rounding of percentages, or exclusion of ‘don’t know’ and/or ‘refused’ responses.
Although the 2016 survey provides generally robust findings for the population of businesses without employees overall and for many sub-groups, it should be noted that the achieved samples for some groups are smaller and the data relating to these smaller groups needs to be considered with some caution.
13
Longitudinal Small Business Survey 2016: Businesses with no employees – cross-sectional report
Table 2.1: Statistical confidence in survey findings – by registration, nation and sector7
Sample size Standard error at
10%/90%
Standard error at
30%/70%
Standard error at
50%/50% All UK zero-employee businesses 2,324 +/-1.2% +/-1.9% +/-2.0%
Unregistered (DnB sourced) 1,077 +/-1.8% +/-2.7% +/-3.0%
Registered (IDBR sourced) 1,247 +/-1.7% +/-2.5% +/-2.8%
England 1,859 +/-1.4% +/-2.1% +/-2.3%
Scotland 269 +/-3.6% +/-5.5% +/-6.0%
Wales 61 +/-7.5% +/-11.5% +/-12.5%
Northern Ireland 135 +/-5.1% +/-7.7% +/-8.4%
ABDE. Primary sector 144 +/-4.9% +/-7.5% +/-8.2%
C. Manufacturing 123 +/-5.3% +/-8.1% +/-8.8%
F. Construction 338 +/-3.2% +/-4.9% +/-5.3%
G. Retail & wholesale 306 +/-3.4% +/-5.1% +/-5.6%
H. Transport & storage 106 +/-5.7% +/-8.7% +/-9.5%
I. Accommodation & food service 74 +/-6.8% +/-10.4% +/-11.4%
J. Information & communication 180 +/-4.4% +/-6.7% +/-7.3%
KL. Financial & real estate 109 +/-5.6% +/-8.6% +/-9.4%
M. Professional & scientific 477 +/-2.7% +/-4.1% +/-4.5%
N. Administrative services 139 +/-5.0% +/-7.6% +/-8.3%
P. Education 79 +/-6.6% +/-10.1% +/-11.0%
Q. Human health 59 +/-7.7% +/-11.7% +/-12.8%
R. Arts & entertainment 88 +/-6.3% +/-9.6% +/-10.4%
S. Other services 102 +/-5.8% +/-8.9% +/-9.7%
7 The table presents the standard error margin for the 2016 survey, at the 95% confidence level, associated with findings of 10%/90%, 30%/70% and findings of 50%.
14
Longitudinal Small Business Survey 2016: Businesses with no employees – cross-sectional report
3. Profile of businesses This section explores the characteristics of businesses with no employees, for example in terms of their employer status, sector, legal status, age and the characteristics of their owners. LSBS Year 2 data is weighted8 to estimates derived from BEIS’ Business Population Estimates (BPE). For that reason, the data shown below on employer status and sector is drawn from the BPE rather than LSBS.
Employer status (based on BPE 2016)
The 2016 Business Population Estimates calculated that there were 5,497,670 businesses in the UK private sector. This was an increase of 108,220 on the 2015 estimates.
Seventy-six per cent of these businesses had no employees while the remaining 24 per cent are employers and therefore fall out of the scope of this report. The number, in 2016, of businesses with no employees was 4,178,229. This was an increase of 100,644 on the 2015 estimate.
The bulk of these (3,044,025, representing 55 per cent of all businesses) were unregistered businesses).
Businesses with no employees accounted for 17 per cent of all employment in the UK private sector, and seven per cent of all turnover.
Sector (based on BPE 2015)
Standard Industrial Classification (SIC) is used as a means of classifying business establishments by the type of economic activity in which they were engaged. It has been revised several times, the latest revision producing the SIC 2007 classification.
The most populous sectors among businesses with no employees in 2016 were construction (20 per cent) and professional/scientific (15 per cent).
8 See technical report for more detail on the weighting.
15
Longitudinal Small Business Survey 2016: Businesses with no employees – cross-sectional report
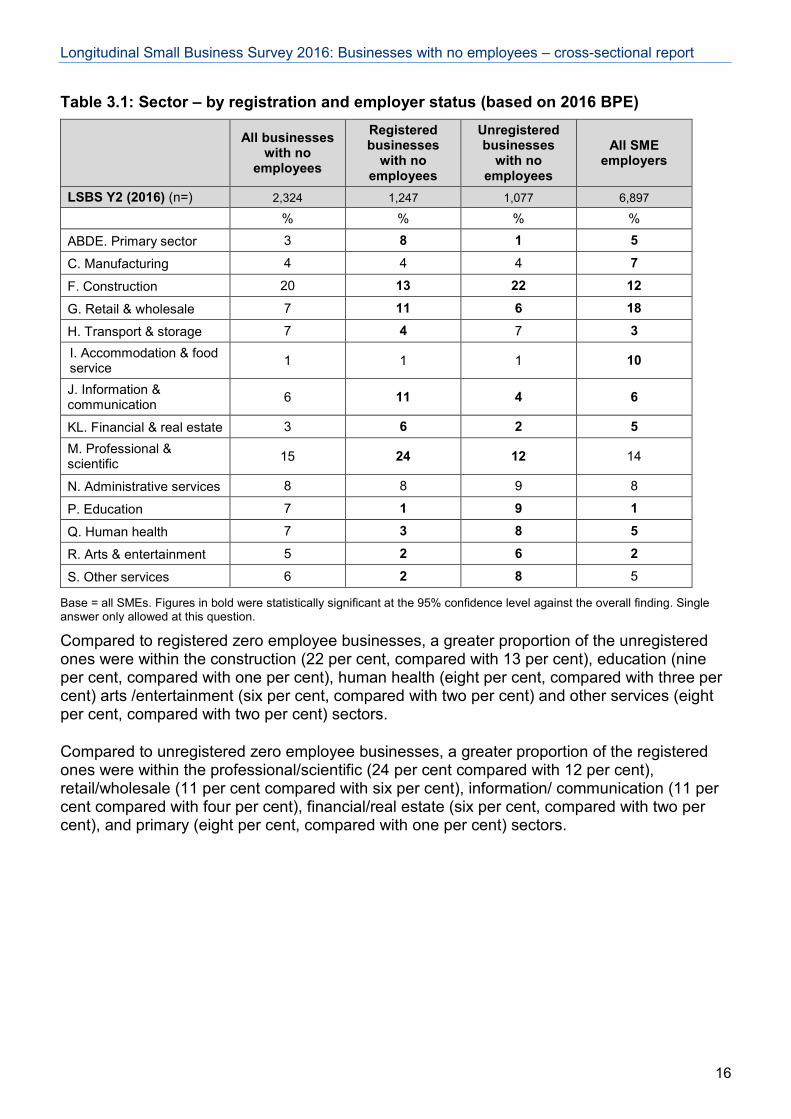
Table 3.1: Sector – by registration and employer status (based on 2016 BPE)
All businesses
with no employees
Registered businesses
with no employees
Unregistered businesses
with no employees
All SME employers
LSBS Y2 (2016) (n=) 2,324 1,247 1,077 6,897
% % % %
ABDE. Primary sector 3 8 1 5
C. Manufacturing 4 4 4 7
F. Construction 20 13 22 12
G. Retail & wholesale 7 11 6 18
H. Transport & storage 7 4 7 3 I. Accommodation & food service 1 1 1 10
J. Information & communication 6 11 4 6
KL. Financial & real estate 3 6 2 5 M. Professional & scientific 15 24 12 14
N. Administrative services 8 8 9 8
P. Education 7 1 9 1
Q. Human health 7 3 8 5
R. Arts & entertainment 5 2 6 2
S. Other services 6 2 8 5
Base = all SMEs. Figures in bold were statistically significant at the 95% confidence level against the overall finding. Single answer only allowed at this question.
Compared to registered zero employee businesses, a greater proportion of the unregistered ones were within the construction (22 per cent, compared with 13 per cent), education (nine per cent, compared with one per cent), human health (eight per cent, compared with three per cent) arts /entertainment (six per cent, compared with two per cent) and other services (eight per cent, compared with two per cent) sectors.
Compared to unregistered zero employee businesses, a greater proportion of the registered ones were within the professional/scientific (24 per cent compared with 12 per cent), retail/wholesale (11 per cent compared with six per cent), information/ communication (11 per cent compared with four per cent), financial/real estate (six per cent, compared with two per cent), and primary (eight per cent, compared with one per cent) sectors.
16
Longitudinal Small Business Survey 2016: Businesses with no employees – cross-sectional report
Number of sites
From this point forward in this report, all results are based on the Year 2 (2016) LSBS (rather than, as above, on Business Population Estimates). Where possible, comparisons are made with Year 1 (2015) LSBS.
In 2016, 94 per cent of businesses with no employees operated from a single site (93 per cent in 2015). This compared with 86 per cent of SME employers.
Whether business premises are somebody’s home
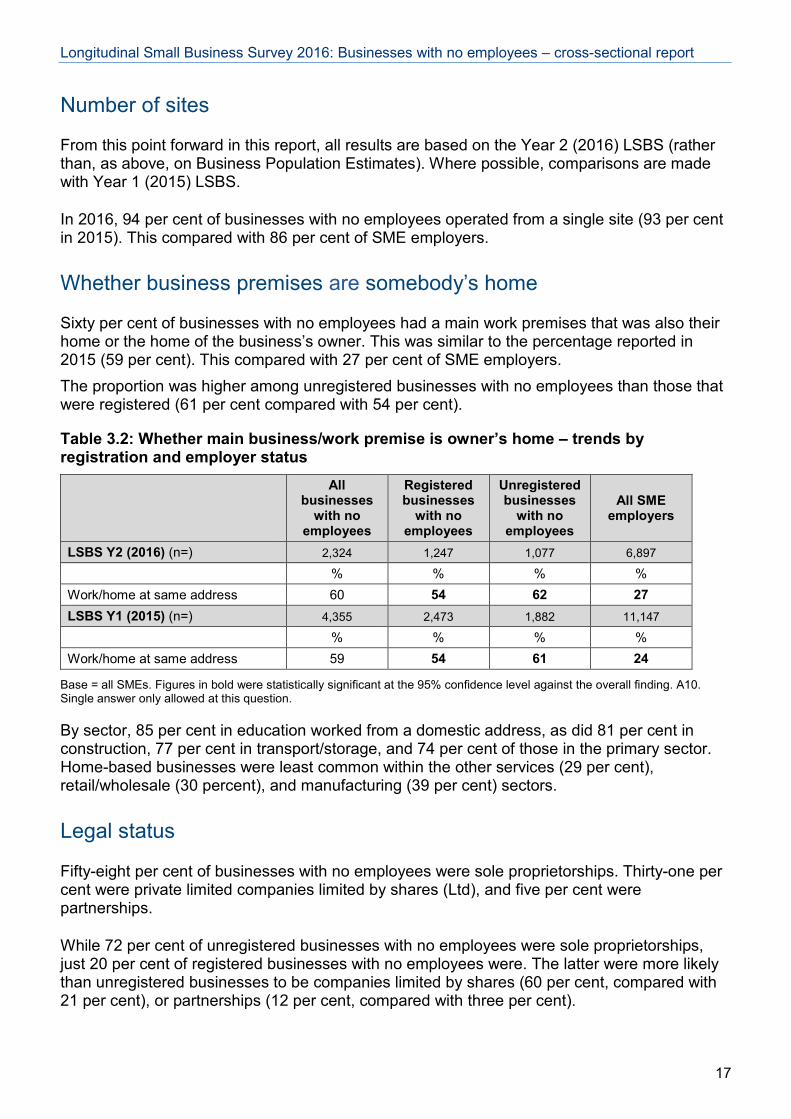
Sixty per cent of businesses with no employees had a main work premises that was also their home or the home of the business’s owner. This was similar to the percentage reported in 2015 (59 per cent). This compared with 27 per cent of SME employers. The proportion was higher among unregistered businesses with no employees than those that were registered (61 per cent compared with 54 per cent).
Table 3.2: Whether main business/work premise is owner’s home – trends by registration and employer status
All businesses
with no employees
Registered businesses
with no employees
Unregistered businesses
with no employees
All SME employers
LSBS Y2 (2016) (n=) 2,324 1,247 1,077 6,897
% % % % Work/home at same address 60 54 62 27 LSBS Y1 (2015) (n=) 4,355 2,473 1,882 11,147
% % % % Work/home at same address 59 54 61 24
Base = all SMEs. Figures in bold were statistically significant at the 95% confidence level against the overall finding. A10. Single answer only allowed at this question.
By sector, 85 per cent in education worked from a domestic address, as did 81 per cent in construction, 77 per cent in transport/storage, and 74 per cent of those in the primary sector. Home-based businesses were least common within the other services (29 per cent), retail/wholesale (30 percent), and manufacturing (39 per cent) sectors.
Legal status
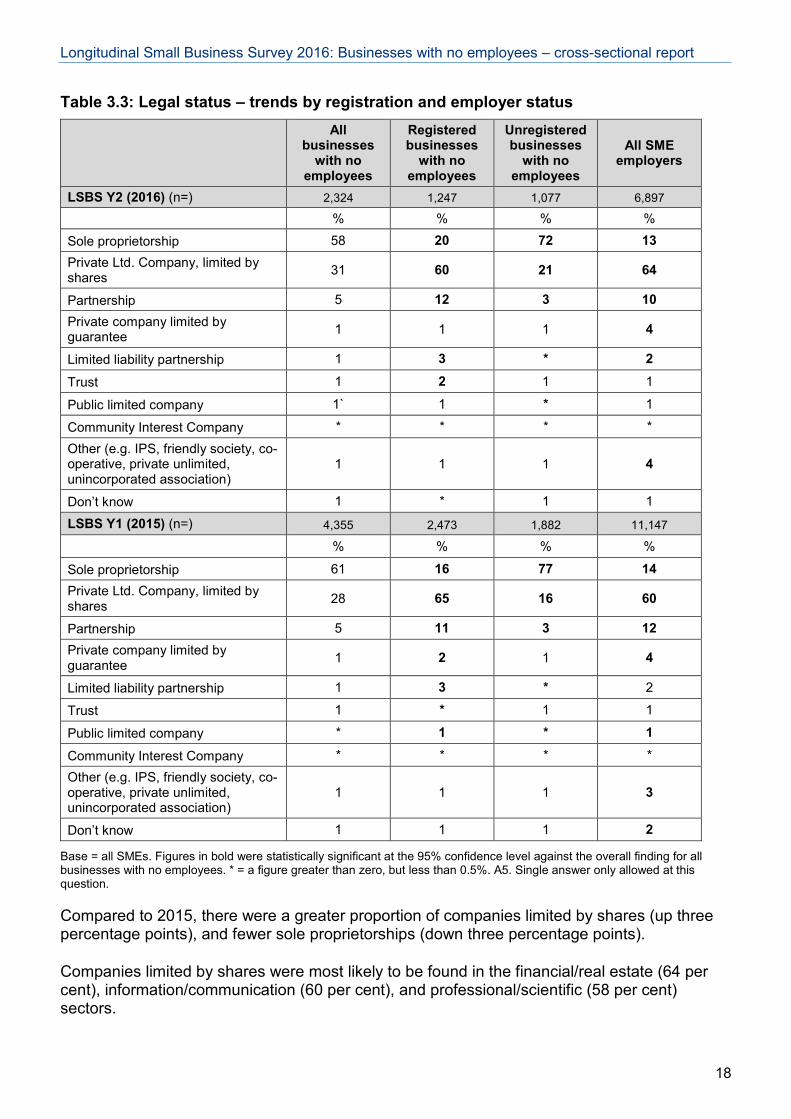
Fifty-eight per cent of businesses with no employees were sole proprietorships. Thirty-one per cent were private limited companies limited by shares (Ltd), and five per cent were partnerships.
While 72 per cent of unregistered businesses with no employees were sole proprietorships, just 20 per cent of registered businesses with no employees were. The latter were more likely than unregistered businesses to be companies limited by shares (60 per cent, compared with 21 per cent), or partnerships (12 per cent, compared with three per cent).
17
Longitudinal Small Business Survey 2016: Businesses with no employees – cross-sectional report
Table 3.3: Legal status – trends by registration and employer status
All businesses
with no employees
Registered businesses
with no employees
Unregistered businesses
with no employees
All SME employers
LSBS Y2 (2016) (n=) 2,324 1,247 1,077 6,897
% % % %
Sole proprietorship 58 20 72 13 Private Ltd. Company, limited by shares 31 60 21 64
Partnership 5 12 3 10 Private company limited by guarantee 1 1 1 4
Limited liability partnership 1 3 * 2
Trust 1 2 1 1
Public limited company 1` 1 * 1
Community Interest Company * * * * Other (e.g. IPS, friendly society, co-operative, private unlimited, unincorporated association)
1 1 1 4
Don’t know 1 * 1 1
LSBS Y1 (2015) (n=) 4,355 2,473 1,882 11,147
% % % %
Sole proprietorship 61 16 77 14 Private Ltd. Company, limited by shares 28 65 16 60
Partnership 5 11 3 12 Private company limited by guarantee 1 2 1 4
Limited liability partnership 1 3 * 2
Trust 1 * 1 1
Public limited company * 1 * 1
Community Interest Company * * * * Other (e.g. IPS, friendly society, co-operative, private unlimited, unincorporated association)
1 1 1 3
Don’t know 1 1 1 2
Base = all SMEs. Figures in bold were statistically significant at the 95% confidence level against the overall finding for all businesses with no employees. * = a figure greater than zero, but less than 0.5%. A5. Single answer only allowed at this question.
Compared to 2015, there were a greater proportion of companies limited by shares (up three percentage points), and fewer sole proprietorships (down three percentage points).
Companies limited by shares were most likely to be found in the financial/real estate (64 per cent), information/communication (60 per cent), and professional/scientific (58 per cent) sectors.
18
Longitudinal Small Business Survey 2016: Businesses with no employees – cross-sectional report
Sole proprietorships were most likely to be found in the transport/storage (81 per cent) and education (78 per cent) sectors.
Partnerships were most likely to be found in the primary (45 per cent) and accommodation/ food service (25 per cent) sectors.
Registered charity status
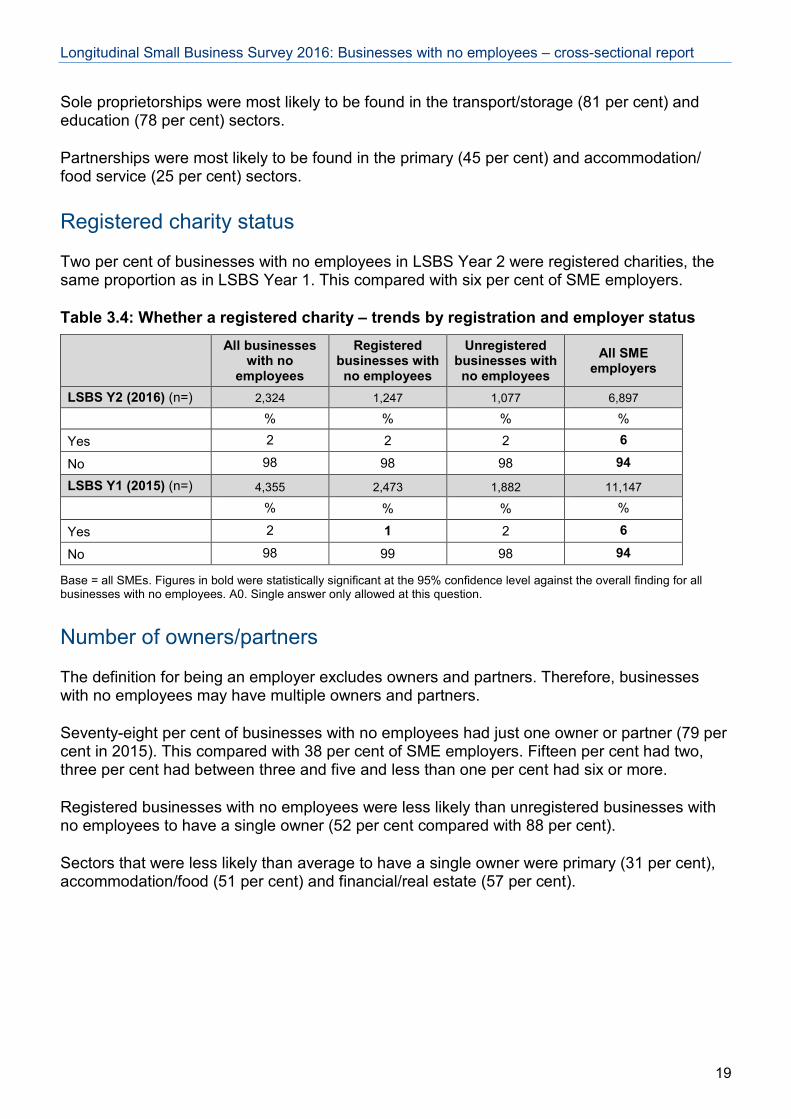
Two per cent of businesses with no employees in LSBS Year 2 were registered charities, the same proportion as in LSBS Year 1. This compared with six per cent of SME employers.
Table 3.4: Whether a registered charity – trends by registration and employer status
All businesses
with no employees
Registered businesses with no employees
Unregistered businesses with no employees
All SME employers
LSBS Y2 (2016) (n=) 2,324 1,247 1,077 6,897
% % % %
Yes 2 2 2 6
No 98 98 98 94
LSBS Y1 (2015) (n=) 4,355 2,473 1,882 11,147
% % % %
Yes 2 1 2 6
No 98 99 98 94
Base = all SMEs. Figures in bold were statistically significant at the 95% confidence level against the overall finding for all businesses with no employees. A0. Single answer only allowed at this question.
Number of owners/partners
The definition for being an employer excludes owners and partners. Therefore, businesses with no employees may have multiple owners and partners.
Seventy-eight per cent of businesses with no employees had just one owner or partner (79 per cent in 2015). This compared with 38 per cent of SME employers. Fifteen per cent had two, three per cent had between three and five and less than one per cent had six or more.
Registered businesses with no employees were less likely than unregistered businesses with no employees to have a single owner (52 per cent compared with 88 per cent).
Sectors that were less likely than average to have a single owner were primary (31 per cent), accommodation/food (51 per cent) and financial/real estate (57 per cent).
19
Longitudinal Small Business Survey 2016: Businesses with no employees – cross-sectional report
Family-owned businesses
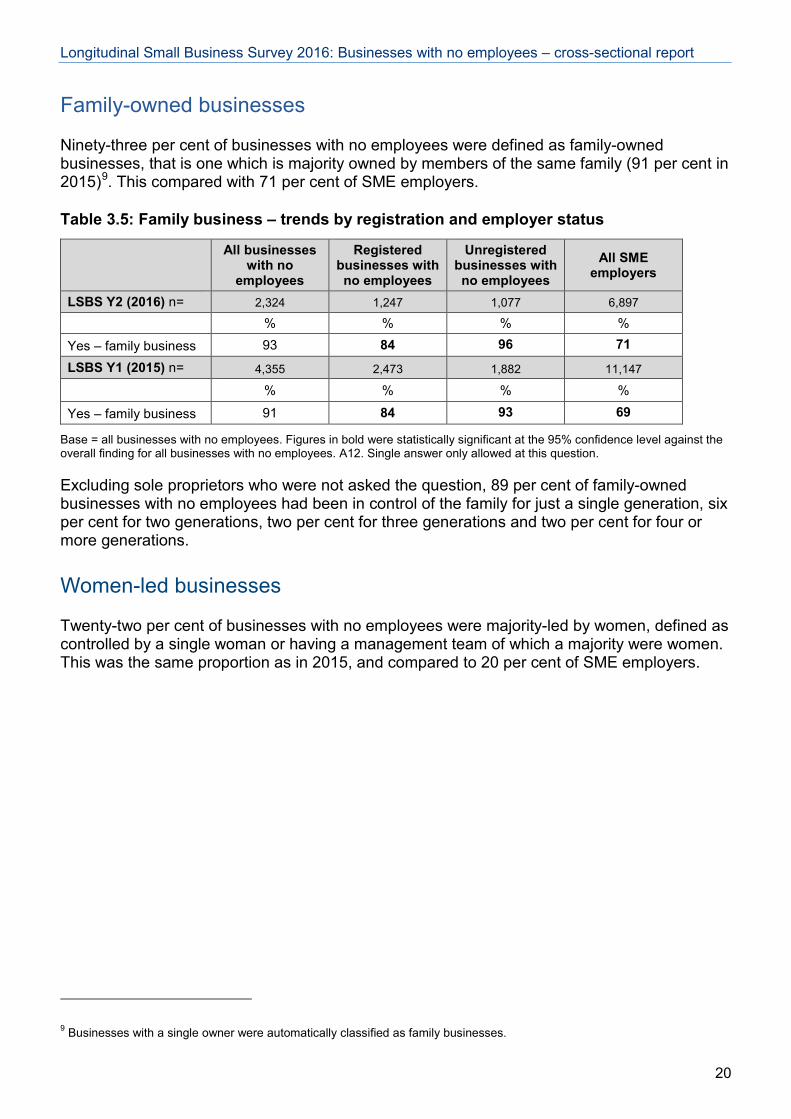
Ninety-three per cent of businesses with no employees were defined as family-owned businesses, that is one which is majority owned by members of the same family (91 per cent in 2015)9. This compared with 71 per cent of SME employers.
Table 3.5: Family business – trends by registration and employer status
All businesses
with no employees
Registered businesses with no employees
Unregistered businesses with no employees
All SME employers
LSBS Y2 (2016) n= 2,324 1,247 1,077 6,897
% % % %
Yes – family business 93 84 96 71
LSBS Y1 (2015) n= 4,355 2,473 1,882 11,147
% % % %
Yes – family business 91 84 93 69
Base = all businesses with no employees. Figures in bold were statistically significant at the 95% confidence level against the overall finding for all businesses with no employees. A12. Single answer only allowed at this question.
Excluding sole proprietors who were not asked the question, 89 per cent of family-owned businesses with no employees had been in control of the family for just a single generation, six per cent for two generations, two per cent for three generations and two per cent for four or more generations.
Women-led businesses
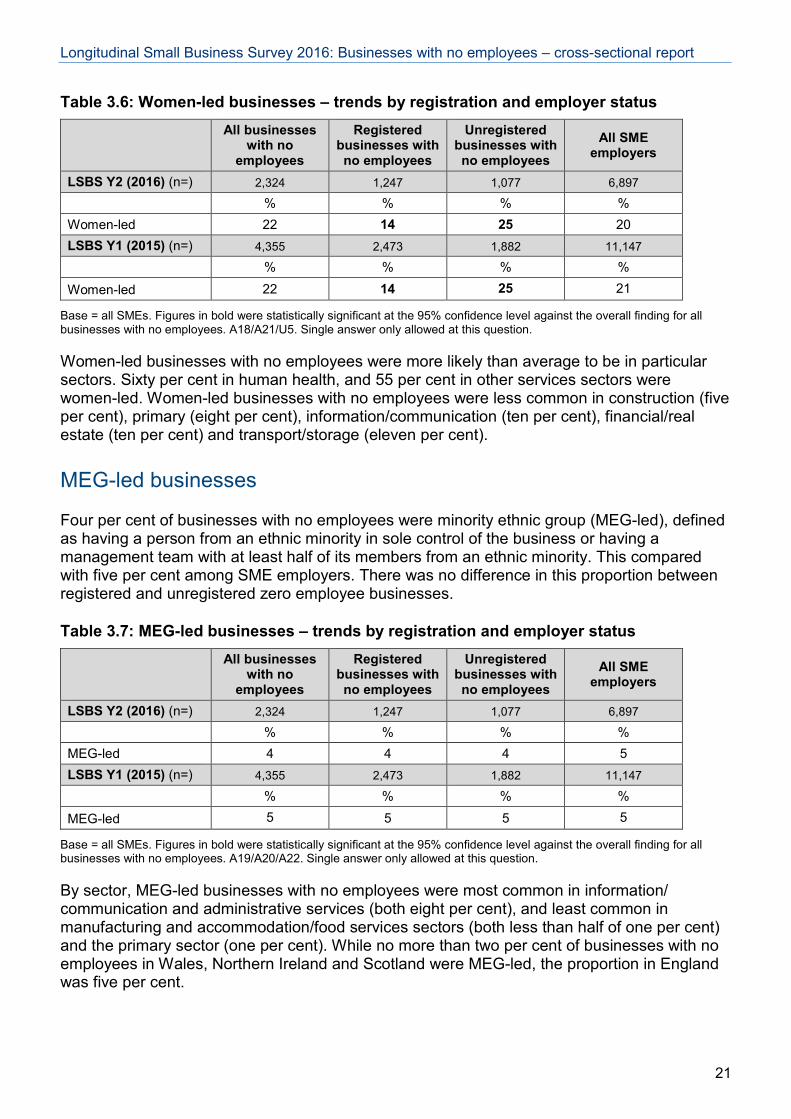
Twenty-two per cent of businesses with no employees were majority-led by women, defined as controlled by a single woman or having a management team of which a majority were women. This was the same proportion as in 2015, and compared to 20 per cent of SME employers.
9 Businesses with a single owner were automatically classified as family businesses.
20
Longitudinal Small Business Survey 2016: Businesses with no employees – cross-sectional report
Table 3.6: Women-led businesses – trends by registration and employer status
All businesses
with no employees
Registered businesses with no employees
Unregistered businesses with no employees
All SME employers
LSBS Y2 (2016) (n=) 2,324 1,247 1,077 6,897
% % % % Women-led 22 14 25 20 LSBS Y1 (2015) (n=) 4,355 2,473 1,882 11,147
% % % %
Women-led 22 14 25 21
Base = all SMEs. Figures in bold were statistically significant at the 95% confidence level against the overall finding for all businesses with no employees. A18/A21/U5. Single answer only allowed at this question.
Women-led businesses with no employees were more likely than average to be in particular sectors. Sixty per cent in human health, and 55 per cent in other services sectors were women-led. Women-led businesses with no employees were less common in construction (five per cent), primary (eight per cent), information/communication (ten per cent), financial/real estate (ten per cent) and transport/storage (eleven per cent).
MEG-led businesses
Four per cent of businesses with no employees were minority ethnic group (MEG-led), defined as having a person from an ethnic minority in sole control of the business or having a management team with at least half of its members from an ethnic minority. This compared with five per cent among SME employers. There was no difference in this proportion between registered and unregistered zero employee businesses.
Table 3.7: MEG-led businesses – trends by registration and employer status
All businesses
with no employees
Registered businesses with no employees
Unregistered businesses with no employees
All SME employers
LSBS Y2 (2016) (n=) 2,324 1,247 1,077 6,897
% % % % MEG-led 4 4 4 5 LSBS Y1 (2015) (n=) 4,355 2,473 1,882 11,147
% % % %
MEG-led 5 5 5 5
Base = all SMEs. Figures in bold were statistically significant at the 95% confidence level against the overall finding for all businesses with no employees. A19/A20/A22. Single answer only allowed at this question.
By sector, MEG-led businesses with no employees were most common in information/ communication and administrative services (both eight per cent), and least common in manufacturing and accommodation/food services sectors (both less than half of one per cent) and the primary sector (one per cent). While no more than two per cent of businesses with no employees in Wales, Northern Ireland and Scotland were MEG-led, the proportion in England was five per cent.
21
Longitudinal Small Business Survey 2016: Businesses with no employees – cross-sectional report
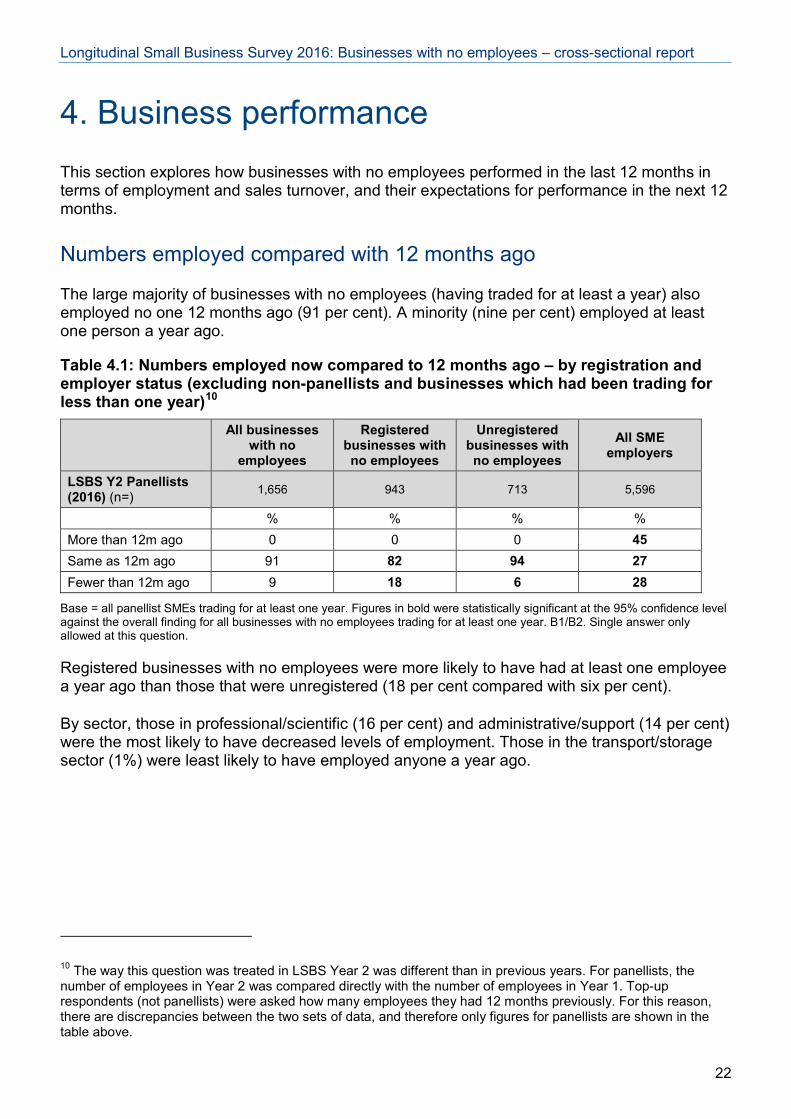
4. Business performance This section explores how businesses with no employees performed in the last 12 months in terms of employment and sales turnover, and their expectations for performance in the next 12 months.
Numbers employed compared with 12 months ago
The large majority of businesses with no employees (having traded for at least a year) also employed no one 12 months ago (91 per cent). A minority (nine per cent) employed at least one person a year ago.
Table 4.1: Numbers employed now compared to 12 months ago – by registration and employer status (excluding non-panellists and businesses which had been trading for less than one year)10
All businesses
with no employees
Registered businesses with no employees
Unregistered businesses with no employees
All SME employers
LSBS Y2 Panellists (2016) (n=) 1,656 943 713 5,596
% % % % More than 12m ago 0 0 0 45 Same as 12m ago 91 82 94 27 Fewer than 12m ago 9 18 6 28
Base = all panellist SMEs trading for at least one year. Figures in bold were statistically significant at the 95% confidence level against the overall finding for all businesses with no employees trading for at least one year. B1/B2. Single answer only allowed at this question.
Registered businesses with no employees were more likely to have had at least one employee a year ago than those that were unregistered (18 per cent compared with six per cent).
By sector, those in professional/scientific (16 per cent) and administrative/support (14 per cent) were the most likely to have decreased levels of employment. Those in the transport/storage sector (1%) were least likely to have employed anyone a year ago.
10 The way this question was treated in LSBS Year 2 was different than in previous years. For panellists, the number of employees in Year 2 was compared directly with the number of employees in Year 1. Top-up respondents (not panellists) were asked how many employees they had 12 months previously. For this reason, there are discrepancies between the two sets of data, and therefore only figures for panellists are shown in the table above.
22
Longitudinal Small Business Survey 2016: Businesses with no employees – cross-sectional report
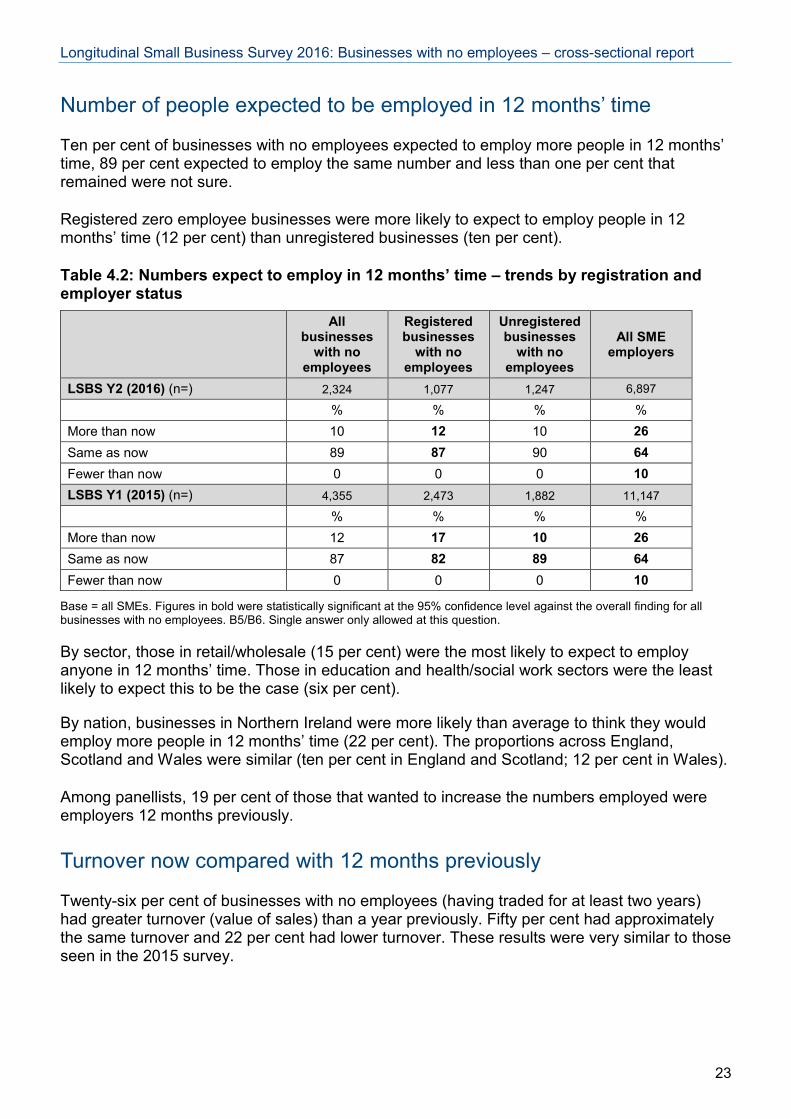
Number of people expected to be employed in 12 months’ time
Ten per cent of businesses with no employees expected to employ more people in 12 months’ time, 89 per cent expected to employ the same number and less than one per cent that remained were not sure.
Registered zero employee businesses were more likely to expect to employ people in 12 months’ time (12 per cent) than unregistered businesses (ten per cent).
Table 4.2: Numbers expect to employ in 12 months’ time – trends by registration and employer status
All businesses
with no employees
Registered businesses
with no employees
Unregistered businesses
with no employees
All SME employers
LSBS Y2 (2016) (n=) 2,324 1,077 1,247 6,897
% % % % More than now 10 12 10 26 Same as now 89 87 90 64 Fewer than now 0 0 0 10 LSBS Y1 (2015) (n=) 4,355 2,473 1,882 11,147
% % % % More than now 12 17 10 26 Same as now 87 82 89 64 Fewer than now 0 0 0 10
Base = all SMEs. Figures in bold were statistically significant at the 95% confidence level against the overall finding for all businesses with no employees. B5/B6. Single answer only allowed at this question.
By sector, those in retail/wholesale (15 per cent) were the most likely to expect to employ anyone in 12 months’ time. Those in education and health/social work sectors were the least likely to expect this to be the case (six per cent).
By nation, businesses in Northern Ireland were more likely than average to think they would employ more people in 12 months’ time (22 per cent). The proportions across England, Scotland and Wales were similar (ten per cent in England and Scotland; 12 per cent in Wales).
Among panellists, 19 per cent of those that wanted to increase the numbers employed were employers 12 months previously.
Turnover now compared with 12 months previously
Twenty-six per cent of businesses with no employees (having traded for at least two years) had greater turnover (value of sales) than a year previously. Fifty per cent had approximately the same turnover and 22 per cent had lower turnover. These results were very similar to those seen in the 2015 survey.
23
Longitudinal Small Business Survey 2016: Businesses with no employees – cross-sectional report
Table 4.3: Turnover now compared to 12 months previously – trends by registration and employer status (excluding businesses that have been trading for less than two years)
All businesses
with no employees
Registered businesses with no employees
Unregistered businesses with no employees
All SME employers
LSBS Y2 (2016) (n=) 2,280 1,228 1,052 6,854
% % % % Turnover greater now 26 26 26 34 Same as before 50 47 51 44 Turnover lower now 22 25 21 20 LSBS Y1 (2015) (n=) 4,263 2,416 1,847 10,973
% % % % Turnover greater now 25 29 23 38 Same as before 50 44 51 41 Turnover lower now 23 25 22 17
Base = all SMEs trading for at least two years. Figures in bold were statistically significant at the 95% confidence level against the overall finding for all businesses with no employees. P2. Single answer only allowed at this question.
By sector, businesses more likely than average to report a higher turnover were those in accommodation/food (37 per cent) and professional/scientific (30 per cent) sectors. Less likely than average to report a higher turnover were those in primary sectors (16 per cent).
Expectations of turnover in 12 months’ time
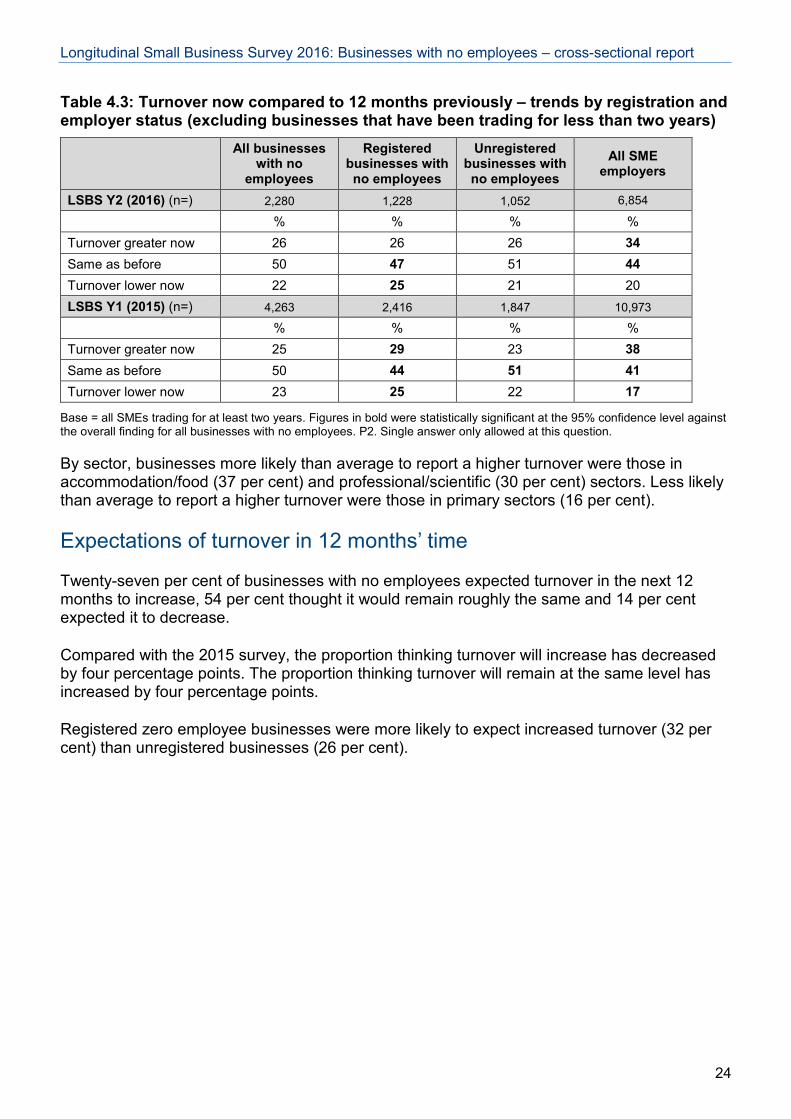
Twenty-seven per cent of businesses with no employees expected turnover in the next 12 months to increase, 54 per cent thought it would remain roughly the same and 14 per cent expected it to decrease.
Compared with the 2015 survey, the proportion thinking turnover will increase has decreased by four percentage points. The proportion thinking turnover will remain at the same level has increased by four percentage points.
Registered zero employee businesses were more likely to expect increased turnover (32 per cent) than unregistered businesses (26 per cent).
24
Longitudinal Small Business Survey 2016: Businesses with no employees – cross-sectional report
Table 4.4: Expectations of turnover in 12 months’ time – trends by registration and employer status
All businesses
with no employees
Registered businesses
with no employees
Unregistered businesses
with no employees
All SME employers
LSBS Y2 (2016) (n=) 2,324 1,247 1,077 6,897
% % % % More than now 27 32 26 40 Same as now 54 50 56 47 Less than now 14 14 14 10 LSBS Y1 (2015) (n=) 4,355 2,473 1,882 11,147
% % % % More than now 31 35 30 45 Same as now 50 47 50 43 Less than now 13 14 13 8
Base = all SMEs. Figures in bold were statistically significant at the 95% confidence level against the overall finding for all businesses with no employees. P7. Single answer only allowed at this question.
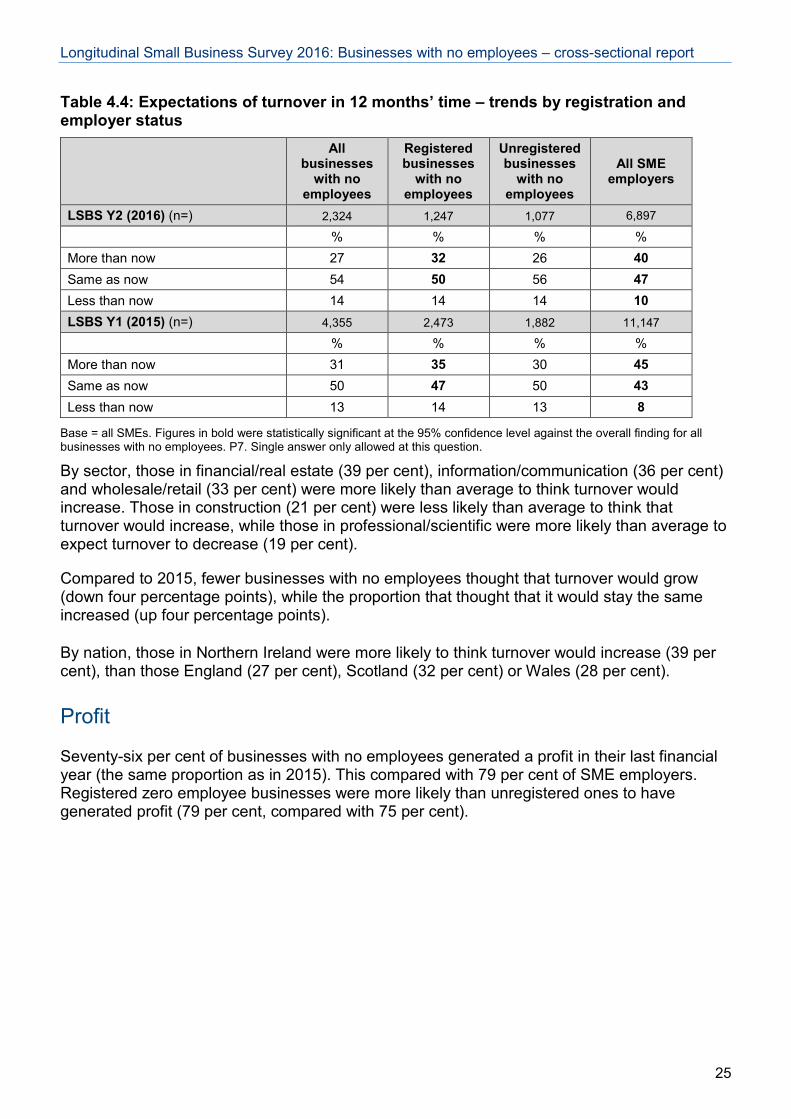
By sector, those in financial/real estate (39 per cent), information/communication (36 per cent) and wholesale/retail (33 per cent) were more likely than average to think turnover would increase. Those in construction (21 per cent) were less likely than average to think that turnover would increase, while those in professional/scientific were more likely than average to expect turnover to decrease (19 per cent).
Compared to 2015, fewer businesses with no employees thought that turnover would grow (down four percentage points), while the proportion that thought that it would stay the same increased (up four percentage points).
By nation, those in Northern Ireland were more likely to think turnover would increase (39 per cent), than those England (27 per cent), Scotland (32 per cent) or Wales (28 per cent).
Profit
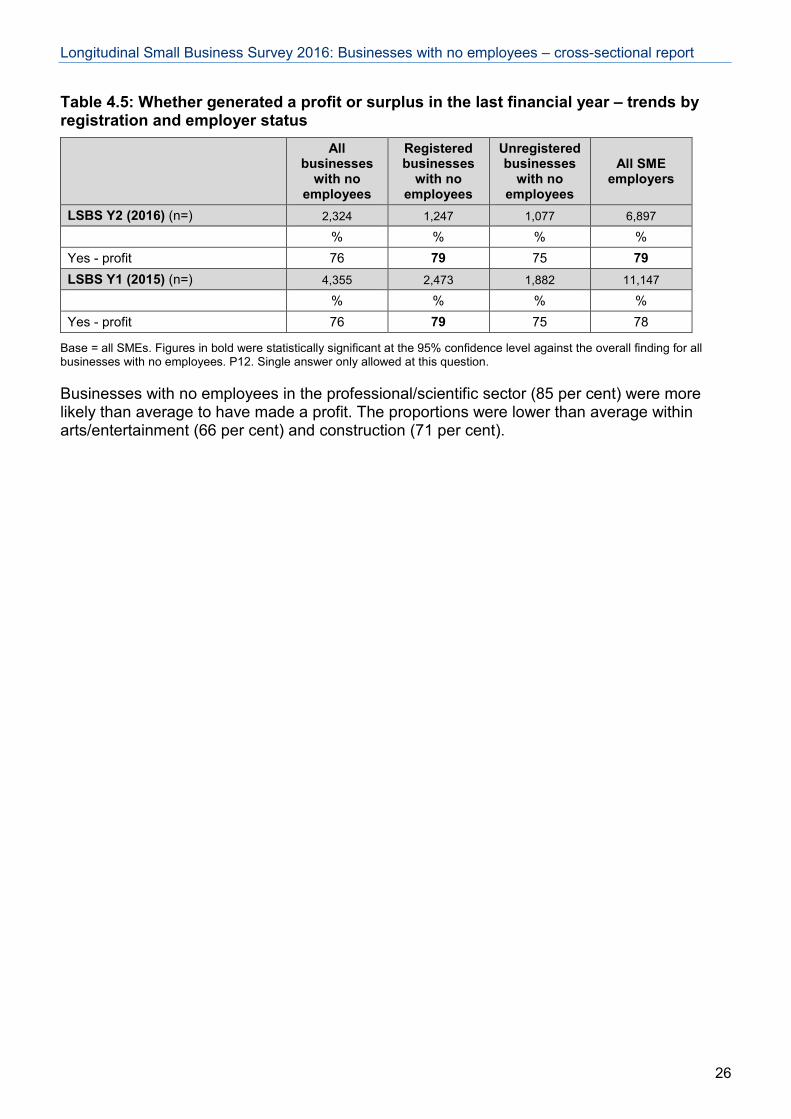
Seventy-six per cent of businesses with no employees generated a profit in their last financial year (the same proportion as in 2015). This compared with 79 per cent of SME employers. Registered zero employee businesses were more likely than unregistered ones to have generated profit (79 per cent, compared with 75 per cent).
25
Longitudinal Small Business Survey 2016: Businesses with no employees – cross-sectional report
Table 4.5: Whether generated a profit or surplus in the last financial year – trends by registration and employer status
All businesses
with no employees
Registered businesses
with no employees
Unregistered businesses
with no employees
All SME employers
LSBS Y2 (2016) (n=) 2,324 1,247 1,077 6,897
% % % % Yes - profit 76 79 75 79 LSBS Y1 (2015) (n=) 4,355 2,473 1,882 11,147
% % % % Yes - profit 76 79 75 78
Base = all SMEs. Figures in bold were statistically significant at the 95% confidence level against the overall finding for all businesses with no employees. P12. Single answer only allowed at this question.
Businesses with no employees in the professional/scientific sector (85 per cent) were more likely than average to have made a profit. The proportions were lower than average within arts/entertainment (66 per cent) and construction (71 per cent).
26
Longitudinal Small Business Survey 2016: Businesses with no employees – cross-sectional report
5. Exporting This section deals with the export of goods or services outside of the UK: the proportions of businesses with no employees that export, and the percentage of their turnover gained from exports, who they export to, plans for increasing the level of exports, exporting for the first time, and reasons for not exporting.
Whether sold goods or services outside of the UK in the last 12 months
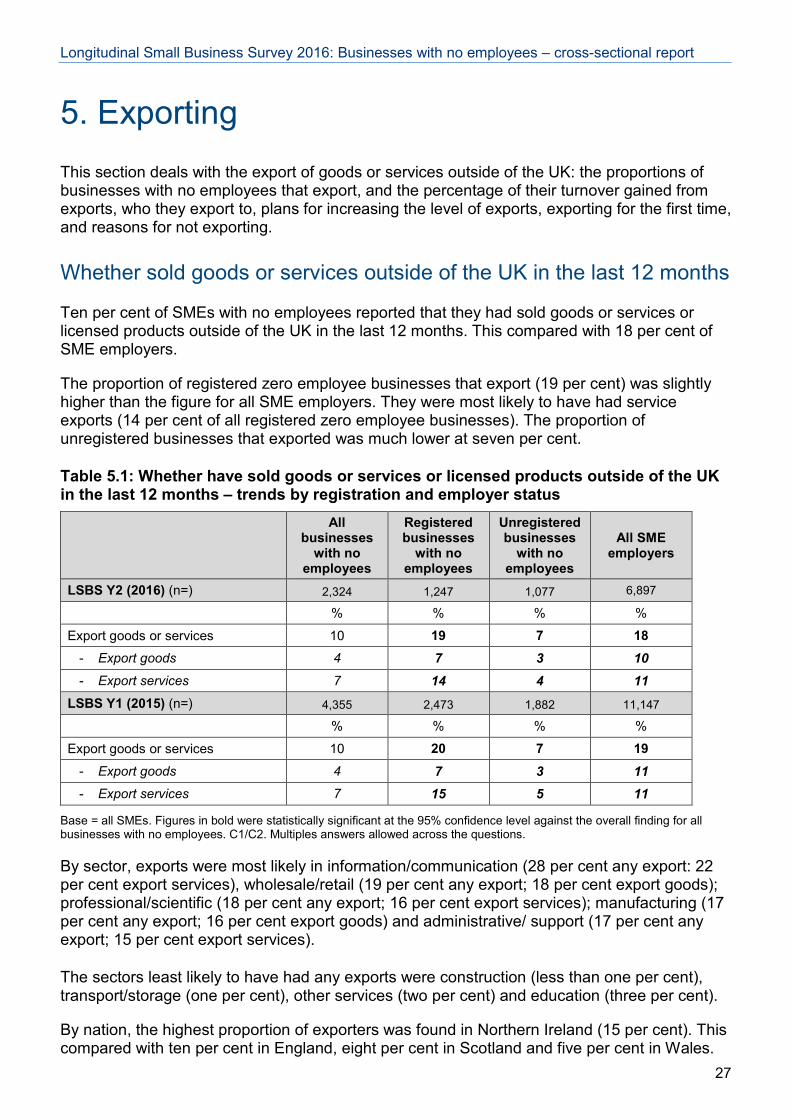
Ten per cent of SMEs with no employees reported that they had sold goods or services or licensed products outside of the UK in the last 12 months. This compared with 18 per cent of SME employers.
The proportion of registered zero employee businesses that export (19 per cent) was slightly higher than the figure for all SME employers. They were most likely to have had service exports (14 per cent of all registered zero employee businesses). The proportion of unregistered businesses that exported was much lower at seven per cent.
Table 5.1: Whether have sold goods or services or licensed products outside of the UK in the last 12 months – trends by registration and employer status
All businesses
with no employees
Registered businesses
with no employees
Unregistered businesses
with no employees
All SME employers
LSBS Y2 (2016) (n=) 2,324 1,247 1,077 6,897
% % % %
Export goods or services 10 19 7 18 - Export goods 4 7 3 10 - Export services 7 14 4 11
LSBS Y1 (2015) (n=) 4,355 2,473 1,882 11,147
% % % %
Export goods or services 10 20 7 19 - Export goods 4 7 3 11 - Export services 7 15 5 11
Base = all SMEs. Figures in bold were statistically significant at the 95% confidence level against the overall finding for all businesses with no employees. C1/C2. Multiples answers allowed across the questions.
By sector, exports were most likely in information/communication (28 per cent any export: 22 per cent export services), wholesale/retail (19 per cent any export; 18 per cent export goods); professional/scientific (18 per cent any export; 16 per cent export services); manufacturing (17 per cent any export; 16 per cent export goods) and administrative/ support (17 per cent any export; 15 per cent export services).
The sectors least likely to have had any exports were construction (less than one per cent), transport/storage (one per cent), other services (two per cent) and education (three per cent).
By nation, the highest proportion of exporters was found in Northern Ireland (15 per cent). This compared with ten per cent in England, eight per cent in Scotland and five per cent in Wales.
27
Longitudinal Small Business Survey 2016: Businesses with no employees – cross-sectional report
Where exported to in the last 12 months
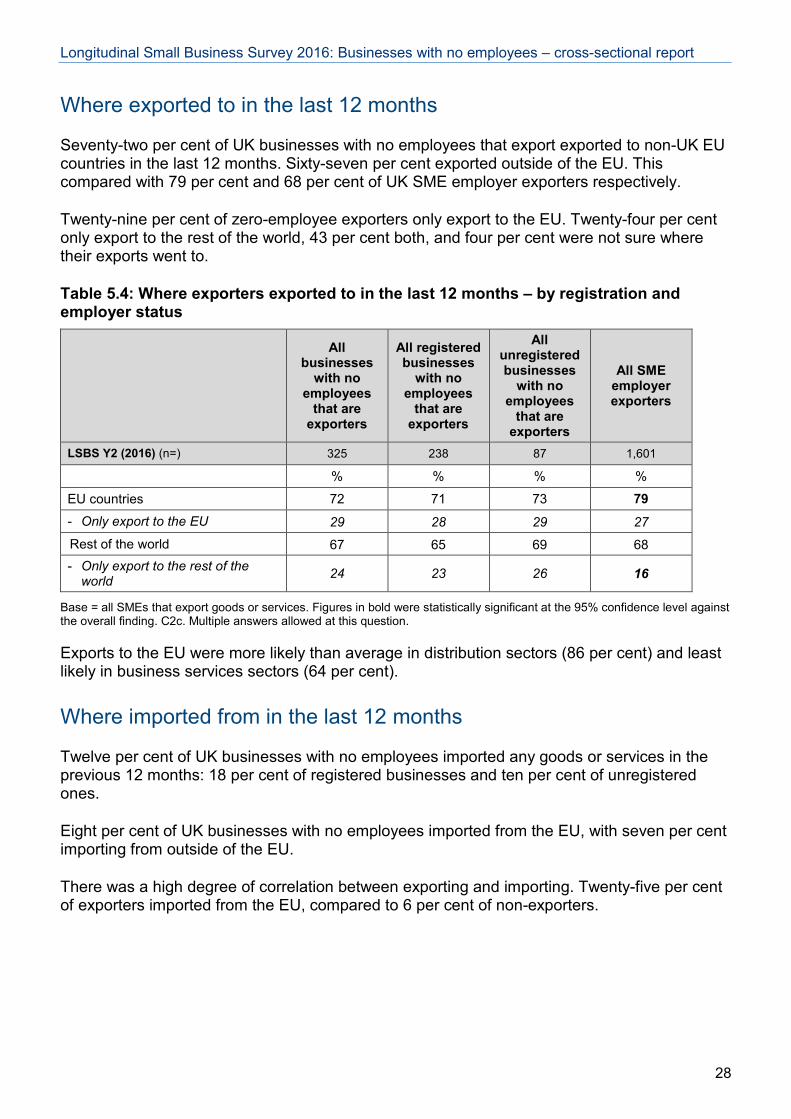
Seventy-two per cent of UK businesses with no employees that export exported to non-UK EU countries in the last 12 months. Sixty-seven per cent exported outside of the EU. This compared with 79 per cent and 68 per cent of UK SME employer exporters respectively.
Twenty-nine per cent of zero-employee exporters only export to the EU. Twenty-four per cent only export to the rest of the world, 43 per cent both, and four per cent were not sure where their exports went to.
Table 5.4: Where exporters exported to in the last 12 months – by registration and employer status
All businesses
with no employees
that are exporters
All registered businesses
with no employees
that are exporters
All unregistered businesses
with no employees
that are exporters
All SME employer exporters
LSBS Y2 (2016) (n=) 325 238 87 1,601
% % % %
EU countries 72 71 73 79 - Only export to the EU 29 28 29 27
Rest of the world 67 65 69 68 - Only export to the rest of the
world 24 23 26 16
Base = all SMEs that export goods or services. Figures in bold were statistically significant at the 95% confidence level against the overall finding. C2c. Multiple answers allowed at this question.
Exports to the EU were more likely than average in distribution sectors (86 per cent) and least likely in business services sectors (64 per cent).
Where imported from in the last 12 months
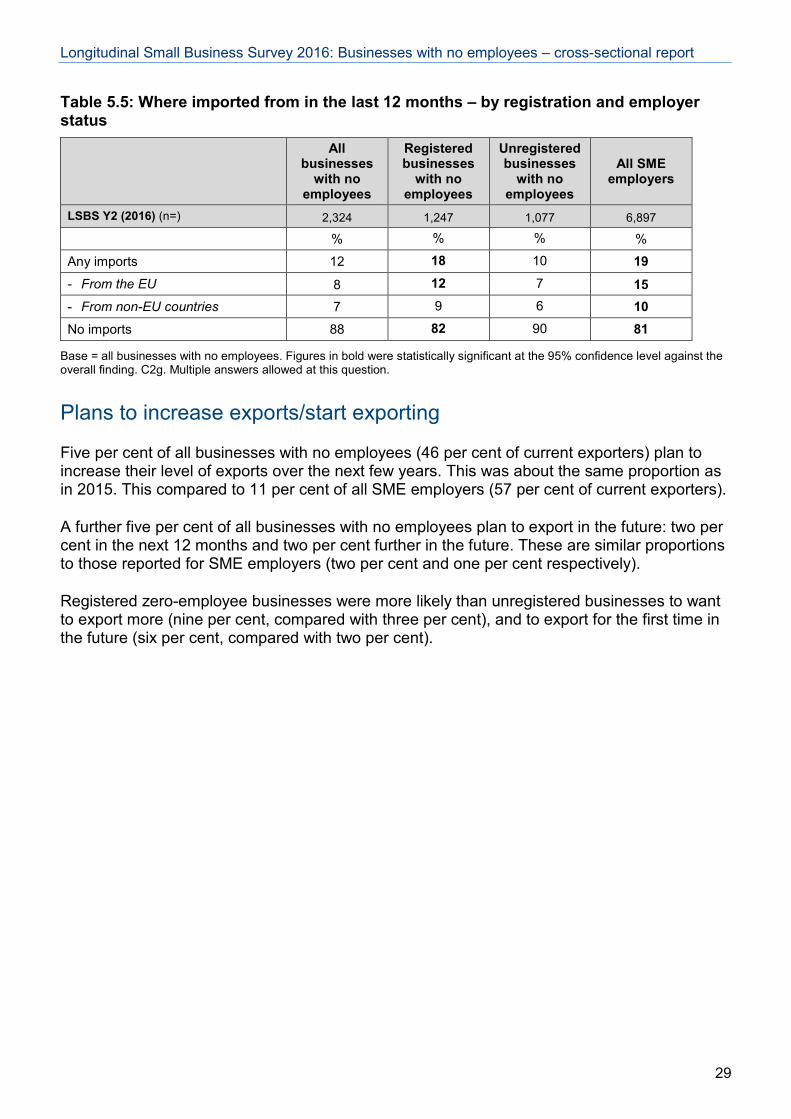
Twelve per cent of UK businesses with no employees imported any goods or services in the previous 12 months: 18 per cent of registered businesses and ten per cent of unregistered ones.
Eight per cent of UK businesses with no employees imported from the EU, with seven per cent importing from outside of the EU.
There was a high degree of correlation between exporting and importing. Twenty-five per cent of exporters imported from the EU, compared to 6 per cent of non-exporters.
28
Longitudinal Small Business Survey 2016: Businesses with no employees – cross-sectional report
Table 5.5: Where imported from in the last 12 months – by registration and employer status
All businesses
with no employees
Registered businesses
with no employees
Unregistered businesses
with no employees
All SME employers
LSBS Y2 (2016) (n=) 2,324 1,247 1,077 6,897
% % % %
Any imports 12 18 10 19 - From the EU 8 12 7 15 - From non-EU countries 7 9 6 10 No imports 88 82 90 81
Base = all businesses with no employees. Figures in bold were statistically significant at the 95% confidence level against the overall finding. C2g. Multiple answers allowed at this question.
Plans to increase exports/start exporting
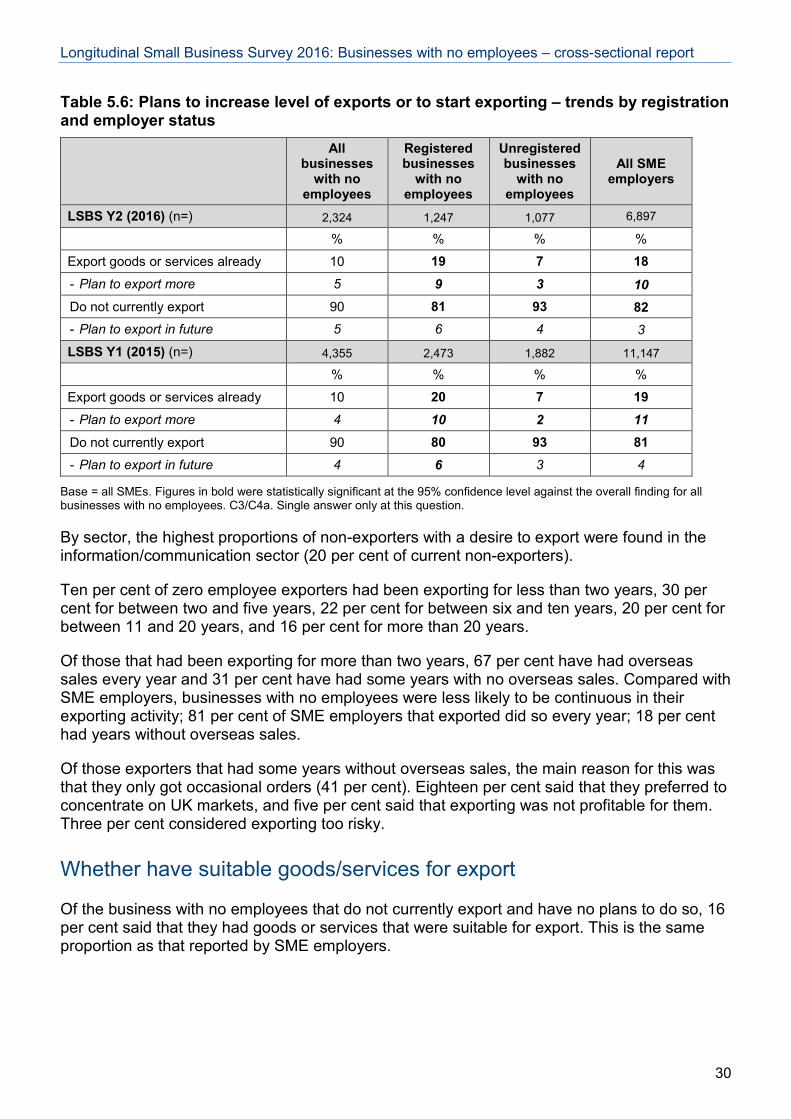
Five per cent of all businesses with no employees (46 per cent of current exporters) plan to increase their level of exports over the next few years. This was about the same proportion as in 2015. This compared to 11 per cent of all SME employers (57 per cent of current exporters).
A further five per cent of all businesses with no employees plan to export in the future: two per cent in the next 12 months and two per cent further in the future. These are similar proportions to those reported for SME employers (two per cent and one per cent respectively).
Registered zero-employee businesses were more likely than unregistered businesses to want to export more (nine per cent, compared with three per cent), and to export for the first time in the future (six per cent, compared with two per cent).
29
Longitudinal Small Business Survey 2016: Businesses with no employees – cross-sectional report
Table 5.6: Plans to increase level of exports or to start exporting – trends by registration and employer status
All businesses
with no employees
Registered businesses
with no employees
Unregistered businesses
with no employees
All SME employers
LSBS Y2 (2016) (n=) 2,324 1,247 1,077 6,897
% % % %
Export goods or services already 10 19 7 18 - Plan to export more 5 9 3 10 Do not currently export 90 81 93 82 - Plan to export in future 5 6 4 3
LSBS Y1 (2015) (n=) 4,355 2,473 1,882 11,147
% % % %
Export goods or services already 10 20 7 19 - Plan to export more 4 10 2 11 Do not currently export 90 80 93 81 - Plan to export in future 4 6 3 4
Base = all SMEs. Figures in bold were statistically significant at the 95% confidence level against the overall finding for all businesses with no employees. C3/C4a. Single answer only at this question.
By sector, the highest proportions of non-exporters with a desire to export were found in the information/communication sector (20 per cent of current non-exporters).
Ten per cent of zero employee exporters had been exporting for less than two years, 30 per cent for between two and five years, 22 per cent for between six and ten years, 20 per cent for between 11 and 20 years, and 16 per cent for more than 20 years.
Of those that had been exporting for more than two years, 67 per cent have had overseas sales every year and 31 per cent have had some years with no overseas sales. Compared with SME employers, businesses with no employees were less likely to be continuous in their exporting activity; 81 per cent of SME employers that exported did so every year; 18 per cent had years without overseas sales.
Of those exporters that had some years without overseas sales, the main reason for this was that they only got occasional orders (41 per cent). Eighteen per cent said that they preferred to concentrate on UK markets, and five per cent said that exporting was not profitable for them. Three per cent considered exporting too risky.
Whether have suitable goods/services for export
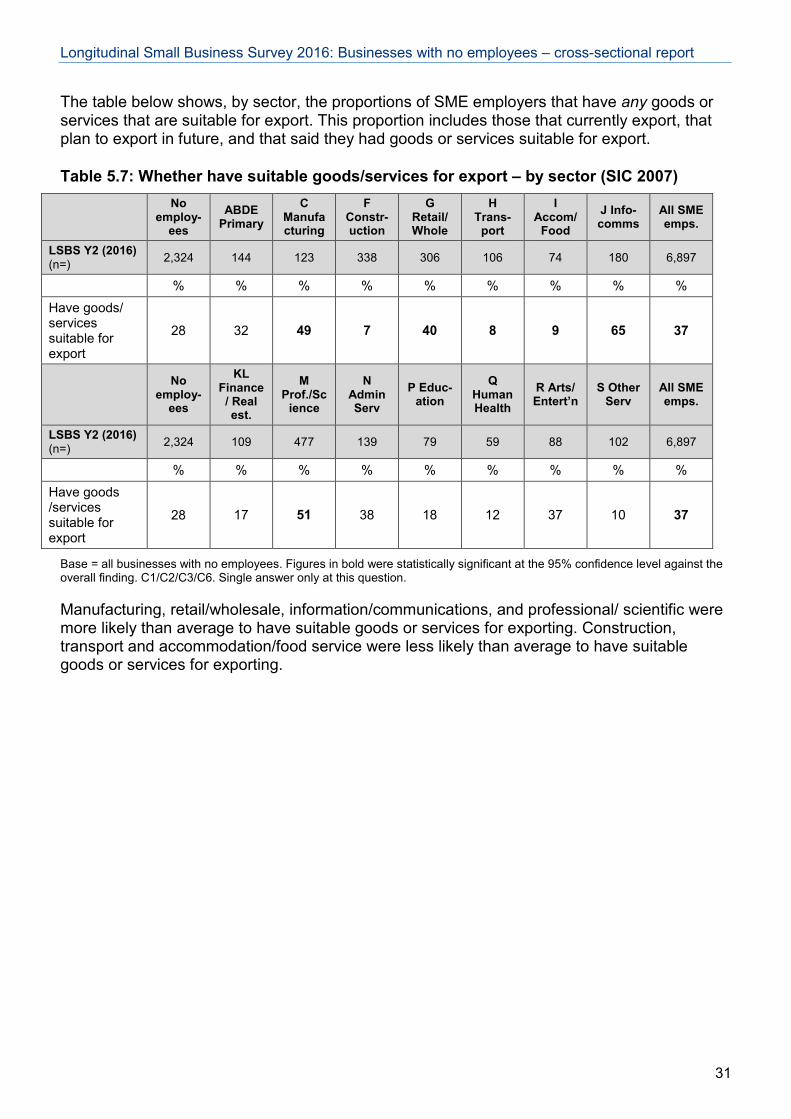
Of the business with no employees that do not currently export and have no plans to do so, 16 per cent said that they had goods or services that were suitable for export. This is the same proportion as that reported by SME employers.
30
Longitudinal Small Business Survey 2016: Businesses with no employees – cross-sectional report
The table below shows, by sector, the proportions of SME employers that have any goods or services that are suitable for export. This proportion includes those that currently export, that plan to export in future, and that said they had goods or services suitable for export.
Table 5.7: Whether have suitable goods/services for export – by sector (SIC 2007)
No
employ-ees
ABDE Primary
C Manufacturing
F Constr-uction
G Retail/ Whole
H Trans-
port
I Accom/
Food J Info-comms
All SME emps.
LSBS Y2 (2016) (n=) 2,324 144 123 338 306 106 74 180 6,897
% % % % % % % % % Have goods/ services suitable for export
28 32 49 7 40 8 9 65 37
No
employ-ees
KL Finance/ Real est.
M Prof./Sc
ience
N Admin Serv
P Educ-ation
Q Human Health
R Arts/ Entert’n
S Other Serv
All SME emps.
LSBS Y2 (2016) (n=) 2,324 109 477 139 79 59 88 102 6,897
% % % % % % % % % Have goods /services suitable for export
28 17 51 38 18 12 37 10 37
Base = all businesses with no employees. Figures in bold were statistically significant at the 95% confidence level against the overall finding. C1/C2/C3/C6. Single answer only at this question.
Manufacturing, retail/wholesale, information/communications, and professional/ scientific were more likely than average to have suitable goods or services for exporting. Construction, transport and accommodation/food service were less likely than average to have suitable goods or services for exporting.
31
Longitudinal Small Business Survey 2016: Businesses with no employees – cross-sectional report
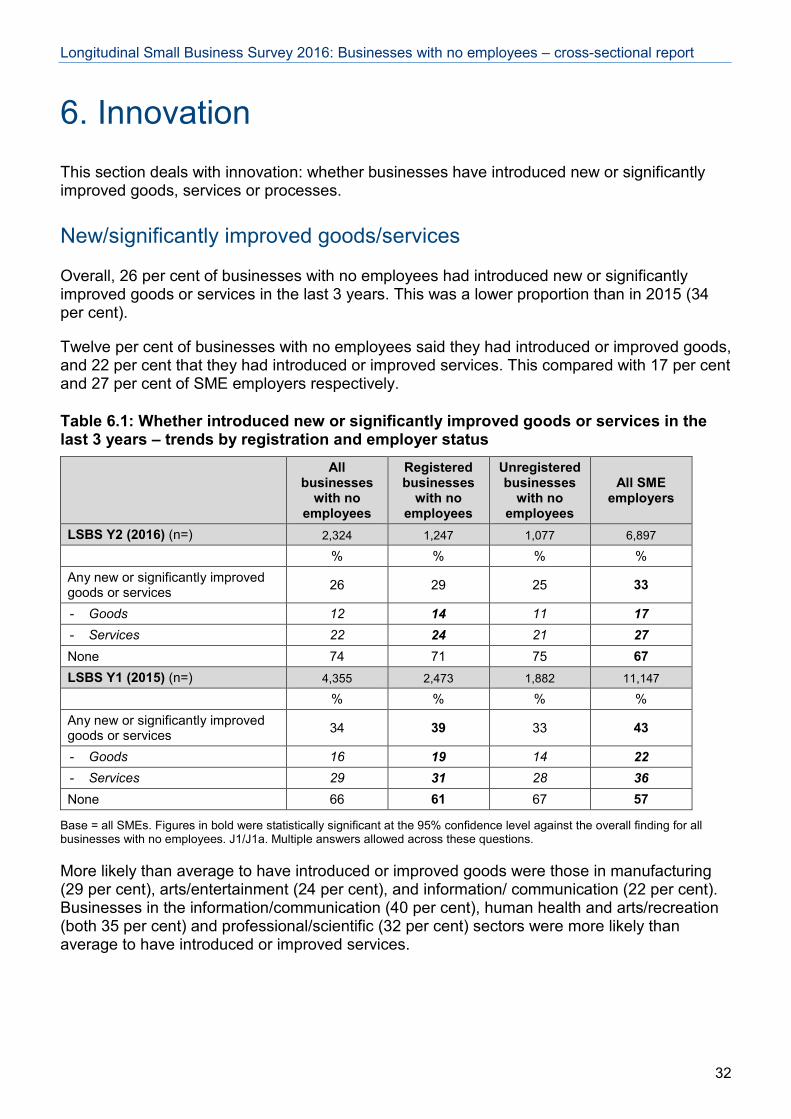
6. Innovation This section deals with innovation: whether businesses have introduced new or significantly improved goods, services or processes.
New/significantly improved goods/services
Overall, 26 per cent of businesses with no employees had introduced new or significantly improved goods or services in the last 3 years. This was a lower proportion than in 2015 (34 per cent).
Twelve per cent of businesses with no employees said they had introduced or improved goods, and 22 per cent that they had introduced or improved services. This compared with 17 per cent and 27 per cent of SME employers respectively.
Table 6.1: Whether introduced new or significantly improved goods or services in the last 3 years – trends by registration and employer status
All businesses
with no employees
Registered businesses
with no employees
Unregistered businesses
with no employees
All SME employers
LSBS Y2 (2016) (n=) 2,324 1,247 1,077 6,897
% % % % Any new or significantly improved goods or services 26 29 25 33
- Goods 12 14 11 17 - Services 22 24 21 27 None 74 71 75 67 LSBS Y1 (2015) (n=) 4,355 2,473 1,882 11,147
% % % % Any new or significantly improved goods or services 34 39 33 43
- Goods 16 19 14 22 - Services 29 31 28 36 None 66 61 67 57
Base = all SMEs. Figures in bold were statistically significant at the 95% confidence level against the overall finding for all businesses with no employees. J1/J1a. Multiple answers allowed across these questions.
More likely than average to have introduced or improved goods were those in manufacturing (29 per cent), arts/entertainment (24 per cent), and information/ communication (22 per cent). Businesses in the information/communication (40 per cent), human health and arts/recreation (both 35 per cent) and professional/scientific (32 per cent) sectors were more likely than average to have introduced or improved services.
32
Longitudinal Small Business Survey 2016: Businesses with no employees – cross-sectional report
Overall, the most innovative sectors, i.e. those most likely to have introduced or improved goods or services in the last three years, were information/communication (46 per cent), arts/recreation (43 per cent), manufacturing (36 per cent) and professional/scientific (34 per cent). Those sectors in which innovation was least likely were transport/storage (13 per cent) and construction (15 per cent).
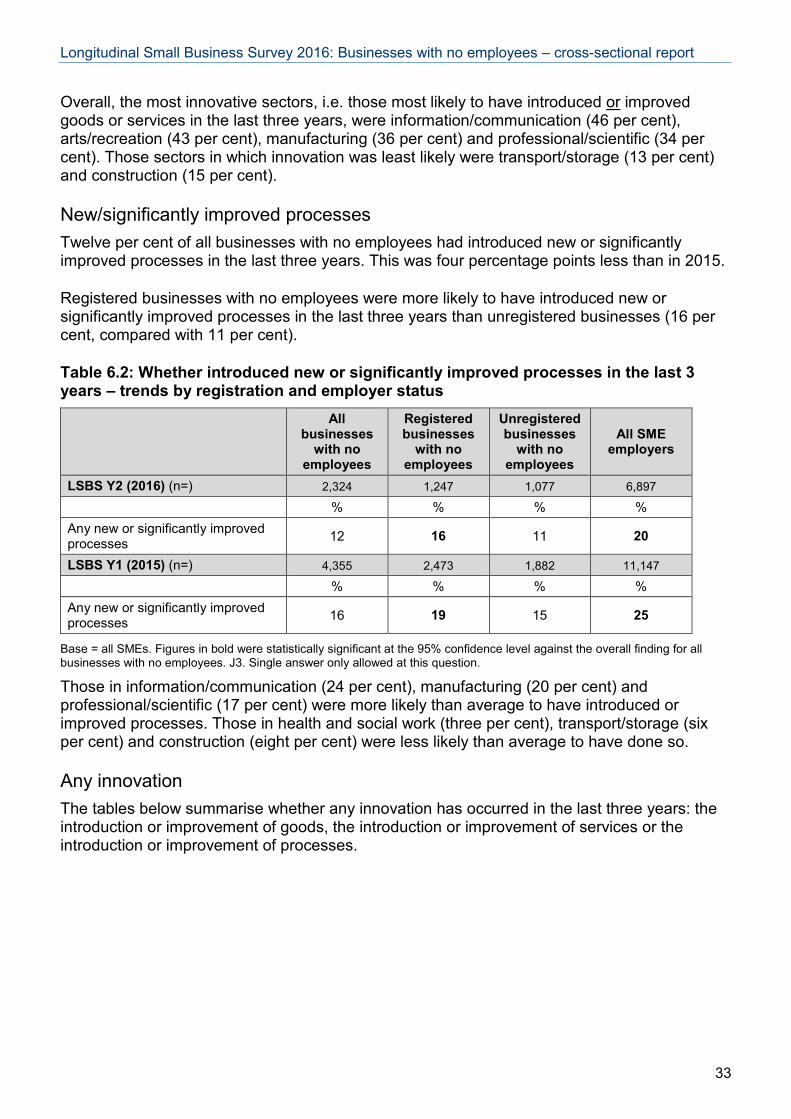
New/significantly improved processes Twelve per cent of all businesses with no employees had introduced new or significantly improved processes in the last three years. This was four percentage points less than in 2015.
Registered businesses with no employees were more likely to have introduced new or significantly improved processes in the last three years than unregistered businesses (16 per cent, compared with 11 per cent).
Table 6.2: Whether introduced new or significantly improved processes in the last 3 years – trends by registration and employer status
All businesses
with no employees
Registered businesses
with no employees
Unregistered businesses
with no employees
All SME employers
LSBS Y2 (2016) (n=) 2,324 1,247 1,077 6,897
% % % % Any new or significantly improved processes 12 16 11 20
LSBS Y1 (2015) (n=) 4,355 2,473 1,882 11,147
% % % % Any new or significantly improved processes 16 19 15 25
Base = all SMEs. Figures in bold were statistically significant at the 95% confidence level against the overall finding for all businesses with no employees. J3. Single answer only allowed at this question.
Those in information/communication (24 per cent), manufacturing (20 per cent) and professional/scientific (17 per cent) were more likely than average to have introduced or improved processes. Those in health and social work (three per cent), transport/storage (six per cent) and construction (eight per cent) were less likely than average to have done so.
Any innovation The tables below summarise whether any innovation has occurred in the last three years: the introduction or improvement of goods, the introduction or improvement of services or the introduction or improvement of processes.
33
Longitudinal Small Business Survey 2016: Businesses with no employees – cross-sectional report
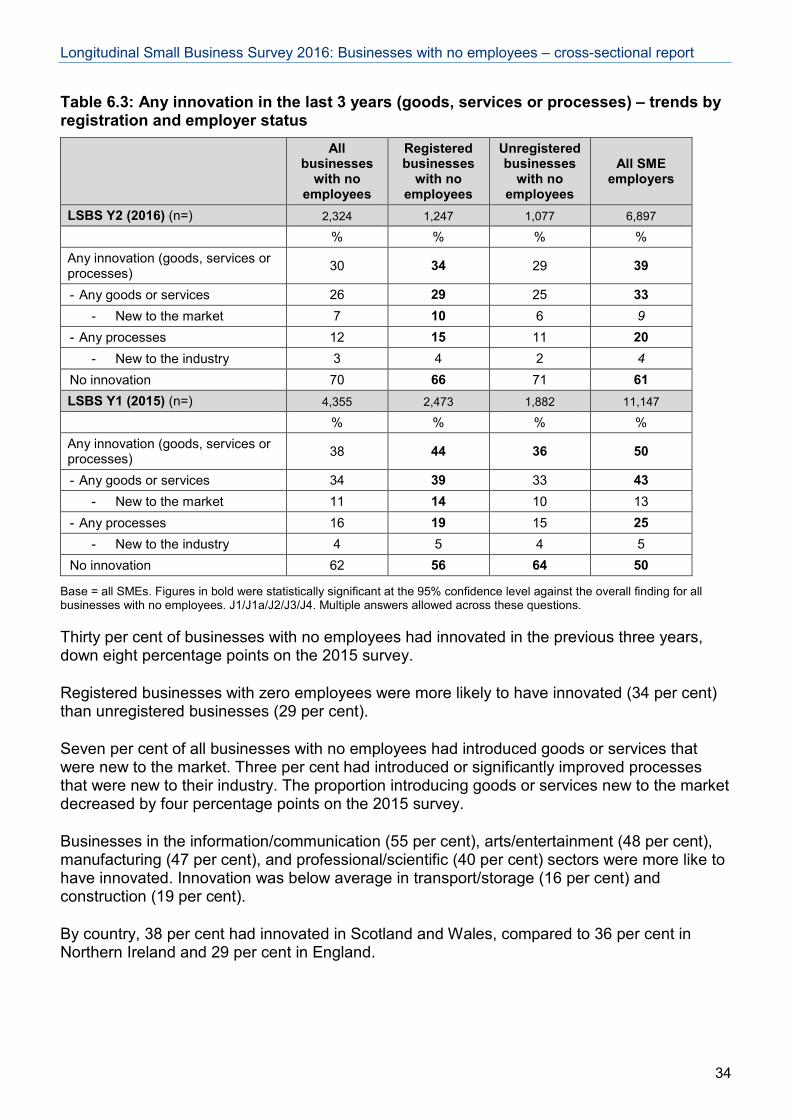
Table 6.3: Any innovation in the last 3 years (goods, services or processes) – trends by registration and employer status
All businesses
with no employees
Registered businesses
with no employees
Unregistered businesses
with no employees
All SME employers
LSBS Y2 (2016) (n=) 2,324 1,247 1,077 6,897
% % % % Any innovation (goods, services or processes) 30 34 29 39
- Any goods or services 26 29 25 33 - New to the market 7 10 6 9
- Any processes 12 15 11 20 - New to the industry 3 4 2 4
No innovation 70 66 71 61 LSBS Y1 (2015) (n=) 4,355 2,473 1,882 11,147
% % % % Any innovation (goods, services or processes) 38 44 36 50
- Any goods or services 34 39 33 43 - New to the market 11 14 10 13
- Any processes 16 19 15 25 - New to the industry 4 5 4 5
No innovation 62 56 64 50
Base = all SMEs. Figures in bold were statistically significant at the 95% confidence level against the overall finding for all businesses with no employees. J1/J1a/J2/J3/J4. Multiple answers allowed across these questions.
Thirty per cent of businesses with no employees had innovated in the previous three years, down eight percentage points on the 2015 survey.
Registered businesses with zero employees were more likely to have innovated (34 per cent) than unregistered businesses (29 per cent).
Seven per cent of all businesses with no employees had introduced goods or services that were new to the market. Three per cent had introduced or significantly improved processes that were new to their industry. The proportion introducing goods or services new to the market decreased by four percentage points on the 2015 survey.
Businesses in the information/communication (55 per cent), arts/entertainment (48 per cent), manufacturing (47 per cent), and professional/scientific (40 per cent) sectors were more like to have innovated. Innovation was below average in transport/storage (16 per cent) and construction (19 per cent).
By country, 38 per cent had innovated in Scotland and Wales, compared to 36 per cent in Northern Ireland and 29 per cent in England.
34
Longitudinal Small Business Survey 2016: Businesses with no employees – cross-sectional report
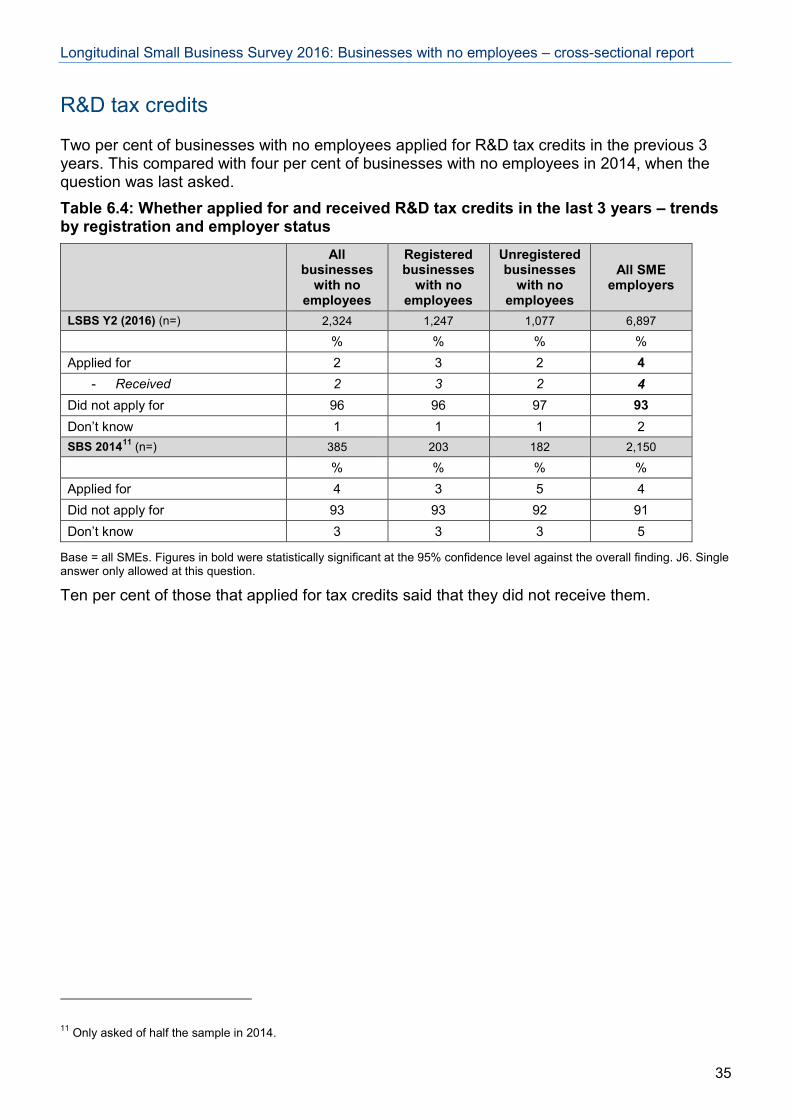
R&D tax credits
Two per cent of businesses with no employees applied for R&D tax credits in the previous 3 years. This compared with four per cent of businesses with no employees in 2014, when the question was last asked. Table 6.4: Whether applied for and received R&D tax credits in the last 3 years – trends by registration and employer status
All businesses
with no employees
Registered businesses
with no employees
Unregistered businesses
with no employees
All SME employers
LSBS Y2 (2016) (n=) 2,324 1,247 1,077 6,897
% % % % Applied for 2 3 2 4
- Received 2 3 2 4 Did not apply for 96 96 97 93 Don’t know 1 1 1 2 SBS 201411 (n=) 385 203 182 2,150
% % % % Applied for 4 3 5 4 Did not apply for 93 93 92 91 Don’t know 3 3 3 5
Base = all SMEs. Figures in bold were statistically significant at the 95% confidence level against the overall finding. J6. Single answer only allowed at this question.
Ten per cent of those that applied for tax credits said that they did not receive them.
11 Only asked of half the sample in 2014.
35
Longitudinal Small Business Survey 2016: Businesses with no employees – cross-sectional report
7. Access to external finance This section looks at the types of finance that are used, application for external finance, and success in receiving it.
Types of external finance currently being used
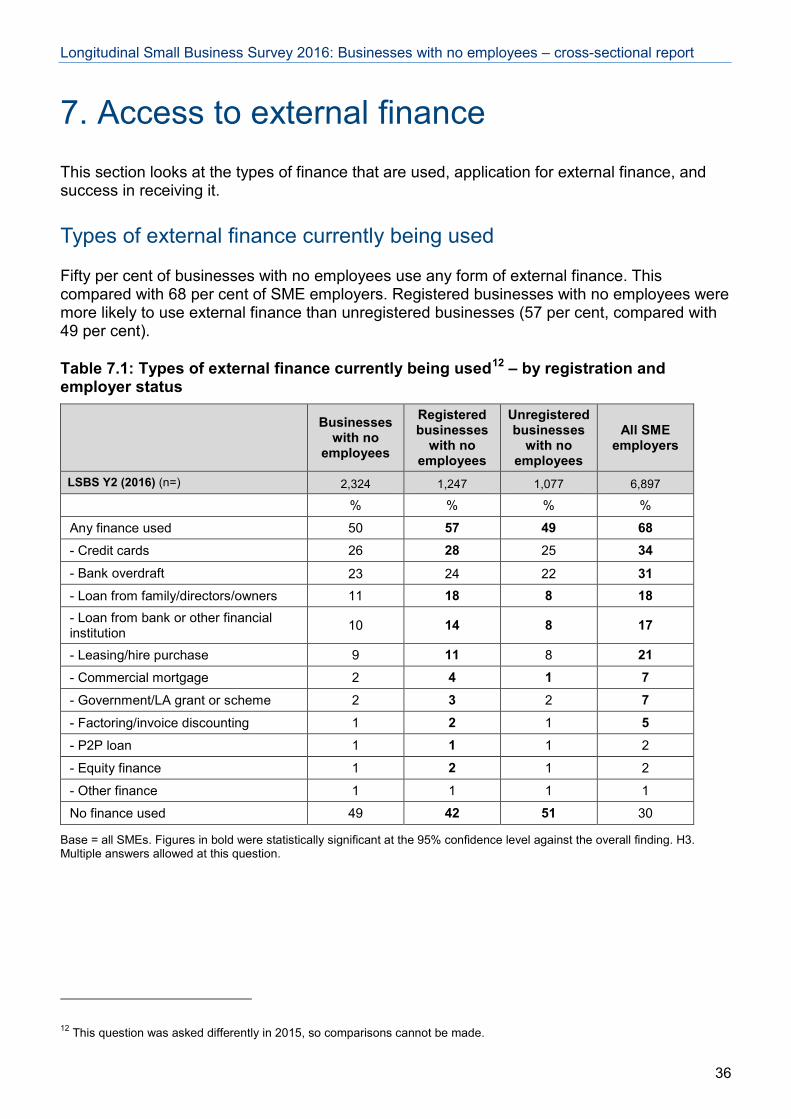
Fifty per cent of businesses with no employees use any form of external finance. This compared with 68 per cent of SME employers. Registered businesses with no employees were more likely to use external finance than unregistered businesses (57 per cent, compared with 49 per cent).
Table 7.1: Types of external finance currently being used12 – by registration and employer status
Businesses
with no employees
Registered businesses
with no employees
Unregistered businesses
with no employees
All SME employers
LSBS Y2 (2016) (n=) 2,324 1,247 1,077 6,897 % % % %
Any finance used 50 57 49 68 - Credit cards 26 28 25 34 - Bank overdraft 23 24 22 31 - Loan from family/directors/owners 11 18 8 18 - Loan from bank or other financial institution 10 14 8 17
- Leasing/hire purchase 9 11 8 21 - Commercial mortgage 2 4 1 7 - Government/LA grant or scheme 2 3 2 7 - Factoring/invoice discounting 1 2 1 5 - P2P loan 1 1 1 2
- Equity finance 1 2 1 2
- Other finance 1 1 1 1
No finance used 49 42 51 30
Base = all SMEs. Figures in bold were statistically significant at the 95% confidence level against the overall finding. H3. Multiple answers allowed at this question.
12 This question was asked differently in 2015, so comparisons cannot be made.
36
Longitudinal Small Business Survey 2016: Businesses with no employees – cross-sectional report
The most common forms of external finance used were credit cards (26 per cent), bank overdrafts (23 per cent), loans from family/directors/owners (11 per cent), and loans from banks and other financial institutions (ten per cent). Loans from these sources were most likely to be used by registered businesses.
37
Longitudinal Small Business Survey 2016: Businesses with no employees – cross-sectional report
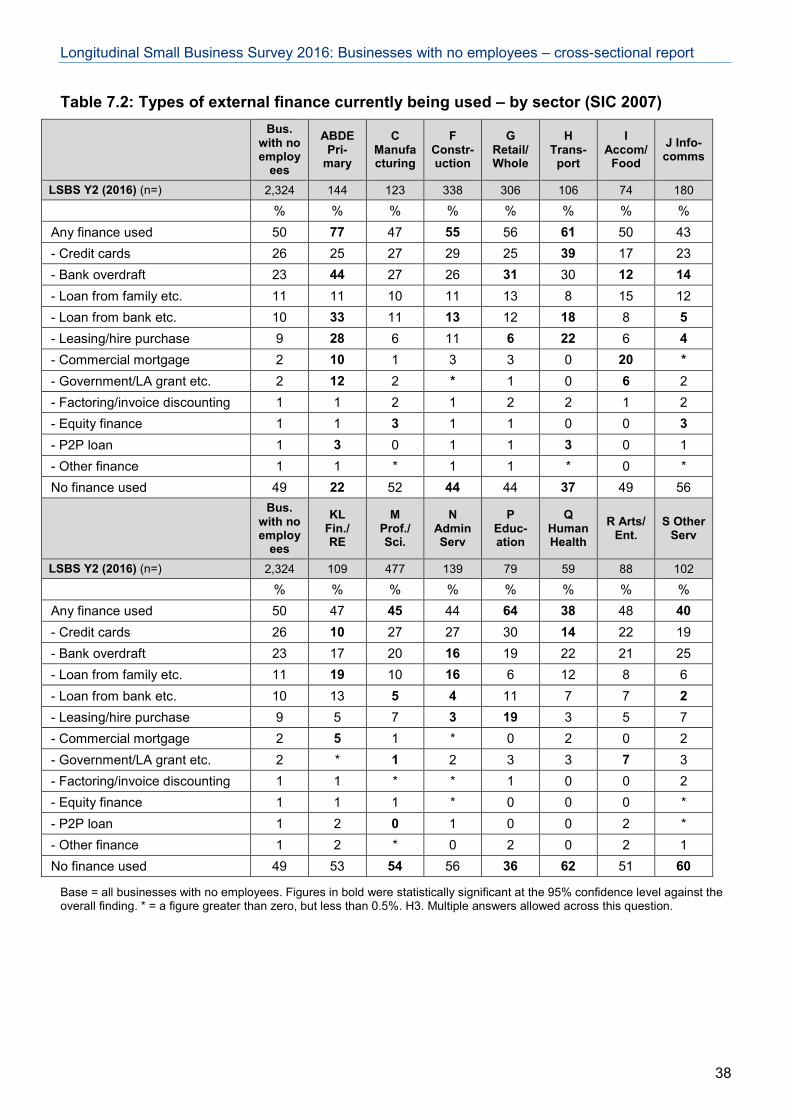
Table 7.2: Types of external finance currently being used – by sector (SIC 2007)
Bus.
with no employ
ees
ABDE Pri-
mary
C Manufacturing
F Constr-uction
G Retail/ Whole
H Trans-
port
I Accom/
Food J Info-comms
LSBS Y2 (2016) (n=) 2,324 144 123 338 306 106 74 180
% % % % % % % % Any finance used 50 77 47 55 56 61 50 43 - Credit cards 26 25 27 29 25 39 17 23 - Bank overdraft 23 44 27 26 31 30 12 14 - Loan from family etc. 11 11 10 11 13 8 15 12 - Loan from bank etc. 10 33 11 13 12 18 8 5 - Leasing/hire purchase 9 28 6 11 6 22 6 4 - Commercial mortgage 2 10 1 3 3 0 20 * - Government/LA grant etc. 2 12 2 * 1 0 6 2 - Factoring/invoice discounting 1 1 2 1 2 2 1 2 - Equity finance 1 1 3 1 1 0 0 3 - P2P loan 1 3 0 1 1 3 0 1 - Other finance 1 1 * 1 1 * 0 * No finance used 49 22 52 44 44 37 49 56
Bus.
with no employ
ees
KL Fin./ RE
M Prof./ Sci.
N Admin Serv
P Educ-ation
Q Human Health
R Arts/ Ent.
S Other Serv
LSBS Y2 (2016) (n=) 2,324 109 477 139 79 59 88 102
% % % % % % % % Any finance used 50 47 45 44 64 38 48 40 - Credit cards 26 10 27 27 30 14 22 19 - Bank overdraft 23 17 20 16 19 22 21 25 - Loan from family etc. 11 19 10 16 6 12 8 6 - Loan from bank etc. 10 13 5 4 11 7 7 2 - Leasing/hire purchase 9 5 7 3 19 3 5 7 - Commercial mortgage 2 5 1 * 0 2 0 2 - Government/LA grant etc. 2 * 1 2 3 3 7 3 - Factoring/invoice discounting 1 1 * * 1 0 0 2 - Equity finance 1 1 1 * 0 0 0 * - P2P loan 1 2 0 1 0 0 2 * - Other finance 1 2 * 0 2 0 2 1 No finance used 49 53 54 56 36 62 51 60
Base = all businesses with no employees. Figures in bold were statistically significant at the 95% confidence level against the overall finding. * = a figure greater than zero, but less than 0.5%. H3. Multiple answers allowed across this question.
38
Longitudinal Small Business Survey 2016: Businesses with no employees – cross-sectional report
The primary sector, largely consisting of the agricultural businesses, was the most likely to be using any form of external finance (77 per cent). Transport/storage (61 per cent) and education (64 per cent) also had an above average propensity to be using finance.
Use of finance was lower than average in the human health (38 per cent), other services (40 per cent) and professional/scientific (45 per cent) sectors.
Different sectors use different types of external finance to suit their needs:
• Credit cards were most likely to be used in transport/storage (39 per cent);
• Bank overdrafts were particularly likely to be used in primary (44 per cent) and retail/wholesale (31 per cent);
• Leasing/hire purchase was used most by primary (28 per cent), transport/storage (22 per cent) and education (19 per cent);
• Loans from family, director or owners were most likely to be used in financial/real estate (19 per cent) and administrative/support (16 per cent);
• Bank loans were most likely to be used in primary (33 per cent), transport/storage (18 per cent) and construction (13 per cent);
• Mortgages were most used in primary (ten per cent) and accommodation/food service (20 per cent);
• Government or Local Authority grants or schemes, were most likely to be used in primary (12 per cent), arts/entertainment (seven per cent) and accommodation/food service (six per cent);
• Equity finance was most used in manufacturing and information/communication (both three per cent).
Whether sought external finance in the last 12 months
Eight per cent of businesses with no employees had sought external finance in the 12 months preceding interview, a similar proportion to 2015 (nine per cent). There was no difference by whether the business was registered or unregistered.
39
Longitudinal Small Business Survey 2016: Businesses with no employees – cross-sectional report
Table 7.3: Whether sought external finance in the last 12 months – trends by registration and employer status
All businesses
with no employees
Registered businesses
with no employees
Unregistered businesses
with no employees
All SME employers
LSBS Y2 (2016) (n=) 2,324 1,247 1,077 6,897
% % % % Yes - any 8 8 8 13
- Once 6 6 6 9 - More than once 2 2 2 4
No 92 92 92 85 LSBS Y1 (2015) (n=) 4,355 2,473 1,882 11,147
% % % % Yes - any 9 11 8 17
- Once 6 8 6 11 - More than once 3 3 2 6
No 91 89 92 81
Base = all SMEs. Figures in bold were statistically significant at the 95% confidence level against the overall finding for all businesses with no employees. H4. Single answer only allowed at this question.
Table 7.4: Whether sought external finance in the last 12 months – by sector (SIC 2007)
Bus.
with no employ
ees
ABDE Primary
C Manufacturing
F Constr-uction
G Retail/ Whole
H Trans-
port
I Accom/
Food J Info-comms
LSBS Y2 (2016) (n=) 2,324 144 123 338 306 106 74 180
% % % % % % % %
Yes - any 8 15 12 7 8 10 9 12
- Once 6 13 10 6 5 8 5 9
- More than once 2 2 2 2 3 2 4 3
No 92 85 88 92 92 88 90 87
Bus.
with no employ
ees
KL Finance/ Real est.
M Prof./ Science
N Admin Serv
P Educ-ation
Q Human Health
R Arts/ Ent.
S Other Serv
LSBS Y2 (2016) (n=) 2.324 109 477 139 79 59 88 102
% % % % % % % %
Yes - any 8 7 4 7 11 5 6 4
- Once 6 4 3 7 9 3 3 3
- More than once 2 3 1 * 2 2 3 1
No 92 92 96 93 89 95 93 96
Base = all businesses with no employees. Figures in bold were statistically significant at the 95% confidence level against the overall finding. * = a figure greater than zero, but less than 0.5%. H4. Single answer only allowed at this question.
By sector, those in primary (15 per cent), manufacturing (12 per cent) and information/communication (12 per cent) sectors are more likely than average to have sought finance.
40
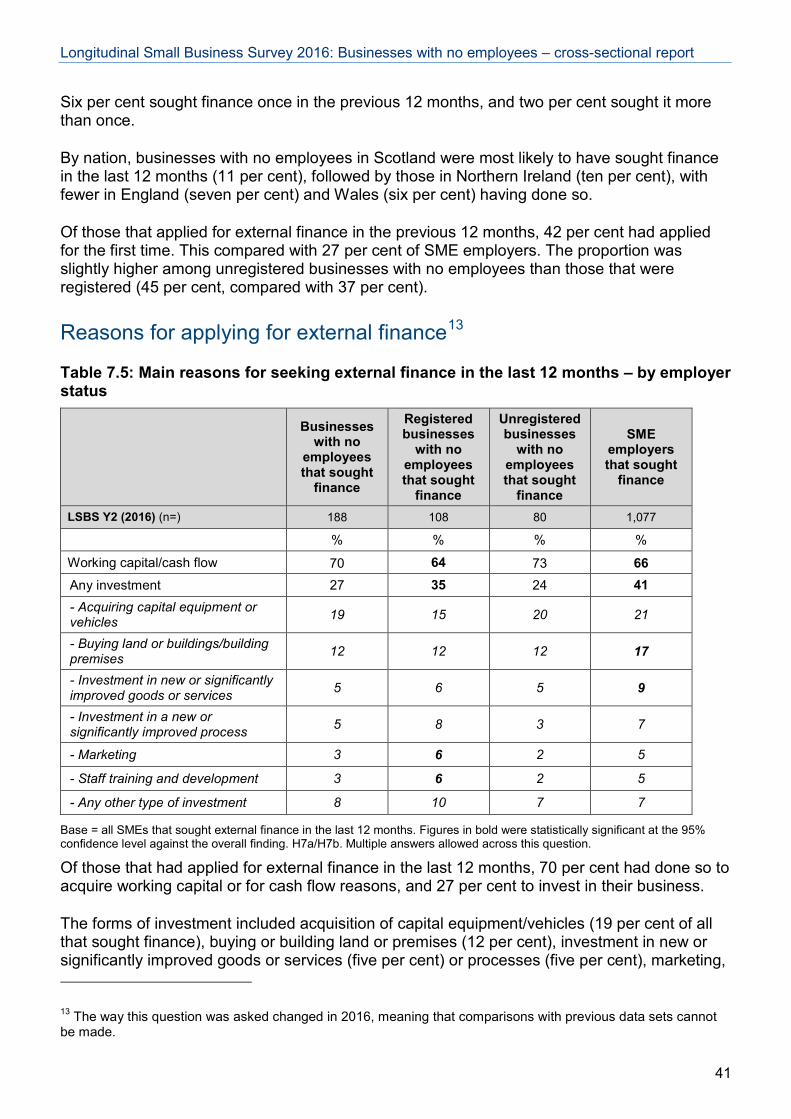
Longitudinal Small Business Survey 2016: Businesses with no employees – cross-sectional report
Six per cent sought finance once in the previous 12 months, and two per cent sought it more than once.
By nation, businesses with no employees in Scotland were most likely to have sought finance in the last 12 months (11 per cent), followed by those in Northern Ireland (ten per cent), with fewer in England (seven per cent) and Wales (six per cent) having done so.
Of those that applied for external finance in the previous 12 months, 42 per cent had applied for the first time. This compared with 27 per cent of SME employers. The proportion was slightly higher among unregistered businesses with no employees than those that were registered (45 per cent, compared with 37 per cent).
Reasons for applying for external finance13
Table 7.5: Main reasons for seeking external finance in the last 12 months – by employer status
Businesses with no
employees that sought
finance
Registered businesses
with no employees that sought
finance
Unregistered businesses
with no employees that sought
finance
SME employers that sought
finance
LSBS Y2 (2016) (n=) 188 108 80 1,077
% % % %
Working capital/cash flow 70 64 73 66 Any investment 27 35 24 41 - Acquiring capital equipment or vehicles 19 15 20 21
- Buying land or buildings/building premises 12 12 12 17
- Investment in new or significantly improved goods or services 5 6 5 9
- Investment in a new or significantly improved process 5 8 3 7
- Marketing 3 6 2 5
- Staff training and development 3 6 2 5
- Any other type of investment 8 10 7 7
Base = all SMEs that sought external finance in the last 12 months. Figures in bold were statistically significant at the 95% confidence level against the overall finding. H7a/H7b. Multiple answers allowed across this question.
Of those that had applied for external finance in the last 12 months, 70 per cent had done so to acquire working capital or for cash flow reasons, and 27 per cent to invest in their business.
The forms of investment included acquisition of capital equipment/vehicles (19 per cent of all that sought finance), buying or building land or premises (12 per cent), investment in new or significantly improved goods or services (five per cent) or processes (five per cent), marketing,
13 The way this question was asked changed in 2016, meaning that comparisons with previous data sets cannot be made.
41
Longitudinal Small Business Survey 2016: Businesses with no employees – cross-sectional report
staff training/development (both three per cent) and any other sort of investment (eight per cent).
The main reasons for seeking working capital/cash flow were:
• To fund general growth (58 per cent of those seeking finance for working capital);
• To cover a short-term gap until funds were received from customers (57 per cent);
• As a safety net, just in case (31 per cent);
• To cover a short-term gap due to unexpected expenses, e.g. late payment (23 per cent);
Type of external finance sought
Thirty-nine per cent of businesses with no employees that sought external finance in the previous 12 months applied for bank loans. Thirty per cent applied for bank overdrafts (including extensions and renewals of existing facilities). Fourteen per cent each applied for loans from family/business partner/directors/owner or government/local authority grants or schemes.
Compared with the 2015 survey, businesses with no employees that applied for finance were more likely to apply for government grants/schemes (up eight percentage points), and were less likely to apply for credit cards (down 11 percentage points), and leasing/HP (down nine percentage points).
Registered businesses were more likely than the unregistered ones to have applied for most types of finance, the exceptions being bank loans, mortgages, government grants/schemes, P2P loans, and factoring/invoice discounting.
42
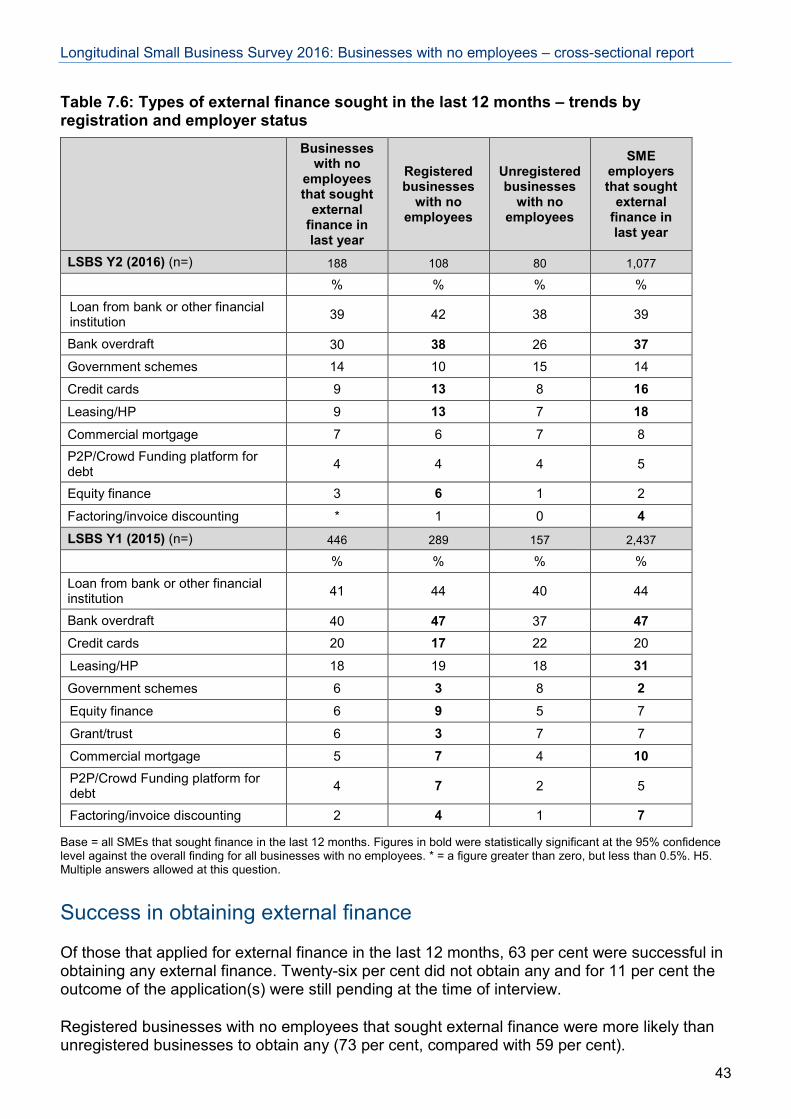
Longitudinal Small Business Survey 2016: Businesses with no employees – cross-sectional report
Table 7.6: Types of external finance sought in the last 12 months – trends by registration and employer status
Businesses with no
employees that sought
external finance in last year
Registered businesses
with no employees
Unregistered businesses
with no employees
SME employers that sought
external finance in last year
LSBS Y2 (2016) (n=) 188 108 80 1,077
% % % % Loan from bank or other financial institution 39 42 38 39
Bank overdraft 30 38 26 37 Government schemes 14 10 15 14
Credit cards 9 13 8 16 Leasing/HP 9 13 7 18 Commercial mortgage 7 6 7 8 P2P/Crowd Funding platform for debt 4 4 4 5
Equity finance 3 6 1 2
Factoring/invoice discounting * 1 0 4 LSBS Y1 (2015) (n=) 446 289 157 2,437
% % % % Loan from bank or other financial institution 41 44 40 44
Bank overdraft 40 47 37 47 Credit cards 20 17 22 20
Leasing/HP 18 19 18 31 Government schemes 6 3 8 2 Equity finance 6 9 5 7
Grant/trust 6 3 7 7
Commercial mortgage 5 7 4 10 P2P/Crowd Funding platform for debt 4 7 2 5
Factoring/invoice discounting 2 4 1 7
Base = all SMEs that sought finance in the last 12 months. Figures in bold were statistically significant at the 95% confidence level against the overall finding for all businesses with no employees. * = a figure greater than zero, but less than 0.5%. H5. Multiple answers allowed at this question.
Success in obtaining external finance
Of those that applied for external finance in the last 12 months, 63 per cent were successful in obtaining any external finance. Twenty-six per cent did not obtain any and for 11 per cent the outcome of the application(s) were still pending at the time of interview.
Registered businesses with no employees that sought external finance were more likely than unregistered businesses to obtain any (73 per cent, compared with 59 per cent).
43
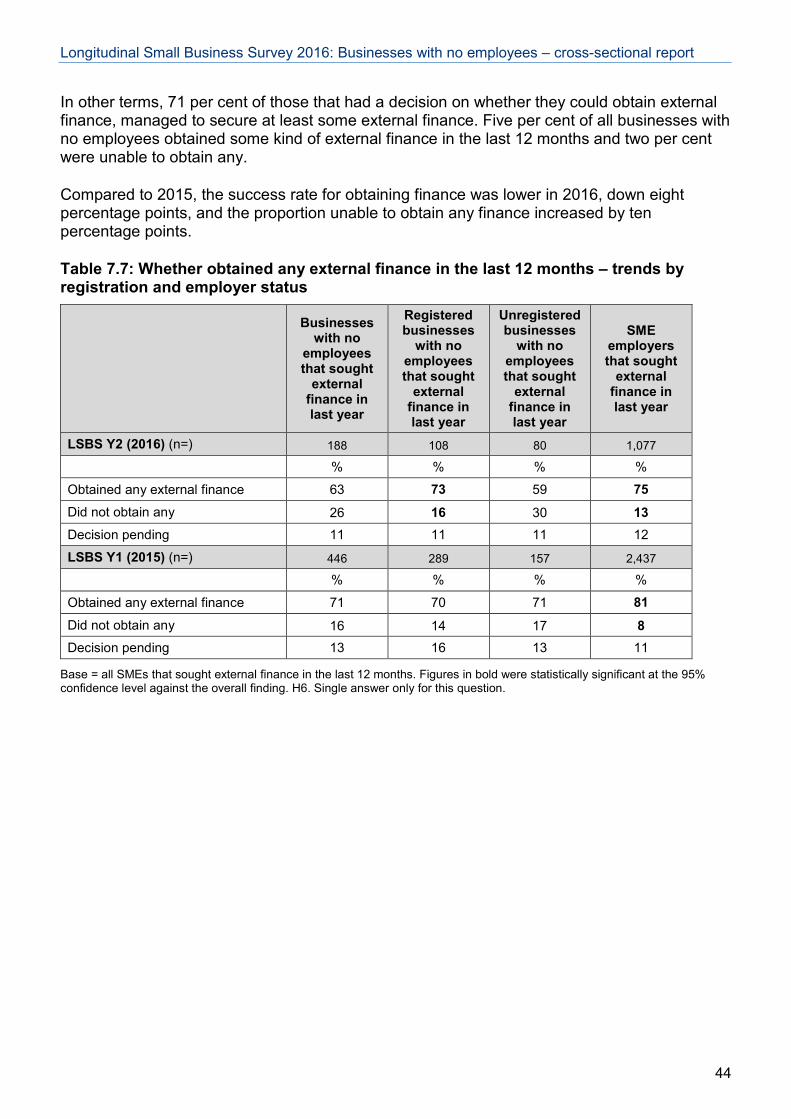
Longitudinal Small Business Survey 2016: Businesses with no employees – cross-sectional report
In other terms, 71 per cent of those that had a decision on whether they could obtain external finance, managed to secure at least some external finance. Five per cent of all businesses with no employees obtained some kind of external finance in the last 12 months and two per cent were unable to obtain any.
Compared to 2015, the success rate for obtaining finance was lower in 2016, down eight percentage points, and the proportion unable to obtain any finance increased by ten percentage points.
Table 7.7: Whether obtained any external finance in the last 12 months – trends by registration and employer status
Businesses with no
employees that sought
external finance in last year
Registered businesses
with no employees that sought
external finance in last year
Unregistered businesses
with no employees that sought
external finance in last year
SME employers that sought
external finance in last year
LSBS Y2 (2016) (n=) 188 108 80 1,077
% % % %
Obtained any external finance 63 73 59 75 Did not obtain any 26 16 30 13 Decision pending 11 11 11 12
LSBS Y1 (2015) (n=) 446 289 157 2,437
% % % %
Obtained any external finance 71 70 71 81 Did not obtain any 16 14 17 8 Decision pending 13 16 13 11
Base = all SMEs that sought external finance in the last 12 months. Figures in bold were statistically significant at the 95% confidence level against the overall finding. H6. Single answer only for this question.
44
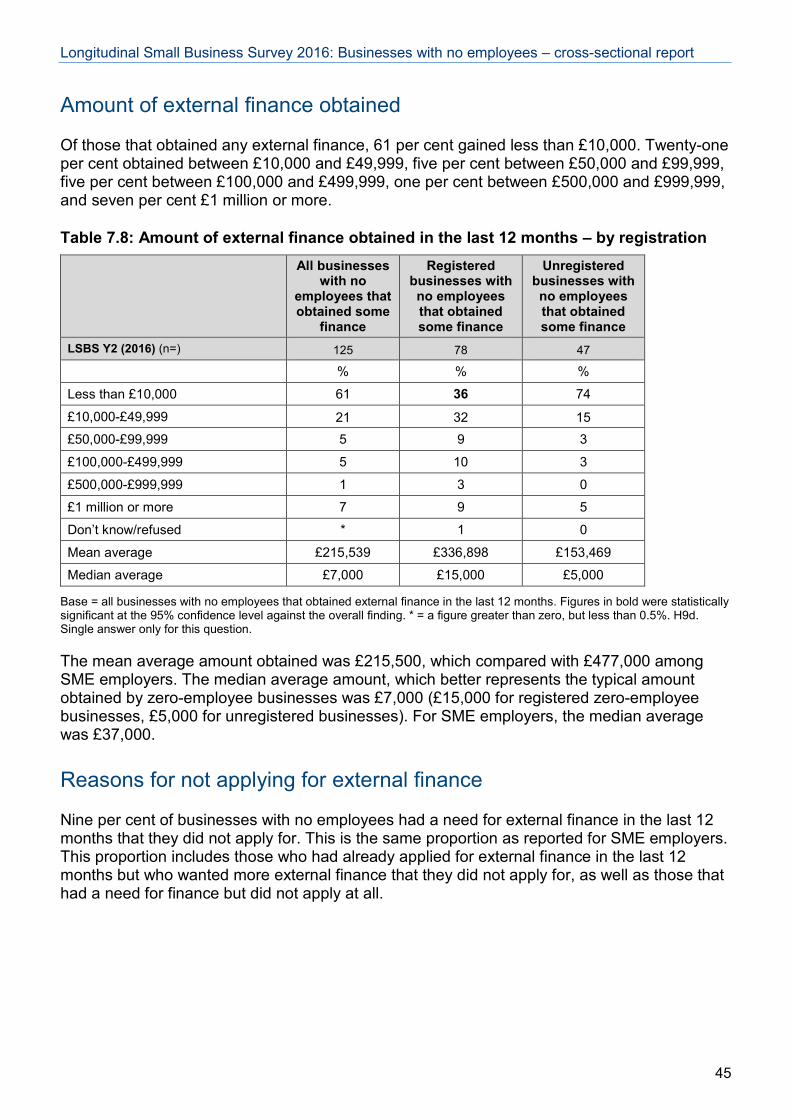
Longitudinal Small Business Survey 2016: Businesses with no employees – cross-sectional report
Amount of external finance obtained
Of those that obtained any external finance, 61 per cent gained less than £10,000. Twenty-one per cent obtained between £10,000 and £49,999, five per cent between £50,000 and £99,999, five per cent between £100,000 and £499,999, one per cent between £500,000 and £999,999, and seven per cent £1 million or more.
Table 7.8: Amount of external finance obtained in the last 12 months – by registration
All businesses with no
employees that obtained some
finance
Registered businesses with no employees that obtained some finance
Unregistered businesses with no employees that obtained some finance
LSBS Y2 (2016) (n=) 125 78 47
% % %
Less than £10,000 61 36 74
£10,000-£49,999 21 32 15 £50,000-£99,999 5 9 3
£100,000-£499,999 5 10 3
£500,000-£999,999 1 3 0
£1 million or more 7 9 5
Don’t know/refused * 1 0
Mean average £215,539 £336,898 £153,469
Median average £7,000 £15,000 £5,000
Base = all businesses with no employees that obtained external finance in the last 12 months. Figures in bold were statistically significant at the 95% confidence level against the overall finding. * = a figure greater than zero, but less than 0.5%. H9d. Single answer only for this question.
The mean average amount obtained was £215,500, which compared with £477,000 among SME employers. The median average amount, which better represents the typical amount obtained by zero-employee businesses was £7,000 (£15,000 for registered zero-employee businesses, £5,000 for unregistered businesses). For SME employers, the median average was £37,000.
Reasons for not applying for external finance
Nine per cent of businesses with no employees had a need for external finance in the last 12 months that they did not apply for. This is the same proportion as reported for SME employers. This proportion includes those who had already applied for external finance in the last 12 months but who wanted more external finance that they did not apply for, as well as those that had a need for finance but did not apply at all.
45
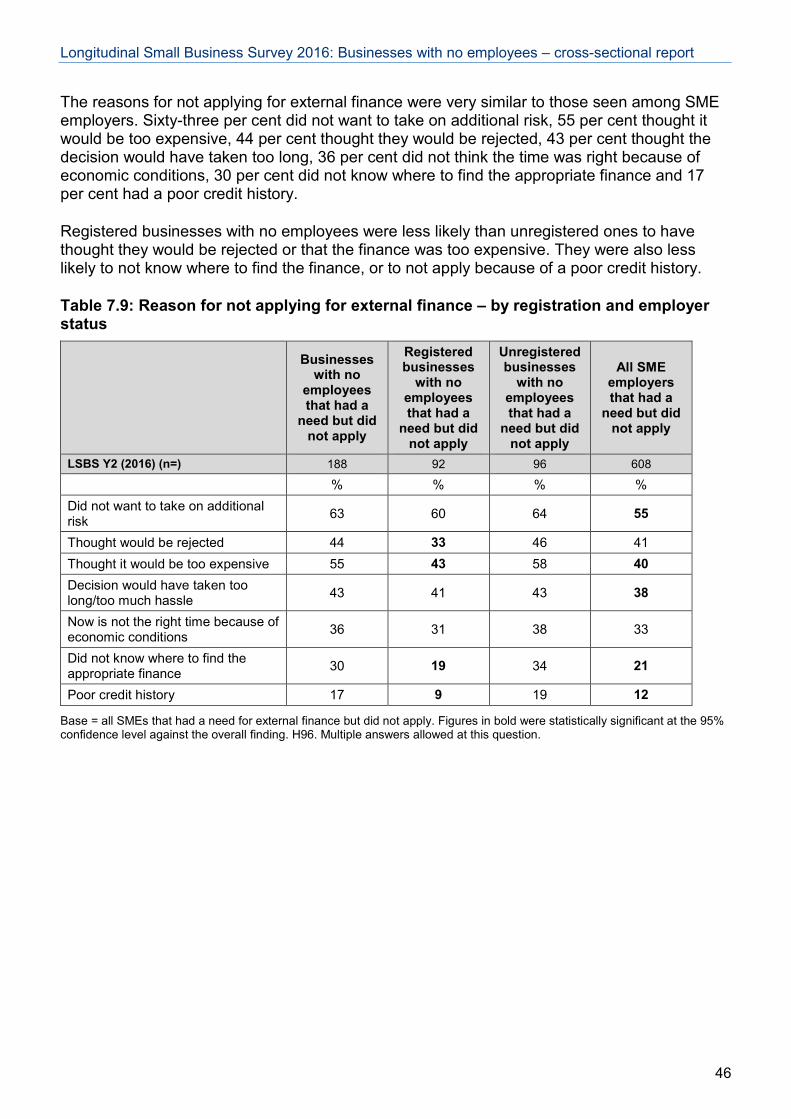
Longitudinal Small Business Survey 2016: Businesses with no employees – cross-sectional report
The reasons for not applying for external finance were very similar to those seen among SME employers. Sixty-three per cent did not want to take on additional risk, 55 per cent thought it would be too expensive, 44 per cent thought they would be rejected, 43 per cent thought the decision would have taken too long, 36 per cent did not think the time was right because of economic conditions, 30 per cent did not know where to find the appropriate finance and 17 per cent had a poor credit history.
Registered businesses with no employees were less likely than unregistered ones to have thought they would be rejected or that the finance was too expensive. They were also less likely to not know where to find the finance, or to not apply because of a poor credit history.
Table 7.9: Reason for not applying for external finance – by registration and employer status
Businesses with no
employees that had a
need but did not apply
Registered businesses
with no employees that had a
need but did not apply
Unregistered businesses
with no employees that had a
need but did not apply
All SME employers that had a
need but did not apply
LSBS Y2 (2016) (n=) 188 92 96 608
% % % % Did not want to take on additional risk 63 60 64 55
Thought would be rejected 44 33 46 41 Thought it would be too expensive 55 43 58 40 Decision would have taken too long/too much hassle 43 41 43 38
Now is not the right time because of economic conditions 36 31 38 33
Did not know where to find the appropriate finance 30 19 34 21
Poor credit history 17 9 19 12
Base = all SMEs that had a need for external finance but did not apply. Figures in bold were statistically significant at the 95% confidence level against the overall finding. H96. Multiple answers allowed at this question.
46
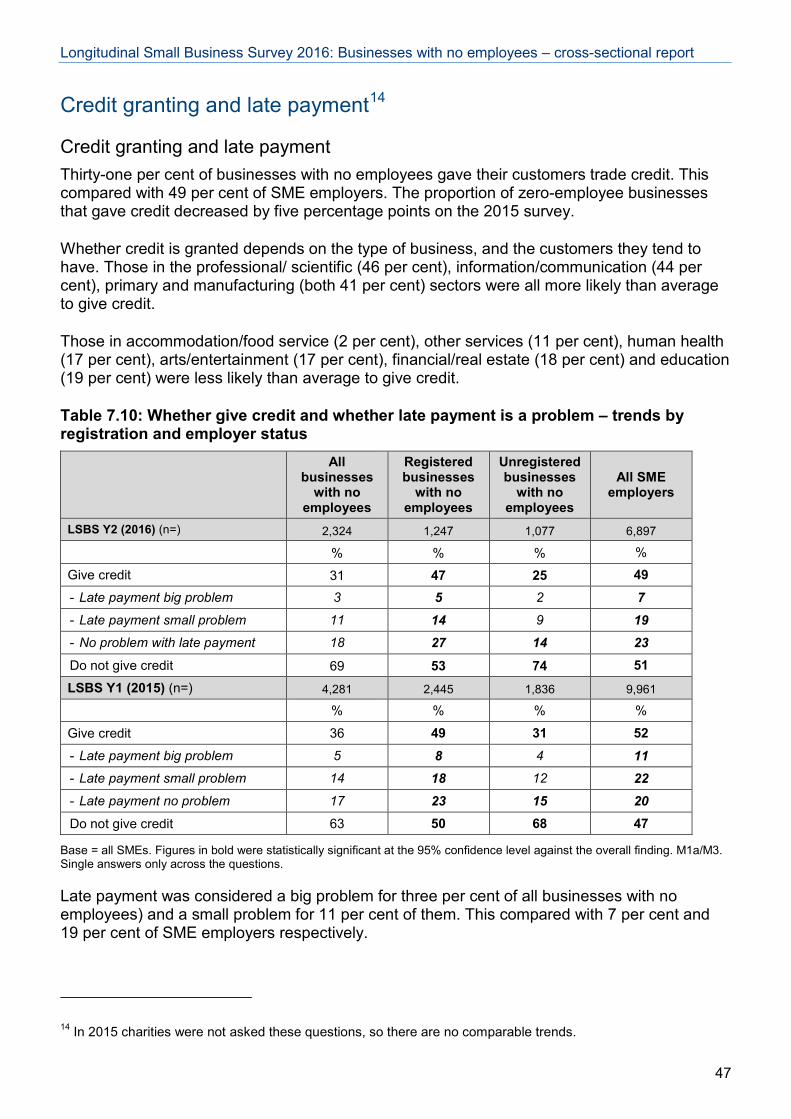
Longitudinal Small Business Survey 2016: Businesses with no employees – cross-sectional report
Credit granting and late payment14
Credit granting and late payment Thirty-one per cent of businesses with no employees gave their customers trade credit. This compared with 49 per cent of SME employers. The proportion of zero-employee businesses that gave credit decreased by five percentage points on the 2015 survey.
Whether credit is granted depends on the type of business, and the customers they tend to have. Those in the professional/ scientific (46 per cent), information/communication (44 per cent), primary and manufacturing (both 41 per cent) sectors were all more likely than average to give credit.
Those in accommodation/food service (2 per cent), other services (11 per cent), human health (17 per cent), arts/entertainment (17 per cent), financial/real estate (18 per cent) and education (19 per cent) were less likely than average to give credit.
Table 7.10: Whether give credit and whether late payment is a problem – trends by registration and employer status
All businesses
with no employees
Registered businesses
with no employees
Unregistered businesses
with no employees
All SME employers
LSBS Y2 (2016) (n=) 2,324 1,247 1,077 6,897
% % % %
Give credit 31 47 25 49 - Late payment big problem 3 5 2 7 - Late payment small problem 11 14 9 19 - No problem with late payment 18 27 14 23 Do not give credit 69 53 74 51 LSBS Y1 (2015) (n=) 4,281 2,445 1,836 9,961
% % % %
Give credit 36 49 31 52 - Late payment big problem 5 8 4 11 - Late payment small problem 14 18 12 22 - Late payment no problem 17 23 15 20 Do not give credit 63 50 68 47
Base = all SMEs. Figures in bold were statistically significant at the 95% confidence level against the overall finding. M1a/M3. Single answers only across the questions.
Late payment was considered a big problem for three per cent of all businesses with no employees) and a small problem for 11 per cent of them. This compared with 7 per cent and 19 per cent of SME employers respectively.
14 In 2015 charities were not asked these questions, so there are no comparable trends.
47
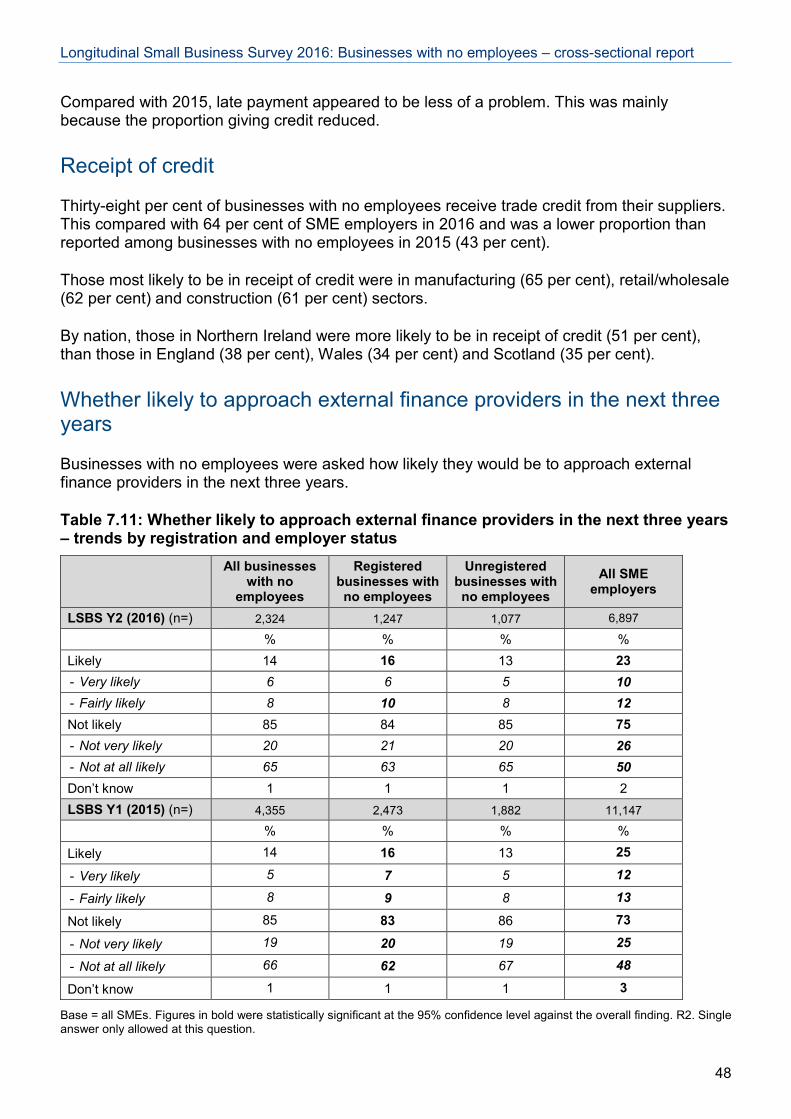
Longitudinal Small Business Survey 2016: Businesses with no employees – cross-sectional report
Compared with 2015, late payment appeared to be less of a problem. This was mainly because the proportion giving credit reduced.
Receipt of credit
Thirty-eight per cent of businesses with no employees receive trade credit from their suppliers. This compared with 64 per cent of SME employers in 2016 and was a lower proportion than reported among businesses with no employees in 2015 (43 per cent).
Those most likely to be in receipt of credit were in manufacturing (65 per cent), retail/wholesale (62 per cent) and construction (61 per cent) sectors.
By nation, those in Northern Ireland were more likely to be in receipt of credit (51 per cent), than those in England (38 per cent), Wales (34 per cent) and Scotland (35 per cent).
Whether likely to approach external finance providers in the next three years
Businesses with no employees were asked how likely they would be to approach external finance providers in the next three years.
Table 7.11: Whether likely to approach external finance providers in the next three years – trends by registration and employer status
All businesses
with no employees
Registered businesses with no employees
Unregistered businesses with no employees
All SME employers
LSBS Y2 (2016) (n=) 2,324 1,247 1,077 6,897
% % % % Likely 14 16 13 23 - Very likely 6 6 5 10 - Fairly likely 8 10 8 12 Not likely 85 84 85 75 - Not very likely 20 21 20 26 - Not at all likely 65 63 65 50 Don’t know 1 1 1 2 LSBS Y1 (2015) (n=) 4,355 2,473 1,882 11,147
% % % %
Likely 14 16 13 25
- Very likely 5 7 5 12
- Fairly likely 8 9 8 13
Not likely 85 83 86 73
- Not very likely 19 20 19 25
- Not at all likely 66 62 67 48
Don’t know 1 1 1 3
Base = all SMEs. Figures in bold were statistically significant at the 95% confidence level against the overall finding. R2. Single answer only allowed at this question.
48
Longitudinal Small Business Survey 2016: Businesses with no employees – cross-sectional report
Fourteen per cent said it was likely (six per cent very likely, eight per cent fairly likely). These proportions were very similar to those in the 2015 survey.
This was a lower proportion than among SME employers (23 per cent likely). It was also higher among registered businesses with no employees than among unregistered businesses (16 per cent, compared with 13 per cent).
By sector, those in primary (25 per cent) were more likely than average to expect to approach external finance providers. Those in professional/scientific (nine per cent) were less likely than average to expect to do this.
49
Longitudinal Small Business Survey 2016: Businesses with no employees – cross-sectional report
8. Major obstacles to the success of the business
This section explores the major obstacles that businesses with no employees report as restricting their business success.
Major obstacles to the success of the business
Respondents were read a list of issues and asked which, if any, represented major obstacles to the success of their business.
Overall, 43 per cent of businesses with no employees said that competition in the market was a major obstacle to the success of their business. Twenty-nine per cent said regulations/red tape, 24 per cent late payment and 21 per cent taxation (including VAT, PAYE, NI and rates).
In general, registered businesses with no employees had more obstacles than unregistered ones. SME employers were more likely than both groups to mention obstacles.
Compared with 2015, businesses with no employees were less likely to mention most obstacles, and in particular regulations/red tape (down six percentage points) and taxation (down five percentage points).
By sector, there were some differences in the obstacles mentioned:
• Competition was particularly likely to be a major obstacle for those in retail/wholesale (55 per cent);
• Regulations/red tape was more likely than average to be a major obstacle in primary (57 per cent), financial/real estate (47 per cent) and construction (36 per cent);
• Late payment was more likely than average to be a major obstacle in the construction (33 per cent), information/communication (31 per cent) and professional/scientific (29 per cent) sectors;
• Taxation was most likely to be a problem in retail/wholesale (31 per cent) and manufacturing (29 per cent);
• UK exit from the EU was a particular obstacle in financial/real estate (22 per cent), professional/scientific (21 per cent) and information/communication (20 per cent) sectors;
• Obtaining finance was more likely than average to be a major obstacle in construction (17 per cent);
• The availability and cost of suitable premises was more likely than average to be a major obstacle in arts/entertainment (26 per cent), manufacturing (20 per cent) and retail/wholesale (20 per cent);
• Staff recruitment and skills was a particular obstacle in manufacturing (18 per cent);
• The National Living Wage was more likely than average to be an obstacle in other services (14 per cent), manufacturing (12 per cent), retail/wholesale (11 per cent) and primary (ten per cent) sectors;
50
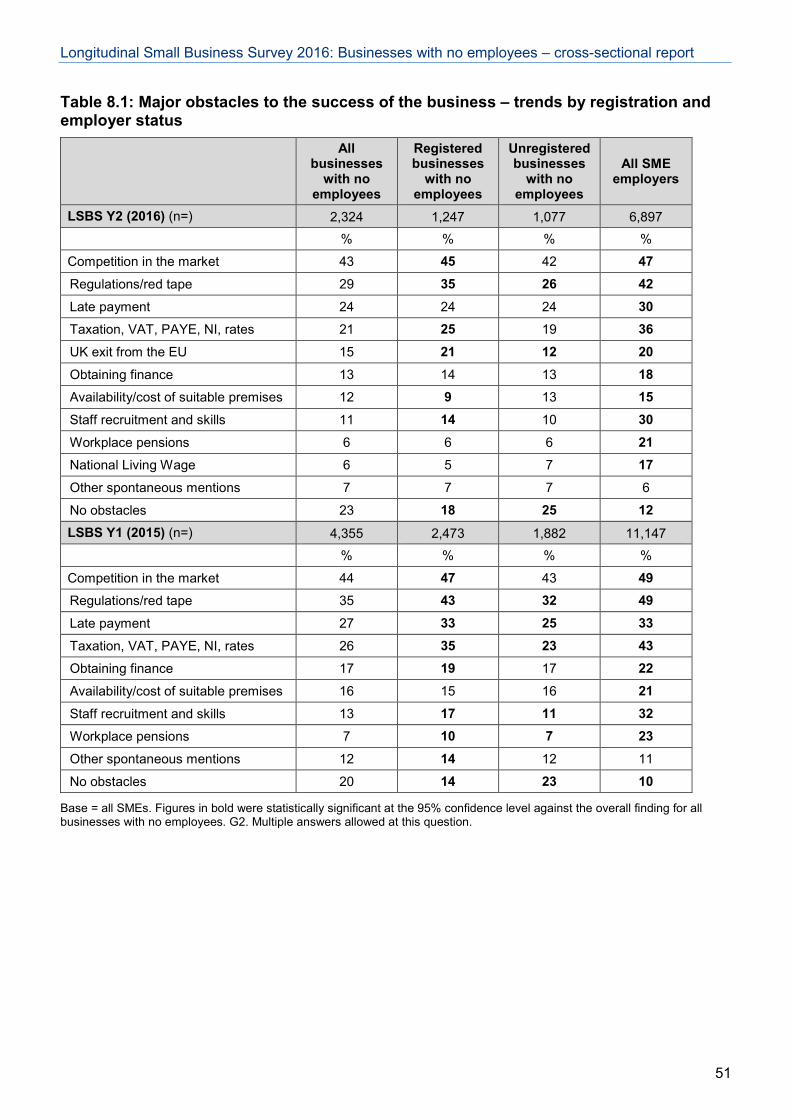
Longitudinal Small Business Survey 2016: Businesses with no employees – cross-sectional report
Table 8.1: Major obstacles to the success of the business – trends by registration and employer status
All businesses
with no employees
Registered businesses
with no employees
Unregistered businesses
with no employees
All SME employers
LSBS Y2 (2016) (n=) 2,324 1,247 1,077 6,897 % % % %
Competition in the market 43 45 42 47 Regulations/red tape 29 35 26 42 Late payment 24 24 24 30 Taxation, VAT, PAYE, NI, rates 21 25 19 36 UK exit from the EU 15 21 12 20 Obtaining finance 13 14 13 18 Availability/cost of suitable premises 12 9 13 15 Staff recruitment and skills 11 14 10 30 Workplace pensions 6 6 6 21 National Living Wage 6 5 7 17 Other spontaneous mentions 7 7 7 6
No obstacles 23 18 25 12 LSBS Y1 (2015) (n=) 4,355 2,473 1,882 11,147 % % % %
Competition in the market 44 47 43 49 Regulations/red tape 35 43 32 49 Late payment 27 33 25 33 Taxation, VAT, PAYE, NI, rates 26 35 23 43 Obtaining finance 17 19 17 22 Availability/cost of suitable premises 16 15 16 21 Staff recruitment and skills 13 17 11 32 Workplace pensions 7 10 7 23 Other spontaneous mentions 12 14 12 11
No obstacles 20 14 23 10
Base = all SMEs. Figures in bold were statistically significant at the 95% confidence level against the overall finding for all businesses with no employees. G2. Multiple answers allowed at this question.
51
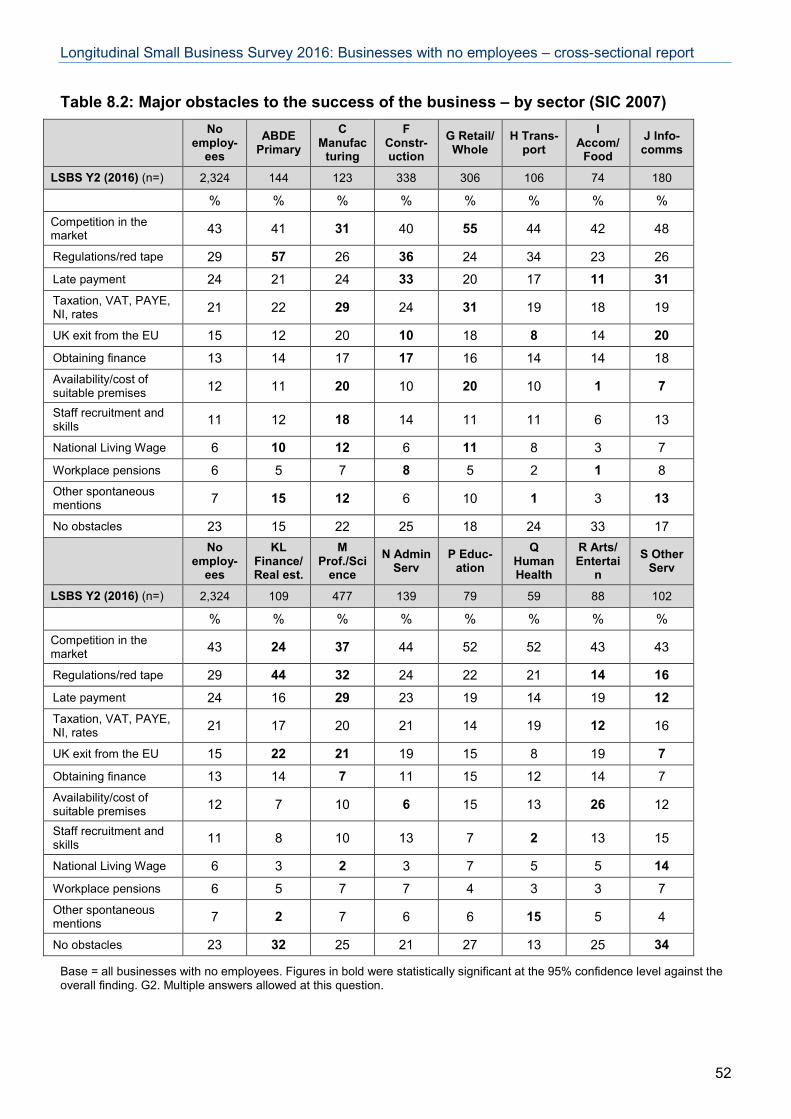
Longitudinal Small Business Survey 2016: Businesses with no employees – cross-sectional report
Table 8.2: Major obstacles to the success of the business – by sector (SIC 2007)
No
employ-ees
ABDE Primary
C Manufac
turing
F Constr-uction
G Retail/ Whole
H Trans-port
I Accom/
Food J Info-comms
LSBS Y2 (2016) (n=) 2,324 144 123 338 306 106 74 180
% % % % % % % % Competition in the market 43 41 31 40 55 44 42 48
Regulations/red tape 29 57 26 36 24 34 23 26 Late payment 24 21 24 33 20 17 11 31 Taxation, VAT, PAYE, NI, rates 21 22 29 24 31 19 18 19
UK exit from the EU 15 12 20 10 18 8 14 20 Obtaining finance 13 14 17 17 16 14 14 18 Availability/cost of suitable premises 12 11 20 10 20 10 1 7
Staff recruitment and skills 11 12 18 14 11 11 6 13
National Living Wage 6 10 12 6 11 8 3 7
Workplace pensions 6 5 7 8 5 2 1 8 Other spontaneous mentions 7 15 12 6 10 1 3 13
No obstacles 23 15 22 25 18 24 33 17
No
employ-ees
KL Finance/ Real est.
M Prof./Sci
ence N Admin
Serv P Educ-
ation Q
Human Health
R Arts/ Entertai
n S Other
Serv
LSBS Y2 (2016) (n=) 2,324 109 477 139 79 59 88 102
% % % % % % % % Competition in the market 43 24 37 44 52 52 43 43
Regulations/red tape 29 44 32 24 22 21 14 16 Late payment 24 16 29 23 19 14 19 12 Taxation, VAT, PAYE, NI, rates 21 17 20 21 14 19 12 16
UK exit from the EU 15 22 21 19 15 8 19 7 Obtaining finance 13 14 7 11 15 12 14 7 Availability/cost of suitable premises 12 7 10 6 15 13 26 12
Staff recruitment and skills 11 8 10 13 7 2 13 15
National Living Wage 6 3 2 3 7 5 5 14 Workplace pensions 6 5 7 7 4 3 3 7 Other spontaneous mentions 7 2 7 6 6 15 5 4
No obstacles 23 32 25 21 27 13 25 34
Base = all businesses with no employees. Figures in bold were statistically significant at the 95% confidence level against the overall finding. G2. Multiple answers allowed at this question.
52
Longitudinal Small Business Survey 2016: Businesses with no employees – cross-sectional report
Regulations
Those that thought regulations or red tape were major obstacles were asked to name the regulations that particularly affected them.
The most mentioned regulations were sector-specific ones (17 per cent), tax-related regulations (also 17 per cent), and health and safety (12 per cent), while 17 per cent cited /all regulations or did not specify.
For a new question in the 2016 survey, all respondents were asked whether they thought that the burdens resulting from regulations would decrease, stay the same or increase in the next 12 months.
Twenty-six per cent of businesses with no employees thought that the burden would increase (eight per cent increase a lot, 18 per cent increase a little). This compared with 34 per cent of SME employers.
Fifty-eight per cent thought the burden would stay the same and seven per cent thought the burden would decrease. A further ten per cent did not know. Among SME employers, these proportions were 53 per cent, six per cent and six per cent respectively.
53
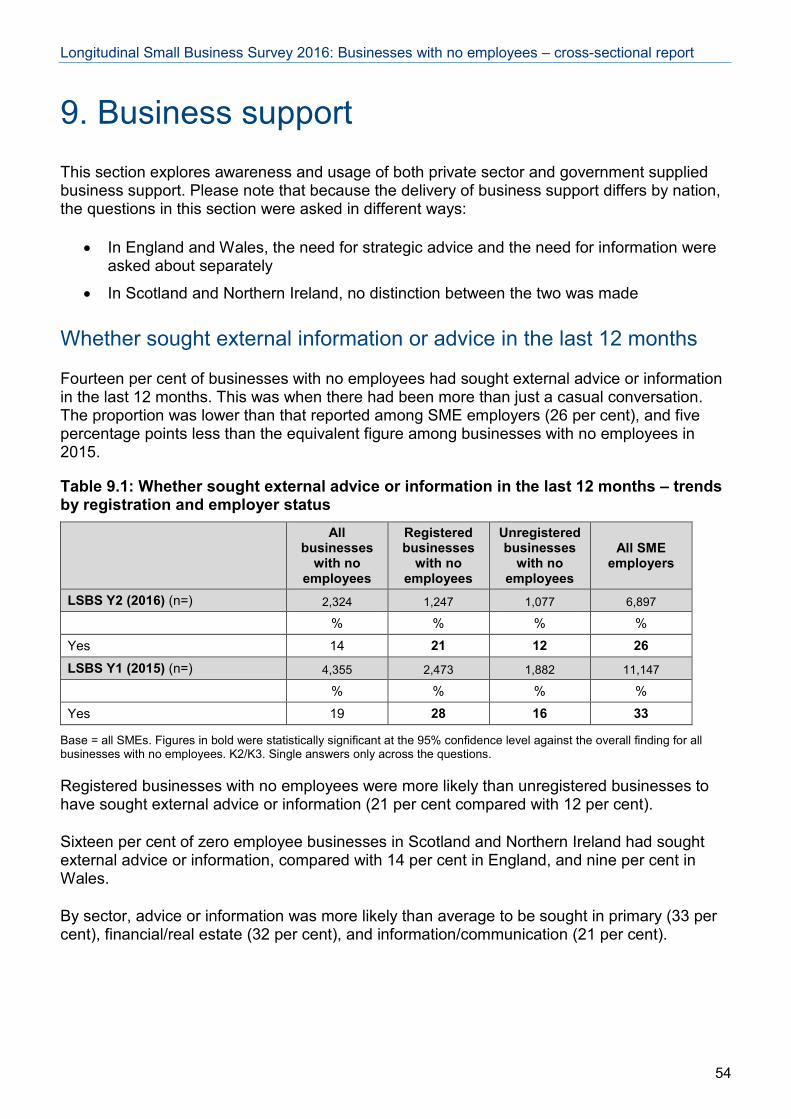
Longitudinal Small Business Survey 2016: Businesses with no employees – cross-sectional report
9. Business support This section explores awareness and usage of both private sector and government supplied business support. Please note that because the delivery of business support differs by nation, the questions in this section were asked in different ways:
• In England and Wales, the need for strategic advice and the need for information were asked about separately
• In Scotland and Northern Ireland, no distinction between the two was made
Whether sought external information or advice in the last 12 months
Fourteen per cent of businesses with no employees had sought external advice or information in the last 12 months. This was when there had been more than just a casual conversation. The proportion was lower than that reported among SME employers (26 per cent), and five percentage points less than the equivalent figure among businesses with no employees in 2015.
Table 9.1: Whether sought external advice or information in the last 12 months – trends by registration and employer status
All businesses
with no employees
Registered businesses
with no employees
Unregistered businesses
with no employees
All SME employers
LSBS Y2 (2016) (n=) 2,324 1,247 1,077 6,897
% % % %
Yes 14 21 12 26 LSBS Y1 (2015) (n=) 4,355 2,473 1,882 11,147
% % % %
Yes 19 28 16 33
Base = all SMEs. Figures in bold were statistically significant at the 95% confidence level against the overall finding for all businesses with no employees. K2/K3. Single answers only across the questions.
Registered businesses with no employees were more likely than unregistered businesses to have sought external advice or information (21 per cent compared with 12 per cent).
Sixteen per cent of zero employee businesses in Scotland and Northern Ireland had sought external advice or information, compared with 14 per cent in England, and nine per cent in Wales.
By sector, advice or information was more likely than average to be sought in primary (33 per cent), financial/real estate (32 per cent), and information/communication (21 per cent).
54
Longitudinal Small Business Survey 2016: Businesses with no employees – cross-sectional report
In England and Wales, of the zero employee businesses that had sought external advice or information, 32 per cent had sought information relating to the day to day running of their business, 30 per cent had sought strategic advice to help introduce a step change to grow the business in terms of profitability, numbers employed, or to increase productivity, and 22 per cent had sought both these types of advice or information. Sixteen per cent did not think the advice or information they received fell into any of these categories.
Based on all businesses with no employees in England and Wales, seven per cent sought external strategic advice, and eight per cent sought external information.
Across England and Wales, by sector, strategic advice was more likely than average to be sought in the education (14 per cent), primary (12 per cent), financial/real estate (11 per cent) and human health (10 per cent) sectors.
In England and Wales information was more likely to be sought by those in the financial/real estate (22 per cent), accommodation/food services, and primary (both 14 per cent) sectors.
Type of information or advice sought (England and Wales only)15
In 2016 in England and Wales, strategic advice was most likely sought for business growth (26 per cent of those that sought it), financial advice e.g. accounting for the general running of the business (18 per cent), improving business efficiency and productivity (17 per cent) and marketing (17 per cent).
Information was most likely sought on tax/national insurance law and payments (19 per cent), on financial issues relating to the general running of the business (13 per cent) and on business growth (12 per cent).
15 Because these sets of questions were asked differently according to country, the data is not comparable across the UK and only results from England and Wales are shown here.
55
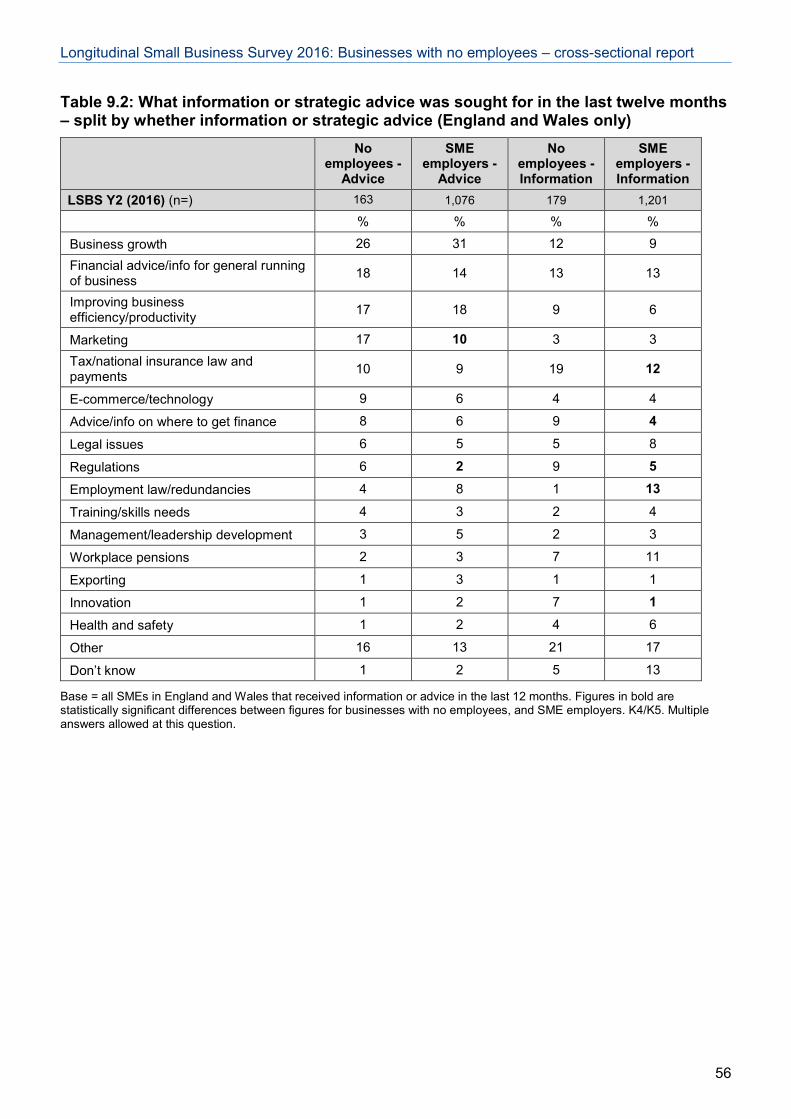
Longitudinal Small Business Survey 2016: Businesses with no employees – cross-sectional report
Table 9.2: What information or strategic advice was sought for in the last twelve months – split by whether information or strategic advice (England and Wales only)
No
employees - Advice
SME employers -
Advice
No employees - Information
SME employers - Information
LSBS Y2 (2016) (n=) 163 1,076 179 1,201
% % % %
Business growth 26 31 12 9 Financial advice/info for general running of business 18 14 13 13
Improving business efficiency/productivity 17 18 9 6
Marketing 17 10 3 3 Tax/national insurance law and payments 10 9 19 12
E-commerce/technology 9 6 4 4
Advice/info on where to get finance 8 6 9 4
Legal issues 6 5 5 8
Regulations 6 2 9 5
Employment law/redundancies 4 8 1 13
Training/skills needs 4 3 2 4
Management/leadership development 3 5 2 3
Workplace pensions 2 3 7 11
Exporting 1 3 1 1
Innovation 1 2 7 1
Health and safety 1 2 4 6
Other 16 13 21 17
Don’t know 1 2 5 13
Base = all SMEs in England and Wales that received information or advice in the last 12 months. Figures in bold are statistically significant differences between figures for businesses with no employees, and SME employers. K4/K5. Multiple answers allowed at this question.
56
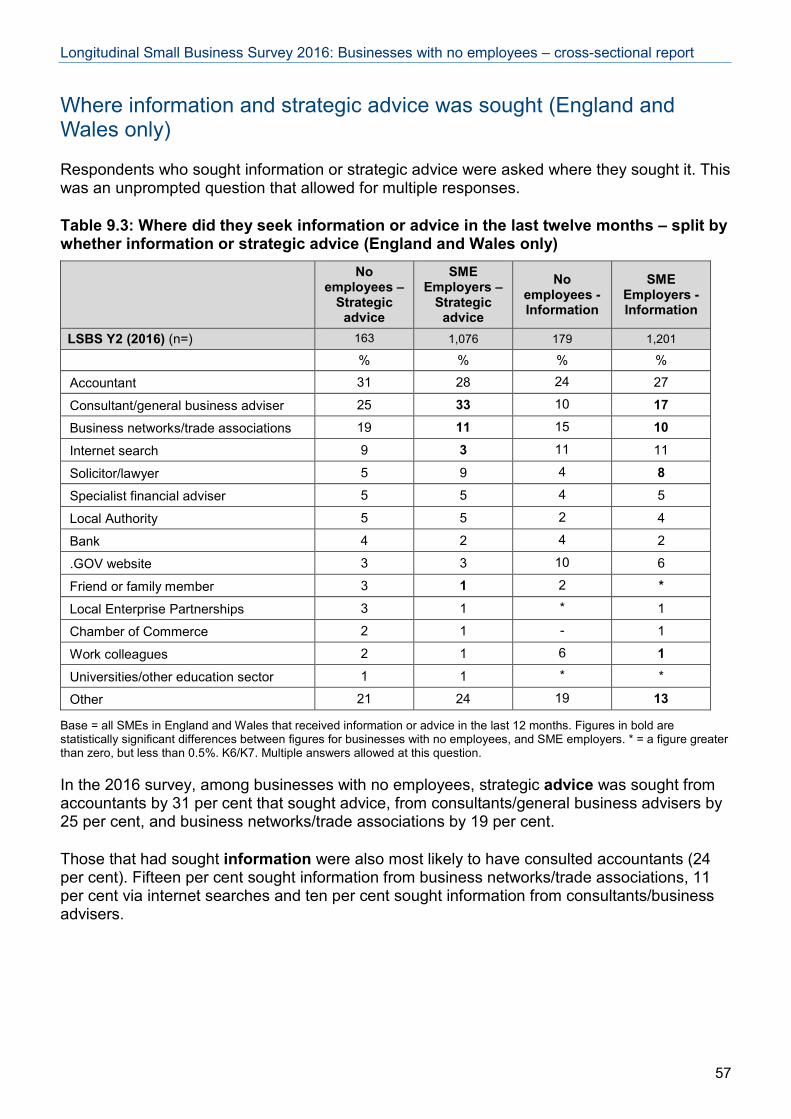
Longitudinal Small Business Survey 2016: Businesses with no employees – cross-sectional report
Where information and strategic advice was sought (England and Wales only)
Respondents who sought information or strategic advice were asked where they sought it. This was an unprompted question that allowed for multiple responses.
Table 9.3: Where did they seek information or advice in the last twelve months – split by whether information or strategic advice (England and Wales only)
No employees –
Strategic advice
SME Employers –
Strategic advice
No employees - Information
SME Employers - Information
LSBS Y2 (2016) (n=) 163 1,076 179 1,201
% % % %
Accountant 31 28 24 27
Consultant/general business adviser 25 33 10 17
Business networks/trade associations 19 11 15 10
Internet search 9 3 11 11
Solicitor/lawyer 5 9 4 8
Specialist financial adviser 5 5 4 5
Local Authority 5 5 2 4
Bank 4 2 4 2
.GOV website 3 3 10 6
Friend or family member 3 1 2 *
Local Enterprise Partnerships 3 1 * 1
Chamber of Commerce 2 1 - 1
Work colleagues 2 1 6 1
Universities/other education sector 1 1 * *
Other 21 24 19 13
Base = all SMEs in England and Wales that received information or advice in the last 12 months. Figures in bold are statistically significant differences between figures for businesses with no employees, and SME employers. * = a figure greater than zero, but less than 0.5%. K6/K7. Multiple answers allowed at this question.
In the 2016 survey, among businesses with no employees, strategic advice was sought from accountants by 31 per cent that sought advice, from consultants/general business advisers by 25 per cent, and business networks/trade associations by 19 per cent.
Those that had sought information were also most likely to have consulted accountants (24 per cent). Fifteen per cent sought information from business networks/trade associations, 11 per cent via internet searches and ten per cent sought information from consultants/business advisers.
57
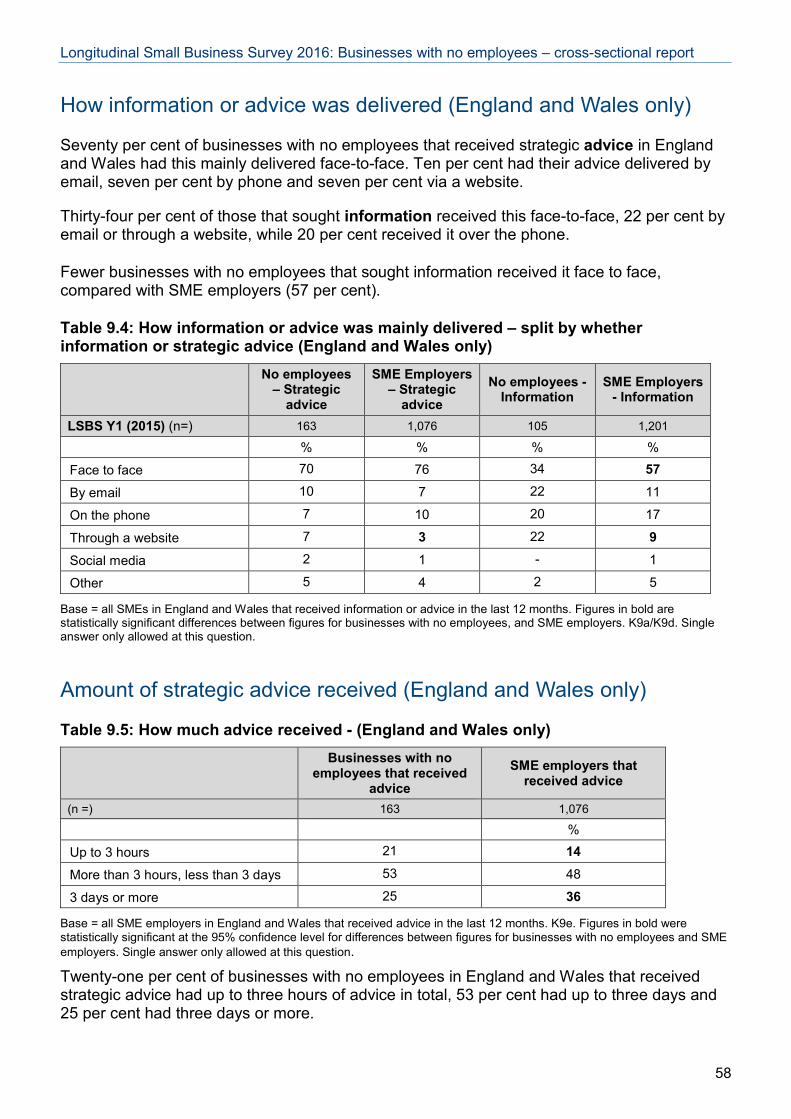
Longitudinal Small Business Survey 2016: Businesses with no employees – cross-sectional report
How information or advice was delivered (England and Wales only)
Seventy per cent of businesses with no employees that received strategic advice in England and Wales had this mainly delivered face-to-face. Ten per cent had their advice delivered by email, seven per cent by phone and seven per cent via a website.
Thirty-four per cent of those that sought information received this face-to-face, 22 per cent by email or through a website, while 20 per cent received it over the phone.
Fewer businesses with no employees that sought information received it face to face, compared with SME employers (57 per cent).
Table 9.4: How information or advice was mainly delivered – split by whether information or strategic advice (England and Wales only)
No employees
– Strategic advice
SME Employers – Strategic
advice No employees -
Information SME Employers
- Information
LSBS Y1 (2015) (n=) 163 1,076 105 1,201
% % % %
Face to face 70 76 34 57
By email 10 7 22 11
On the phone 7 10 20 17
Through a website 7 3 22 9
Social media 2 1 - 1
Other 5 4 2 5
Base = all SMEs in England and Wales that received information or advice in the last 12 months. Figures in bold are statistically significant differences between figures for businesses with no employees, and SME employers. K9a/K9d. Single answer only allowed at this question.
Amount of strategic advice received (England and Wales only)
Table 9.5: How much advice received - (England and Wales only)
Businesses with no
employees that received advice
SME employers that received advice
(n =) 163 1,076
%
Up to 3 hours 21 14
More than 3 hours, less than 3 days 53 48
3 days or more 25 36
Base = all SME employers in England and Wales that received advice in the last 12 months. K9e. Figures in bold were statistically significant at the 95% confidence level for differences between figures for businesses with no employees and SME employers. Single answer only allowed at this question.
Twenty-one per cent of businesses with no employees in England and Wales that received strategic advice had up to three hours of advice in total, 53 per cent had up to three days and 25 per cent had three days or more.
58
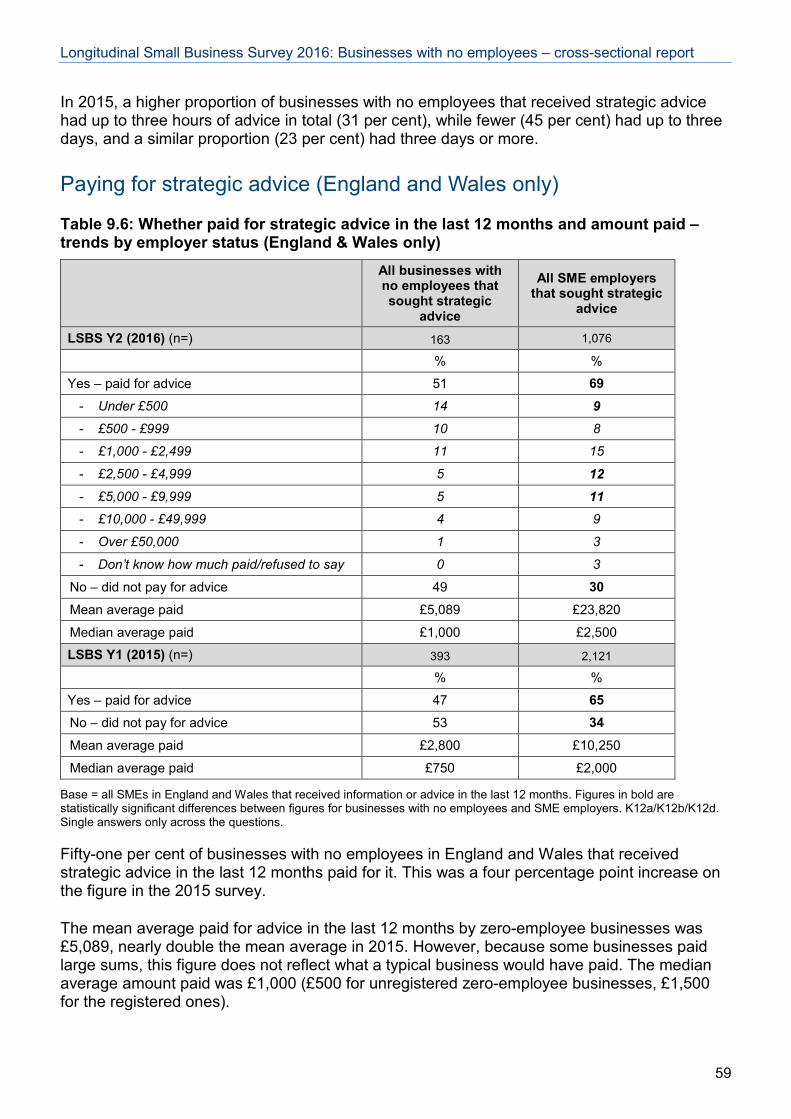
Longitudinal Small Business Survey 2016: Businesses with no employees – cross-sectional report
In 2015, a higher proportion of businesses with no employees that received strategic advice had up to three hours of advice in total (31 per cent), while fewer (45 per cent) had up to three days, and a similar proportion (23 per cent) had three days or more.
Paying for strategic advice (England and Wales only)
Table 9.6: Whether paid for strategic advice in the last 12 months and amount paid – trends by employer status (England & Wales only)
All businesses with no employees that sought strategic
advice
All SME employers that sought strategic
advice
LSBS Y2 (2016) (n=) 163 1,076
% %
Yes – paid for advice 51 69 - Under £500 14 9 - £500 - £999 10 8
- £1,000 - £2,499 11 15
- £2,500 - £4,999 5 12 - £5,000 - £9,999 5 11 - £10,000 - £49,999 4 9
- Over £50,000 1 3
- Don’t know how much paid/refused to say 0 3
No – did not pay for advice 49 30 Mean average paid £5,089 £23,820
Median average paid £1,000 £2,500
LSBS Y1 (2015) (n=) 393 2,121
% %
Yes – paid for advice 47 65 No – did not pay for advice 53 34 Mean average paid £2,800 £10,250
Median average paid £750 £2,000
Base = all SMEs in England and Wales that received information or advice in the last 12 months. Figures in bold are statistically significant differences between figures for businesses with no employees and SME employers. K12a/K12b/K12d. Single answers only across the questions.
Fifty-one per cent of businesses with no employees in England and Wales that received strategic advice in the last 12 months paid for it. This was a four percentage point increase on the figure in the 2015 survey.
The mean average paid for advice in the last 12 months by zero-employee businesses was £5,089, nearly double the mean average in 2015. However, because some businesses paid large sums, this figure does not reflect what a typical business would have paid. The median average amount paid was £1,000 (£500 for unregistered zero-employee businesses, £1,500 for the registered ones).
59
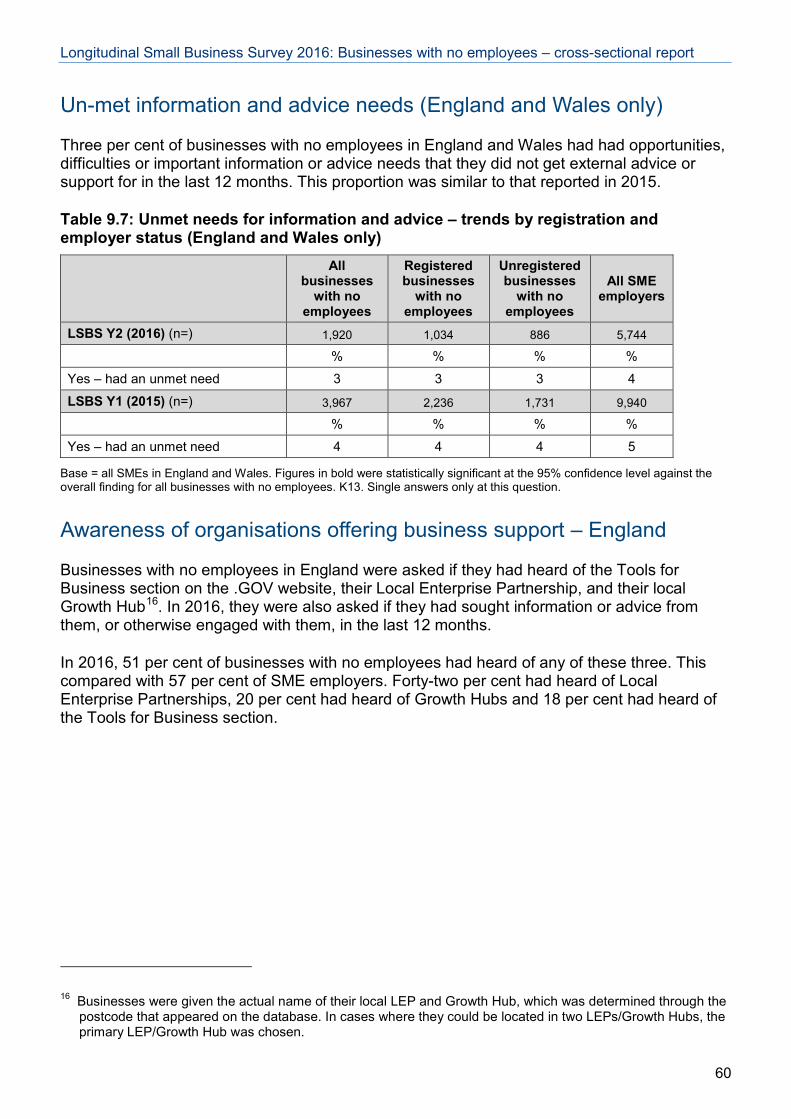
Longitudinal Small Business Survey 2016: Businesses with no employees – cross-sectional report
Un-met information and advice needs (England and Wales only)
Three per cent of businesses with no employees in England and Wales had had opportunities, difficulties or important information or advice needs that they did not get external advice or support for in the last 12 months. This proportion was similar to that reported in 2015.
Table 9.7: Unmet needs for information and advice – trends by registration and employer status (England and Wales only)
All businesses
with no employees
Registered businesses
with no employees
Unregistered businesses
with no employees
All SME employers
LSBS Y2 (2016) (n=) 1,920 1,034 886 5,744
% % % %
Yes – had an unmet need 3 3 3 4
LSBS Y1 (2015) (n=) 3,967 2,236 1,731 9,940
% % % %
Yes – had an unmet need 4 4 4 5
Base = all SMEs in England and Wales. Figures in bold were statistically significant at the 95% confidence level against the overall finding for all businesses with no employees. K13. Single answers only at this question.
Awareness of organisations offering business support – England
Businesses with no employees in England were asked if they had heard of the Tools for Business section on the .GOV website, their Local Enterprise Partnership, and their local Growth Hub16. In 2016, they were also asked if they had sought information or advice from them, or otherwise engaged with them, in the last 12 months.
In 2016, 51 per cent of businesses with no employees had heard of any of these three. This compared with 57 per cent of SME employers. Forty-two per cent had heard of Local Enterprise Partnerships, 20 per cent had heard of Growth Hubs and 18 per cent had heard of the Tools for Business section.
16 Businesses were given the actual name of their local LEP and Growth Hub, which was determined through the postcode that appeared on the database. In cases where they could be located in two LEPs/Growth Hubs, the primary LEP/Growth Hub was chosen.
60
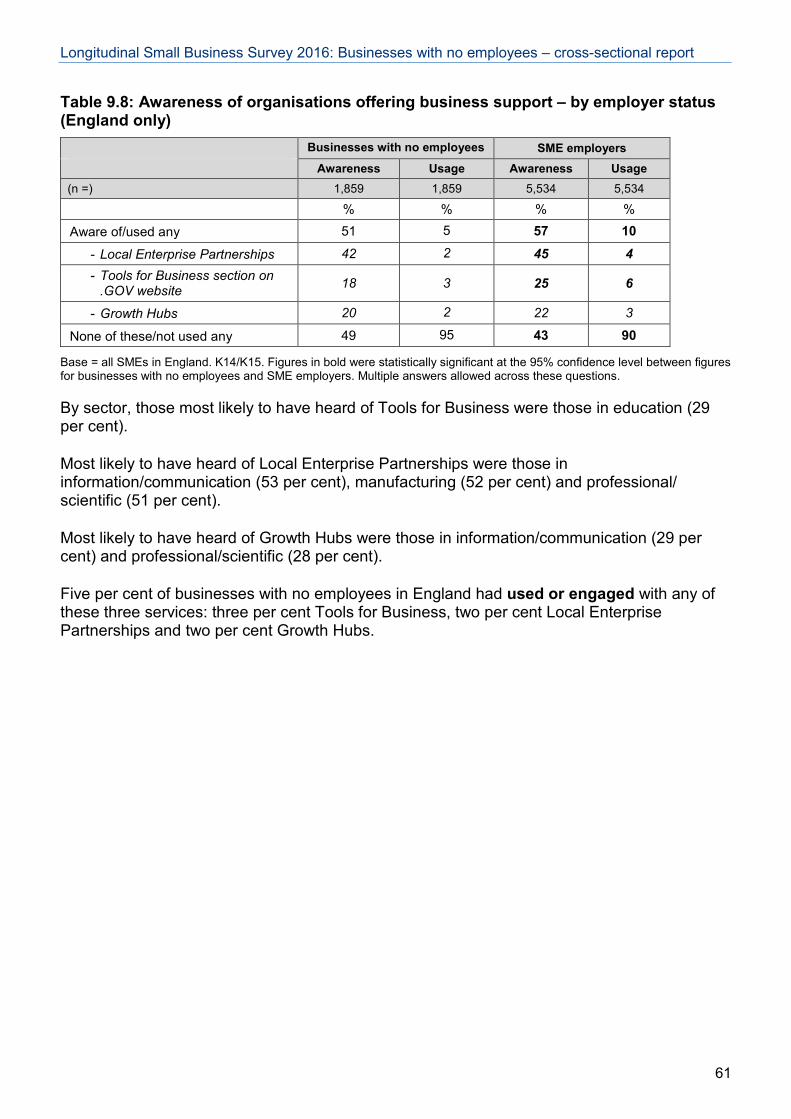
Longitudinal Small Business Survey 2016: Businesses with no employees – cross-sectional report
Table 9.8: Awareness of organisations offering business support – by employer status (England only) Businesses with no employees SME employers Awareness Usage Awareness Usage (n =) 1,859 1,859 5,534 5,534
% % % %
Aware of/used any 51 5 57 10
- Local Enterprise Partnerships 42 2 45 4 - Tools for Business section on
.GOV website 18 3 25 6
- Growth Hubs 20 2 22 3
None of these/not used any 49 95 43 90
Base = all SMEs in England. K14/K15. Figures in bold were statistically significant at the 95% confidence level between figures for businesses with no employees and SME employers. Multiple answers allowed across these questions.
By sector, those most likely to have heard of Tools for Business were those in education (29 per cent).
Most likely to have heard of Local Enterprise Partnerships were those in information/communication (53 per cent), manufacturing (52 per cent) and professional/ scientific (51 per cent).
Most likely to have heard of Growth Hubs were those in information/communication (29 per cent) and professional/scientific (28 per cent).
Five per cent of businesses with no employees in England had used or engaged with any of these three services: three per cent Tools for Business, two per cent Local Enterprise Partnerships and two per cent Growth Hubs.
61
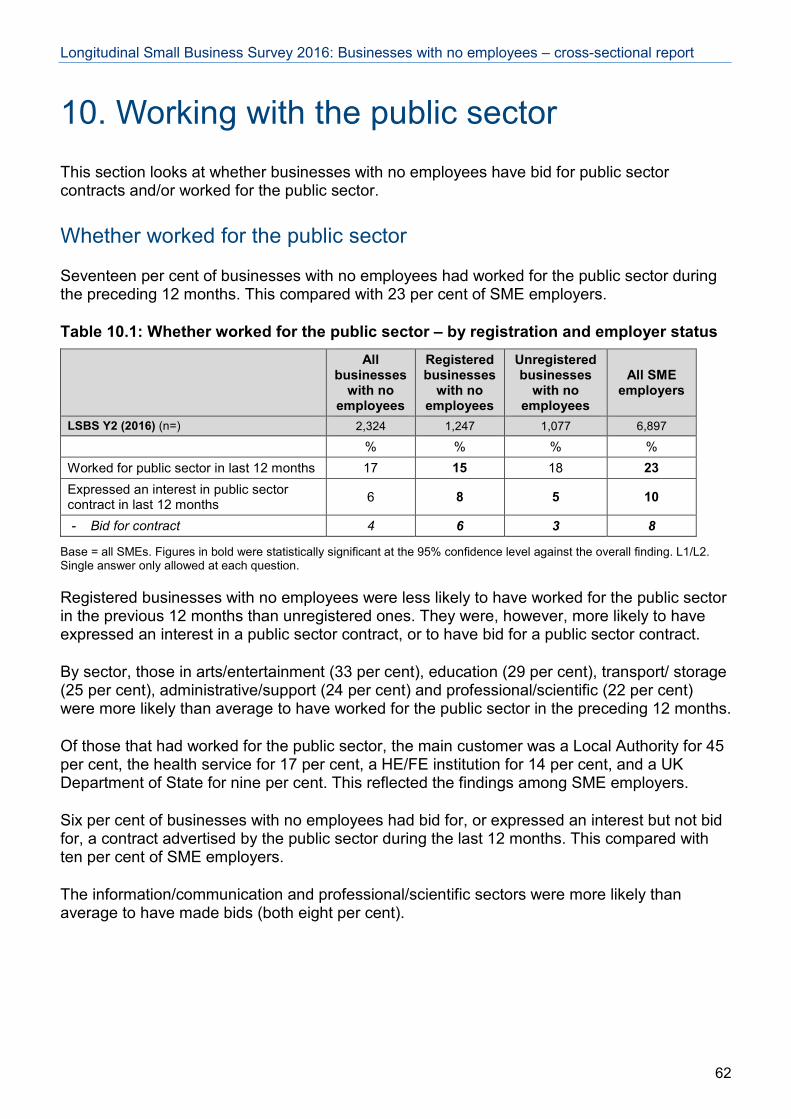
Longitudinal Small Business Survey 2016: Businesses with no employees – cross-sectional report
10. Working with the public sector This section looks at whether businesses with no employees have bid for public sector contracts and/or worked for the public sector.
Whether worked for the public sector
Seventeen per cent of businesses with no employees had worked for the public sector during the preceding 12 months. This compared with 23 per cent of SME employers.
Table 10.1: Whether worked for the public sector – by registration and employer status
All businesses
with no employees
Registered businesses
with no employees
Unregistered businesses
with no employees
All SME employers
LSBS Y2 (2016) (n=) 2,324 1,247 1,077 6,897
% % % % Worked for public sector in last 12 months 17 15 18 23 Expressed an interest in public sector contract in last 12 months 6 8 5 10
- Bid for contract 4 6 3 8
Base = all SMEs. Figures in bold were statistically significant at the 95% confidence level against the overall finding. L1/L2. Single answer only allowed at each question.
Registered businesses with no employees were less likely to have worked for the public sector in the previous 12 months than unregistered ones. They were, however, more likely to have expressed an interest in a public sector contract, or to have bid for a public sector contract.
By sector, those in arts/entertainment (33 per cent), education (29 per cent), transport/ storage (25 per cent), administrative/support (24 per cent) and professional/scientific (22 per cent) were more likely than average to have worked for the public sector in the preceding 12 months.
Of those that had worked for the public sector, the main customer was a Local Authority for 45 per cent, the health service for 17 per cent, a HE/FE institution for 14 per cent, and a UK Department of State for nine per cent. This reflected the findings among SME employers.
Six per cent of businesses with no employees had bid for, or expressed an interest but not bid for, a contract advertised by the public sector during the last 12 months. This compared with ten per cent of SME employers.
The information/communication and professional/scientific sectors were more likely than average to have made bids (both eight per cent).
62
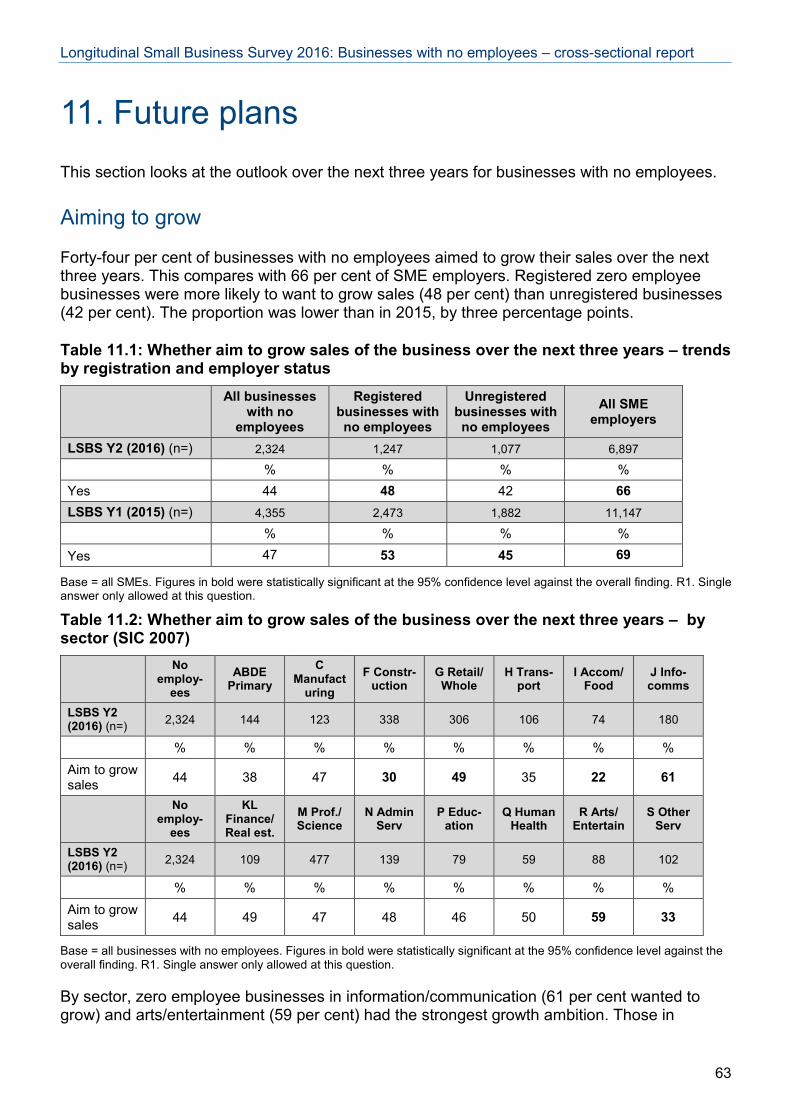
Longitudinal Small Business Survey 2016: Businesses with no employees – cross-sectional report
11. Future plans This section looks at the outlook over the next three years for businesses with no employees.
Aiming to grow
Forty-four per cent of businesses with no employees aimed to grow their sales over the next three years. This compares with 66 per cent of SME employers. Registered zero employee businesses were more likely to want to grow sales (48 per cent) than unregistered businesses (42 per cent). The proportion was lower than in 2015, by three percentage points.
Table 11.1: Whether aim to grow sales of the business over the next three years – trends by registration and employer status
All businesses
with no employees
Registered businesses with no employees
Unregistered businesses with no employees
All SME employers
LSBS Y2 (2016) (n=) 2,324 1,247 1,077 6,897
% % % % Yes 44 48 42 66 LSBS Y1 (2015) (n=) 4,355 2,473 1,882 11,147
% % % %
Yes 47 53 45 69
Base = all SMEs. Figures in bold were statistically significant at the 95% confidence level against the overall finding. R1. Single answer only allowed at this question.
Table 11.2: Whether aim to grow sales of the business over the next three years – by sector (SIC 2007)
No
employ-ees
ABDE Primary
C Manufact
uring F Constr-
uction G Retail/ Whole
H Trans-port
I Accom/ Food
J Info-comms
LSBS Y2 (2016) (n=) 2,324 144 123 338 306 106 74 180
% % % % % % % % Aim to grow sales 44 38 47 30 49 35 22 61
No
employ-ees
KL Finance/ Real est.
M Prof./ Science
N Admin Serv
P Educ-ation
Q Human Health
R Arts/ Entertain
S Other Serv
LSBS Y2 (2016) (n=) 2,324 109 477 139 79 59 88 102
% % % % % % % % Aim to grow sales 44 49 47 48 46 50 59 33
Base = all businesses with no employees. Figures in bold were statistically significant at the 95% confidence level against the overall finding. R1. Single answer only allowed at this question.
By sector, zero employee businesses in information/communication (61 per cent wanted to grow) and arts/entertainment (59 per cent) had the strongest growth ambition. Those in
63
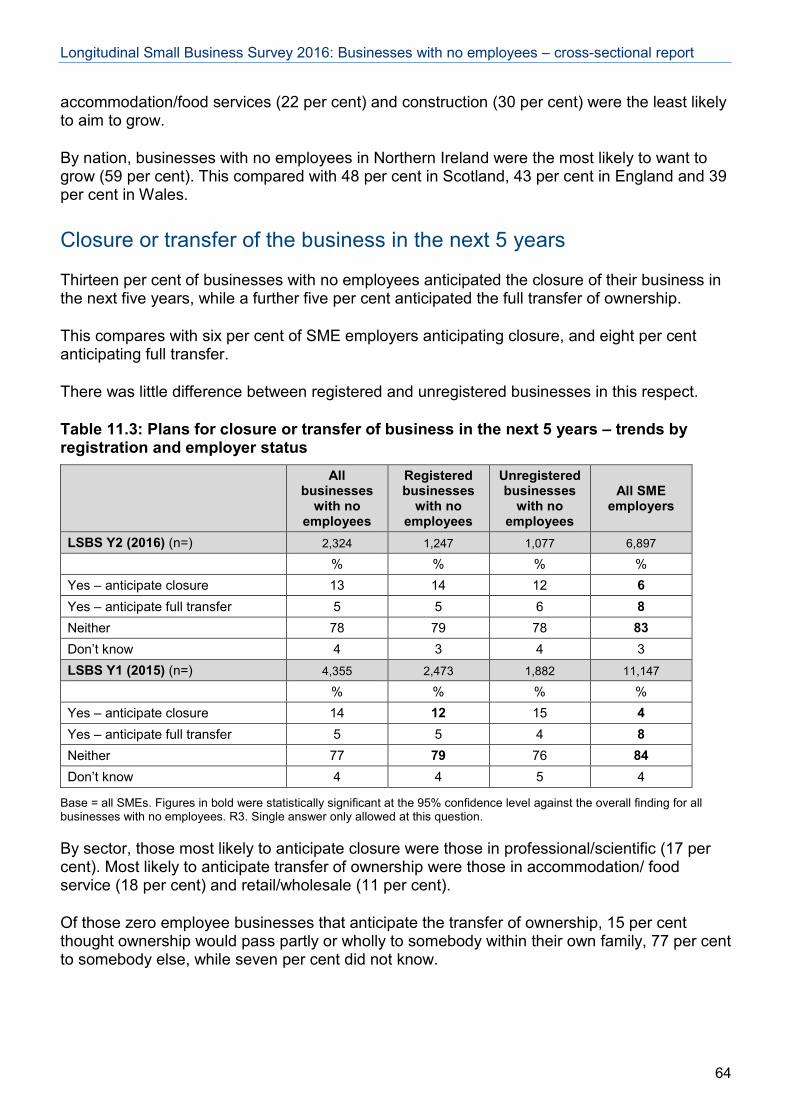
Longitudinal Small Business Survey 2016: Businesses with no employees – cross-sectional report
accommodation/food services (22 per cent) and construction (30 per cent) were the least likely to aim to grow.
By nation, businesses with no employees in Northern Ireland were the most likely to want to grow (59 per cent). This compared with 48 per cent in Scotland, 43 per cent in England and 39 per cent in Wales.
Closure or transfer of the business in the next 5 years
Thirteen per cent of businesses with no employees anticipated the closure of their business in the next five years, while a further five per cent anticipated the full transfer of ownership.
This compares with six per cent of SME employers anticipating closure, and eight per cent anticipating full transfer.
There was little difference between registered and unregistered businesses in this respect.
Table 11.3: Plans for closure or transfer of business in the next 5 years – trends by registration and employer status
All businesses
with no employees
Registered businesses
with no employees
Unregistered businesses
with no employees
All SME employers
LSBS Y2 (2016) (n=) 2,324 1,247 1,077 6,897
% % % % Yes – anticipate closure 13 14 12 6 Yes – anticipate full transfer 5 5 6 8 Neither 78 79 78 83 Don’t know 4 3 4 3 LSBS Y1 (2015) (n=) 4,355 2,473 1,882 11,147
% % % % Yes – anticipate closure 14 12 15 4 Yes – anticipate full transfer 5 5 4 8 Neither 77 79 76 84 Don’t know 4 4 5 4
Base = all SMEs. Figures in bold were statistically significant at the 95% confidence level against the overall finding for all businesses with no employees. R3. Single answer only allowed at this question.
By sector, those most likely to anticipate closure were those in professional/scientific (17 per cent). Most likely to anticipate transfer of ownership were those in accommodation/ food service (18 per cent) and retail/wholesale (11 per cent).
Of those zero employee businesses that anticipate the transfer of ownership, 15 per cent thought ownership would pass partly or wholly to somebody within their own family, 77 per cent to somebody else, while seven per cent did not know.
64
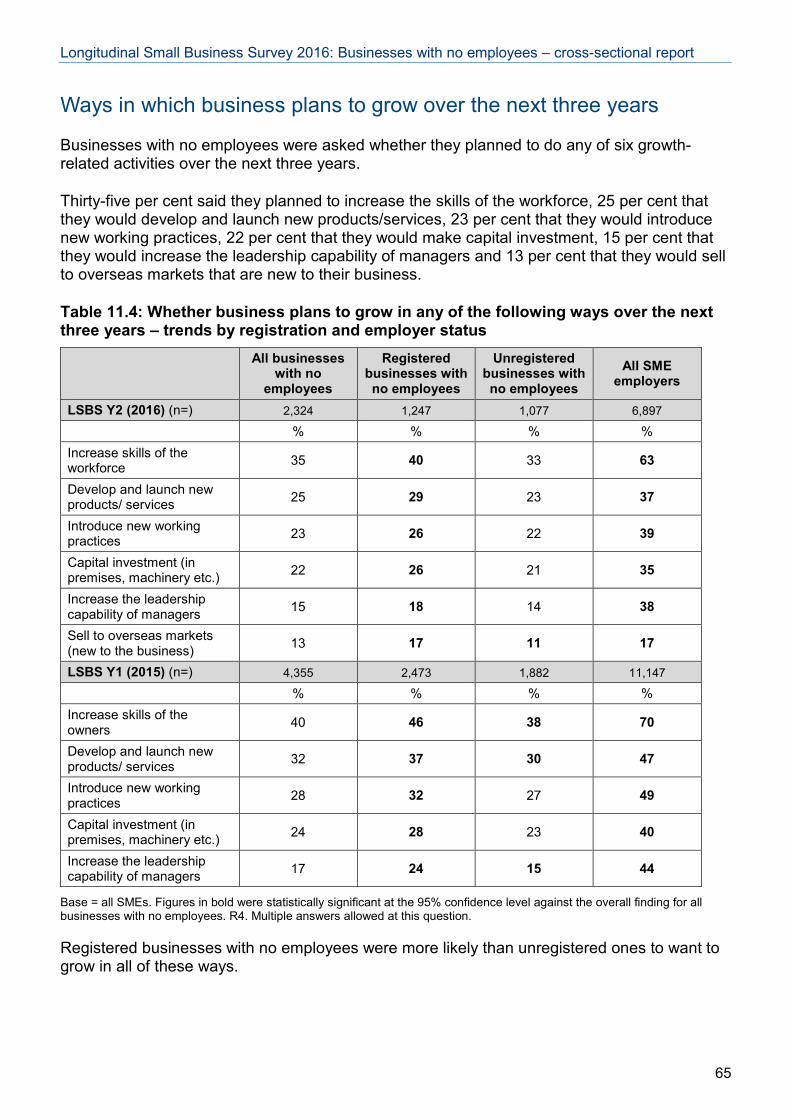
Longitudinal Small Business Survey 2016: Businesses with no employees – cross-sectional report
Ways in which business plans to grow over the next three years
Businesses with no employees were asked whether they planned to do any of six growth-related activities over the next three years.
Thirty-five per cent said they planned to increase the skills of the workforce, 25 per cent that they would develop and launch new products/services, 23 per cent that they would introduce new working practices, 22 per cent that they would make capital investment, 15 per cent that they would increase the leadership capability of managers and 13 per cent that they would sell to overseas markets that are new to their business.
Table 11.4: Whether business plans to grow in any of the following ways over the next three years – trends by registration and employer status
All businesses
with no employees
Registered businesses with no employees
Unregistered businesses with no employees
All SME employers
LSBS Y2 (2016) (n=) 2,324 1,247 1,077 6,897
% % % % Increase skills of the workforce 35 40 33 63
Develop and launch new products/ services 25 29 23 37
Introduce new working practices 23 26 22 39
Capital investment (in premises, machinery etc.) 22 26 21 35
Increase the leadership capability of managers 15 18 14 38
Sell to overseas markets (new to the business) 13 17 11 17
LSBS Y1 (2015) (n=) 4,355 2,473 1,882 11,147
% % % % Increase skills of the owners 40 46 38 70
Develop and launch new products/ services 32 37 30 47
Introduce new working practices 28 32 27 49
Capital investment (in premises, machinery etc.) 24 28 23 40
Increase the leadership capability of managers 17 24 15 44
Base = all SMEs. Figures in bold were statistically significant at the 95% confidence level against the overall finding for all businesses with no employees. R4. Multiple answers allowed at this question.
Registered businesses with no employees were more likely than unregistered ones to want to grow in all of these ways.
65
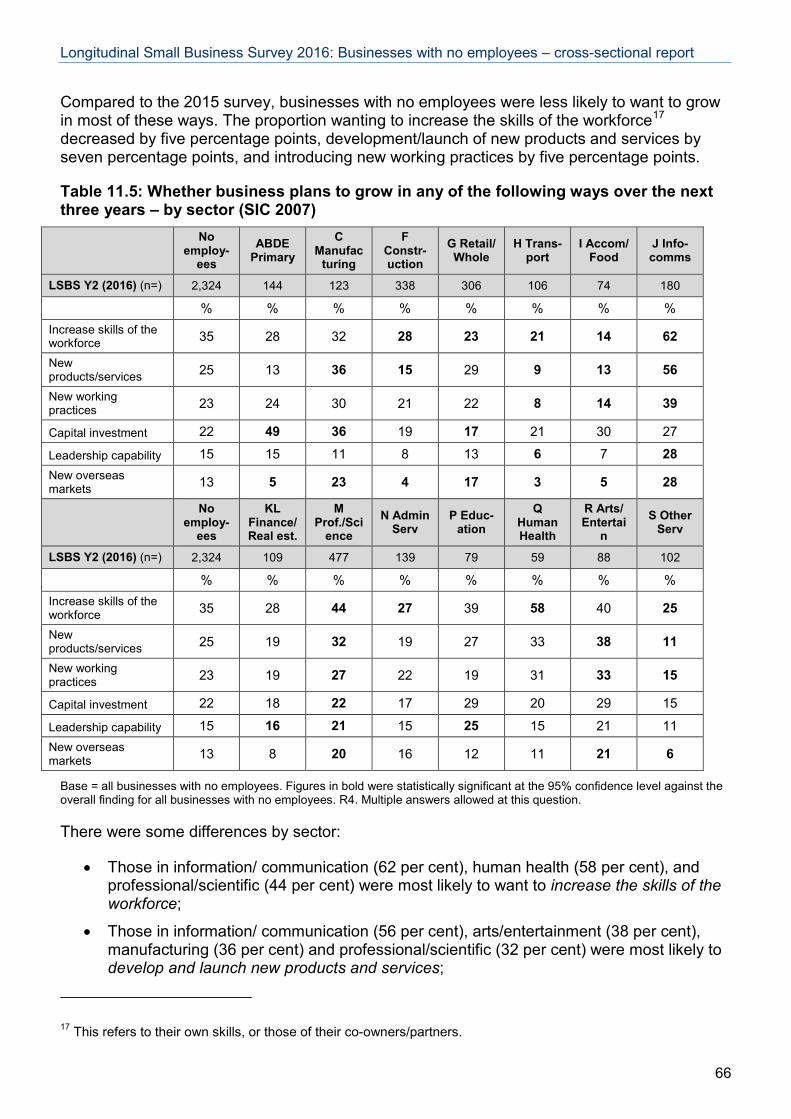
Longitudinal Small Business Survey 2016: Businesses with no employees – cross-sectional report
Compared to the 2015 survey, businesses with no employees were less likely to want to grow in most of these ways. The proportion wanting to increase the skills of the workforce17 decreased by five percentage points, development/launch of new products and services by seven percentage points, and introducing new working practices by five percentage points.
Table 11.5: Whether business plans to grow in any of the following ways over the next three years – by sector (SIC 2007)
No
employ-ees
ABDE Primary
C Manufac
turing
F Constr-uction
G Retail/ Whole
H Trans-port
I Accom/ Food
J Info-comms
LSBS Y2 (2016) (n=) 2,324 144 123 338 306 106 74 180
% % % % % % % % Increase skills of the workforce 35 28 32 28 23 21 14 62
New products/services 25 13 36 15 29 9 13 56
New working practices 23 24 30 21 22 8 14 39
Capital investment 22 49 36 19 17 21 30 27
Leadership capability 15 15 11 8 13 6 7 28 New overseas markets 13 5 23 4 17 3 5 28
No
employ-ees
KL Finance/ Real est.
M Prof./Sci
ence N Admin
Serv P Educ-
ation Q
Human Health
R Arts/ Entertai
n S Other
Serv
LSBS Y2 (2016) (n=) 2,324 109 477 139 79 59 88 102
% % % % % % % % Increase skills of the workforce 35 28 44 27 39 58 40 25
New products/services 25 19 32 19 27 33 38 11
New working practices 23 19 27 22 19 31 33 15
Capital investment 22 18 22 17 29 20 29 15
Leadership capability 15 16 21 15 25 15 21 11 New overseas markets 13 8 20 16 12 11 21 6
Base = all businesses with no employees. Figures in bold were statistically significant at the 95% confidence level against the overall finding for all businesses with no employees. R4. Multiple answers allowed at this question.
There were some differences by sector:
• Those in information/ communication (62 per cent), human health (58 per cent), and professional/scientific (44 per cent) were most likely to want to increase the skills of the workforce;
• Those in information/ communication (56 per cent), arts/entertainment (38 per cent), manufacturing (36 per cent) and professional/scientific (32 per cent) were most likely to develop and launch new products and services;
17 This refers to their own skills, or those of their co-owners/partners.
66
Longitudinal Small Business Survey 2016: Businesses with no employees – cross-sectional report
• Those in the information/communication (39 per cent) and arts/entertainment (33 per cent) sectors were more likely than average to want to introduce new working practices;
• Those in the primary sector (49 per cent) and manufacturing (36 per cent) were most likely to plan to make capital investment;
• Those in information/communications (28 per cent), education (25 per cent) and professional/scientific (21 per cent) sectors were more likely than average to want to increase leadership capability;
• Those in information/communications (28 per cent), manufacturing (23 per cent), arts/entertainment (21 per cent), professional/scientific (20 per cent) and retail/wholesale (17 per cent) sectors were most likely to sell to overseas markets that are new for their business.
67