Embed Size (px)
Citation preview

287
2.17 Polyphase (Oil/Water/Gas) Flowmeters
I. H. GIBSON
(2003)
Design Pressure
Limited by piping design class
Operating Temperature Range
Limited by piping design class, 30 to 270
°
F (0 to 130
°
C)
Fluids
Mixtures of liquids, vapors, or gases; typically oil, water, and gas
Cost
Extremely variable, depending on line size, pressure rating, and installation require-ments, starting at about $100,000
Subsea equipment commonly twice the price of surface-design units of comparablecapacity
Accuracy
Five to 10%, depending on relative proportions of phases
Partial List of Suppliers
3-Phase Measurements AS (VenturiX, PhaseTester) (www.framoeng.no)Agar Corp. (www.agarcorp.com)Aker-Kvaerner (DUET) (www.kvaerner.com/kop)FlowSys AS (Topflow)FMC Technologies (www.fmctechnologies.com)Framo Engineering AS, Schlumberger (www.framoeng.no)Jiskoot Autocontrol (Mixmeter) (www.jiskoot.com)McCrometer (www.mccrometer.com)Petroleum Software Ltd. (ESMER) (www.petroleumsoftware.co.uk)Roxar AS (Fluenta, MFI) (www.roxar.com)Solartron ISA (Dualstream) (www.solartronisa.com)
Whereas most flow measurements are carefully designed tooperate in single phase (gas, vapor, liquid), there are manycircumstances in which the ability to distinguish the compo-nents of a liquid/vapor/gas mixture (or, indeed, multipleimmiscible liquids, vapor, and gas) in the presence of solidsis highly desirable.
In the production of oil/gas from unpumped petroleumwells, the flow from several thousand meters underground tothe surface brings up water (commonly saline), inert gasessuch as carbon dioxide and nitrogen, water-saturated hydro-carbon gas (methane, ethane), hydrocarbon condensates (pro-pane, butane, and so on), and higher hydrocarbons.
The liquids and gases do not normally travel at the samevelocity, as the liquids are being dragged to the surface bythe expanding gas flow. A wide variety of flow regimes are
possible, depending on the mixture of phases and the geometry.A production facility may have tens of wells, and individualwells in a facility may have different mixes of ownership.This leads a requirement to be able to determine the flow ofthe economically interesting components from each well asaccurately as possible.
The traditional method has been to use a small
test sep-arator
that will separate the gas and the oil and water phasesfrom a single well by gravity while production from the restof the facility is flowing to production separators. The testseparator is fitted with a full array of level and pressurecontrols and flowmeters (turbine, positive-displacement, ori-fice, and others) to enable a steady-state operation to beachieved. Commonly, the test separator is operated at a pres-sure slightly above the production separator to allow the
FY101A
FY101B
FY101C
Gas
Oil
Water
MPFM
Flow Sheet Symbol
UT101
© 2003 by Béla Lipták

288
Flow Measurement
streams from the test separator to be mixed with the flowsout of the production separator. This requires a large amountof room and a complex valving system to enable each wellto be tested separately. As pressures are commonly 1000 to4500 PSI (7000 to 30,000 kPa) or higher, and the temperatureis 150 to 270
°
F (65 to 130
°
C) at the surface, the test separatoris not an inexpensive device. Individual well tests rarely canbe scheduled more frequently than monthly as a result of thetime taken to stabilize operation at a set of operating condi-tions. Even with the best of intentions, test separator mea-surements are notorious for inaccuracies, because quite smallamounts of vapor disengaging in the liquid meters can induceerrors in the 5 to 10% region.
For offshore platforms, where the cost of test separatorequipment can exceed on-shore costs by many times (andespecially for subsea operations, where operators cannot easilyaccess equipment), the potential savings from an on-linemethod of measurement have driven the development of avariety of devices over the past 15 years. These employ awide variety of operating principles, some of which are out-lined below.
The techniques used differ depending on the ratio ofliquid to gas (known as LGR or the inverse, GLR). Theextreme end of the LGR (say
<
10% by mass) is classified as
wet gas.
WET-GAS METERING
The standard approach for wet-gas metering treats the fluidas a gas. This uses differential-pressure devices (venturi ororifice) or vortex or ultrasonic meters. Turbine meters areunsatisfactory because even small quantities of high-velocityliquid can damage the meter. The venturi has a considerableadvantage over the orifice in that it does not dam liquidbehind the device, altering the flow profile. The McCrometerV-cone
meters (Section 2.28) are also suitable for thisservice and have also been used for flow conditioners.
Normal ISO 5167 flow conditioners are
not
recom-mended for wet-gas service; not only can they dam liquids,they can induce hydrocarbon hydrate formation.
Where practical, insulation of the metering run is recom-mended. In some environments, trace heating may be indicatedto prevent hydrate formation in the tapping connections.
Pressure tappings should be short and inclined verticallyupward to avoid trapping condensate in the connections andto avoid hydrate formation.
Process gas chromatographs are not recommended forwet-gas services unless the liquid content is below 0.1%.
Venturi Meters
The venturi (Section 2.29) is much more rugged than theorifice in wet-gas service and allows for higher differential-pressure operation. With modern transmitters, turndown up
to 10:1 is possible and may be necessary, given that wet-gasbehavior is far more variable than that of a pure gas.
Design is generally in accordance with ISO 5761–1,although recent work by Reader-Harris et al
1
has shown thatthe ISO coefficients are not as well defined as claimed. Thecoefficients are quite sensitive to minor machining variationsand, at high Reynolds number operation, the flow may breakaway from the throat. The coefficient can also be sensitiveto the diameter-to-length ratio of the tappings; use of the“triple-T” piezometer connections advocated by ISO 5167 isimpractical for wet-gas service, because the downward-facingtappings would fill with liquid.
A downstream tapping after the full pressure recovery isachieved is recommended to allow the calculation of liquidcontent and temperature correction to upstream conditions.
Algorithms for Wet-Gas Measurement
Differential devices used on wet-gas service will generally
overestimate
the dry-gas flow rate, and various algorithmshave been developed to compensate. The Chisholm andMurdock
2
correlations were developed for orifice plates; thede Leeuw correlation has been developed for venturi metersand is an extension of the Chisholm equations.
In addition to the dry-gas flow rate, it is normally requiredto determine the liquid flow rate, and particularly the con-densate flow rate. All three correlations (de Leeuw, Chisholm,Murdock) are based on the Lockhart–Martinelli parameter,which is a function of both liquid flow rate and density. Theliquid flow rate can be determined by
• Routing the flow to a test separator• The use of tracer techniques• Sampling
or a combination of these. Since these are all spot-test tech-niques, modification to the Lockhart–Martinelli equation canbe made to work in terms of the dry-gas mass fraction, whichis relatively constant, provided the wetness of the gas isconstant. None of these techniques is easily useful in subseaconditions, and adaptations have been made to apply dualmeasurements in series with devices of different geometrythat allow the Lockhart–Martinelli relationship to be solvedfor equal values of liquid/gas. These still require considerableinput of process data derived from composition.
Theory of Operation of Wet-Gas Metering
It has long been known that a gas stream carrying a well-dispersed liquid content through a differential flow element(orifice, nozzle, venturi, or V-cone) will develop a higherdifferential than that due to the corresponding gas flow. If theproperties of the gas and liquid are known, it is possible tocalculate the relative content of liquid in the gas.
The following development has been adapted fromthe UK DTI Oil and Gas Division’s Guidance Notes for
© 2003 by Béla Lipták

2.17 Polyphase (Oil/Water/Gas) Flowmeters
289
Petroleum Measurement under the Petroleum (Production)Regulations.
2
de Leeuw Wet-Gas Venturi Correlation
de Leuuw
3
has shown that the real gas mass flow rate can bederived from the following equations (all equations are basedon SI units):
2.17(1)
where
Q
uncorrected gas
=
uncorrected gas mass flow rate as indi-cated by the venturi meter using the following equation:
2.17(2)
where
C
gas
=
discharge coefficient of the venturi flowmeter in dry gas as determined through calibration
ε
=
expansibility of gas in venturi as defined by ISO 5167-1
d
=
throat diameter of the venturi flowmeter (corrected for temperature)
ρ
gas
=
gas density at upstream conditions
∆
P
=
raw differential pressure as measured by the transmitter
β
=
ratio of
d
to
D
, the pipe diameter
and
X
is the
Lockhart–Martinelli
parameter, which is derivedas follows:
2.17(3)
where
Q
liquid
=
combined liquid flow rate through the venturi flowmeter
ρ
liquid
=
combined liquid density
The coefficient
C
is given by the following equation:
2.17(4)
where the exponent
n
is given by
2.17(5)
2.17(6)
and
Fr
g
is the gas Froude number given by
2.17(7)
where
V
gas
=
superficial gas pipe velocity
g
=
local acceleration due to gravity
V
gas
can be derived using an iterative method and “seeding”a velocity based on the uncorrected mass flow rate. The firstpass equation is
2.17(8)
For further iterations
Q
uncorrected gas
is replaced by consecutive
Q
real gas
values until the equation converges to a solution.
Liquid Mass Flow Rate Correction Algorithm
The resultant liquid mass flow rates can be derived from thefollowing equations:
2.17(9)
Condensate mass flow rate
2.17(10)
Water mass flow rate
2.17(11)
Methanol (or glycol) mass flow rate
2.17(12)
where
ζ
condensate
=
condensate mass fraction
ζ
water
=
water mass fraction
ζ
methanol
=
methanol mass fraction
In turn,
2.17(13)
2.17(14)
2.17(15)
CX Xrealgas
uncorrectedgas=+ +( )1 2
Q C dP
uncorrectedgas gas
gas=−
επρ
β2
4
2
4 1
( )∆
XQ
Q= liquid
realgas
liquid
gas
*ρρ
C
n n
=
+
ρρ
ρρ
liquid
gas
gas
liquid
n eFr
gg= − ≥−
0 606 1 1 50 746
. ( ..
) for Fr
n g= ≤ ≤0 41 0 5 1 5. . . for Fr
Frg
V
gD=
−
gas gas
liquid gas( )*
( )
ρρ ρ
VQ
Dgasuncorrectedgas
gas
=4
2
*
ρ π
Q Q Qtotal realgas liquid= +
Q Qcondensate total condensate= *ζ
Q Qwater total water= *ζ
Q Qmethanol total methanol= *ζ
ζ ψcondensate condensate= X *
ζ ψwater water= X *
ζ ψmethanol methanol= X *
© 2003 by Béla Lipták

290
Flow Measurement
where
ψ
condensate
=
condensate-to-gas mass fraction
ψ
water
=
water-to-gas mass fraction
ψ
methanol
=
methanol-to-gas mass fraction (methanol injection is commonly used to suppress hydrocarbon hydrate formation)
Liquid Density Calculation Algorithm
The liquid density can be calculated as follows:
2.17(16)
where
ψ
liquid
=
total liquid to gas mass ratio
ρ
liquid
=
density of liquid
ρ
condensate
= density of hydrocarbon condensateρwater = density of water
ρmethanol = density of methanolρcondensate = is derived from the condensate base density
and corrected for temperature and pressure (Ctl and Cpl)
Corrections from the standard API MPMS11.2.1M maybe applied. However, for improved accuracy, it is recom-mended that samples of the condensate be obtained and ana-lyzed to derive specific correction factors. The values of K0
and K1 for crude oil (613.9723 and 0, respectively) are notideal for condensate, and the alternatives from the standardsreferred to above may be no better.
Water and methanol densities can be derived as follows:
2.17(17)
wheret = temperature at the inlet of the venturi
A, B, C = water constants (e.g., −0.0001732, −0.1307, 1040)
D, E, F = methanol constants (e.g., 0.0000713, −0.3344, 540)
The correct values of these methanol and water constantsmay vary due to salinity or product type. It is therefore advisableto have the liquids analyzed to determine appropriate values.
Upstream Temperature Correction and Pressure Recovery
The correction for downstream measured temperature toupstream temperature (in degrees centigrade) at the inlet isgiven by
2.17(18)
wheretm = measured temperatureP3 = fully recovered downstream pressureP1 = pressure measured at the upstream tappingK3 = downstream to upstream temperature correction
exponent
P3 can be measured using a third pressure tapping orcalculated (in bar) from the following empirical equationfrom Miller:4
2.17(19)
where
2.17(20)
and the constants A, B, and C, for venturies with 7 and 15°exit cone angles, are as follows:
7° cone angle A = 0.38 B = 0.42 C = 0.21815° cone angle A = 0.59 B = 0.86 C = 0.436
Gas Mass Fraction Estimation Using Tracer Techniques
The gas mass fraction can be estimated as follows:
1. Perform the tracer flow technique to determine con-densate and water flow rates and mass ratios. This usesconcentrated oil-soluble and water-soluble fluorescentchemicals, injected upstream and partially recoveredby sampling downstream of the flowmeter.
2. Analyze the condensate to determine base density.3. Sample the gas to determine gas density.4. Record the total uncorrected gas flow from venturi
during the tracer flow technique.5. Determine the dry “first pass” gas mass fraction and
liquid-to-gas ratio based on the recorded uncorrectedgas flow and tracer flow results (corrections for meth-anol injection after completion of tracer technique maybe required).
6. Seed values from the last stage into the wet-gas venturiflow calculation to determine a “first pass” correctedgas flow rate.
7. Re-seed this value into the calculation, correcting gasmass ratio and liquid-to-gas ratio.
8. Iterate the process until the corrected gas flow rateconverges.
Solartron-ISA Dualstream II Theory
The Solartron-ISA Dualstream II, originally developedby British Gas, extends the theory noted above by fittingtwo dissimilar pressure differential devices in series. Thesehave differing Lockhart–Martinelli characteristics, and the
ρψ
ψρ
ψρ
ψρ
liquidliquid
condensate
condensate
water
water
methanol
methanol
=
+
+
t tP
PKm= +
−( . )* .273 15 273 153
13
t tP
PKm= +
−( . )* .273 15 273 153
13
P P3 1310= − − * ∆ω
∆ ∆ω β β= + +( )*A B C P2
© 2003 by Béla Lipták
2.17 Polyphase (Oil/Water/Gas) Flowmeters 291
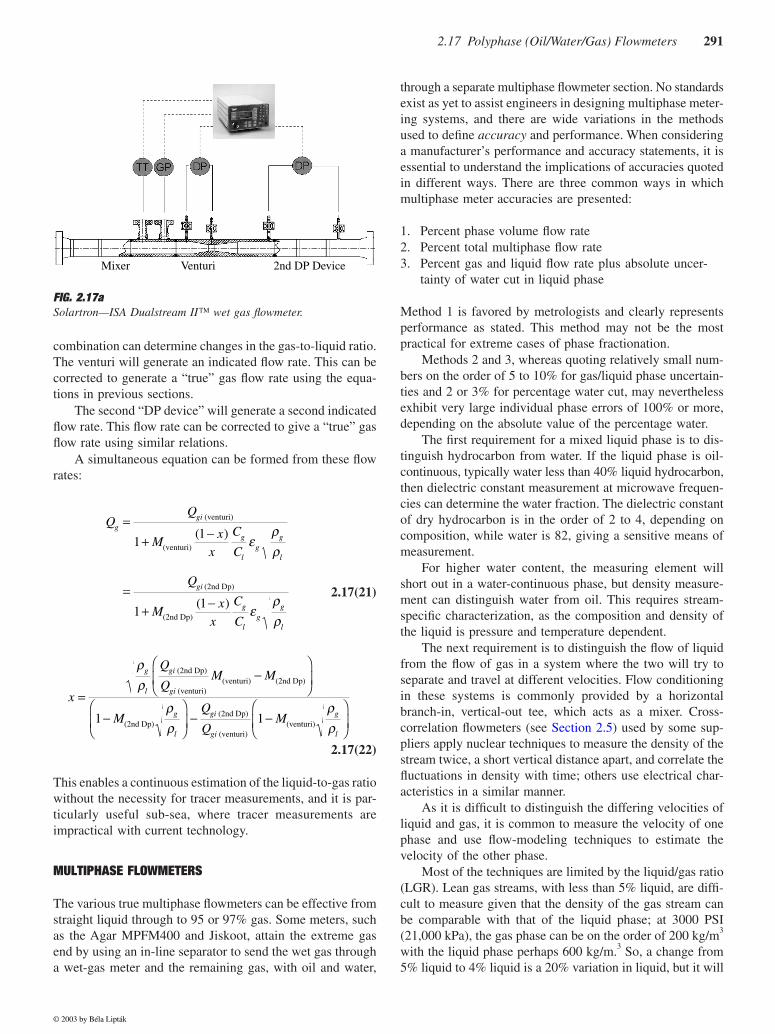
combination can determine changes in the gas-to-liquid ratio.The venturi will generate an indicated flow rate. This can becorrected to generate a “true” gas flow rate using the equa-tions in previous sections.
The second “DP device” will generate a second indicatedflow rate. This flow rate can be corrected to give a “true” gasflow rate using similar relations.
A simultaneous equation can be formed from these flowrates:
2.17(21)
2.17(22)
This enables a continuous estimation of the liquid-to-gas ratiowithout the necessity for tracer measurements, and it is par-ticularly useful sub-sea, where tracer measurements areimpractical with current technology.
MULTIPHASE FLOWMETERS
The various true multiphase flowmeters can be effective fromstraight liquid through to 95 or 97% gas. Some meters, suchas the Agar MPFM400 and Jiskoot, attain the extreme gasend by using an in-line separator to send the wet gas througha wet-gas meter and the remaining gas, with oil and water,
through a separate multiphase flowmeter section. No standardsexist as yet to assist engineers in designing multiphase meter-ing systems, and there are wide variations in the methodsused to define accuracy and performance. When consideringa manufacturer’s performance and accuracy statements, it isessential to understand the implications of accuracies quotedin different ways. There are three common ways in whichmultiphase meter accuracies are presented:
1. Percent phase volume flow rate2. Percent total multiphase flow rate3. Percent gas and liquid flow rate plus absolute uncer-
tainty of water cut in liquid phase
Method 1 is favored by metrologists and clearly representsperformance as stated. This method may not be the mostpractical for extreme cases of phase fractionation.
Methods 2 and 3, whereas quoting relatively small num-bers on the order of 5 to 10% for gas/liquid phase uncertain-ties and 2 or 3% for percentage water cut, may neverthelessexhibit very large individual phase errors of 100% or more,depending on the absolute value of the percentage water.
The first requirement for a mixed liquid phase is to dis-tinguish hydrocarbon from water. If the liquid phase is oil-continuous, typically water less than 40% liquid hydrocarbon,then dielectric constant measurement at microwave frequen-cies can determine the water fraction. The dielectric constantof dry hydrocarbon is in the order of 2 to 4, depending oncomposition, while water is 82, giving a sensitive means ofmeasurement.
For higher water content, the measuring element willshort out in a water-continuous phase, but density measure-ment can distinguish water from oil. This requires stream-specific characterization, as the composition and density ofthe liquid is pressure and temperature dependent.
The next requirement is to distinguish the flow of liquidfrom the flow of gas in a system where the two will try toseparate and travel at different velocities. Flow conditioningin these systems is commonly provided by a horizontalbranch-in, vertical-out tee, which acts as a mixer. Cross-correlation flowmeters (see Section 2.5) used by some sup-pliers apply nuclear techniques to measure the density of thestream twice, a short vertical distance apart, and correlate thefluctuations in density with time; others use electrical char-acteristics in a similar manner.
As it is difficult to distinguish the differing velocities ofliquid and gas, it is common to measure the velocity of onephase and use flow-modeling techniques to estimate thevelocity of the other phase.
Most of the techniques are limited by the liquid/gas ratio(LGR). Lean gas streams, with less than 5% liquid, are diffi-cult to measure given that the density of the gas stream canbe comparable with that of the liquid phase; at 3000 PSI(21,000 kPa), the gas phase can be on the order of 200 kg/m3
with the liquid phase perhaps 600 kg/m.3 So, a change from5% liquid to 4% liquid is a 20% variation in liquid, but it will
FIG. 2.17aSolartron—ISA Dualstream II wet gas flowmeter.
2nd DP DeviceMixer Venturi
Mx
x
C
C
Q
Mx
x
C
C
ggi
g
lg
g
l
gi
g
lg
g
l
=+ −
=+ −
(venturi)
(venturi)
(2nd Dp)
(2nd Dp)
11
11
( )
( )
ερρ
ερρ
x
Q
QM M
MQ
QM
g
l
gi
gi
g
l
gi
gi
g
l
=
−
−
− −
ρρ
ρρ
ρρ
(2nd Dp)
(venturi)(venturi) (2nd Dp)
(2nd Dp) (2nd Dp)
(venturi)(venturi)1 1
© 2003 by Béla Lipták

292 Flow Measurement
only change the density by less than 2%. To avoid this, onesupplier (AGAR) uses a centrifugal separator to separate muchof the gas from a remaining three-phase mixture, measurethis separately, and then mixes it back after the other streamhas been measured. Removing 80% of the gas enables themultiphase meter section to be much smaller and more sen-sitive to the valuable liquid hydrocarbon. The true volumetricflow of the multiphase mixture is measured by a positive-
displacement Oval gear meter, and venturi techniques andmicrowave water content distinguish the different phases.
The orientation of a multiphase flowmeter can stronglyinfluence the multiphase flow regime. In systems withmedium to high gas content and low velocity, vertical upflowcan find the gas phase unable to continuously sweep the liquidphase forward, and the liquid may recycle backward, leadingto metering errors and to slug flow. This offers a significantlow-end constraint on flow through devices of fixed geome-try, which will differ between devices of similar size.
Horizontal-flow installations can show internal segregation,with gas, oil, and water layers traveling at different velocities.Again, maintaining a high velocity helps to mix the phases,but the upstream piping layout may contribute to slugging,which the meter system can do little to correct.
Measurement in multiphase flow is notable by widelyvarying conditions under nominally constant flow. In slugflow, the liquid fraction can vary between almost zero in theregion after a liquid slug to almost 100% inside the slug.Significant fluctuations will also be present in annular andchurn flow patterns.
The pressure drop of a liquid slug passing through aventuri meter can be five times higher than the average pres-sure drop for the flow; the minimum pressure drop in thesame flow, corresponding to the film region, can be 20% ofthe average. Therefore, a venturi meter would experiencepressure drop varying by 25:1 at a nominally steady mul-tiphase production condition. This is one reason for the
FIG. 2.17bAgar MPFM 400 high void fraction meter.
Gas Bypass Loop
FFDDevice
GasMeter
PDMeter
Flow
MPFM301
OW
M
Mom
entu
m M
eter
FIG. 2.17cAker-Kvaerner “DUET” subsea multiphase flowmeter.
Pressure andTemperatureTransmitter
RadiationSourceHolders
Single-pointClamp
TronicSubsea MateableCable Connector
RadiationDetectors
ElectronicsCompartment
© 2003 by Béla Lipták

2.17 Polyphase (Oil/Water/Gas) Flowmeters 293
attraction of correlation flowmetering techniques, which donot experience such extremes yet require (and see) apprecia-ble fluctuations in physical properties in the short term.
To reduce the uncertainty associated with measurementof a parameter that fluctuates over such a wide range, manysamples are required over a relatively long measuring period.
When a multiphase meter is located at the receiving endof a pipeline, the resulting measurement is influenced by theflow into the line (which may be combined from severalwells); the flow patterns developing along the line; the ele-vation changes along the line, which can trap liquid at lowpoints; the outlet pressure changes; and other fluctuations.As can be imagined, the flow out of such a pipeline variesconsiderably, and the measuring equipment must be specifiedto cover the full range of the variation, usually based oninadequate data.
References
1. Reader-Harris, M. J., Brunton, W. C, Gibson, J. J., Hodges, D. andNicholson, I. G., Discharge coefficients of venturi tubes with standardand nonstandard convergent angles, Flow Meas. Instrum., 12, 135–145,2001.
2. U.K. Department of Trade and Industry (DTI) Oil and Gas DivisionGuidance Notes For Petroleum Measurement Under The Petroleum(Production) Regulations Issue 6, October 2001.
3. de Leeuw, H., Liquid correction of venturi meter readings in wet gasflow, North Sea Flow Measurement Workshop, Kristiansand, Norway,Paper 21, 1997.
4. Miller, R. W., Flow Measurement Engineering Handbook, Table 6.4,3rd ed., McGraw-Hill, New York, 1996.
Bibliography
Chisholm, D., Two phase flow through sharp-edged orifices, research note,J. Mech. Eng. Sci., 1977.
Couput, J. P., Wet Gas Metering in the Upstream Area: Needs, Applications& Developments, North Sea Flow Measurement Workshop, Glenea-gles, Scotland, Paper 6.1, 2000.
Jamison, A. W., Johnson, P. A., Spearman, E. P. and Sattary, J. A., Unpredictedbehaviour of venturi flow meter in gas at high Reynolds numbers, NorthSea Flow Measurement Workshop, Peebles, Scotland, 1996.
Murdock, J. W., Two phase flow measurement with orifices, J. Basic Eng.,December 1962.
Steven, R., An Overview of the Current State of Wet Gas Metering in theNatural Gas Production Industry and Proposals for Future Research,2nd Annual Course on Practical Developments in Gas Flow Meter-ing—Focus on Cost Reduction, NEL, East Kilbride, Glasgow, 1999.
Stobie, G., Wet gas flow measurement in the real world, One Day Seminaron Practical Developments in Gas Flow Metering, National Engineer-ing Laboratory, East Kilbride, Glasgow, 1998.
Stobie, G. J., Wet gas metering in the real world—part II, Wet Gas MeteringSeminar, Paris, 2001.
Van Maanen, H. R. E., Cost Reduction for Wet Gas Measurement Using theTracer-Venturi Combination, Practical Developments in Gas FlowMetering, Paper 2, NEL, East Kilbride, Glasgow, 1999.
Wilson, M. B., The Development and Testing of an Ultrasonic Flow Meterfor Wet Gas Applications, Seminar on the Measurement of Wet Gas,East Kilbride, Scotland, 1996.
Zanker, K. J., The Performance of a Multi-path Ultrasonic Meter with WetGas, North Sea Flow Measurement Workshop, Paper 6.2, Gleneagles,Scotland, 2000.
FIG. 2.17dAker-Kvaerner “DUET” subsea multiphase flowmeter sectionaldrawing.
© 2003 by Béla Lipták