Embed Size (px)
Citation preview
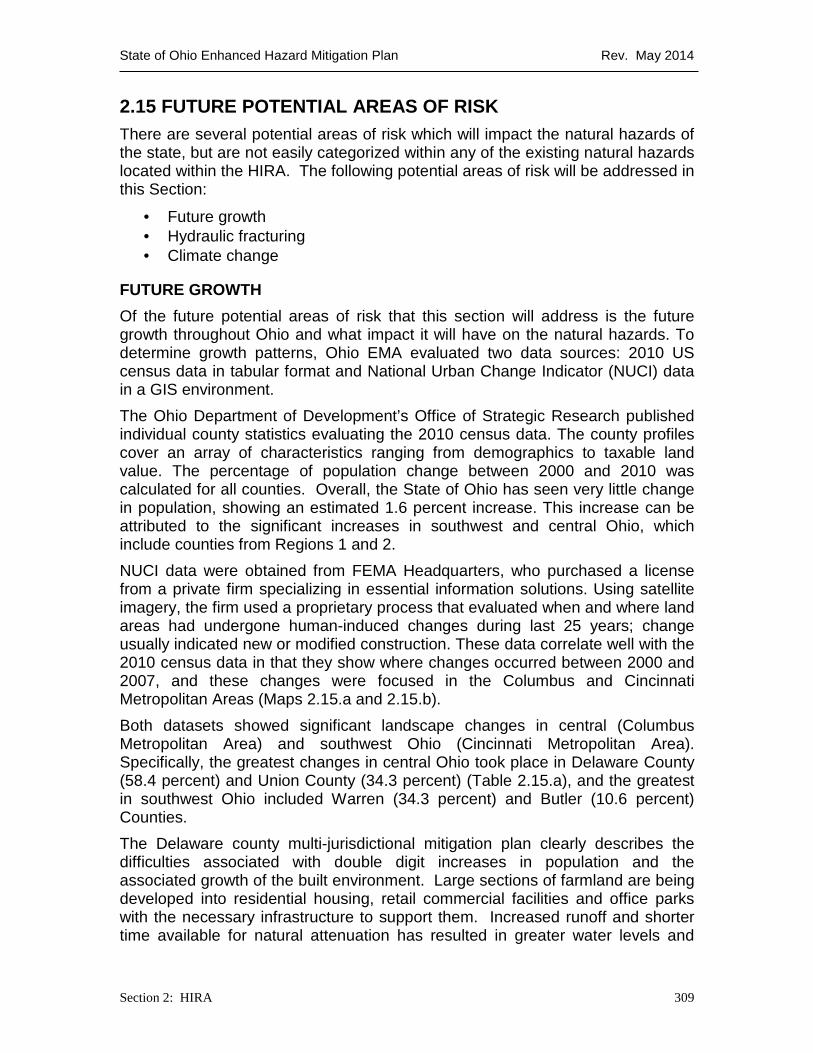
State of Ohio Enhanced Hazard Mitigation Plan Rev. May 2014
Section 2: HIRA 309
2.15 FUTURE POTENTIAL AREAS OF RISK There are several potential areas of risk which will impact the natural hazards of the state, but are not easily categorized within any of the existing natural hazards located within the HIRA. The following potential areas of risk will be addressed in this Section:
· Future growth · Hydraulic fracturing · Climate change
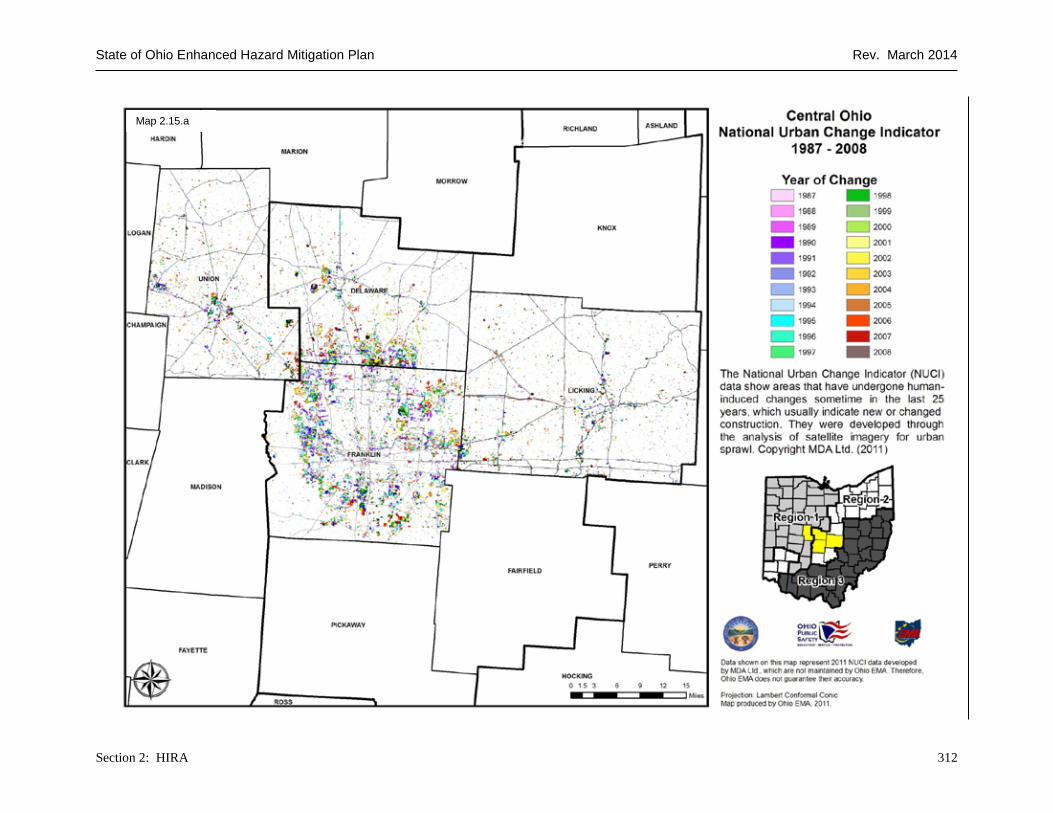
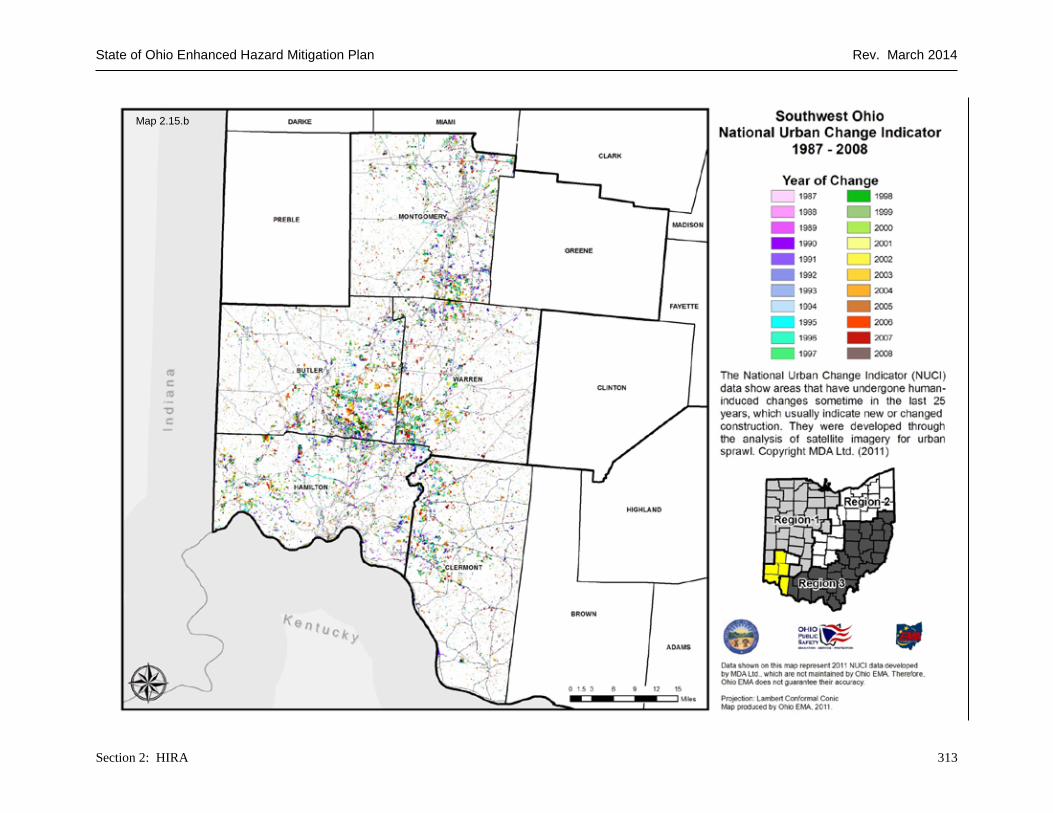
FUTURE GROWTH Of the future potential areas of risk that this section will address is the future growth throughout Ohio and what impact it will have on the natural hazards. To determine growth patterns, Ohio EMA evaluated two data sources: 2010 US census data in tabular format and National Urban Change Indicator (NUCI) data in a GIS environment. The Ohio Department of Development’s Office of Strategic Research published individual county statistics evaluating the 2010 census data. The county profiles cover an array of characteristics ranging from demographics to taxable land value. The percentage of population change between 2000 and 2010 was calculated for all counties. Overall, the State of Ohio has seen very little change in population, showing an estimated 1.6 percent increase. This increase can be attributed to the significant increases in southwest and central Ohio, which include counties from Regions 1 and 2. NUCI data were obtained from FEMA Headquarters, who purchased a license from a private firm specializing in essential information solutions. Using satellite imagery, the firm used a proprietary process that evaluated when and where land areas had undergone human-induced changes during last 25 years; change usually indicated new or modified construction. These data correlate well with the 2010 census data in that they show where changes occurred between 2000 and 2007, and these changes were focused in the Columbus and Cincinnati Metropolitan Areas (Maps 2.15.a and 2.15.b). Both datasets showed significant landscape changes in central (Columbus Metropolitan Area) and southwest Ohio (Cincinnati Metropolitan Area). Specifically, the greatest changes in central Ohio took place in Delaware County (58.4 percent) and Union County (34.3 percent) (Table 2.15.a), and the greatest in southwest Ohio included Warren (34.3 percent) and Butler (10.6 percent) Counties. The Delaware county multi-jurisdictional mitigation plan clearly describes the difficulties associated with double digit increases in population and the associated growth of the built environment. Large sections of farmland are being developed into residential housing, retail commercial facilities and office parks with the necessary infrastructure to support them. Increased runoff and shorter time available for natural attenuation has resulted in greater water levels and

State of Ohio Enhanced Hazard Mitigation Plan Rev. May 2014
Section 2: HIRA 310
flows near existing neighborhoods. The county has a clear understanding of the problems, their implications and is working to address them through mitigation planning and educational outreach. Part of the difficulty in addressing the situation is that the growth areas are creating high-value real estate for Ohio, while the impacted areas range from manufactured home parks to older, residential structures built in or near the floodplain. Over time the size of the regulatory floodplain can be expected to increase due to development. Two other central Ohio counties, Union and Fairfield, experienced moderate growth; however, no adverse impacts were observed.
Table 2.15.a
Ohio Counties Showing Significant Population Growth
(2000-2014)
Ohio Region County Percent Increase
2 Delaware 58.4%
2 Warren 34.3%
1 Union 27.8%
2 Fairfield 19.1%
2 Licking 14.4%
2 Butler 10.6%
Considering the rapid growth in southwest Ohio, the Warren County Regional Planning Commission has planned for structured growth, which has resulted in minimal adverse impact. The Warren County multi-jurisdictional mitigation plan outlines the program objectives to:
· Discourage small, isolated subdivisions where soil conditions and lot size are not conducive to on-site wastewater disposal systems, where applicable;
· Encourage a logical pattern of residential development where future growth would occur in proximity to existing residential areas, within the designated Urban Service Areas of the township;
· Build multi-family housing at a scale that can accommodate the need, combined with prudent use of the Planned Unit Development process, to

State of Ohio Enhanced Hazard Mitigation Plan Rev. May 2014
Section 2: HIRA 311
accomplish quality development, mitigating the impact of county utilities and other public services;
· Develop adequate, well designed and affordable housing for the elderly population, the handicapped and families with children;
· Give a stronger emphasis to establishing open space/green belt areas, separating developing residential areas from incompatible uses;
· Establish a system to encourage housing maintenance through a coordinated, ongoing inspection program by county and local officials;
· Encourage the repair or removal of dilapidated/substandard structures;
· Identify, document and protect older homes or residential areas of historical and/or architectural significance from unwanted, incompatible land uses; and
· Explore the establishment of an historical zoning district to protect individual structures or neighborhoods of historical and/or architectural significance.
Mitigation planning and associated strategies have been adequately developed to minimize adverse effects from the significant growth experienced in central and southwest Ohio and aid in community resilience.
State of Ohio Enhanced Hazard Mitigation Plan Rev. March 2014
Section 2: HIRA 312
Map 2.15.a
State of Ohio Enhanced Hazard Mitigation Plan Rev. March 2014
Section 2: HIRA 313
Map 2.15.b

State of Ohio Enhanced Hazard Mitigation Plan Rev. May 2014
Section 2: HIRA 314
OHIO BALANCED GROWTH STRATEGY One of the primary strategies that the State of Ohio adopted to address future growth throughout state is the Ohio Balanced Growth strategy. (http://balancedgrowth.ohio.gov) This strategy is a voluntary, incentive based program that provides local governments with a regional planning framework based upon watersheds and water resource protection. The fundamental principle to guide the action of state agencies is that if local governments within a watershed can agree upon areas where development is to be encouraged and which are to be conserved, Ohio will align state programs to support these locally based decisions and conversely will not utilize state programs to violate them. The Ohio Water Resources Council (OWRC) has implemented this initiative statewide based upon a previous program development by the Ohio Lake Erie Commission (OLEC). The program has many elements that encourage balanced growth throughout the state, specifically:
· Focusing on land use and development planning in Ohio’s watersheds. The goal is to link land use planning to the health of watersheds and major bodies of water.
· Creation of Watershed Planning Partnerships to encourage regional cooperation on the issues of land use planning and development.
· Production of Watershed Balanced Growth Plans, which will guide how growth and conversation would be promoted by both local and state policies.
· The development of model regulations to promote local land use practices that minimize development impacts on water quality.
· Align state policies, incentives and other resources to support Watershed Balanced Growth planning and implementation.
WATERSHED BALANCED GROWTH PLANS One of the primary aspects of the Ohio Balanced Growth Strategy is the creation and adoption of a Watershed Balanced Growth Plan. These plans are intended to provide a framework for regional decision-making on growth, conservation, stormwater issues and water quality. Each of these plans is based upon the 10 guiding principles for sustainable Ohio watersheds, the guiding principles are:
1. Maximize investment in existing core urban areas, transportation, and infrastructure networks to enhance the economic vitality of existing communities. 2. Minimize the conversion of green space and the loss of critical habitat areas, farmland, forest, and open spaces. 3. Limit any net increase in the loading of pollutants or transfer of pollution loading from one medium to another.

State of Ohio Enhanced Hazard Mitigation Plan Rev. May 2014
Section 2: HIRA 315
4. To the extent feasible, protect and restore the natural hydrology of the watershed and flow characteristics of its streams, tributaries, and wetlands. 5. Restore the physical habitat and chemical water quality of the watershed to protect and restore diverse and thriving plant communities and preserve rare and endangered species. 6. Encourage the inclusion of all economic and environmental factors into cost / benefit accounting in land use and development decisions. 7. Avoid development decisions that shift economic benefits or environmental burdens from one location within a region to another. 8. Establish and maintain a safe, efficient, and accessible transportation system that integrates highway, rail, air, transit, water, and pedestrian networks to foster economic growth and personal travel. 9. Encourage all new development and redevelopment initiatives to address the need to protect and preserve access to historic, cultural, and scenic resources. 10. Promote public access to and enjoyment of our natural resources for all Ohioans
These Watershed Balanced Growth plans are not intended to supersede either local comprehensive plans or local hazard mitigation plans, but to harmonize with them. Each Watershed Balanced Growth Plan must identify or include the following:
· Priority Conservation Areas (PCA), which are critical areas to protect within the watershed. This includes areas which provide flood control, are susceptible to significant natural hazards and offer areas for ecological / open space restoration in urban areas.
· Priority Development Areas (PDA), which are areas where development should be encouraged. This included area which will maximize development potential and efficient use of infrastructure.
· The related documentation for justifying the designation of any PCAs or PDAs.
· Plans for the implementation of any developed strategies and a description of the governance structure.
· A specific statement noting how the plan will meet the 10 guiding principles for sustainable Ohio watersheds.
STATE INCENTIVES One of the challenges of the Balance Growth Program is that the State of Ohio is a home rule State. Therefore all land use, zoning, and planning decisions are made solely at the local level. State agencies do, however, influence the location of development in many ways through infrastructure investments, economic

State of Ohio Enhanced Hazard Mitigation Plan Rev. May 2014
Section 2: HIRA 316
development incentives, tax policies and other policies and programs. In order to encourage local watershed groups to undertake the Balanced Growth Program process, the state created an incentive package that is available to Watershed Planning Partners and their participating local jurisdictions with an endorsed plan. These are the 26 state programs that include special consideration for Balanced Growth participating communities, these programs are offered by various state agencies including the OEPA, ODNR, ODSA, ODOT and several other State agencies. More information about the specific state sponsored incentives is available at http://balancedgrowth.ohio.gov/BalancedGrowthStrategy.aspx
BEST LOCAL LAND USE PRACTICES In addition to providing incentives for the adoption of Balance Growth Plans, the State has created several best local land use practices that address the following subject matters:
· Stream, Floodplain, and Wetland Protection
· Storm Water Management/Erosion and Sediment Control
· Comprehensive Planning
· Compact Development
· Conservation Development
· Natural Areas Establishment and Management
· Source Water Protection These best local land use practices are available for download at http://balancedgrowth.ohio.gov/BestLocalLandUsePractices/BestLocalLandUsePractices2012.aspx
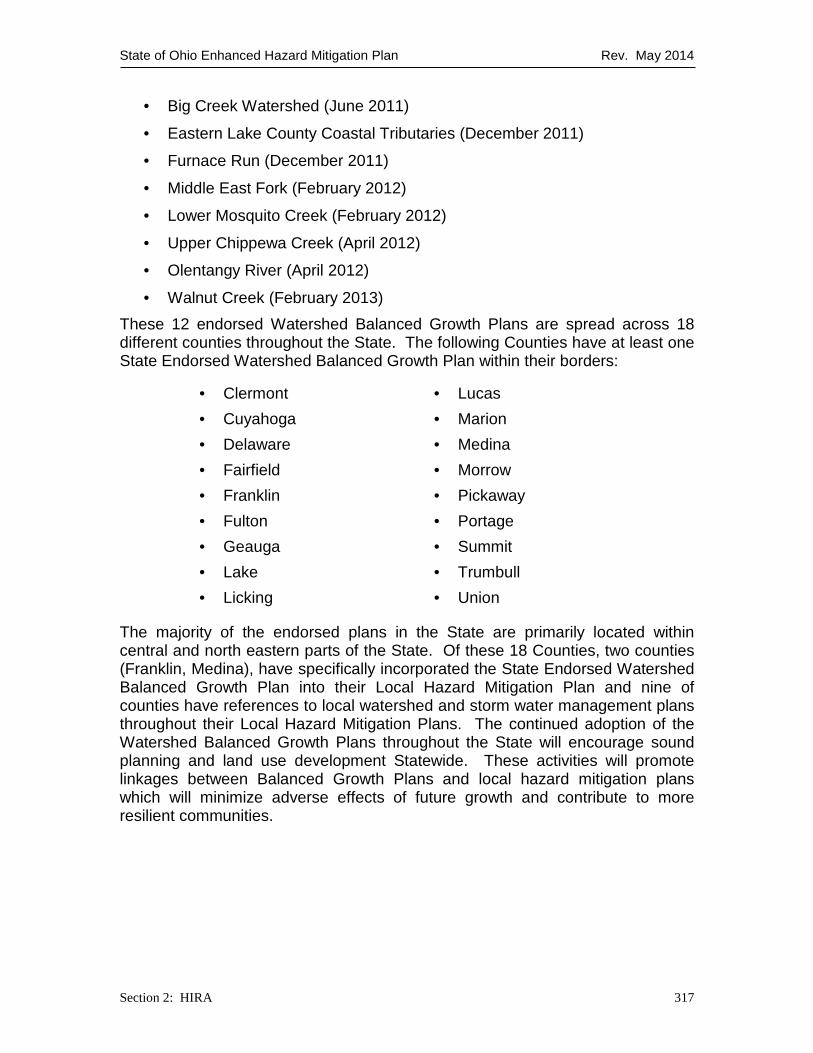
LOCAL ADOPTION OF WATERSHED BALANCED GROWTH PLANS Since 2008, 12 local State endorsed Watershed Balanced Growth Plans have been adopted throughout the State of Ohio and over half of those plans were adopted in the past three years. The plans must be adopted at the local level with support from local governments that represent at least 75% of the geographic land area of a watershed, and 75% of the local governments in the watershed and 75% of the population in the watershed. Once local support requirements are met, the state conducts a final review prior to endorsing the plan to ensure compliance with the criteria of the program. The following Watershed Balanced Growth Plans have been adopted at the local level and endorsed by the State of Ohio:
· Chippewa Creek Watershed (December 2008)
· Upper West Branch Rocky River Watershed (June 2009)
· Chagrin River Watershed (September 2009)
· Swan Creek Watershed (September 2009)
State of Ohio Enhanced Hazard Mitigation Plan Rev. May 2014
Section 2: HIRA 317
· Big Creek Watershed (June 2011)
· Eastern Lake County Coastal Tributaries (December 2011)
· Furnace Run (December 2011)
· Middle East Fork (February 2012)
· Lower Mosquito Creek (February 2012)
· Upper Chippewa Creek (April 2012)
· Olentangy River (April 2012)
· Walnut Creek (February 2013) These 12 endorsed Watershed Balanced Growth Plans are spread across 18 different counties throughout the State. The following Counties have at least one State Endorsed Watershed Balanced Growth Plan within their borders:
The majority of the endorsed plans in the State are primarily located within central and north eastern parts of the State. Of these 18 Counties, two counties (Franklin, Medina), have specifically incorporated the State Endorsed Watershed Balanced Growth Plan into their Local Hazard Mitigation Plan and nine of counties have references to local watershed and storm water management plans throughout their Local Hazard Mitigation Plans. The continued adoption of the Watershed Balanced Growth Plans throughout the State will encourage sound planning and land use development Statewide. These activities will promote linkages between Balanced Growth Plans and local hazard mitigation plans which will minimize adverse effects of future growth and contribute to more resilient communities.
· Clermont · Lucas · Cuyahoga · Marion · Delaware · Medina · Fairfield · Morrow · Franklin · Pickaway · Fulton · Portage · Geauga · Summit · Lake · Trumbull · Licking · Union
State of Ohio Enhanced Hazard Mitigation Plan Rev. May 2014
Section 2: HIRA 318
State of Ohio Enhanced Hazard Mitigation Plan Rev. May 2014
Section 2: HIRA 319
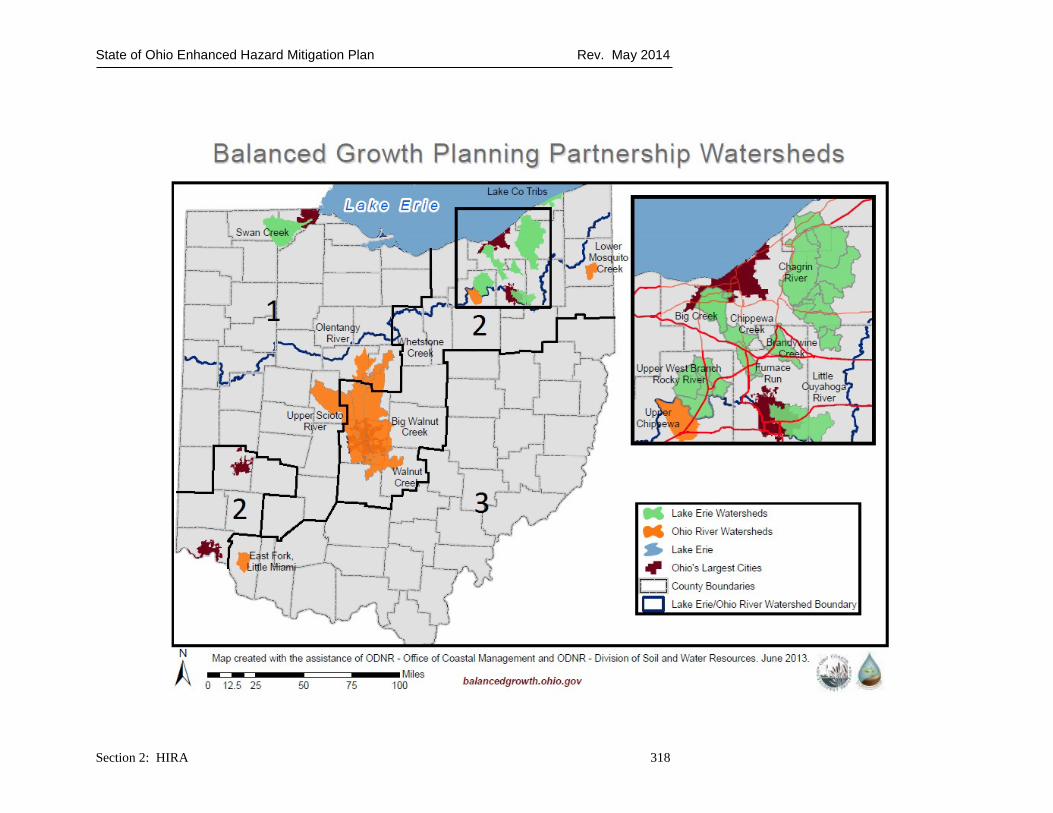
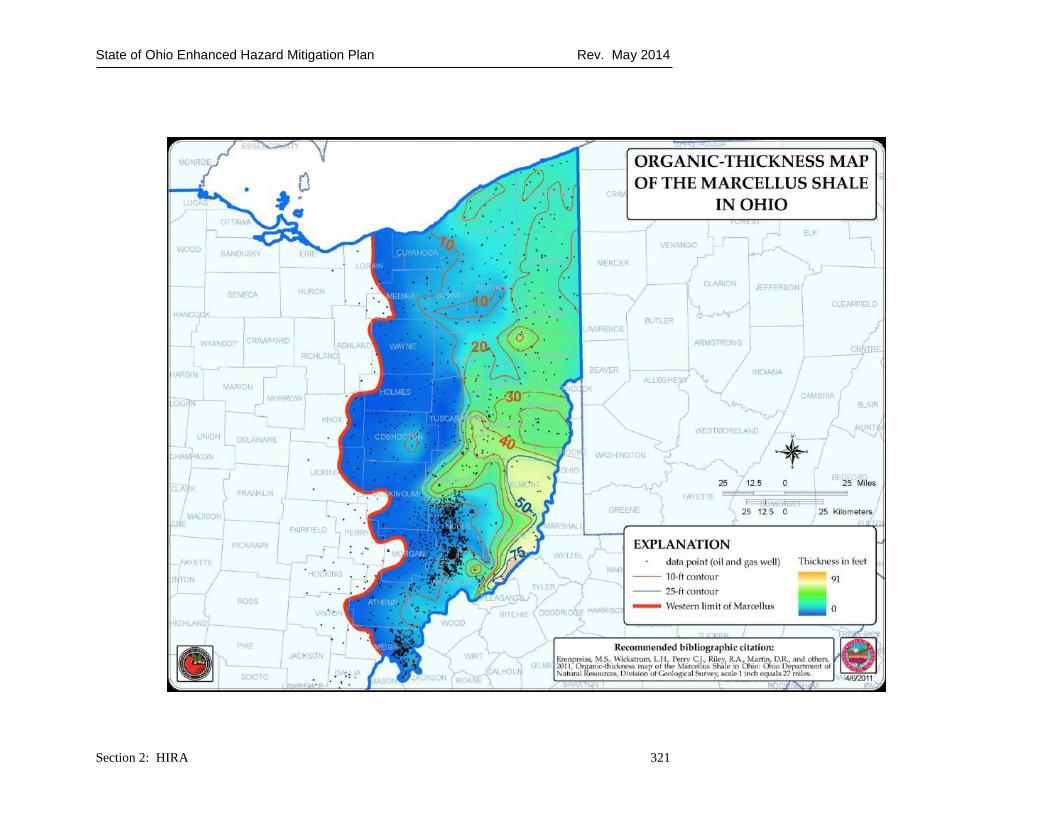
NATURAL GAS DRILLING IN THE MARCELLUS AND UTICA SHALE Together, the Marcellus and Utica Shale regions extend across New York, Pennsylvania, Maryland, West Virginia, Ohio and portions of Kentucky and these deposits sit between 7,000 and 12,000 feet below ground. Both the Marcellus and the Utica shale regions are important geologic formations because they hold large reserves of natural gas. Researchers estimate the Marcellus Shale alone could contain as much as 363 trillion cubic feet of natural gas. Ohio is experiencing far less Marcellus Shale drilling than several of the neighboring states because the Marcellus Shale is much thinner on its western edge.

State of Ohio Enhanced Hazard Mitigation Plan Rev. May 2014
Section 2: HIRA 320
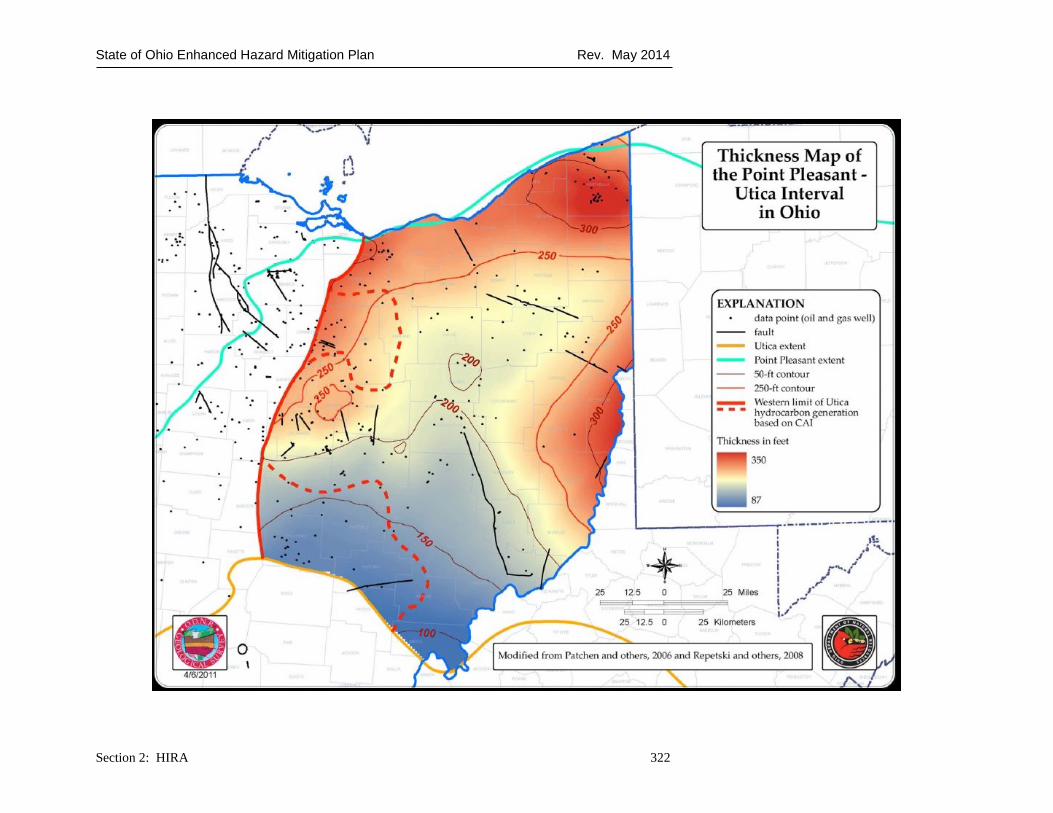
Ohio has and will continue to see a significant increase in drilling as much of the State sits over the Utica Shale Formation. The extraction of natural gas from the Shale is a two-step process of horizontal drilling and hydraulic fracturing. The process starts with a production well, which is drilled thousands of feet downward and then gradually angled out horizontally through the Shale deposit. After the well is drilled, a mixture of water, sand and chemicals additives is injected at very high pressure to fracture the Shale. This part of the process called hydraulic fracturing or fracing, is a technique used in the oil and gas industry since the 1950’s. Per the ONDR Division of Geological Survey, resource estimates indicate the Devonian-age Marcellus Shale is the largest exploration play in the eastern United States. Recently, the application of horizontal drilling combined with multi-staged hydraulic fracturing to create permeable flow paths from wellbores into shale units has resulted in a drilling boom for the Marcellus in the Appalachian Basin states of Pennsylvania, West Virginia, southern New York, and eastern Ohio. Fracturing technology also may have application in other shale units, such as the Ordovician-age Utica Shale, which extends across much of the Appalachian Basin region. While limited production has occurred in the Utica up to this point, thickness and widespread geographical extent indicate it may also have great oil-and-gas potential.
State of Ohio Enhanced Hazard Mitigation Plan Rev. May 2014
Section 2: HIRA 321
State of Ohio Enhanced Hazard Mitigation Plan Rev. May 2014
Section 2: HIRA 322

State of Ohio Enhanced Hazard Mitigation Plan Rev. May 2014
Section 2: HIRA 323
CURRENT STATE OF NATURAL GAS AND OIL DRILLING IN THE STATE The Ohio Oil & Gas Summary issued each year reflects the most up to date information and trends effecting Ohio’s oil and gas industries. The 48th edition of this Summary noted that 553 oil and gas wells were drilled in the state is 2012 and this is down from a peak of 1089 new wells drilled in 2008. The spike of wells drilled from 2005-2008 was related to the exploration of the Devonian Shale. Of the 553 wells drilled in 2012, 198 or 36% of all wells were drilled to the Utica/Point Pleasant Shale formations.
According to an analysis of “The Economic Potential for Shale Formations in Ohio” authored by a joint partnership of Cleveland State University, Ohio State University and Marietta College, the future growth of the drilling in the Utica-Point Pleasant Shale will occur at an extremely rapid rate in the next several years.
The attachment provided the ONDR Division of Oil and Gas Resources Management indicates the activity of horizontal well drilling in the Utica-Point Pleasant Shale in the State. As this map indicates the current and future activity will occur in the eastern and southeastern portions of the State.

State of Ohio Enhanced Hazard Mitigation Plan Rev. May 2014
Section 2: HIRA 324
ENVIRONMENTAL CONCERNS Some citizens and local governments are becoming aware and concerned about the potential environmental and societal impacts of drilling activity in their communities. The primary concerns noted in “Drilling for Natural Gas in the Marcellus and Utica Shales: Environmental Regulatory Basics” by ODNR & OEPA dated November 2012 are:

State of Ohio Enhanced Hazard Mitigation Plan Rev. May 2014
Section 2: HIRA 325
· The possible impacts of brine or flowback water on ground water resources
· The hydraulic fracturing fluid compositions and there possible health effects
· Increased road traffic and higher road maintenance costs · Method of disposal for the brine, hydraulic fracturing fluid and other
substances related to the drilling · Possible increase in seismic activity from injection wells · Possible increase in air pollution from the drilling related activities
REGULATION OF NATURAL GAS DRILLING IN THE MARCELLUS AND UTICA SHALE The regulation of Natural Gas Drilling in the Marcellus and Utica Shale lies with primarily two bodies in the State of Ohio, the Ohio Department of Natural Resources (ODNR) and the Ohio Environmental Protection Agency (OEPA). The table below is a summary of ODNR and OEPA regulatory authorities over oil/gas drilling and production activities.
The ODNR Division of Oil and Gas summarizes below the impacts and effects of the two the primary legislative acts that created the current framework for have regulating the oil and gas industry in the State of Ohio.
SENATE BILL 165 On March 31, 2010 Governor Ted Strickland signed Substitute SB 165, the first major revision to Ohio oil and gas law in twenty-five years. Many significant

State of Ohio Enhanced Hazard Mitigation Plan Rev. May 2014
Section 2: HIRA 326
changes were implemented as a result of passage of this new legislation which became effective on June 30, 2010. The bill provided for enhanced permitting authority in urban areas, strengthened funding for operations and orphan well plugging, added additional notification requirements by the industry and expanded enforcement provisions.
SENATE BILL 315 On June 11, 2012, Governor John Kasich signed landmark oil and gas regulatory legislation. This law established one of the nation’s toughest regulatory frameworks for overseeing the new technologies that allow for the exploration of natural gas in deep shale rock formations. The new law builds on recently approved well construction standards, which are extremely protective of groundwater and the environment. SB 315 does the following:
· Creates the nation’s first combined well construction and hydraulic fracturing chemical disclosure requirement. The law requires chemical disclosure during all aspects of the initial drilling process and during hydraulic fracturing, while adhering to existing federal and state trade secret/proprietary laws. However, ODNR can upon request obtain proprietary chemical formulas to conduct an investigation or in response to a spill. The public has the ability to view hydraulic fracturing fluid compositions used at specific wells at the website “fracfocus.org”.
· Requires the sharing of all chemical information with doctors. Doctors may share even proprietary chemical information with the patient and other medical professionals directly involved in treating a patient.
· Allows appeals to the Ohio Oil & Gas Commission for certain permitting concerns prior to perusing court action.
· Establishes mandatory daily fines for well operators who violate the law. · Requires well operators to take pre-drilling water samples within 1,500
feet of a proposed horizontal well and disclose the results in permit applications.
· Requires well operators to disclose the proposed source of water used in the well drilling and hydraulic fracturing process.
· Encourages well operators to enter into a Road Use Maintenance Agreement (RUMA) with local government. The agreement also stipulates designated travel routes for heavy equipment haulers to ensure safety and minimize impact. SB 315 requires ODNR and ODOT work with local officials to review and report on the effectiveness of the RUMA process.
· Requires injection well owners to electronically transmit quarterly reports to ODNR with information about each shipment.
State of Ohio Enhanced Hazard Mitigation Plan Rev. May 2014
Section 2: HIRA 327
LOCAL LAND USE, ZONING REGULATION, AND HOME RULE In the state, municipal corporations (cities and villages) have certain powers granted to them in Article XVIII of the state Constitution that exist outside their authority found in the Revised Code. Because these powers originate in the Constitution, laws passed by the General Assembly that interfere with them are invalid as applied to municipal corporations unless those laws otherwise are sanctioned by the Constitution. These constitutionally granted powers, known as “home rule” power include the power of local self-government, the exercise of certain police powers, and the ownership and operation of public utilities. “Police power” has been defined as the authority to make regulations for the public health, safety, and morals and the general welfare of society. Keep in mind any Municipal laws for the exercise of municipal police powers cannot be in conflict with general laws. Included in these “Police power” regulations are local land use and zoning regulation. http://www.lsc.state.oh.us/membersonly/128municipalhomerule.pdf The Ohio Supreme Court recently heard arguments whether municipal corporations have the authority to regulate and approve the location of oil and gas wells through local zoning code. The city of Munroe Falls in northeastern Oho is asking the court to reverse an appellate-court ruling that stated the city had no authority to impose zoning restrictions on hydraulic fracturing and negligible authority to regulate drilling. Beck Energy Corporation and the Ohio Department of Natural Resources argued before the court that state law gives ODNR exclusive authority to determine where drilling and hydraulic fracturing occurs in state. The city of Munroe Falls countered that the city’s home-rule powers give it some of the authority in deciding where hydraulic fracturing rigs should be located. The city objects to Beck Energy’s receipt of an ODNR permit to drill at the rear of 5-acre plot without complying with city ordinances and zoning that prohibits drilling in a residential-zoned area. The outcome of this case before the Ohio Supreme Court is as of yet undetermined, but its outcome will greatly affect the future regulation of drilling and hydraulic fracturing throughout the state.
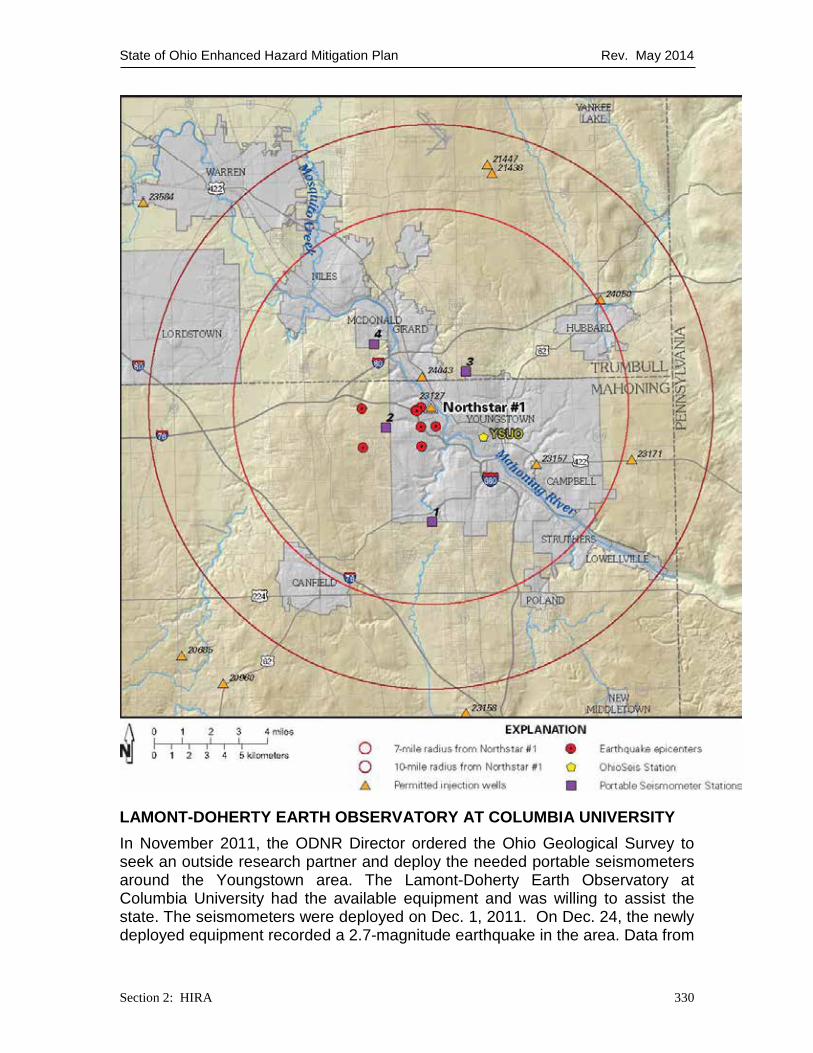
SEISMIC EVENTS IN YOUNGSTOWN A preliminary report was released by ODNR in March 2012 on the Northstar 1 Class II Injection Well and the Seismic Events in the Youngstown, Ohio Area. The reports show that since March 2011, the Youngstown area has experienced 12 low-magnitude seismic events along a previously unknown fault line. These events ranged from 2.1- to 4.0-magnitude and were recorded by the Ohio Department of Natural Resources’ (ODNR) Ohio Seismic Network (OhioSeis). The OhioSeis network works closely with the U.S. Geological Survey to monitor and study all seismic activity within the state. Prior to the network’s establishment in 1999, monitoring earthquakes in Ohio was sporadic at best. In fact, before the network was operational, the Ohio Geological Survey was unable to accurately determine any seismic events below an approximate magnitude of 3.0. A station at Youngstown State University joined the network in 2003.

State of Ohio Enhanced Hazard Mitigation Plan Rev. May 2014
Section 2: HIRA 328
Before 2011, OhioSeis had not recorded earthquake activity with epicenters located in the Youngstown area. Also, no fault line had been previously mapped within the boundaries of Youngstown or Mahoning County. However, the broad geographical area does have a history of seismic activity, and Mahoning Valley residents have felt earthquakes from nearby faults. In fact, the area has experienced at least three prior earthquakes in the past 25 years.
NORTHSTAR 1 CLASS II DEEP INJECTION WELL The 2011 earthquakes are distinct from previous seismic activity in the region because of their proximity to a Class II deep injection well, known as the Northstar 1 well. In fact, all of the events were clustered less than a mile around the well. Northstar 1 is one of 177 operational Class II deep injection wells primarily used for oil and gas fluid waste disposal. (Ohio Disposal Wells) The well is drilled 200’ into the rock formation known as the Precambrian layer at a depth of 9,184’ and began injection in December 2010. The below table, provide by the US E.P.A, describes the six categories or "classes" of injection wells, along with the estimated national inventory for each class. The six classes are based on similarity in the fluids injected, activities, construction, injection depth, design, and operating techniques. This categorization ensures that wells with common design and operating techniques are required to meet appropriate performance criteria for protecting underground sources of drinking water. Classes Use Inventory Class I Inject hazardous wastes, industrial non-hazardous liquids, or municipal
wastewater beneath the lowermost Underground Sources of Drinking Water (USDW).
680 wells
Class II
Inject brines and other fluids associated with oil and gas production, and hydrocarbons for storage.
172, 068 wells
Class III
Inject fluids associated with solution mining of minerals beneath the lowermost USDW.
22,131 wells
Class IV
Inject hazardous or radioactive wastes into or above USDWs. These wells are banned unless authorized under a federal or state ground water
remediation project.
33 sites
Class V
All injection wells not included in Classes I-IV. In general, Class V wells inject non-hazardous fluids into or above USDWs and are typically
shallow, on-site disposal systems. However, there are some deep Class V wells that inject below USDWs.
400,000 to 650,000 wells Note: an inventory range is presented because a complete inventory is not
available. Class
VI
Inject Carbon Dioxide (CO2) for long term storage, also known as Geologic Sequestration of CO2.
6-10 commercial wells expected to come online by 2016. (Interagency Task Force on Carbon Capture and
Storage)
Ohio runs its Class II deep injection program on behalf of the U.S. EPA. As a result, the state meets and in many instances far exceeds U.S. EPA standards and regulations for the program. Since the program’s inception in 1983, more than 202 million barrels of oilfield fluids have been disposed of, with no reports of subsurface ground water contamination incidents. In addition, no seismic event had been previously linked to operations at any of the state’s Class II wells. The earthquakes and their potential link to the Northstar 1 deep injection well were closely scrutinized by state geologists and regulators, who performed 35
State of Ohio Enhanced Hazard Mitigation Plan Rev. May 2014
Section 2: HIRA 329
separate inspections of the well from April 26 to Dec. 15, 2011. Each inspection indicated the well was operating within its permitted injection pressure and volume. In addition, ODNR regulators conducted additional testing of the well to determine if injection fluids were entering permitted injection zones. Tracer tests showed injections were reaching appropriate zones and were within permitted injection intervals. However, the tests proved inconclusive with regard to the volume of fluid entering the Precambrian layer. As a result, state regulators requested the well owner plug the Precambrian section of the Northstar 1 borehole, and the well operator voluntarily agreed to the procedure, albeit on a delayed timetable. With only one seismometer deployed in the Youngstown area, state geologists lacked the necessary data on the earthquakes’ depth and exact location to draw a direct correlation between the seismic events and the deep injection well.
State of Ohio Enhanced Hazard Mitigation Plan Rev. May 2014
Section 2: HIRA 330
LAMONT-DOHERTY EARTH OBSERVATORY AT COLUMBIA UNIVERSITY In November 2011, the ODNR Director ordered the Ohio Geological Survey to seek an outside research partner and deploy the needed portable seismometers around the Youngstown area. The Lamont-Doherty Earth Observatory at Columbia University had the available equipment and was willing to assist the state. The seismometers were deployed on Dec. 1, 2011. On Dec. 24, the newly deployed equipment recorded a 2.7-magnitude earthquake in the area. Data from
State of Ohio Enhanced Hazard Mitigation Plan Rev. May 2014
Section 2: HIRA 331
the portable seismometers was downloaded and analyzed by experts at Lamont-Doherty. On Dec. 29, Lamont-Doherty presented ODNR with their preliminary findings, which indicated the seismic event depth was 2,454’ below the injection well. Based on the Lamont-Doherty data, ODNR regulators ordered the immediate halt of injections at Northstar 1, either voluntarily by the operator or by agency order. The next day, the Youngstown area experienced a 4.0-magnitude seismic event. Gov. John Kasich immediately placed an indefinite moratorium on three drilled deep injection wells and one well with a permit pending in the vicinity of the Northstar 1 well.
INDUCED SEISMICITY Geologists believe it is very difficult for all conditions to be met to induce seismic events. In fact, all the evidence indicates that properly located Class II injection wells will not cause earthquakes. To induce an earthquake a number of circumstances must be met:
• A fault must already exist within the crystalline basement rock and that fault must already be in a near-failure state of stress. • An injection well must be drilled deep enough and near enough to the fault and have a path of communication to the fault. • The injection well must inject a sufficient quantity of fluids at a high enough pressure and for an adequate period of time to cause failure, or movement, along that fault (or system of faults).
A number of coincidental circumstances appear to make a compelling argument for the recent Youngstown-area seismic events to have been induced:
• The Northstar 1 well began injection operations in December 2010. Roughly three months later, the first seismic events were noted and were fairly close to the well. • Subsequent seismic events were clustered around the vicinity of the wellbore. • Evidence of permeability zones within the Precambrian basement rock is interpreted in some of the geophysical logs obtained from within the Northstar 1 well; and (Logs A, B, C, D). • Once sufficient monitoring equipment was in place, the focal depths of events were found to be about 4,000’ laterally and 2,500’ vertically from the wellbore terminus.
It appears there are observed permeability zones within the Precambrian basement rock in the drill coring logs recorded by the Battelle Memorial Institute during the drilling of Northstar 1. These logs were not available to inform regulators of possible issues in geological formations prior to well operation. Instead, Battelle produced and made the logs available to provide geologists with additional information on the region’s geological formations. In the future, ODNR

State of Ohio Enhanced Hazard Mitigation Plan Rev. May 2014
Section 2: HIRA 332
will require the Class II well owner to provide a suite of geophysical logs germane to the respective injection well. To establish a better understanding of what may have happened, further analysis and detailed modeling of all factors must be completed on the Northstar 1 well and the surrounding geology. This work is already underway through ODNR and cooperating agencies and institutions.
FUTURE EVENTS The number of wells that will be drilled over the next several years in Region 3 is expected to grow exponentially. As the number of oil, gas, and injection wells in the state increases, so does the potential for environmental impacts. The state is mitigating this risk by enhancing regulatory and monitoring programs for well drilling and waste disposal operations. Additional information on these efforts can be found at the ODNR Division of Oil and Gas website: http://oilandgas.ohiodnr.gov/. The state’s direction will be to continue to take steps to ensure that oil and natural gas development benefits the citizens of the state and does not adversely impact human health and the environment. CLIMATE CHANGE The Intergovernmental Panel on Climate Change defines climate change as “A change in the state of the climate that can be identified by changes in the mean and/or the variability of its properties and that persists for an extended period, typically decades or longer. Climate change may be due to natural internal processes or external forcings, or to persistent anthropogenic changes in the composition of the atmosphere or in land use.” The National Oceanic Atmospheric Administration defines climate change as “a non-random change in climate that is measured over several decades or longer. The change may be due to natural or human-induced causes.” The climate studies and models reviewed for this section predict multiple impacts from the effects of climate change on the state, these include warmer temperatures, shifting rain and snow patterns, increased flood events and an increased likelihood of extreme weather events by the end of the 21st century. An excerpt of an article from the Ohio State University Climate Change Webinar Series in which State Climatologist Dr. Jeffery Rogers was interviewed, gives an excellent introduction to some of the climate change challenges that the state will be facing in the upcoming years and decades.
Dr. Rogers suggests that the climate in Ohio has been getting steadily warmer over the years, and will likely continue to do so in the future. While the warmest summers on record are still those of the 1930s Dust Bowl, recent summers like 2002, 2005 and 2010 will be very high on that list, according to Dr. Rogers. But greenhouse gases in

State of Ohio Enhanced Hazard Mitigation Plan Rev. May 2014
Section 2: HIRA 333
the atmosphere are not the only reason why summers are getting hotter across the Great Lakes region. “I see it continuing also because in Ohio, there’s a very strong link between humidity and moisture, which will ensure that temperatures will keep going up,” Rogers explains. “Humidity traps more heat, air then retains more humidity, and so on. I think the temperature changes are here to stay,” he adds. The effect of humidity on Ohio’s climate is especially visible when looking at nighttime temperatures in the state…
The article also states that increased humidity as part of a changing climate in Ohio goes along with another weather phenomenon: precipitation extremes – very large or very small amounts of rain or snowfall in a given time period – have become much larger. Especially in the summer, the state goes without rainfall for long periods of time, followed by heavy rainstorms… “We keep going back and forth like this; a couple of days of heavy rain, then things dry out quite a bit,”… To understand how global warming and pollution affect the earth’s climate, one first has to understand how the planet’s temperature is regulated. Radiant energy from the sun strikes the earth’s surface and warms it up. Naturally occurring greenhouse gases such as carbon dioxide (CO2) and water vapor absorb radiation coming from the earth that would potentially go to space and allow the planet to cool. This interplay regulates the overall average temperature on earth at around 59 degrees Fahrenheit – 60 degrees warmer than on an earth without greenhouse gases – and thereby makes life on the planet possible. The current problem with climate change is related to an increase in temperature beyond the 59 degree average, which is caused by an excess of greenhouse gases produced by burning fossil fuels like coal or oil. Burning these fossil fuels also produces sulfates and other aerosols that would contribute to “global dimming,” or a cooling effect. Human produced aerosols like sulfates scatter solar radiation, making it less able to warm the planet’s surface… However, studies have shown that the net effect of carbon dioxide and sulfates is still one of warming temperatures overall…These higher temperatures caused by additional CO2 trapping more heat close to the earth’s surface can result in both droughts and increased precipitation due to higher evaporation of surface waters. While the term “precipitation” includes both rain and snow, Dr. Rogers also explains that Ohio winters are likely to include more rainfall and less snowfall as climate change continues. In the Great Lakes region, scientists are seeing a delicate balancing act between precipitation and evaporation, which both influence the Great Lakes’ hydrologic
State of Ohio Enhanced Hazard Mitigation Plan Rev. May 2014
Section 2: HIRA 334
cycle, or how water travels between the atmosphere and the ground. “As temperatures increase due to global warming, the lakes will tend to evaporate, but there is also a tendency towards heavier precipitation,” Dr. Rogers says, adding that in the worst case scenario the Great Lakes probably won’t experience enough precipitation increases to offset the evaporation from higher temperatures. Water levels would tend to go down in this scenario, causing problems not only for recreational areas on the shore, but also because some of the drinking water supply in the region comes from the Great Lakes. http://changingclimate.osu.edu/assets/pubs/articles/studying-world-climate.pdf
OHIO EMERGENCY MANAGEMENT AGENCY SUMMARY ANALYSIS The scientific studies and data referenced within this section come to one cohesive conclusion, climate change will have an impact on the natural hazards in the state through 2100. The greatest impact to the natural hazards in the state from climate change will be from the changes in precipitation rate and variability. To put it simply, these changes will lead to increased flooding in the spring and fall and increased periods of drought in the summer. Another impact on the state from the effects of climate change is a warming trend that will enhance the possibility of extended and increased extreme heat wave events. This climate change related warming trend will likely lead to an increased evaporation / transpiration feedback cycle, which will lead to reduced availability of water resources. Since the many of the anticipated effects of climate change exacerbate or accelerate existing natural hazards, many of the possible mitigation and adaptation strategies already exist. Based upon the best available scientific date and studies, Ohio EMA would make the following general mitigation and adaption strategy recommendations:
1. Develop greater built environment resilience 2. Improve stormwater infrastructure 3. Increase water quality and resource protection 4. Enhance essential utility resilience
These recommendations will be useful and positive actions regardless of the long term impacts of the climate change on the state. Each of these recommendations will be addressed in greater detail later in this section. LITERATURE AND STUDIES REVIEW The preponderance of available climate change data does not mean that there are not challenges in synthesizing the data from the available scientific sources into both the state and local hazard mitigation plans. There is a considerable amount of climate change data and related studies available, but the spatial context of the majority of these studies can make it very challenging to use both at the state and the local levels. The majority of these studies use a spatial

State of Ohio Enhanced Hazard Mitigation Plan Rev. May 2014
Section 2: HIRA 335
resolution of the entire United States or a regional approach such as focusing on the Great Lakes or Midwest Regions. There is a limited amount of data available that specifically address the impacts and effects of climate change at the state, watershed or local level. The fact that climate change is occurring is not disputed. The current scientific data and modeling suggest that climate change has and will impact the state. The challenges in determining the probability and severity of future impacts can make it difficult to determine with an absolute degree of certainty the full degree of impact climate change may have on the state. This is also further complicated by the fact that information gathered is continually evolving. Therefore, this section will not attempt to estimate potential losses. This section will only provide information on the potential impacts climate change may have on some of our already existing hazards profiled within the SOHMP. This section incorporates basic scientific findings and the most current projections for global climate change as they have the potential to impact the state and the Great Lakes Region. This section will not address any one specific jurisdiction or region in an attempt to determine risk as has been completed for other hazards within this plan update. In some instances examples of potential impacts to specific areas are incorporated. It is important to note that in such instances, the analysis has been conducted by scientists and subject matter experts as referenced, and not by Ohio EMA Staff. There are exciting and promising studies and initiatives happening in the state right now, which will continue to improve both our knowledge about and our response to the impacts of climate change. Many of these studies are currently only in a draft phase or do not provide enough downscaled data to warrant full inclusion within this current iteration of the plan update. As climate science evolves and improves, future updates to this plan will incorporate any new or improved relevant climate change data. CLIMATE CHANGE RESEARCH AT THE OHIO STATE UNIVERSITY The Ohio State University has long been a leader in global climate change research, from physical drivers to impacts to adaptation and mitigation. Research teams across the university are investigating many aspects of global change, including:
· Glaciers, climate change and sea level, atmospheric sciences, contemporary and paleo climate.
· Ecosystem and biodiversity impacts, greenhouse gas monitoring and mitigation, freshwater quantity and quality, economic modeling, coastal community adaptation and mitigation.
· Changes in ecosystem services, risk and decision science, education and community engagement, agricultural impacts and strategies.
State of Ohio Enhanced Hazard Mitigation Plan Rev. May 2014
Section 2: HIRA 336
THE OHIO STATE CLIMATE CHANGE OUTREACH TEAM http://changingclimate.osu.edu/ The Ohio State University Climate Change Outreach Team is a partnership among multiple departments within Ohio State University; the team’s goal is to help localize the climate change issue by bringing related research and resources to residents of Ohio and the Great Lakes region. The team is comprised of leading academics from Ohio State Extension, the Department of Agricultural, Environmental, & Development Economics, Byrd Polar Research Center, School of Environment and Natural Resources (SENR), Department of Geography, Department of Evolution, Ecology & Organismal Biology, Ohio Agricultural Research and Development Center (OARDC) and the Ohio Sea Grant College Program & Stone Laboratory. The team provides regular webinars that address various climate change related topics, with a focus on the Great Lakes region and the State of Ohio. Some of the more recent webinars have covered topics such as:
· Climate Change Impacts on Fisheries in Lakes Michigan and Huron · Climate Change & Harmful Algal Blooms in Lake Erie · Climate and Carbon Impacts on Productivity, Chemistry, and Invasive
Species in the Great Lakes · Making Climate Change Data Relevant at a Local Level · Movement of Climate Change Knowledge Through Social Networks ·
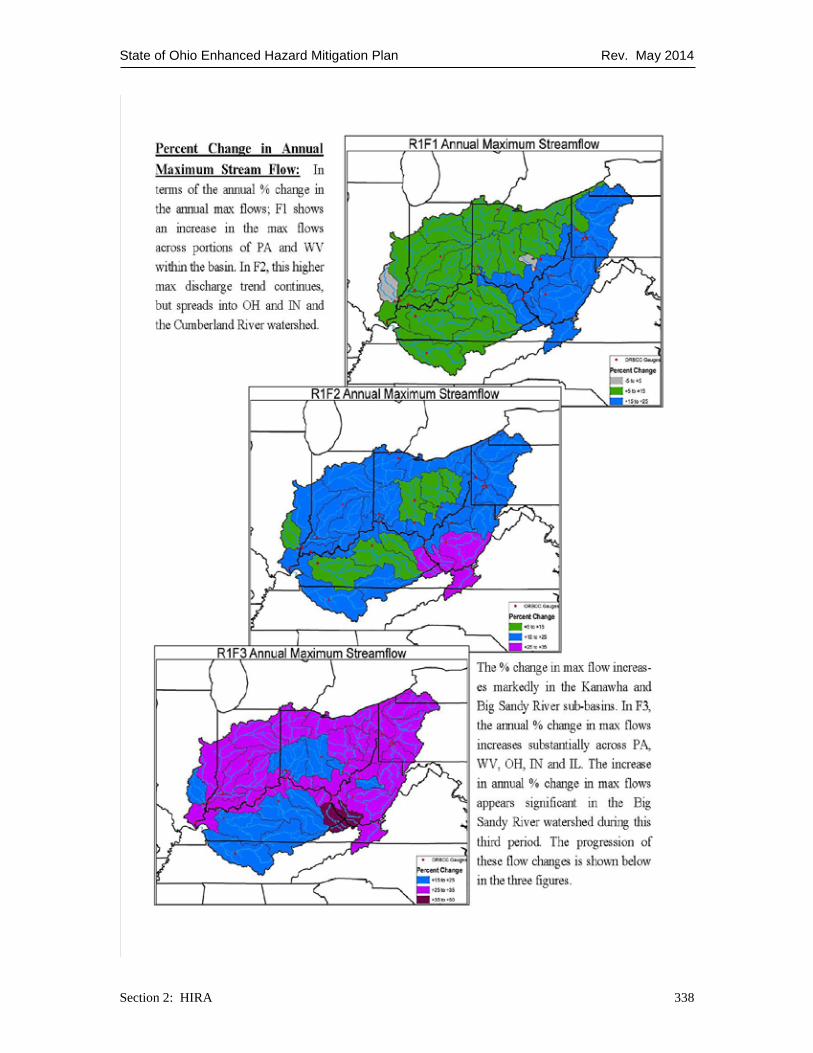
UNITED STATES ARMY CORP OF ENGINEERS (USACE) - NATIONAL WEATHER SERVICE - RESPONSES TO CLIMATE CHANGE PROGRAM PILOT STUDY OF THE OHIO RIVER BASIN http://www.ohioriverbasin.org/wp-content/uploads/2010/10/RCC-ORB-Task-5.pdf This study is currently being undertaken by the National Weather Service with funding provided by the USACE through the Corp’s Institute for Water Resources. This pilot study’s primary focus is on the Ohio River Basin and the possible impacts of climate change on Federal water resources infrastructure and systems. This pilot study is one of the first studies that has developed a downscaled model using current climate change data. This model was developed using archived CMIP3 and CMIP5 Climate and Hydrology Projections, which were in turn downscaled to the river basin level. The pilot study is currently in the draft phase, but the downscaled modeling results have been released. The downscaled modeling results included both observed data for the 1951-2001(R1) and three 30 year forecast periods; 2011-2040(F1), 2041-2070(F2) and 2071-2099(F3). The pilot study produced stream flow outputs for the following nine measures:

State of Ohio Enhanced Hazard Mitigation Plan Rev. May 2014
Section 2: HIRA 337
1. Annual % change mean flow 2. Annual % change maximum flow 3. Annual % change minimum flow 4. March % change mean flow 5. March % change maximum flow
6. March % change minimum flow 7. October % change mean flow 8. October % change maximum
flow 9. October % change minimum
flow
Thematic basin maps have been created to represent the above noted data, these maps highlight the percent changes for the three 30-year periods which are referenced in the maps below as F1 (2011-2040), F2 (2041-2070) and F3 (2071-2099). The thematic basin maps for the percent change in annual maximum stream flow and percent change in October maximum stream flow have been included for reference. The remainder of the thematic basin maps are available in the draft study. The downscaling of these ensemble climate models suggest the overall mean, maximum and minimum flows will generally be within range of recent history through the year 2040. After the year 2040, the increases occur in the mean and maximum flows in the 10% to 40% range. There are some watersheds in the northern and eastern Ohio that appear to experience greater than 40% increases in mean and maximum flows. This appears to occur primarily from later summer until early winter. The autumn increases in maximum flows may enhance early cool season flood events in late autumn and early winter. These increases could lead to worsening spring flooding beyond 2040. The models suggest that droughts could lengthen or shift more between spring, summer and autumn beyond 2040. The models also suggest that the overall variability is also likely to increase with time as well. The final draft of this study will not be complete until 2015 and any additional data provided in the final study will be incorporated into future plan updates.
State of Ohio Enhanced Hazard Mitigation Plan Rev. May 2014
Section 2: HIRA 338

State of Ohio Enhanced Hazard Mitigation Plan Rev. May 2014
Section 2: HIRA 339
State of Ohio Enhanced Hazard Mitigation Plan Rev. May 2014
Section 2: HIRA 340
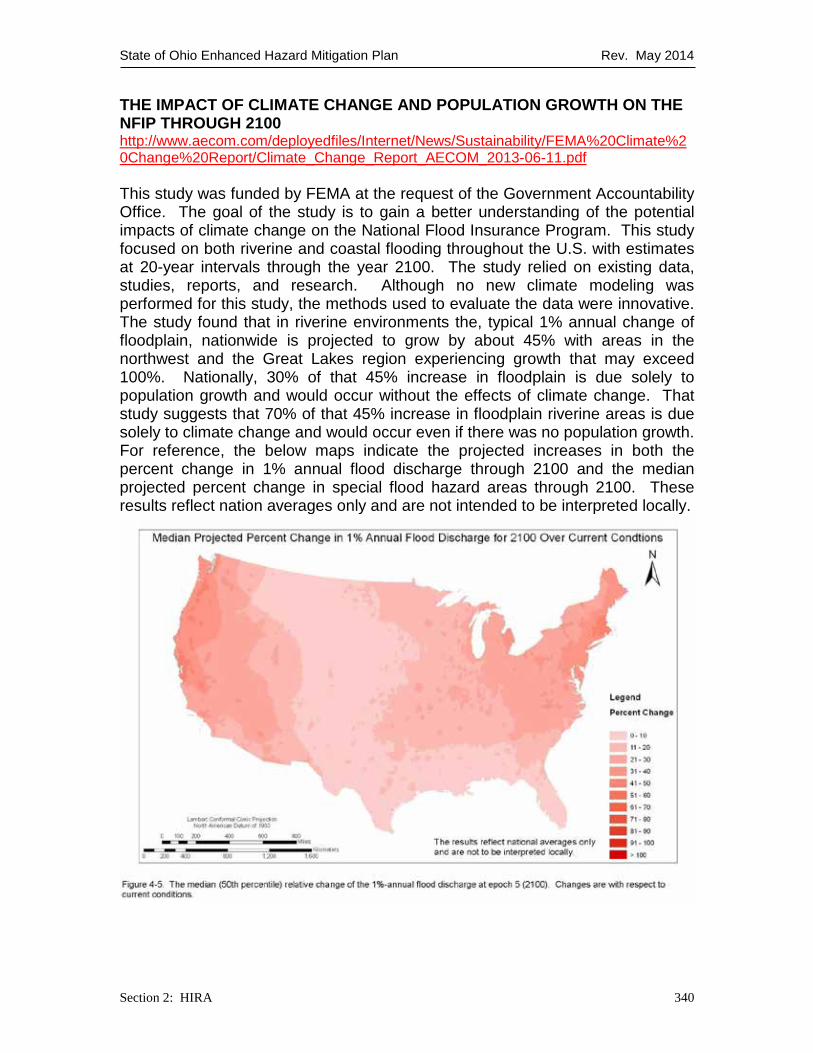
THE IMPACT OF CLIMATE CHANGE AND POPULATION GROWTH ON THE NFIP THROUGH 2100 http://www.aecom.com/deployedfiles/Internet/News/Sustainability/FEMA%20Climate%20Change%20Report/Climate_Change_Report_AECOM_2013-06-11.pdf This study was funded by FEMA at the request of the Government Accountability Office. The goal of the study is to gain a better understanding of the potential impacts of climate change on the National Flood Insurance Program. This study focused on both riverine and coastal flooding throughout the U.S. with estimates at 20-year intervals through the year 2100. The study relied on existing data, studies, reports, and research. Although no new climate modeling was performed for this study, the methods used to evaluate the data were innovative. The study found that in riverine environments the, typical 1% annual change of floodplain, nationwide is projected to grow by about 45% with areas in the northwest and the Great Lakes region experiencing growth that may exceed 100%. Nationally, 30% of that 45% increase in floodplain is due solely to population growth and would occur without the effects of climate change. That study suggests that 70% of that 45% increase in floodplain riverine areas is due solely to climate change and would occur even if there was no population growth. For reference, the below maps indicate the projected increases in both the percent change in 1% annual flood discharge through 2100 and the median projected percent change in special flood hazard areas through 2100. These results reflect nation averages only and are not intended to be interpreted locally.

State of Ohio Enhanced Hazard Mitigation Plan Rev. May 2014
Section 2: HIRA 341
CONFRONTING CLIMATE CHANGE IN THE U.S. MIDWEST - OHIO http://www.ucsusa.org/assets/documents/global_warming/climate-change-ohio.pdf The Union of Concerned Scientist produced a report which has new projections showing some of the potential impacts of climate change on Ohio, including severe summer heat, more dangerous storms and floods, and new threats to agricultural production. The report’s analysis projects hotter summers for the state, including increased threats of drought or prolonged heat waves. The report suggests flood patterns will change with winters, springs and falls becoming wetter, while the drought patterns indicate that summers will become drier. The report projects more frequent downpours and that precipitation is more likely to come in the form of heavy rains. The changes in precipitation, drought and heat patterns will cause more heat related stress on crops and livestock. The changing weather patterns may also lead to a greater amount of crop pests and pathogens ranging farther northward. CLIMATE CHANGE IN THE MIDWEST: IMPACTS, RISKS, VULNERABILITY, AND ADAPTATION S.C. Pryor, Provost’s Professor of Atmospheric Science at Indiana University Bloomington and editor of the Journal of Geophysical Research Atmospheres edited and released Climate Change in the Midwest: Impacts, Risks, Vulnerability, and Adaptation in 2013. This book presents research that focuses on identifying and quantifying the major vulnerabilities to climate change in the
State of Ohio Enhanced Hazard Mitigation Plan Rev. May 2014
Section 2: HIRA 342
Midwest. The book addresses the key sectors that may have vulnerabilities amplified by the effects of climate change, including agriculture, human health, water, energy and infrastructure. The climate vulnerability assessment performed in the book came to the following conclusions for the Midwest:
1. The average temperature may increase 1 to 3 degrees Celsius over the next several decades. Projected change in the climate models indicate a clear tendency towards increased frequency of heat waves. Further cold-air outbreaks and other extreme cold spells will still occur but with reduced likelihood.
2. That rainfall will increase variably across the Midwest over the next several decades. The rainfall potential will increase 20-30% in the spring and winter months and there will be a significant increase in variability of precipitation events in the summer and fall months. There is evidence to suggest a split in future rainfall events, leading to a greater likelihood of droughts in the summer months and floods in the fall months.
3. Some other affects include the likelihood of warmer nights and possibly warmer days leading to an increased susceptibly to pests. The warming will likely cause a reduction in crop yields and the evaporation / transpiration feedback will lead to less available water resources.
4. The projected soil loss through erosion is expected to be significant and greater than anything that has occurred in the previous century.
5. The most direct impact of climate on human health is heat-related morbidity and mortality. The climate models indicate that an increase in heat stress across all models over the course of the 21st century.
6. Using the concepts of stream flow elasticity, projected increases in precipitation over much of the Midwest are estimated to increase by 16-20%
CLIMATE CHANGE’S IMPACT ON NATURAL HAZARDS This plan update will not address any one specific jurisdiction or region in an attempt to determine risk as it has been completed for other hazards within this plan update. This section will only supply already existing information on how changes in the climate have the potential to affect our state’s natural hazards. DROUGHT, EXTREME SUMMER WEATHER AND INVASIVE SPECIES The studies and reports referenced above indicate that a warming trend will increase over the next several decades up to the extent of the studies/reports which is 2100. This warming trend will increase the possibility of extended and increased extreme heat wave events. The average temperature may increase 1 to 3 degrees Celsius over the next several decades throughout the Midwest. The projected change in the climate models indicate a clear tendency towards increased frequency of heat waves. Further cold-air outbreaks and other extreme cold spells will still occur but with reduced likelihood. The studies

State of Ohio Enhanced Hazard Mitigation Plan Rev. May 2014
Section 2: HIRA 343
suggest that a warming trend combined with increased variability of rainfall events in the summer months will lead to increasing periods of drought in the state and the great lakes region. The models suggest that droughts could lengthen or shift more between spring, summer and autumn beyond 2040. The warming trend will likely cause a reduction in crop yields and the evaporation / transpiration feedback will lead to less available water resources for human consumption, recreation and agricultural purposed. The changes in precipitation, drought and heat patterns will also create more heat related stress on crops and livestock. The changing weather patterns may also lead to a greater amount of crop pests and pathogens ranging farther northward. FLOODING, SEVERE THUNDERSTORMS, SEVERE WINTER/ICE STORMS The studies and reports reference above indicated that one of the primary impacts on the state from climate change will be the changes in precipitation rates and variability. The studies also indicated that rainfall will increase variably across the Midwest over the next several decades. The increased variability of precipitation events will mostly occur in the summer and fall months. There is evidence to suggest a split in future rainfall events, leading to a greater likelihood of droughts in the summer months and floods in the fall months. The studies also indicated that after the year 2040, the increases occurring in the mean and maximum stream flows will be in the 10% to 40% range with the north and northeast parts of that state experiencing greater than 40% increases. These increases appear to occur primarily from later summer until early winter, with the autumn increases in maximum stream flows enhancing early cool season flood events in late autumn/early winter. These increases also indicated the possibility of worsening spring flooding beyond 2040. MITIGATION AND ADAPTION STRATEGIES As the climate change data specific to the state becomes more readily available, one of the focuses of dealing with the impacts will be mitigation and adaptation. Ohio EMA has recommended four mitigation and adaption strategies that will help alleviate the future impacts of climate change on the natural hazards within the state. These strategies are recommended because they will have positive impacts regardless of climate change and its predicted long term impacts. DEVELOP GREATER BUILT ENVIRONMENT RESILIENCE The built environment refers to the any buildings or structures which are manmade as opposed to the natural environment. Developing resilience in the built environment is an important mitigation action, especially when you factor for the probability of increasing precipitation rates and variability. Examples of actions that increase resilience of the building environment include:

State of Ohio Enhanced Hazard Mitigation Plan Rev. May 2014
Section 2: HIRA 344
· Reduce the number of pre-FIRM flood prone, repetitive Loss and severe repetitive loss structures through FEMA mitigation grant programs.
· Adopting building, zoning and floodplain regulations that include higher standards than the minimum regulatory requirements.
· Encourage resilient local land use regulation through the Ohio Balanced Growth Initiative.
IMPROVE STORMWATER INFRASTRUCTURE Stormwater infrastructure is normally designed to convey or capture flows associated with a designed storm event, the scale of which is based on a probability distribution of observed rainfall events. One of the underlying assumptions of the atypical design approach is that the rainfall probability distribution is static. The best available climate change models indicate in the future larger precipitation events will occur with an increasing frequency. The existing stormwater infrastructure which was designed with current storm approach cannot be expected to provide the intended level of protection throughout its lifetime service. Examples of actions that improve stormwater infrastructure are:
· Encourage increased green infrastructure and the use of low impact development strategies to reduce stormwater.
· Seek to minimize impervious surfaces such as parking lots, roads, and rooftops in sensitive areas.
· Encourage riparian buffers along streams, rivers, and waterways to maintain natural floodplains.
· Protect and reestablish wetlands to hold runoff and recharge groundwater. · Implement the separation of combined storm and sanitary sewer overflows
to reduce pollution from sewage, bacteria, and E. Coli entering waters during storm events.
INCREASE WATER QUALITY AND RESOURCE PROTECTION The current climate change models indicate that its effects will have a variety of impacts on ground water resources and water quality. The higher water and air temperatures and changes in the timing, intensity, and duration of precipitation will impact water quality and ground water resources. Examples of actions that can be pursued to increase water quality and provide ground and surface water resources protection include:
· Encourage effective water-conservation strategies the general public during summer months, and consider year-round water-conservation strategies for water-intensive users.
· Implement the separation of combined storm and sanitary sewer overflows to reduce pollution from sewage, bacteria, and E. Coli entering waters during storm events.

State of Ohio Enhanced Hazard Mitigation Plan Rev. May 2014
Section 2: HIRA 345
· Recommend sewer and septic systems be upgraded to reduce non-point source pollution from urban areas, farmland, and other sources.
· Ensure that water extractions and diversions are appropriately planned and factor the future impacts of climate change.
ENHANCE UTILITY AND ENERGY RESILIENCE Water, electricity, and wastewater treatment are three utility services that are essential for modern daily life. These three utilities support business, industry, recreation, housing, hospitals and schools in communities across the state. These essential utility services have been traditionally planned, designed and operated with an assumption that the future environment is mostly static and predictable. The scientific climate change models show that increasingly variable and extreme precipitation patterns and temperature increases crises will intensify the risks faced by these essential utility services. With these risks in mind, essential utilities need to be working to strengthen their resilience to extreme climate events, also seeking ways to mitigate the impacts of climate change. Examples of actions that can be pursued to assist utilities services in increasing their resiliency include:
· Engage and educate stakeholders, having their active engagement will help to build shared a understanding and support for utility initiatives
· Strengthen existing utility transmission generation networks so they are able to cope with the future demand resulting from climate change.
· Encourage the development and construction of green infrastructure to help lessen the impact of the increasing extreme climate events.
· Support the upgrade neglected infrastructure networks to provide an efficient supply of utilities.
CLIMATE CHANGE ADAPTATION LITERATURE AND STUDIES REVIEW There are several current studies that suggest various climate change adaption strategies for the Great Lakes or Midwestern region. Many of these studies do not provide enough downscaled data or go into sufficient detail to warrant full inclusion within this current iteration of the plan update. As climate science evolves and improves, future updates to this plan will incorporate any new or improved relevant climate change adaption strategies. CLIMATE CHANGE ADAPTATION IN GREAT LAKE CITIES STUDY http://deepblue.lib.umich.edu/handle/2027.42/97435 This study looks at the anticipated impacts of climate change and how those impacts affected different communities throughout the state. Researchers have identified a variety of resources, assets, and governance structures that increase the ability and likelihood of successful adaptation, even in the face of significant uncertainty. In order to anticipate and successfully respond to these impacts,

State of Ohio Enhanced Hazard Mitigation Plan Rev. May 2014
Section 2: HIRA 346
cities in the state need to better understand the opportunities and constraints within their own organizations. To evaluate this capacity, an Integrated Assessment was conducted for four cities in the state (Toledo, Dayton, Elyria, and Avon Lake). The study takes a broad view of the political, social, and ecological causes, consequences, and potential solutions to climate vulnerability and impact reduction. The results of the study describe the capacities and constraints each city possesses, as well as identifies best practices cities can implement to take advantage of these capacities and overcome constraints. Each city had specific capacities and constraints based on the analysis, several overarching themes emerged. Decision-makers in each city expressed interest in adapting to climate change. Leaders within city governments are working to connect issues of sustainability and adaptation to the core mission of their departments, as well as forming policy networks across the city. Overall, leadership and the quality of current city employees emerged as key capacities throughout the study, but there are significant constraints to adaptation as well. Two broad trends identified are scarce financial resources and limited access to scientific knowledge. The lessons learned in this study could be applied to future plan updates as additional appropriate climate change data become available statewide. ADAPTING TO CLIMATE CHANGE: A PLANNING GUIDE FOR STATE COASTAL MANAGER’S – A GREAT LAKES SUPPLEMENT http://coastalmanagement.noaa.gov/climate/docs/adaptationgreatlakes.pdf
This report for the Great Lakes region is intended to provide additional detail and supplement the Adapting to Climate Change: A Planning Guide for State Coastal Managers, which the National Oceanic and Atmospheric Administration (NOAA) Office of Ocean and Coastal Resources released in 2010. The report included information on climate change and steps to help set up a planning process, assess vulnerability, devise a strategy, and implement a plan to minimize climate change impacts on the Great Lake’s coasts. The planning guide also provides an extensive list of resources to help throughout the planning and implementation process. The report provides updated data and information on the potential climate change impacts and effects for Great Lakes coastal areas. It highlights case examples of adaptive actions taking place in the Great Lakes region today, many of which are still in the planning and policy development stages. CLIMATE CHANGE IN THE MIDWEST: IMPACTS, RISKS, VULNERABILITY, AND ADAPTATION S.C. Pryor, Provost’s Professor of Atmospheric Science at Indiana University Bloomington and editor of the Journal of Geophysical Research Atmospheres edited and released Climate Change in the Midwest: Impacts, Risks, Vulnerability, and Adaptation in 2013. This book’s research focuses on
State of Ohio Enhanced Hazard Mitigation Plan Rev. May 2014
Section 2: HIRA 347
identifying and quantifying the major vulnerabilities to climate change in the Midwest. The book also makes several adaption recommendations for the Midwest as well. The recommendations are representative of some of the adaption recommendations that future plan updates may include once the climate change data related to the state coalesces.
1. Management of water resources should be a priority; this includes building resilience to flooding, addressing issues related to the Great Lakes, and addressing the results of changing precipitation regimes in the implications for flooding.
2. Eliminating combined sewer and stormwater systems in large population centers may help improve resiliency to the extreme precipitation events.
3. Climate change will also influence the supply and demand for energy and the ability of critical distribution networks to deliver electricity to consumers, and thus the energy sector must be a key and continuing focus for measures to reduce vulnerability to climate change, variability and extreme events.
CONCLUSION The Ohio State University’s climate outreach team provided an excellent summation of climate change, “Climate change, two words that are already synonymous with changes in weather patterns across the world, from global warming to increased rainfall and severe storms. But climate change affects different areas in different ways – while some regions will see increased precipitation in the form of snow or rain, others will dry out because of reduced rainfall. And while overall temperatures across the globe are likely to increase, climate change can also be related to an increase in freezing temperatures and severe winter storms. Ohio is likely to be affected by a number of these phenomena, and adapting to different weather conditions will be important to maintain quality of life in the area.” Climate change acts as an amplifier of existing natural hazards. The fact that climate change is occurring is not disputed and over the past several decades there has been a marked increase in the frequency and severity of weather-related disasters both nationally and in the state. This trend is being driven in part by changing global and regional climate conditions. The preponderance of available scientific evidence for anthropogenic forcing of climate change is overwhelming, or simply stated climate change is, in part, being caused by human actions, rather than natural factors alone. It is important that all levels of government and all sectors of society have at least a basic understanding of the potential impacts of climate change. The best available scientific data and modeling suggest that climate change has and will continue to impact natural hazards in the state. While the impacts of climate change may vary by regions and jurisdictions throughout the state, it is clear that the potential
State of Ohio Enhanced Hazard Mitigation Plan Rev. May 2014
Section 2: HIRA 348
consequences of climate change will have significant impacts on all the citizens of the state. As downscaled climate change data becomes more readily available the state will assess its vulnerability in terms of population, structures and critical facilities at risk. The state will also encourage the inclusion of such data in local hazard mitigation plans once the data is granular enough to support the analysis.