Embed Size (px)
DESCRIPTION
From IBISWorld
Citation preview
WWW.IBISWORLD.COM Gold & Silver Ore Mining in the US February 2015 1
IBISWorld Industry Report 21222Gold & Silver Ore Mining in the USFebruary 2015 Leah Goddard
Fool’s gold: Lower prices have discouraged production, limiting industry growth
2 About this Industry2 Industry Definition
2 Main Activities
2 Similar Industries
3 Additional Resources
4 Industry at a Glance
5 Industry Performance5 Executive Summary
5 Key External Drivers
7 Current Performance
9 Industry Outlook
11 Industry Life Cycle
13 Products & Markets13 Supply Chain
13 Products & Services
14 Demand Determinants
15 Major Markets
16 International Trade
18 Business Locations
20 Competitive Landscape20 Market Share Concentration
20 Key Success Factors
20 Cost Structure Benchmarks
22 Basis of Competition
23 Barriers to Entry
23 Industry Globalization
25 Major Companies25 Barrick Gold Corporation
26 Newmont Mining Corporation
27 Kinross Gold Corporation
29 Operating Conditions29 Capital Intensity
30 Technology & Systems
30 Revenue Volatility
31 Regulation & Policy
32 Industry Assistance
33 Key Statistics33 Industry Data
33 Annual Change
33 Key Ratios
34 Jargon & Glossary
www.ibisworld.com | 1-800-330-3772 | [email protected]
WWW.IBISWORLD.COM Gold & Silver Ore Mining in the US February 2015 2
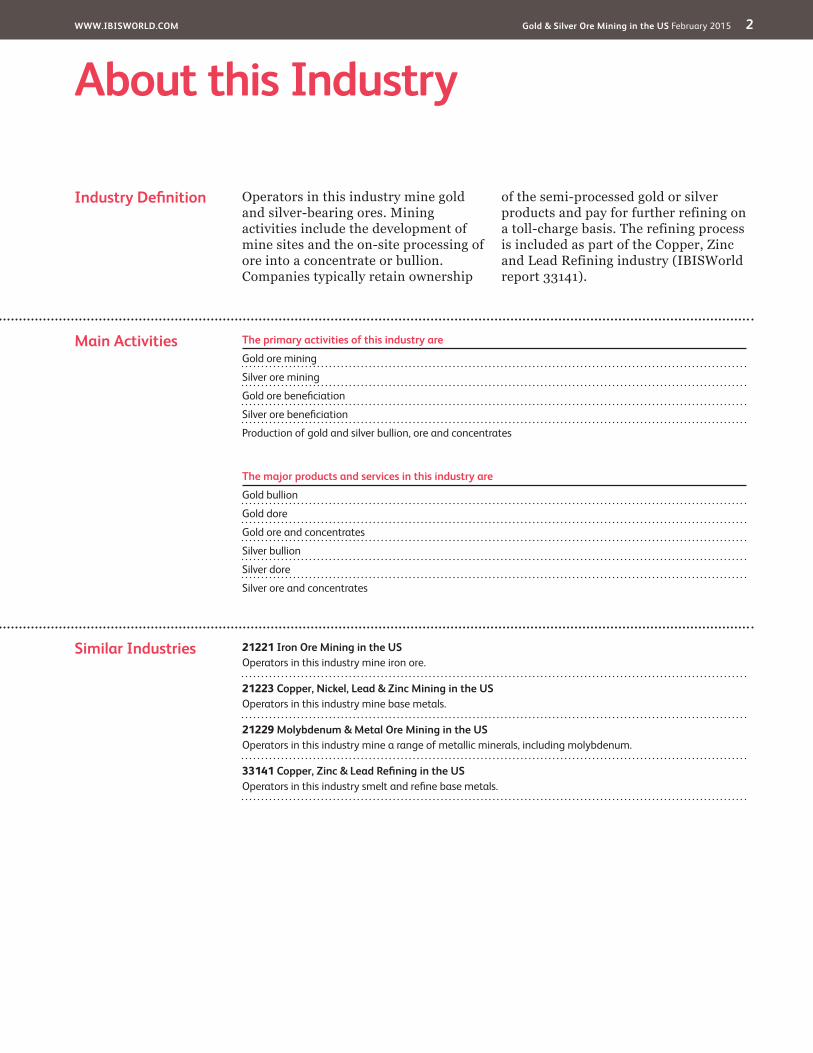
Operators in this industry mine gold and silver-bearing ores. Mining activities include the development of mine sites and the on-site processing of ore into a concentrate or bullion. Companies typically retain ownership
of the semi-processed gold or silver products and pay for further refining on a toll-charge basis. The refining process is included as part of the Copper, Zinc and Lead Refining industry (IBISWorld report 33141).
The primary activities of this industry are
Gold ore mining
Silver ore mining
Gold ore beneficiation
Silver ore beneficiation
Production of gold and silver bullion, ore and concentrates
21221 Iron Ore Mining in the USOperators in this industry mine iron ore.
21223 Copper, Nickel, Lead & Zinc Mining in the USOperators in this industry mine base metals.
21229 Molybdenum & Metal Ore Mining in the USOperators in this industry mine a range of metallic minerals, including molybdenum.
33141 Copper, Zinc & Lead Refining in the USOperators in this industry smelt and refine base metals.
Industry Definition
Main Activities
Similar Industries
About this Industry
The major products and services in this industry are
Gold bullion
Gold dore
Gold ore and concentrates
Silver bullion
Silver dore
Silver ore and concentrates
WWW.IBISWORLD.COM Gold & Silver Ore Mining in the US February 2015 3
About this Industry
Additional Resources For additional information on this industry
www.nma.org National Mining Association
minerals.usgs.gov The US Geological Survey Mineral Resources Program
www.usitc.gov US International Trade Commission
www.sec.gov US Securities and Exchange Commission
IBISWorld writes over 700 US industry reports, which are updated up to four times a year. To see all reports, go to www.ibisworld.com
WWW.IBISWORLD.COM Gold & Silver Ore Mining in the US February 2015 4
$ pe
r tro
y ou
nce
2000
500
1000
1500
2006 08 10 12 14 16 18Year
World price of gold
SOURCE: WWW.IBISWORLD.COM
% c
hang
e
60
−20
0
20
40
2107 09 11 13 15 17 19Year
Revenue Employment
Revenue vs. employment growth
Products and services segmentation (2015)
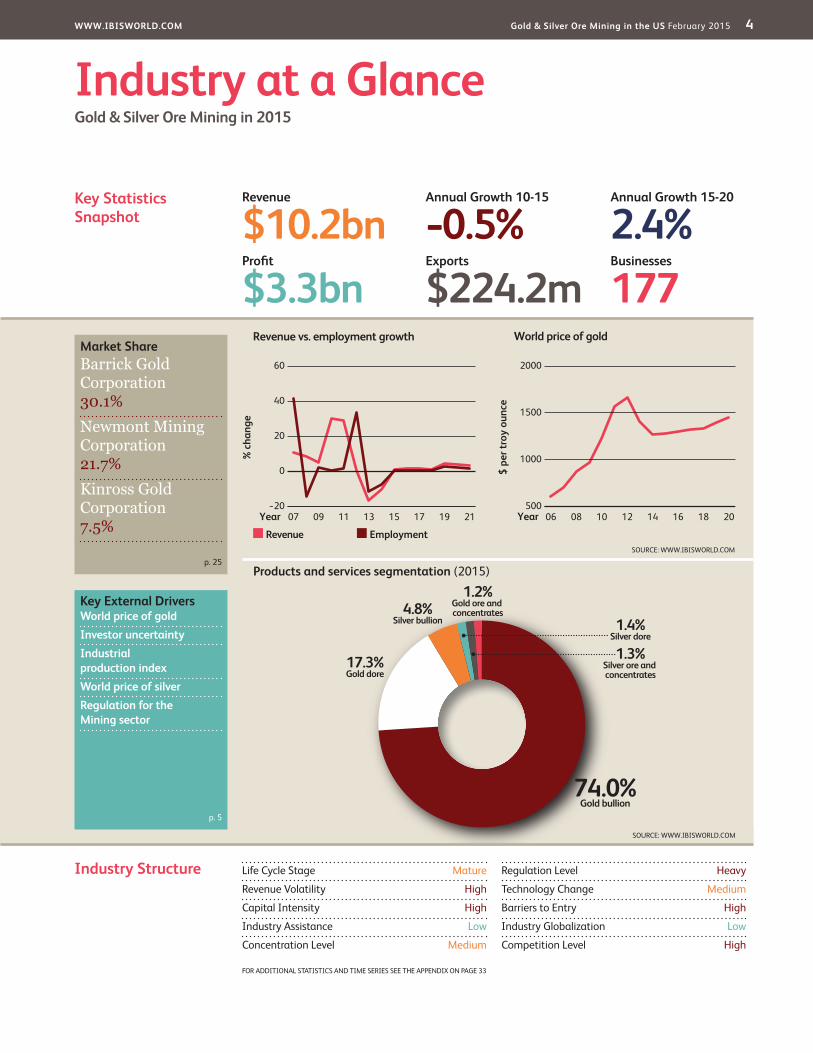
74.0%Gold bullion
1.2%Gold ore and concentrates
17.3%Gold dore
4.8%Silver bullion 1.4%
Silver dore
1.3%Silver ore and concentrates
SOURCE: WWW.IBISWORLD.COM
Key Statistics Snapshot
Industry at a GlanceGold & Silver Ore Mining in 2015
Industry Structure Life Cycle Stage Mature
Revenue Volatility High
Capital Intensity High
Industry Assistance Low
Concentration Level Medium
Regulation Level Heavy
Technology Change Medium
Barriers to Entry High
Industry Globalization Low
Competition Level High
Revenue
$10.2bnProfit
$3.3bnExports
$224.2mBusinesses
177
Annual Growth 15-20
2.4%Annual Growth 10-15
-0.5%
Key External DriversWorld price of goldInvestor uncertaintyIndustrial production indexWorld price of silverRegulation for the Mining sector
Market ShareBarrick Gold Corporation 30.1%Newmont Mining Corporation 21.7%Kinross Gold Corporation 7.5%
p. 25
p. 5
FOR ADDITIONAL STATISTICS AND TIME SERIES SEE THE APPENDIX ON PAGE 33
SOURCE: WWW.IBISWORLD.COM
WWW.IBISWORLD.COM Gold & Silver Ore Mining in the US February 2015 5
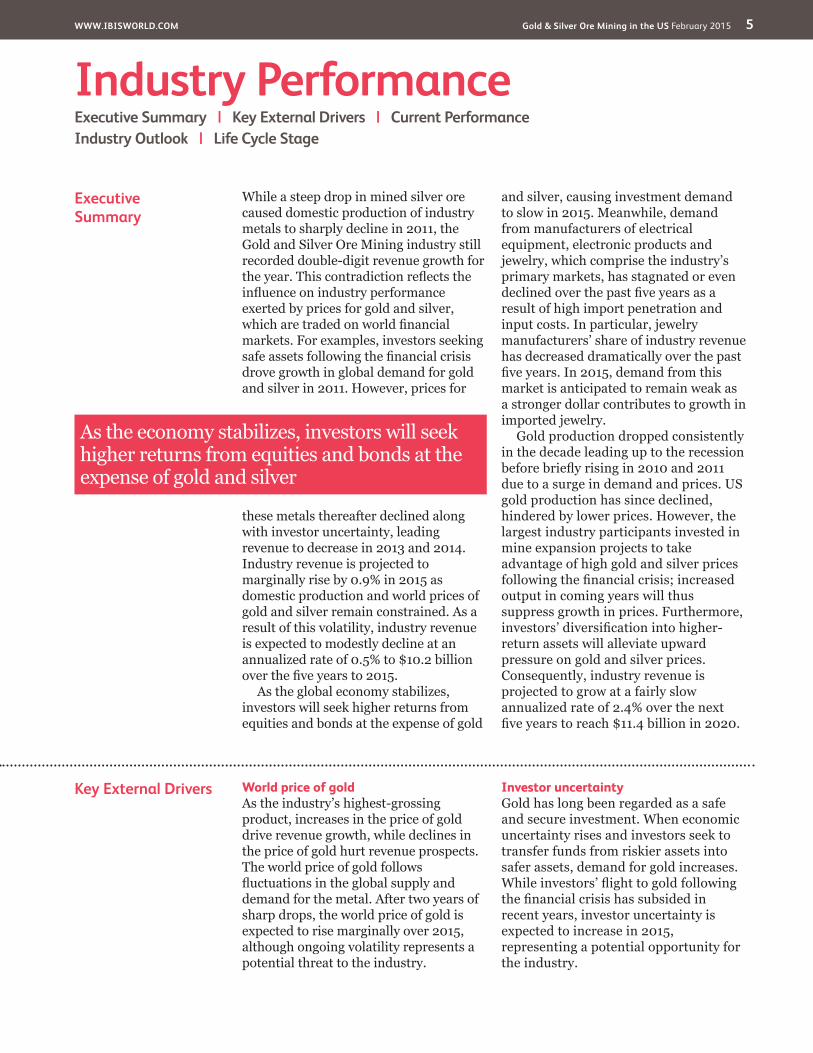
Key External Drivers World price of goldAs the industry’s highest-grossing product, increases in the price of gold drive revenue growth, while declines in the price of gold hurt revenue prospects. The world price of gold follows fluctuations in the global supply and demand for the metal. After two years of sharp drops, the world price of gold is expected to rise marginally over 2015, although ongoing volatility represents a potential threat to the industry.
Investor uncertaintyGold has long been regarded as a safe and secure investment. When economic uncertainty rises and investors seek to transfer funds from riskier assets into safer assets, demand for gold increases. While investors’ flight to gold following the financial crisis has subsided in recent years, investor uncertainty is expected to increase in 2015, representing a potential opportunity for the industry.
Executive Summary
While a steep drop in mined silver ore caused domestic production of industry metals to sharply decline in 2011, the Gold and Silver Ore Mining industry still recorded double-digit revenue growth for the year. This contradiction reflects the influence on industry performance exerted by prices for gold and silver, which are traded on world financial markets. For examples, investors seeking safe assets following the financial crisis drove growth in global demand for gold and silver in 2011. However, prices for
these metals thereafter declined along with investor uncertainty, leading revenue to decrease in 2013 and 2014. Industry revenue is projected to marginally rise by 0.9% in 2015 as domestic production and world prices of gold and silver remain constrained. As a result of this volatility, industry revenue is expected to modestly decline at an annualized rate of 0.5% to $10.2 billion over the five years to 2015.
As the global economy stabilizes, investors will seek higher returns from equities and bonds at the expense of gold
and silver, causing investment demand to slow in 2015. Meanwhile, demand from manufacturers of electrical equipment, electronic products and jewelry, which comprise the industry’s primary markets, has stagnated or even declined over the past five years as a result of high import penetration and input costs. In particular, jewelry manufacturers’ share of industry revenue has decreased dramatically over the past five years. In 2015, demand from this market is anticipated to remain weak as a stronger dollar contributes to growth in imported jewelry.
Gold production dropped consistently in the decade leading up to the recession before briefly rising in 2010 and 2011 due to a surge in demand and prices. US gold production has since declined, hindered by lower prices. However, the largest industry participants invested in mine expansion projects to take advantage of high gold and silver prices following the financial crisis; increased output in coming years will thus suppress growth in prices. Furthermore, investors’ diversification into higher-return assets will alleviate upward pressure on gold and silver prices. Consequently, industry revenue is projected to grow at a fairly slow annualized rate of 2.4% over the next five years to reach $11.4 billion in 2020.
Industry PerformanceExecutive Summary | Key External Drivers | Current Performance Industry Outlook | Life Cycle Stage
As the economy stabilizes, investors will seek higher returns from equities and bonds at the expense of gold and silver
WWW.IBISWORLD.COM Gold & Silver Ore Mining in the US February 2015 6
Industry Performance
Key External Driverscontinued
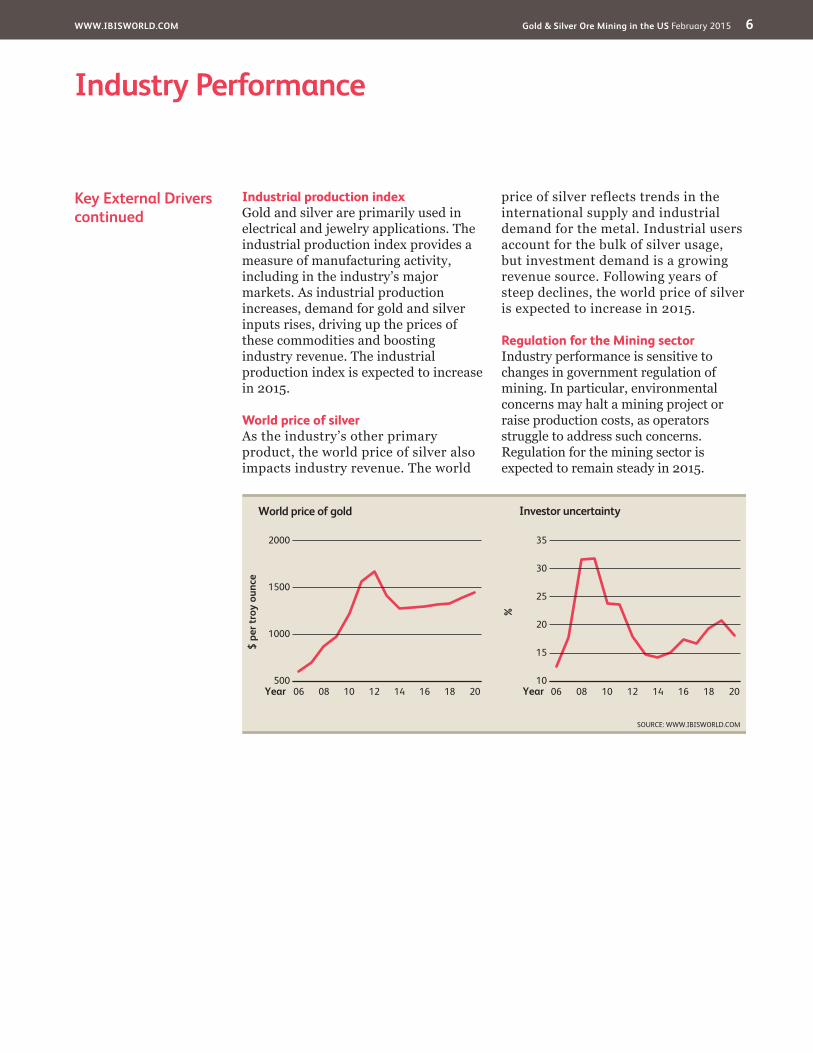
Industrial production indexGold and silver are primarily used in electrical and jewelry applications. The industrial production index provides a measure of manufacturing activity, including in the industry’s major markets. As industrial production increases, demand for gold and silver inputs rises, driving up the prices of these commodities and boosting industry revenue. The industrial production index is expected to increase in 2015.
World price of silverAs the industry’s other primary product, the world price of silver also impacts industry revenue. The world
price of silver reflects trends in the international supply and industrial demand for the metal. Industrial users account for the bulk of silver usage, but investment demand is a growing revenue source. Following years of steep declines, the world price of silver is expected to increase in 2015.
Regulation for the Mining sectorIndustry performance is sensitive to changes in government regulation of mining. In particular, environmental concerns may halt a mining project or raise production costs, as operators struggle to address such concerns. Regulation for the mining sector is expected to remain steady in 2015.
%
35
10
15
20
25
30
2006 08 10 12 14 16 18Year
Investor uncertainty
SOURCE: WWW.IBISWORLD.COM
$ pe
r tro
y ou
nce
2000
500
1000
1500
2006 08 10 12 14 16 18Year
World price of gold
WWW.IBISWORLD.COM Gold & Silver Ore Mining in the US February 2015 7
Industry Performance
Investment demand Gold sales account for more than 90.0% of industry revenue, making the price of gold a significant driver for the industry’s overall performance. The price of gold soared 28.1% in 2011, followed by relatively low growth of 6.3% in 2012. The global economic downturn and resulting shift toward gold investment, which is widely regarded as a safe haven during periods of financial upheaval, are largely responsible for the skyrocketing prices in the early part of the period. Moreover, geopolitical unrest in the Middle East and North Africa, concerns about spikes in crude oil and commodity prices and economic uncertainty in US and European markets also fueled much of the growth of gold prices in 2011 and 2012. Since 2013, however, investors have sought higher returns from equities and bonds at the expense of gold and silver, as uncertainty regarding the Euro debt crises subsided and developed economies recovered from the effects of
the recession. Consequently, with deteriorating gold and silver prices, industry revenue declined as well.
Silver is more closely linked to the industrial sector and represents less than 10.0% of industry revenue. Over the period, industrial demand for silver has modestly declined due to weak economic activity, while investment demand has increased. In fact, since 2010, growing investment demand inflated gold and silver prices enough for jewelry demand to drop, causing domestic jewelry manufacturers’ share of industry revenue to decline over the period. Investment in gold and silver
Current Performance
The Gold and Silver Ore Mining industry was one of the few industries that benefited from the financial crisis. Following years of strong growth, industry revenue continued to rise through 2012 as gold and silver prices surged. The rapid rise in the price of gold, which accounts for more than 90.0% of industry revenue, helped propel sales and profit in the early part of the period. In fact, strong demand from domestic and international investors drove gold prices to an all-time high of $1,895.00 per troy ounce in September 2011. An undersupply of gold due to decreased industry production between 2001 and 2009 further contributed to the spike in prices. In 2010 and 2011, however, mined gold output increased as companies attempted to take advantage of high prices.
As the economy improved and investors started to diversify investments outside of gold and silver, prices deteriorated, reducing industry revenue in 2013 and 2014. Moreover, domestic manufacturers of electrical equipment, electronic products and jewelry, which comprise the primary markets for gold and silver, have struggled with high import penetration and input costs over the past five years. Consequently, weakened demand from these markets accelerated the contraction in industry revenue. As these trends continue into 2015, reduced demand will suppress prices for gold and silver and limit industry revenue growth to 0.9% over the year. As a result of tremendous fluctuations, industry revenue is estimated to modestly decline at an annualized rate of 0.5% to $10.2 billion over the five years to 2015.
Weakened demand from downstream markets accelerated the contraction in industry revenue
WWW.IBISWORLD.COM Gold & Silver Ore Mining in the US February 2015 8
Industry Performance
Investment demandcontinued
exchange-traded funds (ETFs) have become increasingly common because most consumers do not have the resources to physically purchase and store gold and silver, which can be costly due to insurance. Each share in an ETF
represents one-tenth of an ounce. However, as investment demand has started to subside in recent years, demand from jewelry manufacturing has rebounded slightly because inputs have become more affordable.
Decreasing production
While gold and silver prices spiked in the early part of the period, such growth has failed to translate into a substantial increase in output over the five years to 2015, due to a lack of prior exploration and development activity. While production increased in 2010 for the first time in more than a decade, mined gold output has declined since 2012 while mined silver output decreased in 2011 and 2012 before modestly rising in 2013, the latest year of available data. The current downward trend in the price of commodities has been discouraging miners from boosting production volumes. Consequently, mined gold and silver output remains below 2010 production volumes.
Furthermore, low gold prices in the late 1990s and early 2000s reduced interest in domestic gold exploration and the development of new mines. Consequently, there have been insufficient new projects to replace depleted mine reserves. Nevertheless, all-time highs for gold and silver prices sparked renewed interest in new mining operations, such as the extension of the Cortez Hills mine in Nevada, which was completed in 2010. These newly developed mining operations helped increase gold output in 2010 and 2011, boosting exports. However, decreased production, coupled with deteriorating prices, has led international trade
volumes to contract in recent years. Over the five years 2015, exports are expected to decline at an annualized rate of 4.1% to $224.2 million. Meanwhile, imports are projected to drop even more rapidly at an average annual rate of 22.3% to $19.5 million. However, most of the trade in precious metals occurs in the downstream Copper, Zinc and Lead Refining industry (IBISWorld report 33141). For this reason, exports typically account for less than 4.0% of industry revenue, while imports satisfy less than 1.0% of domestic demand, although year-to-year values shift wildly.
As a result of the spike in gold and silver prices in the early part of the period, the number of industry enterprises has increased as more companies tried to cash in on the high profit of mining gold and silver. Therefore, the number of enterprises is estimated to rise at an annualized rate of 2.0% to 177 companies, despite industry exits since 2013 as commodity prices dropped. Similarly, employment in the industry is expected to increase 2.2% per year on average to 12,692 workers over the five years to 2015.
Price increases have failed to translate into substantial growth in output
WWW.IBISWORLD.COM Gold & Silver Ore Mining in the US February 2015 9
Industry Performance
Steady demand The world economy is expected to continue stabilizing and overcoming lingering recessionary effects. In line with this recovery, the Federal Reserve is expected to raise interest rates over the next five years to relieve inflationary pressures, resulting in higher returns from fixed-income assets such as bonds. However, rising interest rates also represent a destabilization of the existing investing environment, generating greater uncertainty. Consequently, many investors will continue to hold gold and silver ETFs in their portfolio to mitigate the risk from another economic downturn. Nevertheless, investors will still seek assets with higher returns, such as bonds, at the expense of gold and silver, limiting investment demand. Consequently, gold and silver prices are anticipated to grow far less rapidly than during and immediately after the financial crisis.
Slowing growth in input costs will boost demand from downstream manufacturers of electrical equipment and electronic products. However, the US Jewelry Manufacturing industry (IBISWorld report 33991) will continue to structurally decline as import penetration increases and production shifts offshore. While this will dampen revenue prospects domestically, the value of industry exports is projected to grow at an average annual rate of 4.2% to total $275.1 million over the five years to 2020, largely as a result of rising manufacturing activity abroad. In comparison, imports are anticipated to decline in the early part of the period as domestic production satisfies demand. Over the next five years, imports are projected to rise marginally at an annualized rate of 0.5% to total $20.0 million.
Industry Outlook
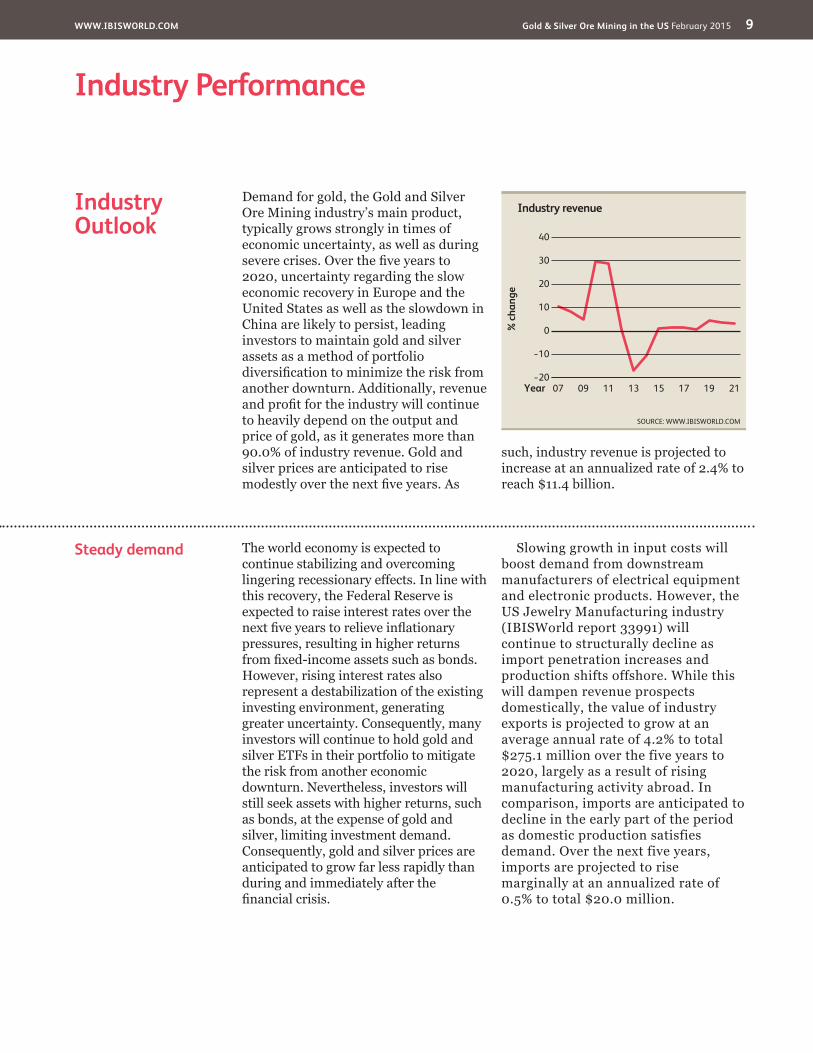
Demand for gold, the Gold and Silver Ore Mining industry’s main product, typically grows strongly in times of economic uncertainty, as well as during severe crises. Over the five years to 2020, uncertainty regarding the slow economic recovery in Europe and the United States as well as the slowdown in China are likely to persist, leading investors to maintain gold and silver assets as a method of portfolio diversification to minimize the risk from another downturn. Additionally, revenue and profit for the industry will continue to heavily depend on the output and price of gold, as it generates more than 90.0% of industry revenue. Gold and silver prices are anticipated to rise modestly over the next five years. As
such, industry revenue is projected to increase at an annualized rate of 2.4% to reach $11.4 billion.
% c
hang
e
40
−20
−10
0
10
20
30
2107 09 11 13 15 17 19Year
Industry revenue
SOURCE: WWW.IBISWORLD.COM
WWW.IBISWORLD.COM Gold & Silver Ore Mining in the US February 2015 10
Industry Performance
Heightened competition
Total US gold production has declined in recent years as weaker prices encouraged producers to scale back production and cut costs to maintain profit margins. While new gold-mining projects are anticipated to begin over the next few years, they are not expected to significantly offset the effect of mine closures. Furthermore, depleting resources nationwide will keep production low and continuously drive industry operators to invest internationally.
In addition, more aggressive gold mining is anticipated in Mexico over the next five years. This trend poses a threat to the US industry due to the lower labor and regulatory costs enjoyed by gold and silver mining companies in Mexico, which can pass on lower prices to customers. Heightened competition will boost merger and acquisition activity as companies
attempt to expand operations to benefit from economies of scale. Overall profit is projected to rise slightly due to the stricter implementation of cost-control measures. Meanwhile, the total number of industry participants is expected to grow marginally at an average annual rate of 0.3% to reach 180 companies over the next five years. Similarly, industry employment is anticipated to increase at an annualized rate of 1.3% to 13,521 workers as the growing size of mines drives up demand for labor.
Depleting resources will keep production low and drive industry operators to invest abroad
WWW.IBISWORLD.COM Gold & Silver Ore Mining in the US February 2015 11
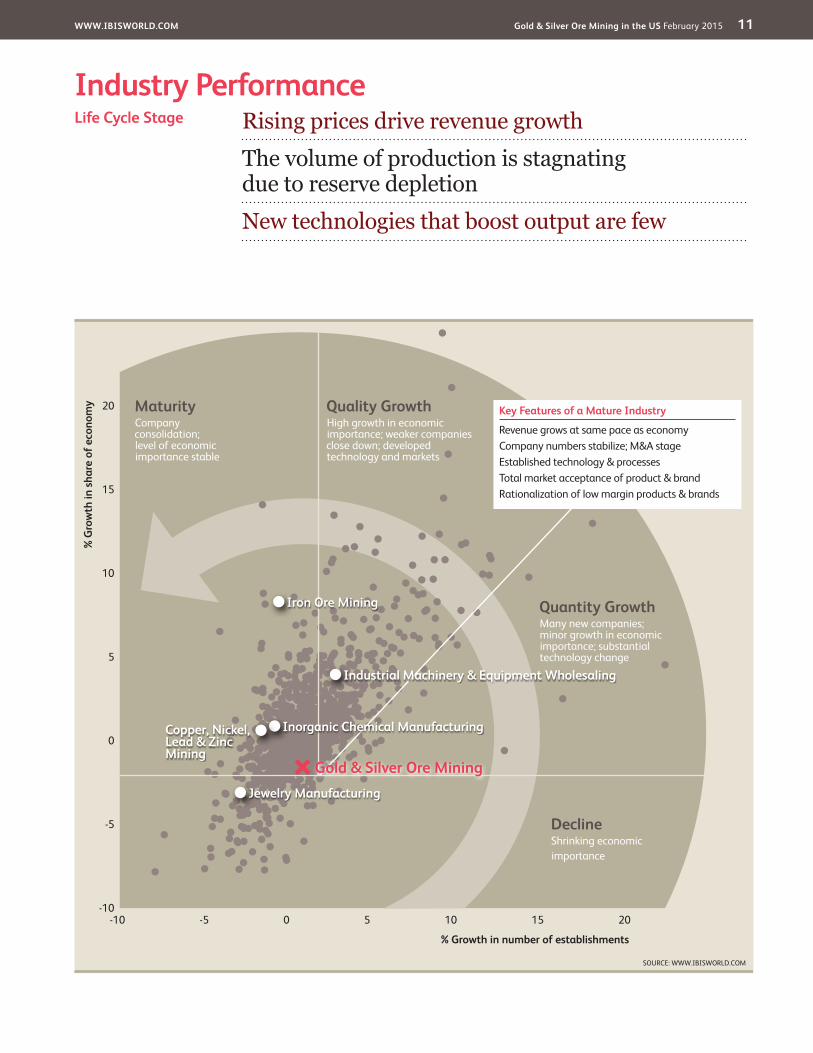
Industry PerformanceRising prices drive revenue growthThe volume of production is stagnating due to reserve depletionNew technologies that boost output are few
Life Cycle Stage
SOURCE: WWW.IBISWORLD.COM
20
15
10
5
0
-5
-10
% G
row
th in
sha
re o
f eco
nom
y
% Growth in number of establishments
-10 -5 0 5 10 15 20
DeclineShrinking economicimportance
Quality GrowthHigh growth in economic importance; weaker companies close down; developed technology and markets
MaturityCompany consolidation;level of economic importance stable
Quantity GrowthMany new companies; minor growth in economic importance; substantial technology change
Key Features of a Mature Industry
Revenue grows at same pace as economyCompany numbers stabilize; M&A stageEstablished technology & processesTotal market acceptance of product & brandRationalization of low margin products & brands
Iron Ore Mining
Jewelry Manufacturing
Inorganic Chemical ManufacturingCopper, Nickel, Lead & Zinc Mining
Industrial Machinery & Equipment Wholesaling
Gold & Silver Ore Mining
WWW.IBISWORLD.COM Gold & Silver Ore Mining in the US February 2015 12
Industry Performance
Industry Life Cycle The Gold and Silver Ore Mining industry is in the mature stage of its life cycle. Domestic production of both metals is decreasing. Although rapidly rising gold and silver prices boosted profit margins in 2010, they have since declined. As such, industry value added (IVA), a measure of the industry’s contribution to the economy, is also estimated to decline at an annualized rate of 0.4% over the 10 years to 2020. In comparison, US GDP is expected to rise at an average annual rate of 2.5% over the same period. However, IVA is extremely volatile because high gold and silver prices can inflate revenue and profit, thereby masking factors that make this a mature industry. Falling revenue and profit during the five years to 2015 falsely indicate the industry’s decline, but slowing enterprise growth and technological change demonstrate its maturity.
Gold and silver are well-accepted commodities and have established uses. Downstream markets for these products are also well defined and are not expected to change much. Further, the industry is limited by the amount of gold and silver available for mining. In fact, total industry production has declined since 2010.
Gold mine production increased in 2010 and 2011 because the lower costs associated with relatively new production techniques, such as open-cut mining and bacterial leaching, have permitted previously uneconomic deposits to be brought into production. New technologies are currently being sought to stabilize increasing costs while meeting environmental standards, but a major change in direction remains unlikely.
This industry is Mature
WWW.IBISWORLD.COM Gold & Silver Ore Mining in the US February 2015 13
Products & Services Gold and silver are sold in three forms: ore and concentrates, dore, and bullion. Gold bullion represents the largest share of industry revenue at 73.9%, and total gold sales account for about 92.5% of industry revenue. Silver products make up an estimated 7.5% of industry revenue despite exceeding gold fivefold in output metric tons (the much higher value of gold accounts for its significant share of revenue).
Silver versus goldThe industry’s two primary products, gold and silver, have shifted slightly as percentages of revenue over time, with silver’s share dropping in response to gold’s quick rise in price. Currently, silver accounts for about 7.5% of revenue. In the past five years, silver’s share of revenue is expected to remain stable as increased industrial demand for the metal will be mitigated by
continued growth in the price of gold. Bullion segments largely dominate the changes in share of industry revenue from both metals because bullion is the primary metal form used in jewelry and coin manufacturing, industrial markets and investments.
Bullion, dore and concentratesBullion, dore and concentrates have changed minimally as share of revenue in the past five years. Major mining companies must pay a toll charge to refine unpurified forms of gold and silver into bullion. Companies may also sell extra concentrate and dore inventory to refineries. Despite fluctuating precious metals prices, refinement charges have remained relatively stable; therefore, some producers are more willing to pay these charges. As a result, bullion sales have gone up in relation to concentrates and dore because demand for gold and
Products & MarketsSupply Chain | Products & Services | Demand Determinants Major Markets | International Trade | Business Locations
KEY BUYING INDUSTRIES
33141 Copper, Zinc & Lead Refining in the US This industry purchases and refines gold bullion into products that meet world standards for purity.
33991 Jewelry Manufacturing in the US Jewelry manufacturers produce a range of decorative items from gold and silver.
52 Finance and Insurance in the US Investment markets and firms that manage investment funds purchase and hold gold and silver for use in commodities trading.
99 Consumers in the US Consumers purchase gold and silver for decorative and investment purposes from retail markets.
KEY SELLING INDUSTRIES
32518 Inorganic Chemical Manufacturing in the US This industry provides chemicals used in the processing of gold and silver bearing ore.
42383 Industrial Machinery & Equipment Wholesaling in the US This industry provides heavy earth moving equipment used in gold and silver mines.
42469 Chemical Wholesaling in the US Firms in this industry supply chemicals used in operations.
42472 Gasoline & Petroleum Wholesaling in the US Firms in this industry supply fuel.
Supply Chain

WWW.IBISWORLD.COM Gold & Silver Ore Mining in the US February 2015 14
Products & Markets
DemandDeterminants
The demand for gold, either in bar form or fabricated into jewelry and coins, rests strongly on its traditional role as a store of wealth for individuals and nations. Demand fluctuates in response to consumer and investor confidence because gold is an investment commodity. Periods of economic decline and uncertainty produce an increase in demand for gold; this negatively correlated relationship is evident through gold’s soaring prices and revenue throughout the economic turbulence of recent years.
Demand for gold and silver in jewelry manufacturing moves largely in response to consumer demand and disposable incomes, domestically and abroad. The price of these metals, however, is determined in investment markets. As a result, large increases in the price of these metals can limit demand for gold and silver from jewelry manufacturers and consumers. For instance, during the recession, many investors fled to gold and silver as safe commodity investments, causing their prices to
Products & Servicescontinued
silver bullion from downstream industries is greater than demand for unpurified forms. This trend is minimal, however, and has primarily been evident in gold dore.
OutputMine output for both metals has experienced long-term declines due to resource depletion and decreased infrastructure investment. However, US gold production increased in 2010 and 2011. Before 2010, gold production in the United States had declined consistently since 2001. The recent jump in production can be attributed to mine exploration and
development in response to rising metal prices that have made mining activities more profitable. However, total gold production has declined from 231 metric tons in 2010 to 227 metric tons in 2013 (latest data available).
Silver production has also declined in the past five years, falling form 1,280 metric tons in 2010 to 1,090 in 2013 (latest data available). In spite of weak output, rising prices for both metals in the early part of the period bolstered revenue, creating a rush for firms to invest in further mine exploration and development in hopes of reaping the benefits of increased value.
Products and services segmentation (2015)
Total $10.2bn
74.0%Gold bullion
1.2%Gold ore and concentrates
17.3%Gold dore
4.8%Silver bullion 1.4%
Silver dore
1.3%Silver ore and concentrates
SOURCE: WWW.IBISWORLD.COM
WWW.IBISWORLD.COM Gold & Silver Ore Mining in the US February 2015 15
Products & Markets
Major Markets
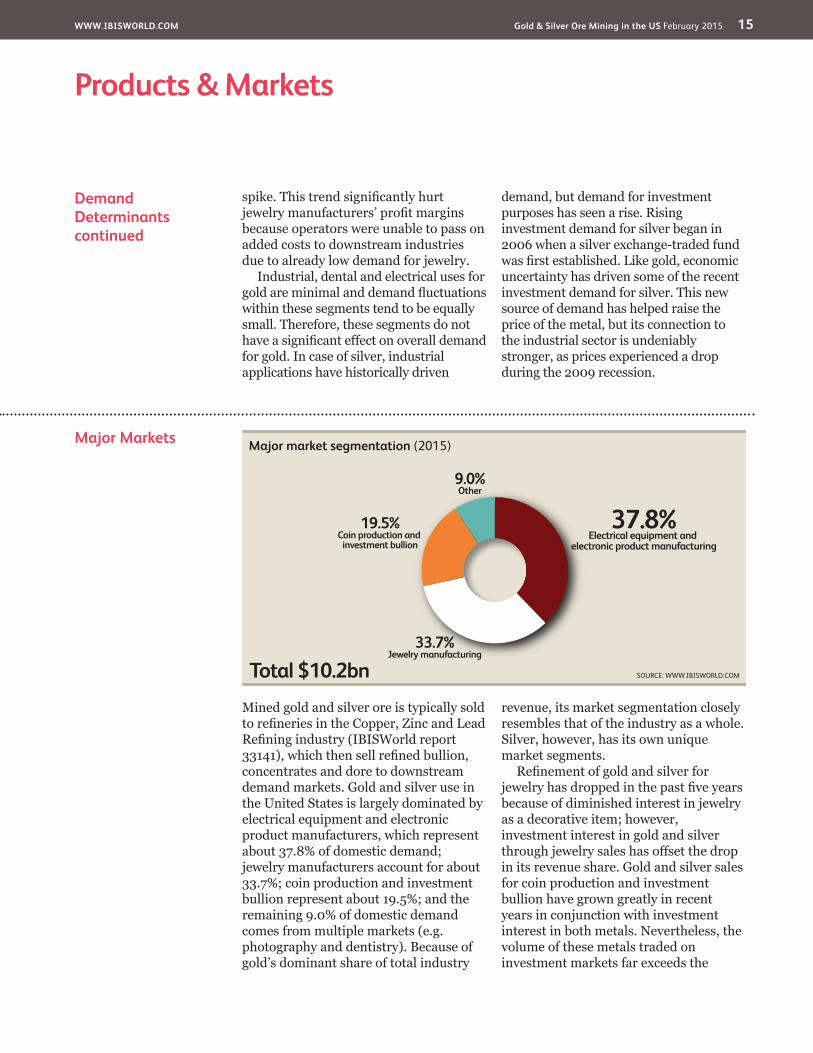
Mined gold and silver ore is typically sold to refineries in the Copper, Zinc and Lead Refining industry (IBISWorld report 33141), which then sell refined bullion, concentrates and dore to downstream demand markets. Gold and silver use in the United States is largely dominated by electrical equipment and electronic product manufacturers, which represent about 37.8% of domestic demand; jewelry manufacturers account for about 33.7%; coin production and investment bullion represent about 19.5%; and the remaining 9.0% of domestic demand comes from multiple markets (e.g. photography and dentistry). Because of gold’s dominant share of total industry
revenue, its market segmentation closely resembles that of the industry as a whole. Silver, however, has its own unique market segments.
Refinement of gold and silver for jewelry has dropped in the past five years because of diminished interest in jewelry as a decorative item; however, investment interest in gold and silver through jewelry sales has offset the drop in its revenue share. Gold and silver sales for coin production and investment bullion have grown greatly in recent years in conjunction with investment interest in both metals. Nevertheless, the volume of these metals traded on investment markets far exceeds the
DemandDeterminantscontinued
spike. This trend significantly hurt jewelry manufacturers’ profit margins because operators were unable to pass on added costs to downstream industries due to already low demand for jewelry.
Industrial, dental and electrical uses for gold are minimal and demand fluctuations within these segments tend to be equally small. Therefore, these segments do not have a significant effect on overall demand for gold. In case of silver, industrial applications have historically driven
demand, but demand for investment purposes has seen a rise. Rising investment demand for silver began in 2006 when a silver exchange-traded fund was first established. Like gold, economic uncertainty has driven some of the recent investment demand for silver. This new source of demand has helped raise the price of the metal, but its connection to the industrial sector is undeniably stronger, as prices experienced a drop during the 2009 recession.
Major market segmentation (2015)
Total $10.2bn
37.8%Electrical equipment and
electronic product manufacturing
33.7%Jewelry manufacturing
19.5%Coin production and investment bullion
9.0%Other
SOURCE: WWW.IBISWORLD.COM
WWW.IBISWORLD.COM Gold & Silver Ore Mining in the US February 2015 16
Products & Markets
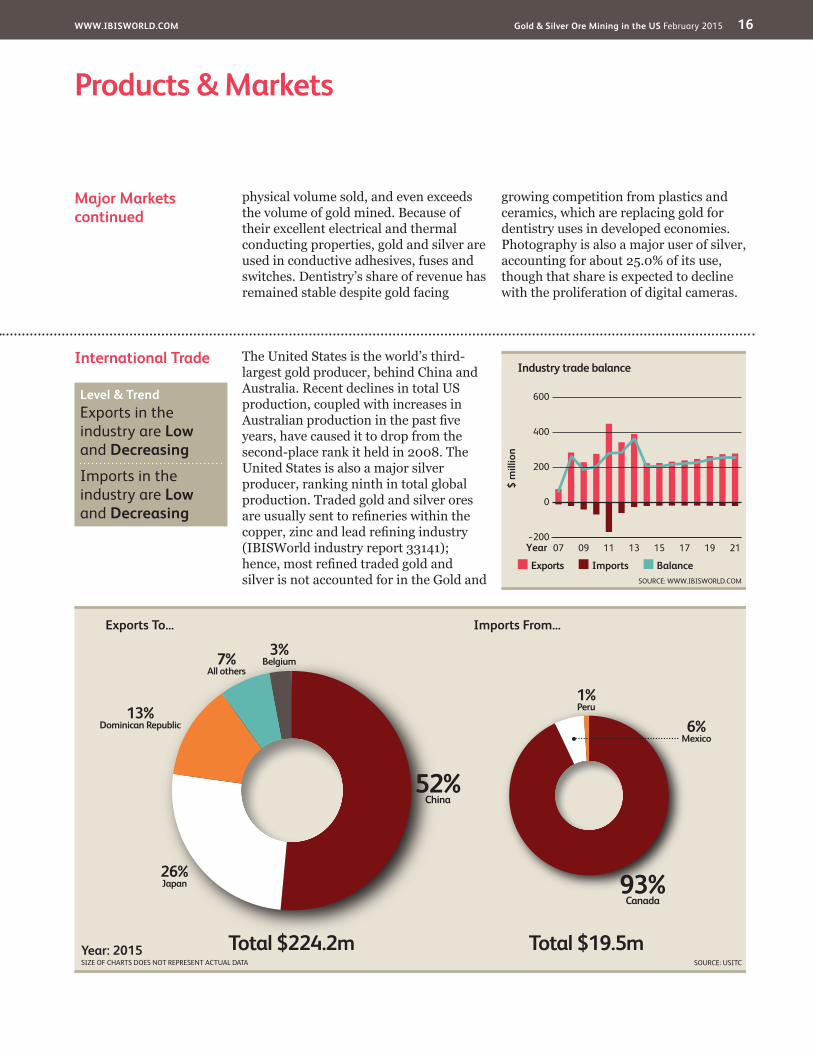
International Trade The United States is the world’s third-largest gold producer, behind China and Australia. Recent declines in total US production, coupled with increases in Australian production in the past five years, have caused it to drop from the second-place rank it held in 2008. The United States is also a major silver producer, ranking ninth in total global production. Traded gold and silver ores are usually sent to refineries within the copper, zinc and lead refining industry (IBISWorld industry report 33141); hence, most refined traded gold and silver is not accounted for in the Gold and
Major Marketscontinued
physical volume sold, and even exceeds the volume of gold mined. Because of their excellent electrical and thermal conducting properties, gold and silver are used in conductive adhesives, fuses and switches. Dentistry’s share of revenue has remained stable despite gold facing
growing competition from plastics and ceramics, which are replacing gold for dentistry uses in developed economies. Photography is also a major user of silver, accounting for about 25.0% of its use, though that share is expected to decline with the proliferation of digital cameras.
$ m
illio
n
600
−200
0
200
400
2107 09 11 13 15 17 19Year
Exports Imports Balance
Industry trade balance
SOURCE: WWW.IBISWORLD.COM
Level & Trend Exports in the industry are Low and Decreasing
Imports in the industry are Low and Decreasing
Imports From...
Total $19.5m
93%Canada
6%Mexico
1%Peru
Exports To...
Total $224.2m
52%China
26%Japan
13%Dominican Republic
7%All others
3%Belgium
Year: 2015SIZE OF CHARTS DOES NOT REPRESENT ACTUAL DATA SOURCE: USITC
WWW.IBISWORLD.COM Gold & Silver Ore Mining in the US February 2015 17
Products & Markets
International Tradecontinued
Silver Ore Mining industry. Exports regularly account for less than 4.0% of revenue, and imports regularly account for less than 1.0% of domestic demand.
ExportsThe value of exports within the Gold and Silver Ore Mining industry has fallen in the past five years. China, Japan, the Dominican Republic and Belgium are the main destinations for gold and silver exports due to the number of firms specializing in gold refining processes in these countries. In fact, in 2010 China became a major export destination due to rigorous investment activity by its central bank. Despite the rapid growth of exports in 2011, total industry exports still make up a small portion of industry revenue,
which is expected to remain the case in the next five years.
ImportsThe primary sources of gold and silver imports to the United States are Canada and Mexico because of major mining activities located in these countries, in addition to the North American Free Trade Agreement and proximity to manufacturing and investment markets in the United States. Imports have swung wildly in the past five years, more than doubling in 2011 and dropping by more than half in 2012 and 2013. Still, during the past five years imports have not risen above 1.0% of domestic demand. This proportion is expected to remain similar in the next five years.
WWW.IBISWORLD.COM Gold & Silver Ore Mining in the US February 2015 18
Products & Markets
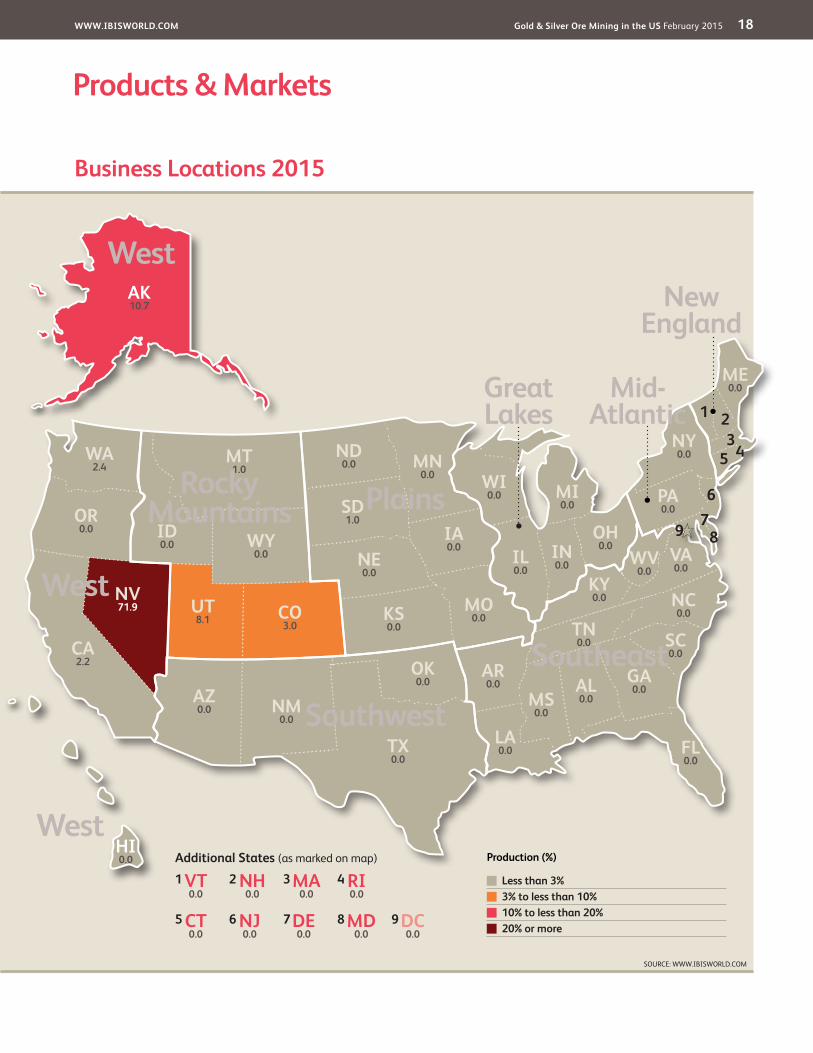
Business Locations 2015
MO0.0
West
West
West
Rocky Mountains Plains
Southwest
Southeast
New England
VT0.0
MA0.0
RI0.0
NJ0.0
DE0.0
NH0.0
CT0.0
MD0.0
DC0.0
1
5
3
7
2
6
4
8 9
Additional States (as marked on map)
AZ0.0
CA2.2
NV71.9
OR0.0
WA2.4
MT1.0
NE0.0
MN0.0
IA0.0
OH0.0 VA
0.0
FL0.0
KS0.0
CO3.0
UT8.1
ID0.0
TX0.0
OK0.0
NC0.0
AK10.7
WY0.0
TN0.0
KY0.0
GA0.0
IL0.0
ME0.0
ND0.0
WI0.0 MI
0.0 PA0.0
WV0.0
SD1.0
NM0.0
AR0.0
MS0.0
AL0.0
SC0.0
LA0.0
HI0.0
IN0.0
NY0.0 5
67
8
321
4
9
SOURCE: WWW.IBISWORLD.COM
Mid- Atlantic
Production (%)
Less than 3% 3% to less than 10% 10% to less than 20% 20% or more
Great Lakes
WWW.IBISWORLD.COM Gold & Silver Ore Mining in the US February 2015 19
Products & Markets
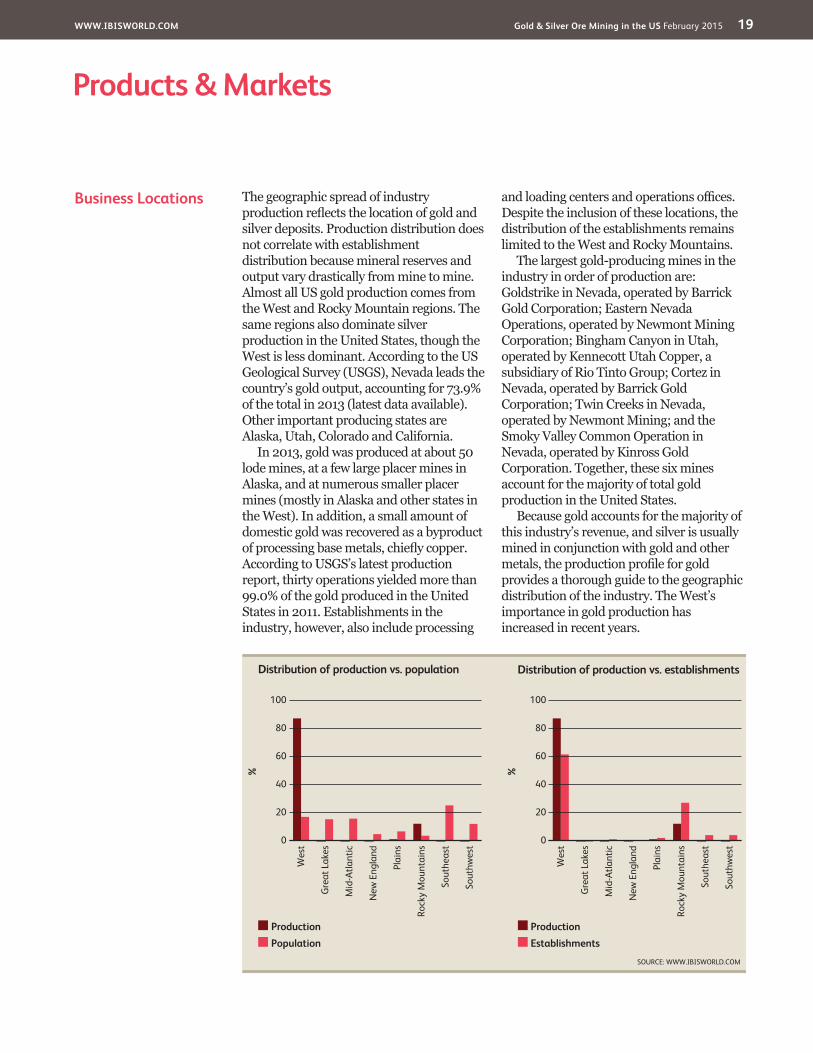
Business Locations The geographic spread of industry production reflects the location of gold and silver deposits. Production distribution does not correlate with establishment distribution because mineral reserves and output vary drastically from mine to mine. Almost all US gold production comes from the West and Rocky Mountain regions. The same regions also dominate silver production in the United States, though the West is less dominant. According to the US Geological Survey (USGS), Nevada leads the country’s gold output, accounting for 73.9% of the total in 2013 (latest data available). Other important producing states are Alaska, Utah, Colorado and California.
In 2013, gold was produced at about 50 lode mines, at a few large placer mines in Alaska, and at numerous smaller placer mines (mostly in Alaska and other states in the West). In addition, a small amount of domestic gold was recovered as a byproduct of processing base metals, chiefly copper. According to USGS’s latest production report, thirty operations yielded more than 99.0% of the gold produced in the United States in 2011. Establishments in the industry, however, also include processing
and loading centers and operations offices. Despite the inclusion of these locations, the distribution of the establishments remains limited to the West and Rocky Mountains.
The largest gold-producing mines in the industry in order of production are: Goldstrike in Nevada, operated by Barrick Gold Corporation; Eastern Nevada Operations, operated by Newmont Mining Corporation; Bingham Canyon in Utah, operated by Kennecott Utah Copper, a subsidiary of Rio Tinto Group; Cortez in Nevada, operated by Barrick Gold Corporation; Twin Creeks in Nevada, operated by Newmont Mining; and the Smoky Valley Common Operation in Nevada, operated by Kinross Gold Corporation. Together, these six mines account for the majority of total gold production in the United States.
Because gold accounts for the majority of this industry’s revenue, and silver is usually mined in conjunction with gold and other metals, the production profile for gold provides a thorough guide to the geographic distribution of the industry. The West’s importance in gold production has increased in recent years.
%
100
0
20
40
60
80So
uthw
est
Wes
t
Gre
at L
akes
Mid
-Atla
ntic
New
Eng
land
Plai
ns
Rock
y M
ount
ains
Sout
heas
t
ProductionEstablishments
Distribution of production vs. establishments
SOURCE: WWW.IBISWORLD.COM
%
100
0
20
40
60
80
Sout
hwes
t
Wes
t
Gre
at L
akes
Mid
-Atla
ntic
New
Eng
land
Plai
ns
Rock
y M
ount
ains
Sout
heas
t
ProductionPopulation
Distribution of production vs. population
WWW.IBISWORLD.COM Gold & Silver Ore Mining in the US February 2015 20
Cost Structure Benchmarks
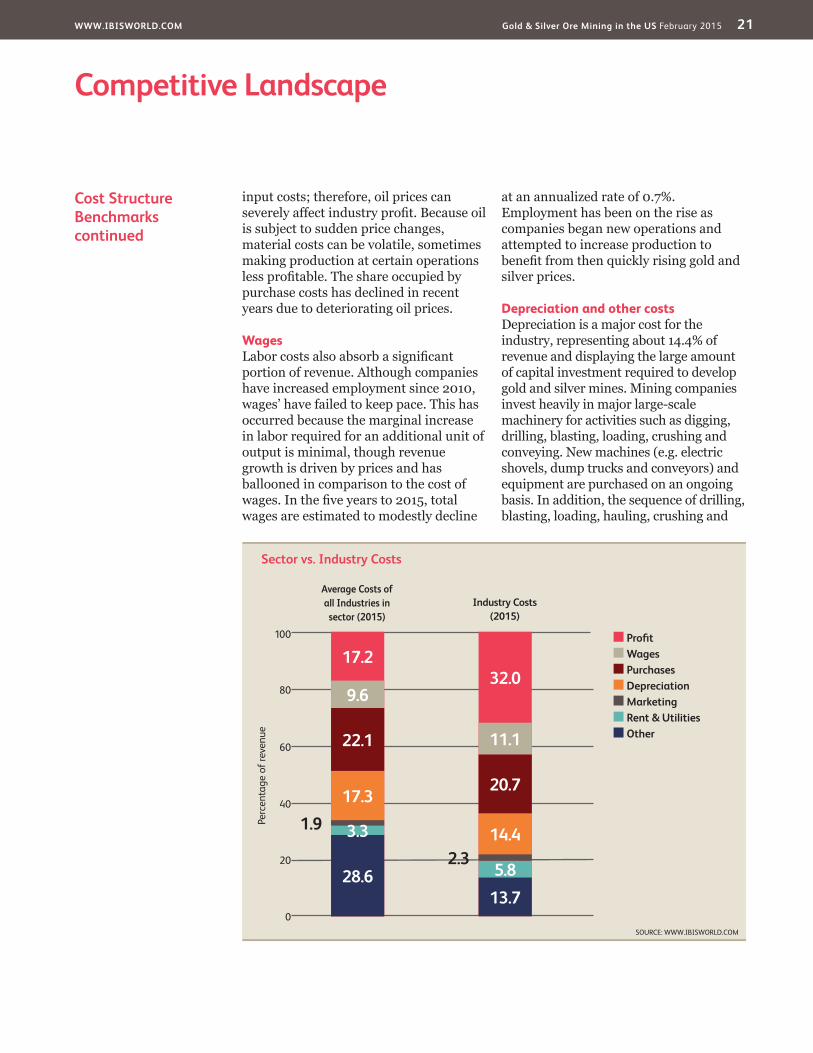
ProfitIndustry profit margins are high because there are few companies with the ability to mine gold and silver, and therefore industry operators wield some price-setting power. This power is furthered by the fact that there are few companies in the industry and therefore there is limited competition. In 2015, profit margins stand at an estimated 32.0% of revenue. Nevertheless, profit can be extremely volatile. Revenue has soared
and fallen during the past five years in conjunction with gold and silver prices, while input costs for fuel, labor and other consumables have risen at a faster pace, causing profit margins to contract from 43.9% in 2010.
PurchasesMaterial purchases for gold and silver producers include fuel, explosives and chemicals for metal extraction. Fuel represents a considerable portion of
Key Success Factors Ability to forward sell production when appropriateThe ability to forward-sell production when gold or silver prices are high effectively locks in those prices.
The ability to comply with environmental lawsFirms must be able to meet environmental laws and regulations to successfully develop and operate mines.
Degree of globalization in the firmGeographic diversity of assets and markets, including mine locations and exporting countries, creates a buffer
against negative fluctuating output and regional economic downturns.
Ability to expand and curtail operations rapidly in line with market demandSuccessful producers have a capacity to read future trends in demand and alter production accordingly.
Availability of resourceAccess to large, high-grade reserves is important. A larger deposit generally permits economies of scale and also provides greater flexibility in scheduling output, while high-grade reserves usually result in lower unit-operating costs.
Market Share Concentration
Concentration in the Gold and Silver Ore Mining industry is moderate. The six largest gold-producing mine sites in the United States, which account for the majority of domestic gold production, are operated by the four largest players: Barrick Gold Corporation, Newmont Mining Corporation, Kinross Gold Corporation and Kennecott Utah Copper (Rio Tinto Group). Industry concentration reflects the relatively small amount of mineral resource locations, where the largest and highest-volume producing mines are controlled by a few large companies, and multiple firms often
operate at the same mine establishments. Additionally, producers have an incentive to merge due to the cost benefits of having larger operations. Large producers also have greater capital availability necessary to invest in mine exploration and development. All these factors give major players an advantage, making it difficult for smaller firms to compete and lead some to consolidation. Most mergers and acquisitions in the industry occurred in the early 2000s, with consolidation accelerating in recent years as a result of deteriorating gold and silver prices.
Competitive LandscapeMarket Share Concentration | Key Success Factors | Cost Structure Benchmarks Basis of Competition | Barriers to Entry | Industry Globalization
Level Concentration in this industry is Medium
IBISWorld identifies 250 Key Success Factors for a business. The most important for this industry are:
WWW.IBISWORLD.COM Gold & Silver Ore Mining in the US February 2015 21
Competitive Landscape
Cost Structure Benchmarkscontinued
input costs; therefore, oil prices can severely affect industry profit. Because oil is subject to sudden price changes, material costs can be volatile, sometimes making production at certain operations less profitable. The share occupied by purchase costs has declined in recent years due to deteriorating oil prices.
WagesLabor costs also absorb a significant portion of revenue. Although companies have increased employment since 2010, wages’ have failed to keep pace. This has occurred because the marginal increase in labor required for an additional unit of output is minimal, though revenue growth is driven by prices and has ballooned in comparison to the cost of wages. In the five years to 2015, total wages are estimated to modestly decline
at an annualized rate of 0.7%. Employment has been on the rise as companies began new operations and attempted to increase production to benefit from then quickly rising gold and silver prices.
Depreciation and other costsDepreciation is a major cost for the industry, representing about 14.4% of revenue and displaying the large amount of capital investment required to develop gold and silver mines. Mining companies invest heavily in major large-scale machinery for activities such as digging, drilling, blasting, loading, crushing and conveying. New machines (e.g. electric shovels, dump trucks and conveyors) and equipment are purchased on an ongoing basis. In addition, the sequence of drilling, blasting, loading, hauling, crushing and
Sector vs. Industry Costs
■ Profi t■ Wages■ Purchases■ Depreciation■ Marketing■ Rent & Utilities■ Other
Average Costs of all Industries in sector (2015)
Industry Costs (2015)
0
20
40
60
Perc
enta
ge o
f rev
enue
80
100
17.2
28.6
3.31.917.3
22.1
9.632.0
13.7
5.82.3
14.4
20.7
11.1
SOURCE: WWW.IBISWORLD.COM
WWW.IBISWORLD.COM Gold & Silver Ore Mining in the US February 2015 22
Competitive Landscape
Basis of Competition Gold and silver are traded on the basis of price, which in turn is set by the interaction between supply and demand. Individual producers are unable to influence either gold or silver prices and both commodities are also traded on futures exchanges. The undifferentiated nature of the two commodities makes for a high level of competition, which has remained steady despite consolidation of large and small firms.
Internal competitionIndividual producers primarily compete on the basis of cost because they are unable to influence gold or silver prices. The lowest-cost mining operations are better able to survive periods of low gold and silver prices or increases in input costs. Low-cost operations also find it easier to secure financing, attract labor and are better able to pursue technological development.
Competition among major players is also centered on the acquisition of attractive mineral properties. Acquiring or holding rights to properties with high gold or silver deposits determines the level of company production, which highly influences financial results.
International gold and silver mining activities are a major source of competition for US producers. While many US producers also operate abroad, companies with greater operations outside the United States can sometimes gain an advantage through lower labor, material and energy costs. Furthermore, government-owned mining operations in many African countries are backed by
government funds, and are therefore better able to attain financing and survive periods of high input costs.
External competitionGold and silver both face competition in end-use markets from other materials. In its major market, jewelry, gold and silver compete with other precious metals, including platinum, and, to a lesser extent, with metals such as stainless steel. This competition is, however, limited and declining as demand for gold jewelry has dropped while demand for gold as an investment item has greatly increased.
Gold faces competition in the small dentistry market from substitute products, such as stainless steel and various types of plastics and ceramics. While competition from these products is rising in developed countries, primarily for aesthetic reasons, the growth of improved dentistry in less-developed countries still relies heavily on gold.
As a precious metal investment option, gold and silver primarily face competition from platinum, with gold representing the greatest portion of this investment. These metals also face competition from the general investment market because many investors focus on precious metals, especially in difficult and uncertain economic times. In recent years, the US economy has seen interest in gold investments increase in relation to interest in stocks and bonds and currency movements. An example of this relationship is the decreasing ratio of the Dow Jones Industrial Average value over the unit price of gold.
Cost Structure Benchmarkscontinued
conveying is, at some large mines (e.g. Bingham Canyon), carried out 24 hours per day throughout the entire year. This continuous use of machinery requires companies to regularly replace equipment, maintaining steady depreciation charges.
Other expenses for the industry include costs for depletion, maintenance and shipping, utilities, contractors, administrative activities, marketing, and royalties paid to mine owners and state governments.
Level & Trend Competition in this industry is High and the trend is Steady
WWW.IBISWORLD.COM Gold & Silver Ore Mining in the US February 2015 23
Competitive Landscape
Industry Globalization
The Gold and Silver Ore Mining industry has a relatively low level of globalization. Numerous major firms operating in this industry in the United States are based in other countries, while US firms also have substantial overseas interests in gold and silver ore mining. The largest industry player, Barrick Gold Corporation operates mines in seven countries outside the United States,
including Argentina, Australia and Canada. The next three largest industry players also have extensive overseas mining operations.
Despite operating on a global market, industry exports and imports are relatively low and steady. Export and import values have increased in recent years primarily due to the large increases in the price of gold. In addition, most
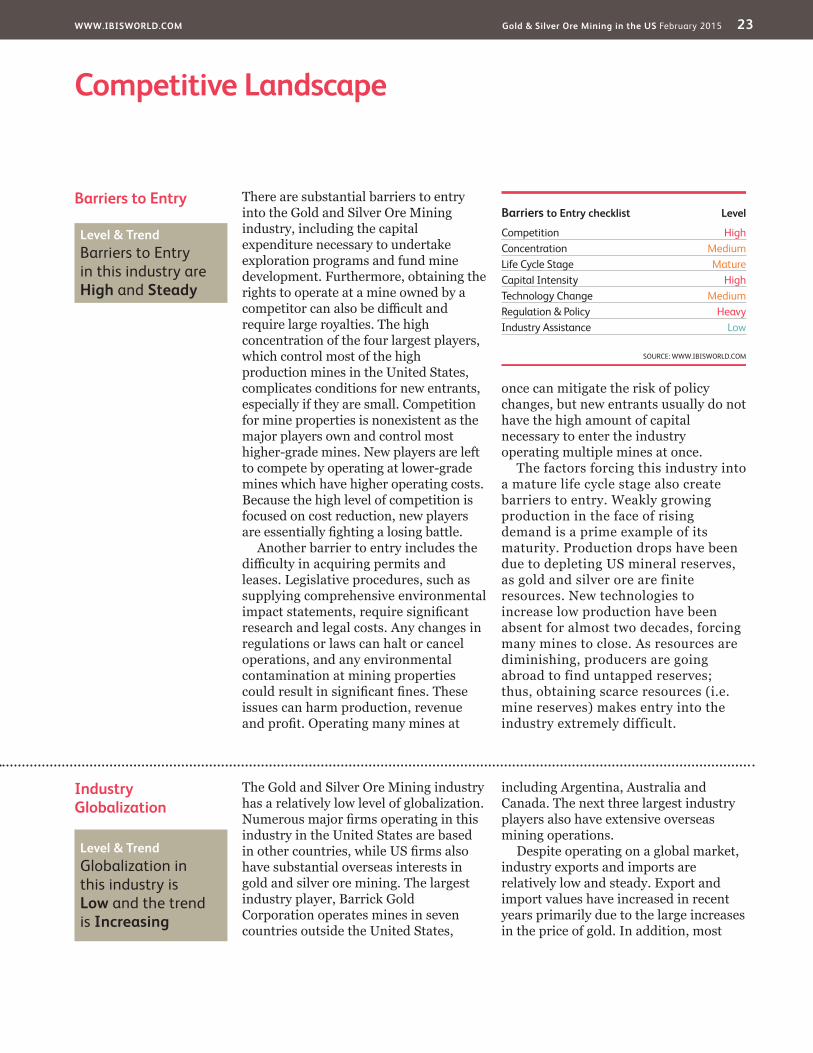
Barriers to Entry There are substantial barriers to entry into the Gold and Silver Ore Mining industry, including the capital expenditure necessary to undertake exploration programs and fund mine development. Furthermore, obtaining the rights to operate at a mine owned by a competitor can also be difficult and require large royalties. The high concentration of the four largest players, which control most of the high production mines in the United States, complicates conditions for new entrants, especially if they are small. Competition for mine properties is nonexistent as the major players own and control most higher-grade mines. New players are left to compete by operating at lower-grade mines which have higher operating costs. Because the high level of competition is focused on cost reduction, new players are essentially fighting a losing battle.
Another barrier to entry includes the difficulty in acquiring permits and leases. Legislative procedures, such as supplying comprehensive environmental impact statements, require significant research and legal costs. Any changes in regulations or laws can halt or cancel operations, and any environmental contamination at mining properties could result in significant fines. These issues can harm production, revenue and profit. Operating many mines at
once can mitigate the risk of policy changes, but new entrants usually do not have the high amount of capital necessary to enter the industry operating multiple mines at once.
The factors forcing this industry into a mature life cycle stage also create barriers to entry. Weakly growing production in the face of rising demand is a prime example of its maturity. Production drops have been due to depleting US mineral reserves, as gold and silver ore are finite resources. New technologies to increase low production have been absent for almost two decades, forcing many mines to close. As resources are diminishing, producers are going abroad to find untapped reserves; thus, obtaining scarce resources (i.e. mine reserves) makes entry into the industry extremely difficult.
Barriers to Entry checklist Level
Competition HighConcentration MediumLife Cycle Stage MatureCapital Intensity HighTechnology Change MediumRegulation & Policy HeavyIndustry Assistance Low
SOURCE: WWW.IBISWORLD.COM
Level & Trend Barriers to Entry in this industry are High and Steady
Level & Trend Globalization in this industry is Low and the trend is Increasing
WWW.IBISWORLD.COM Gold & Silver Ore Mining in the US February 2015 24
Competitive Landscape
Industry Globalizationcontinued
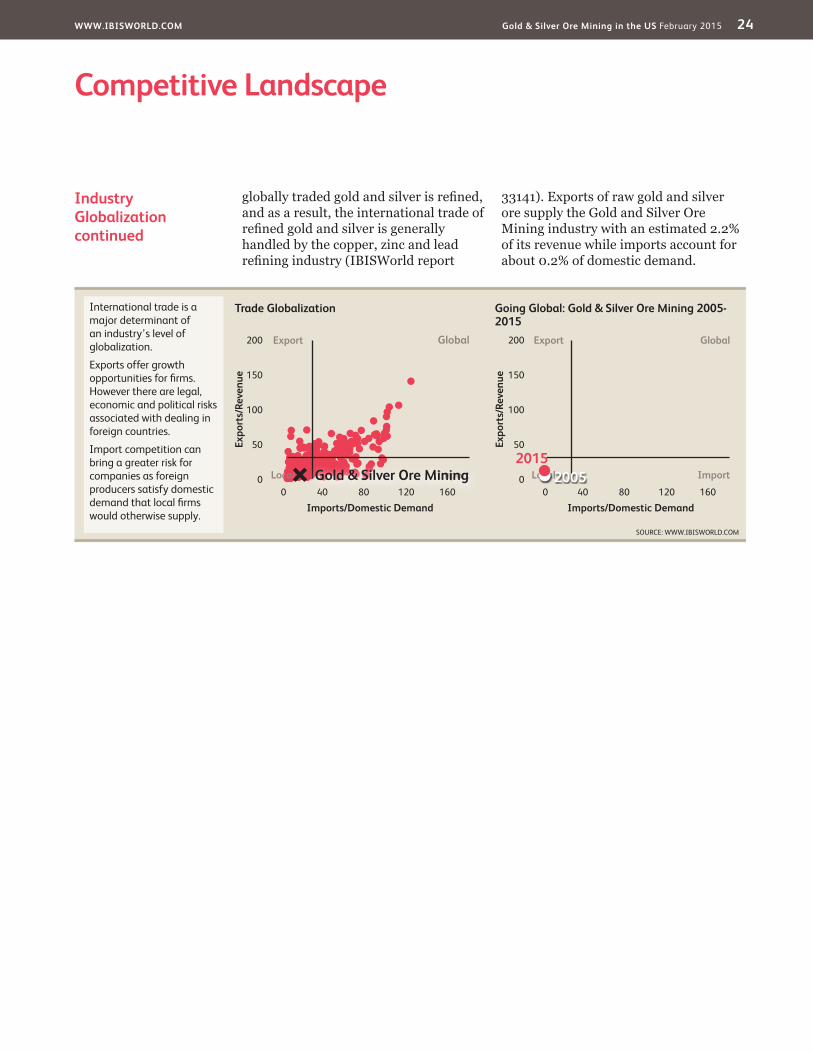
globally traded gold and silver is refined, and as a result, the international trade of refined gold and silver is generally handled by the copper, zinc and lead refining industry (IBISWorld report
33141). Exports of raw gold and silver ore supply the Gold and Silver Ore Mining industry with an estimated 2.2% of its revenue while imports account for about 0.2% of domestic demand.
SOURCE: WWW.IBISWORLD.COM
Trade Globalization Going Global: Gold & Silver Ore Mining 2005-2015
Expo
rts/
Reve
nue
Expo
rts/
Reve
nue
200
150
100
50
0
200
150
100
50
0
Imports/Domestic Demand Imports/Domestic Demand0 040 4080 80120 120160 160
International trade is a major determinant of an industry’s level of globalization.
Exports offer growth opportunities for fi rms. However there are legal, economic and political risks associated with dealing in foreign countries.
Import competition can bring a greater risk for companies as foreign producers satisfy domestic demand that local fi rms would otherwise supply.
Export ExportGlobal Global
ImportLocal ImportLocalGold & Silver Ore Mining 20052015
WWW.IBISWORLD.COM Gold & Silver Ore Mining in the US February 2015 25
Player Performance Barrick Gold Corporation of Canada is involved in the production and sale of gold, copper and silver, including the related activities of exploration and mine development. It operates internationally and generates about one-third of its revenue from US gold mining activities. The company divides its gold mining operations into segments based on region, including North America, South America, Australia Pacific and Africa. Aside from US mines, its North American operations comprise a mine in the Dominican Republic and one in Ontario, Canada.
Of the seven US mines in operation, Barrick wholly owns five and is part owner of Turquoise Ridge (75.0%) and Round Mountain (50.0%). As of its most recent annual report (2013), the company’s highest-producing mine is Cortez, followed by Goldstrike and
Round Mountain, all of which are in Nevada. Despite its third-place ranking, Round Mountain is notable for being the largest open-pit mining operation in North America. In 2014, Barrick finalized the sale of its 33.0% ownership stake in Marigold, another Nevada mine.
In February 2010, Barrick completed an extension of the Cortez mine called Cortez Hills, leading to an estimated 176.0% production increase for the site. By 2011, production for the North America region grew to an estimated 3.4 million troy ounces, driven largely by higher production at Cortez. Consequently, Barrick produced 40.0% more gold than its nearest competitor in 2011, increasing company revenue as gold prices continued to surge. Increased production and growing demand from jewelry manufacturing positioned Barrick as the industry leader.
Major CompaniesBarrick Gold Corporation | Newmont Mining CorporationKinross Gold Corporation | Other Companies
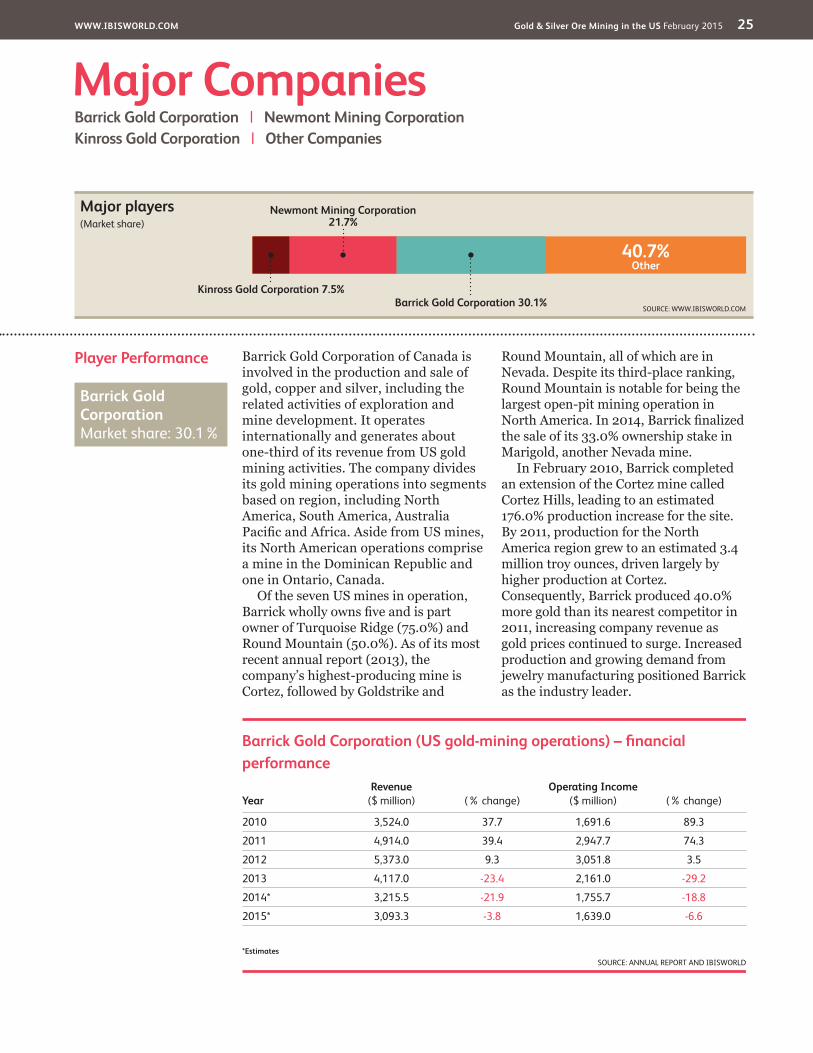
40.7%Other
Barrick Gold Corporation 30.1%
Newmont Mining Corporation 21.7%
Kinross Gold Corporation 7.5%
SOURCE: WWW.IBISWORLD.COM
Major players(Market share)
Barrick Gold Corporation (US gold-mining operations) – fi nancial performance
YearRevenue
($ million) (% change)Operating Income
($ million) (% change)
2010 3,524.0 37.7 1,691.6 89.3
2011 4,914.0 39.4 2,947.7 74.3
2012 5,373.0 9.3 3,051.8 3.5
2013 4,117.0 -23.4 2,161.0 -29.2
2014* 3,215.5 -21.9 1,755.7 -18.8
2015* 3,093.3 -3.8 1,639.0 -6.6
*EstimatesSOURCE: ANNUAL REPORT AND IBISWORLD
Barrick Gold Corporation Market share: 30.1%
WWW.IBISWORLD.COM Gold & Silver Ore Mining in the US February 2015 26
Major Companies
Player Performance Headquartered in Denver, Newmont Mining Corporation is one of the world’s largest gold producers, with significant assets and operations in the United States, Australia, Peru, Indonesia, Ghana, Canada, New Zealand and Mexico. The company also produces copper primarily in Indonesia and Australia.
Newmont’s US mines are located in Nevada and operate as an integrated unit. Operations include a continually fluctuating mix of open-pit mines, underground mines and processing facilities. The company holds a 25.0% interest in the Turquoise Ridge mine, a joint venture with Barrick Gold Corporation, and wholly owns the rest of its US properties. These Nevada operations boast the widest variety of processing methods of any gold-mining complex in the world, allowing Newmont to extract gold from a wide range of ore types and grades.
In April 2011, Newmont completed the acquisition of Vancouver-based Fronteer Gold, which holds interests in three Nevada gold projects that currently have 5.7 million troy ounces of measured, indicated and inferred resource. Its flagship property, Long Canyon, holds an estimated 2.2 million troy ounces. Newmont is currently developing the site with the intention of bringing the project into production in 2017, with initial estimated gold production of 300,000 troy ounces per year. In 2014, the company began to sell off noncore assets to minimize liabilities as the price of gold falls, which has compromised margins.
Financial performanceNewmont’s US gold mining operations generate about one-quarter to one-third of the company’s revenue each year. This revenue has risen and fallen over
Player Performancecontinued
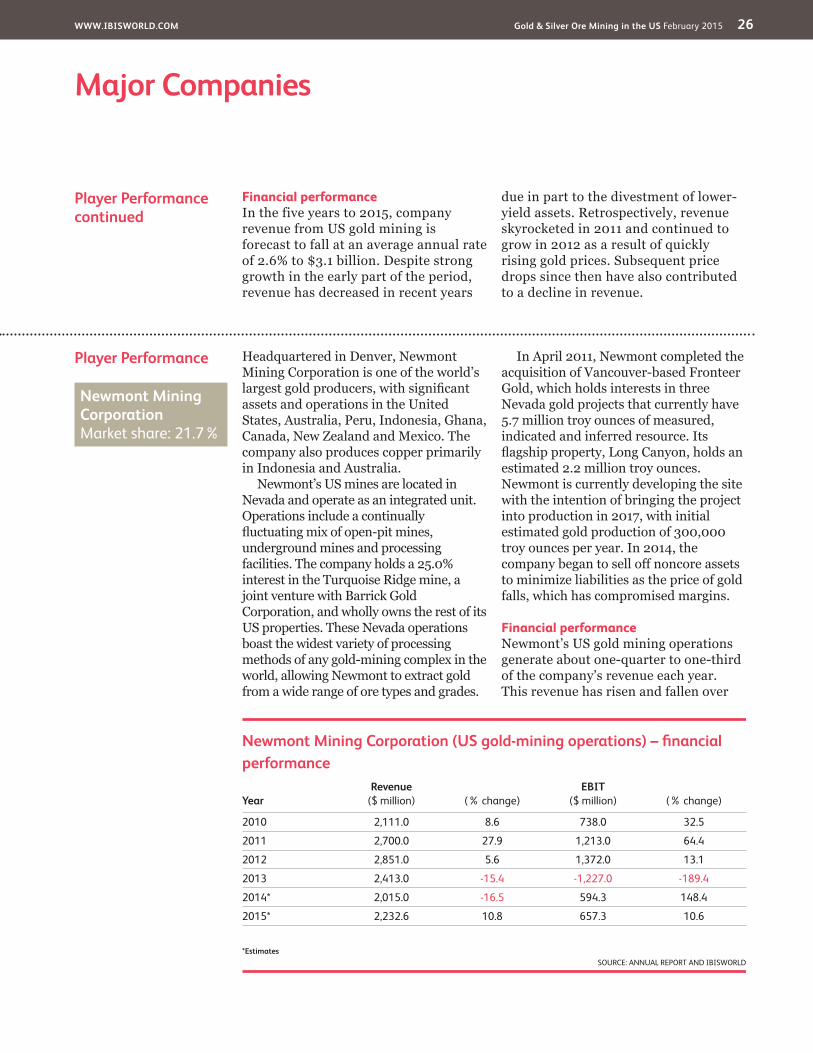
Financial performanceIn the five years to 2015, company revenue from US gold mining is forecast to fall at an average annual rate of 2.6% to $3.1 billion. Despite strong growth in the early part of the period, revenue has decreased in recent years
due in part to the divestment of lower-yield assets. Retrospectively, revenue skyrocketed in 2011 and continued to grow in 2012 as a result of quickly rising gold prices. Subsequent price drops since then have also contributed to a decline in revenue.
Newmont Mining Corporation (US gold-mining operations) – fi nancial performance
YearRevenue
($ million) (% change)EBIT
($ million) (% change)
2010 2,111.0 8.6 738.0 32.5
2011 2,700.0 27.9 1,213.0 64.4
2012 2,851.0 5.6 1,372.0 13.1
2013 2,413.0 -15.4 -1,227.0 -189.4
2014* 2,015.0 -16.5 594.3 148.4
2015* 2,232.6 10.8 657.3 10.6
*EstimatesSOURCE: ANNUAL REPORT AND IBISWORLD
Newmont Mining Corporation Market share: 21.7%

WWW.IBISWORLD.COM Gold & Silver Ore Mining in the US February 2015 27
Major Companies
Player Performance Kinross Gold Corporation is a Canada-based gold-mining company with mines and projects in the United States, Brazil, Canada, Chile, Ecuador, Ghana, Mauritania and Russia. The company employs about 9,100 workers worldwide and produces and sells silver, which amounts to about 10.0% of the company’s revenue.
Kinross’s US operations comprise the Fort Knox, Round Mountain and Buckhorn mines, located in Alaska, Nevada and Washington, respectively. It owns Fort Knox and Buckhorn and shares Round Mountain with Barrick Gold Corporation. The company also controls several additional deposits in the Fort Knox mine area that are being explored as possible future satellite operations. Buckhorn operations began in late 2008 after Kinross ceased mining at the nearby Kettle River mine.
Retrospectively, US production increased in both 2012 and 2013,
following a drop in production in 2011 at its Fort Knox and Buckhorn mines due to a reduction in ore grades. Of its US mines, only Round Mountain achieved production growth in 2011 as a result of increased processing levels. Nevertheless, the company is estimated to have increased overall production in the past five years.
Financial performanceKinross’ US industry-relevant revenue is projected to decrease at an annualized rate of 3.2% to $768.3 million in the five years to 2015. Overall, growing production in new and existing mines and higher gold prices resulted in impressive domestic revenue growth in the early part of the period. However, deteriorating gold and silver prices in recent years have reversed this trend, leading to steep revenue declines since 2013.
Player Performancecontinued
the past five years as the price of gold has spiked and dropped. In 2013, the price of gold fell to the point at which the company realized an operating loss, after which it began to divest noncore
assets to reduce costs. In the five years to 2015, IBISWorld estimates that Newmont’s industry-relevant revenue will modestly grow at an annualized rate of 1.1% to $2.2 billion.
Kinross Gold Corporation (US gold-mining operations) – fi nancial performance
YearRevenue
($ million) (% change)Net Income
($ million) (% change)
2010 903.0 38.3 349.7 123.8
2011 1,028.4 13.9 439.8 25.8
2012 1,133.6 10.2 502.3 14.2
2013 1,039.6 -8.3 197.9 -60.6
2014* 847.1 -18.5 175.4 -11.4
2015* 768.3 -9.3 145.4 -17.1
*EstimatesSOURCE: ANNUAL REPORT AND IBISWORLD
Kinross Gold Corporation Market share: 7.5%
WWW.IBISWORLD.COM Gold & Silver Ore Mining in the US February 2015 28
Major Companies
Other Companies Merger and acquisition activity in recent years has provided greater market share to three major companies, but a notable share of industry revenue is derived from numerous smaller players. Some of these smaller companies dedicate operations to gold or silver mining, such as Goldcorp Inc., AngloGold Ashanti and Quadra Mining Corp. However, a substantial number of operators either produce gold and silver through minority holdings in mines operated by the major players (e.g. Rio Tinto and Sumitomo Metal Mining Co.), or generate gold and silver as a byproduct of other mining operations (e.g. Teck Cominco and Freeport-McMoRan).
Rio Tinto Estimated market share: 2.1%Rio Tinto explores, mines and processes metals and minerals
worldwide, with total North American sales accounting for nearly a quarter of company revenue. The group’s major products include aluminum, copper, diamonds, energy products, gold, industrial minerals and iron ore. The company also mines gold in the United States through its subsidiary Kennecott Utah Copper. Gold and silver are primarily produced as byproducts of Rio Tinto’s copper operations, often extracted as impurities in the final stage of refining copper. Despite Rio Tinto’s involvement in supporting industry production and revenue, gold and silver account for a small portion of its North American sales. IBISWorld anticipates that revenue from the company’s US-gold mining operations will total $220.9 million in 2015.
WWW.IBISWORLD.COM Gold & Silver Ore Mining in the US February 2015 29
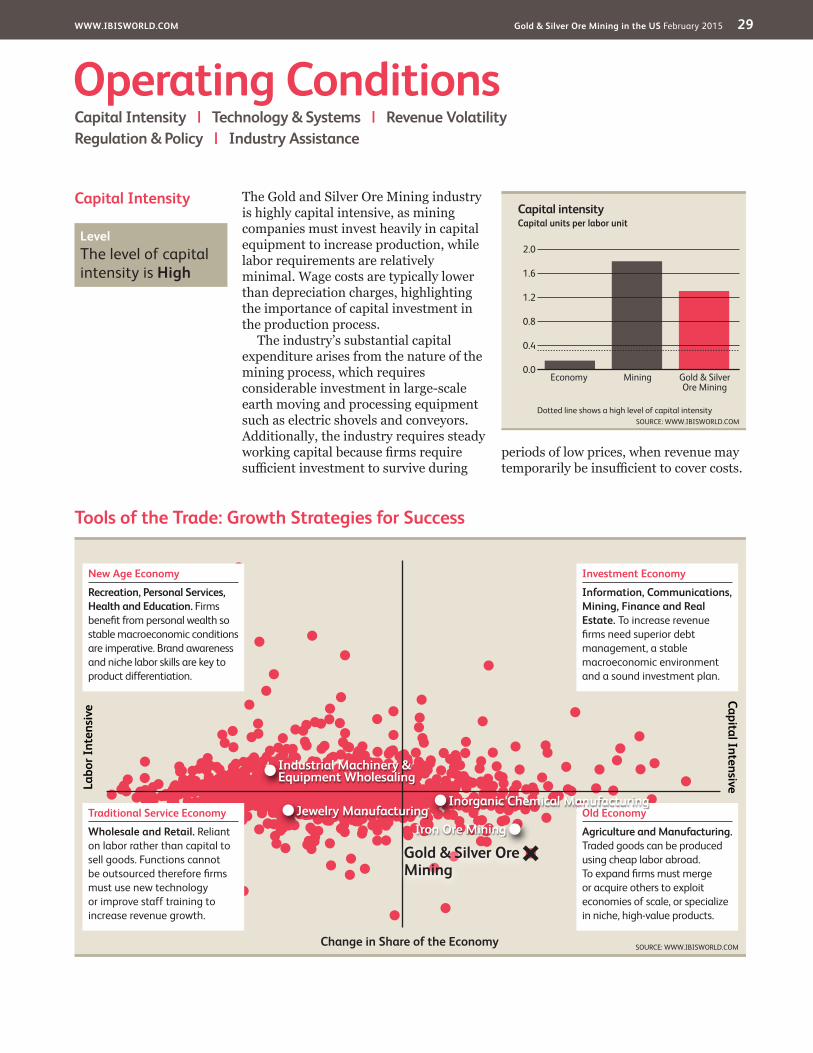
Capital Intensity The Gold and Silver Ore Mining industry is highly capital intensive, as mining companies must invest heavily in capital equipment to increase production, while labor requirements are relatively minimal. Wage costs are typically lower than depreciation charges, highlighting the importance of capital investment in the production process.
The industry’s substantial capital expenditure arises from the nature of the mining process, which requires considerable investment in large-scale earth moving and processing equipment such as electric shovels and conveyors. Additionally, the industry requires steady working capital because firms require sufficient investment to survive during
periods of low prices, when revenue may temporarily be insufficient to cover costs.
Operating ConditionsCapital Intensity | Technology & Systems | Revenue VolatilityRegulation & Policy | Industry Assistance
Tools of the Trade: Growth Strategies for Success
SOURCE: WWW.IBISWORLD.COM
Labo
r Int
ensi
veCapital Intensive
Change in Share of the Economy
New Age Economy
Recreation, Personal Services, Health and Education. Firms benefi t from personal wealth so stable macroeconomic conditions are imperative. Brand awareness and niche labor skills are key to product differentiation.
Traditional Service Economy
Wholesale and Retail. Reliant on labor rather than capital to sell goods. Functions cannot be outsourced therefore fi rms must use new technology or improve staff training to increase revenue growth.
Old Economy
Agriculture and Manufacturing. Traded goods can be produced using cheap labor abroad. To expand fi rms must merge or acquire others to exploit economies of scale, or specialize in niche, high-value products.
Investment Economy
Information, Communications, Mining, Finance and Real Estate. To increase revenue fi rms need superior debt management, a stable macroeconomic environment and a sound investment plan.
Iron Ore MiningJewelry Manufacturing
Inorganic Chemical Manufacturing
Industrial Machinery & Equipment Wholesaling
Gold & Silver Ore Mining
Capital intensity
2.0
0.0
0.4
0.8
1.2
1.6
SOURCE: WWW.IBISWORLD.COMDotted line shows a high level of capital intensity
Capital units per labor unit
Gold & Silver Ore Mining
MiningEconomy
Level The level of capital intensity is High

WWW.IBISWORLD.COM Gold & Silver Ore Mining in the US February 2015 30
Operating Conditions
Revenue Volatility The Gold and Silver Ore Mining industry is highly volatile, reflecting fluctuations in the prices for gold and silver. Metal prices are determined on global markets and reflect the dynamic nature of the supply and demand balance, rising sharply in response to
supply shortfalls and falling just as quickly if oversupply emerges. These prices change in response to demand for the metals, and demand is largely determined by investor confidence. With lower investor confidence and greater economic uncertainty, many
Technology& Systems
The technology and systems employed by the industry have changed at a moderate rate in recent years, after considerable change in methods of gold production during the 1980s and 1990s allowed for greater output from previously low-producing mines. Technology change today is primarily concerned with complying with environmental regulations and reducing input costs. Beyond mining equipment and methods, technological change within the industry has also concentrated on improved information systems. With better systems, companies can improve production planning, equipment monitoring and reserves estimations. This, in turn, reduces long-term costs by operating more efficiently.
The rapid growth in gold production in the United States 30 years ago was based on the open-cut (placer) mining of large,
low-grade deposits combined with the use of chemicals for gold extraction. The techniques marked a sharp change from the traditional method of underground (lode) mining, and helped boost output significantly. Both methods involve an initial process of ore removal, followed by chemical gold extraction.
Silver is mined with gold and other base metals including lead and zinc, with only a handful of mines primarily producing silver. Unlike gold, most silver is produced at lode (underground) mines, rather than from placer operations.
Most major companies within the industry are constantly seeking to invest and develop innovative technologies in order to increase output and decrease costs. Proprietary technologies are especially sought after, as they can give tremendous competitive advantage to firms with access to them.
Level The level of Technology Change is Medium
SOURCE: WWW.IBISWORLD.COM
Volatility vs Growth
Reve
nue
vola
tility
* (%
)
1000
100
10
1
0.1
Five year annualized revenue growth (%)–30 –10 10 30 50 70
Hazardous
Stagnant
Rollercoaster
Blue Chip
* Axis is in logarithmic scale
Gold & Silver Ore Mining
A higher level of revenue volatility implies greater industry risk. Volatility can negatively affect long-term strategic decisions, such as the time frame for capital investment.
When a fi rm makes poor investment decisions it may face underutilized capacity if demand suddenly falls, or capacity constraints if it rises quickly.
Level The level of Volatility is High
WWW.IBISWORLD.COM Gold & Silver Ore Mining in the US February 2015 31
Operating Conditions
Regulation & Policy The industry is highly regulated, with state governments overseeing virtually all aspects of operation. The government determines which land is open to exploration and mining and issues leases for both. In addition, the US Department of the Treasury maintains a stockpile of gold, and the US Department of Defense administers a government-wide secondary precious metals recovery program.
Federal land is open to mining claims in 19 states: Alaska, Alabama, Arizona, Arkansas, California, Colorado, Florida, Idaho, Mississippi, Montana, Nebraska, Nevada, New Mexico, North Dakota, Oregon, South Dakota, Utah, Washington and Wyoming. The US Bureau of Land Management (BLM) manages the surface of public lands in these states and the Forest Service manages the surface of National Forest System lands. The BLM is responsible for the subsurface minerals on both its public lands and National Forest System lands.
Firms are also required to comply with the US Environmental Protection Agency regulations relating to air, water pollution and land use. Mining companies are subject to a high risk of environmental liability and most companies record an accrual for environmental remediation liabilities associated with particular mining operations based on the probability of liability being incurred. The mining
companies are expected to regularly monitor their operations, procedures, and policies for compliance with existing regulations. Because of increasing public environmental concerns, laws and regulations are becoming more restrictive. In response to this, producers are investing in new, more environmentally friendly technologies which require less energy and produce less waste.
Despite producers’ willingness to comply with government policies, any changes in regulations or laws can halt or cancel operations, and any environmental contamination at mining properties could result in significant fines. These issues can affect production, revenue and profit. An example of one such issue is the Cortez Hills mine expansion by Barrick Gold Corporation, which was previously a subject of legal action. Opponents of the project had sought an injunction to stop operations due to environmental concerns. Operations continued as the appeals process advanced, but a negative decision by the court could have severely impacted operations. The BLM issued a Record of Decision (ROD) in March 2011 approving the Supplemental Environmental Impact Statement for the Cortez Hills mine. The ROD removed restrictions in place due to the injunction and enabled the operation to immediately revert to its original scope.
Revenue Volatilitycontinued
people turn to gold as an investment option and a store of value. Poor economic performance has drawn investors toward gold, driving up demand, price, and, ultimately, industry revenue.
Production of gold and silver has had a downward trend for more than a decade, but demand for gold in the past
five years has helped stabilize this drop, with production remaining mostly flat in the past five years. These year-to-year swings in output contribute to revenue volatility, as even the slightest fluctuations can drive trading markets to extensively raise purchases or sell their holdings, thereby allowing prices to swing wildly.
Level & Trend The level of Regulation is Heavy and the trend is Steady
WWW.IBISWORLD.COM Gold & Silver Ore Mining in the US February 2015 32
Operating Conditions
Industry Assistance Industry assistance for Gold and Silver Ore Mining is light and steady. Most imports of unwrought gold enter the United States duty free and no duties are imposed on imports of unrefined silver or refined silver bullion.
National Mining AssociationThe National Mining Association is the voice of the American mining industry in Washington. The association
primarily focuses on lobbying Congress for mining reform, clean energy laws and tax legislation. The General Mining Act of 1872, which gives mining preferences over other uses on much of the nation’s public land, was of major concern in 2010 as Congress was seeking to revamp it with higher royalty and tax provisions. Due to other legislative priorities, the bill to reform the Act was dropped in January 2011.
Level & Trend The level of Industry Assistance is Low and the trend is Steady
WWW.IBISWORLD.COM Gold & Silver Ore Mining in the US February 2015 33
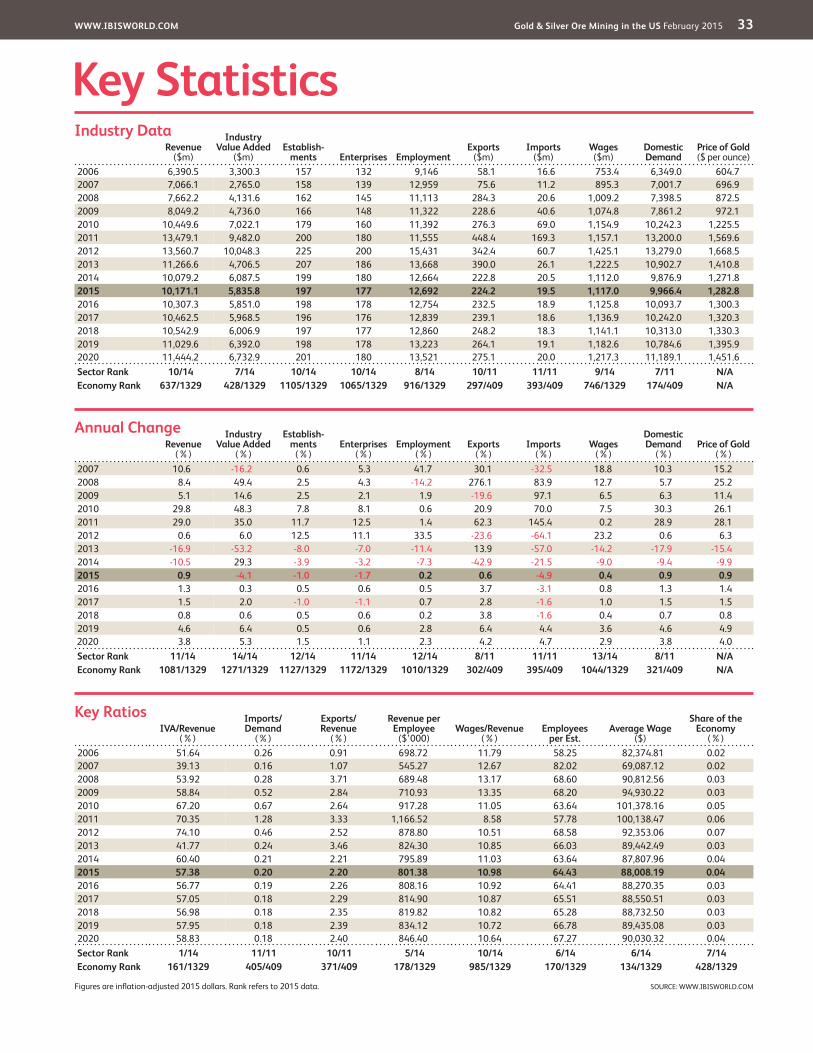
Key StatisticsRevenue
($m)
Industry Value Added
($m)Establish-
ments Enterprises EmploymentExports
($m)Imports
($m)Wages ($m)
Domestic Demand
Price of Gold ($ per ounce)
2006 6,390.5 3,300.3 157 132 9,146 58.1 16.6 753.4 6,349.0 604.72007 7,066.1 2,765.0 158 139 12,959 75.6 11.2 895.3 7,001.7 696.92008 7,662.2 4,131.6 162 145 11,113 284.3 20.6 1,009.2 7,398.5 872.52009 8,049.2 4,736.0 166 148 11,322 228.6 40.6 1,074.8 7,861.2 972.12010 10,449.6 7,022.1 179 160 11,392 276.3 69.0 1,154.9 10,242.3 1,225.52011 13,479.1 9,482.0 200 180 11,555 448.4 169.3 1,157.1 13,200.0 1,569.62012 13,560.7 10,048.3 225 200 15,431 342.4 60.7 1,425.1 13,279.0 1,668.52013 11,266.6 4,706.5 207 186 13,668 390.0 26.1 1,222.5 10,902.7 1,410.82014 10,079.2 6,087.5 199 180 12,664 222.8 20.5 1,112.0 9,876.9 1,271.82015 10,171.1 5,835.8 197 177 12,692 224.2 19.5 1,117.0 9,966.4 1,282.82016 10,307.3 5,851.0 198 178 12,754 232.5 18.9 1,125.8 10,093.7 1,300.32017 10,462.5 5,968.5 196 176 12,839 239.1 18.6 1,136.9 10,242.0 1,320.32018 10,542.9 6,006.9 197 177 12,860 248.2 18.3 1,141.1 10,313.0 1,330.32019 11,029.6 6,392.0 198 178 13,223 264.1 19.1 1,182.6 10,784.6 1,395.92020 11,444.2 6,732.9 201 180 13,521 275.1 20.0 1,217.3 11,189.1 1,451.6Sector Rank 10/14 7/14 10/14 10/14 8/14 10/11 11/11 9/14 7/11 N/AEconomy Rank 637/1329 428/1329 1105/1329 1065/1329 916/1329 297/409 393/409 746/1329 174/409 N/A
IVA/Revenue (%)
Imports/Demand
(%)
Exports/Revenue
(%)
Revenue per Employee
($’000)Wages/Revenue
(%)Employees
per Est.Average Wage
($)
Share of the Economy
(%)2006 51.64 0.26 0.91 698.72 11.79 58.25 82,374.81 0.022007 39.13 0.16 1.07 545.27 12.67 82.02 69,087.12 0.022008 53.92 0.28 3.71 689.48 13.17 68.60 90,812.56 0.032009 58.84 0.52 2.84 710.93 13.35 68.20 94,930.22 0.032010 67.20 0.67 2.64 917.28 11.05 63.64 101,378.16 0.052011 70.35 1.28 3.33 1,166.52 8.58 57.78 100,138.47 0.062012 74.10 0.46 2.52 878.80 10.51 68.58 92,353.06 0.072013 41.77 0.24 3.46 824.30 10.85 66.03 89,442.49 0.032014 60.40 0.21 2.21 795.89 11.03 63.64 87,807.96 0.042015 57.38 0.20 2.20 801.38 10.98 64.43 88,008.19 0.042016 56.77 0.19 2.26 808.16 10.92 64.41 88,270.35 0.032017 57.05 0.18 2.29 814.90 10.87 65.51 88,550.51 0.032018 56.98 0.18 2.35 819.82 10.82 65.28 88,732.50 0.032019 57.95 0.18 2.39 834.12 10.72 66.78 89,435.08 0.032020 58.83 0.18 2.40 846.40 10.64 67.27 90,030.32 0.04Sector Rank 1/14 11/11 10/11 5/14 10/14 6/14 6/14 7/14Economy Rank 161/1329 405/409 371/409 178/1329 985/1329 170/1329 134/1329 428/1329
Figures are inflation-adjusted 2015 dollars. Rank refers to 2015 data.
Revenue (%)
Industry Value Added
(%)
Establish-ments
(%)Enterprises
(%)Employment
(%)Exports
(%)Imports
(%)Wages
(%)
Domestic Demand
(%)Price of Gold
(%)2007 10.6 -16.2 0.6 5.3 41.7 30.1 -32.5 18.8 10.3 15.22008 8.4 49.4 2.5 4.3 -14.2 276.1 83.9 12.7 5.7 25.22009 5.1 14.6 2.5 2.1 1.9 -19.6 97.1 6.5 6.3 11.42010 29.8 48.3 7.8 8.1 0.6 20.9 70.0 7.5 30.3 26.12011 29.0 35.0 11.7 12.5 1.4 62.3 145.4 0.2 28.9 28.12012 0.6 6.0 12.5 11.1 33.5 -23.6 -64.1 23.2 0.6 6.32013 -16.9 -53.2 -8.0 -7.0 -11.4 13.9 -57.0 -14.2 -17.9 -15.42014 -10.5 29.3 -3.9 -3.2 -7.3 -42.9 -21.5 -9.0 -9.4 -9.92015 0.9 -4.1 -1.0 -1.7 0.2 0.6 -4.9 0.4 0.9 0.92016 1.3 0.3 0.5 0.6 0.5 3.7 -3.1 0.8 1.3 1.42017 1.5 2.0 -1.0 -1.1 0.7 2.8 -1.6 1.0 1.5 1.52018 0.8 0.6 0.5 0.6 0.2 3.8 -1.6 0.4 0.7 0.82019 4.6 6.4 0.5 0.6 2.8 6.4 4.4 3.6 4.6 4.9
2020 3.8 5.3 1.5 1.1 2.3 4.2 4.7 2.9 3.8 4.0Sector Rank 11/14 14/14 12/14 11/14 12/14 8/11 11/11 13/14 8/11 N/AEconomy Rank 1081/1329 1271/1329 1127/1329 1172/1329 1010/1329 302/409 395/409 1044/1329 321/409 N/A
Annual Change
Key Ratios
Industry Data
SOURCE: WWW.IBISWORLD.COM
WWW.IBISWORLD.COM Gold & Silver Ore Mining in the US February 2015 34
Jargon & Glossary
BARRIERS TO ENTRY High barriers to entry mean that new companies struggle to enter an industry, while low barriers mean it is easy for new companies to enter an industry.
CAPITAL INTENSITY Compares the amount of money spent on capital (plant, machinery and equipment) with that spent on labor. IBISWorld uses the ratio of depreciation to wages as a proxy for capital intensity. High capital intensity is more than $0.333 of capital to $1 of labor; medium is $0.125 to $0.333 of capital to $1 of labor; low is less than $0.125 of capital for every $1 of labor.
CONSTANT PRICES The dollar figures in the Key Statistics table, including forecasts, are adjusted for inflation using the current year (i.e. year published) as the base year. This removes the impact of changes in the purchasing power of the dollar, leaving only the “real” growth or decline in industry metrics. The inflation adjustments in IBISWorld’s reports are made using the US Bureau of Economic Analysis’ implicit GDP price deflator.
DOMESTIC DEMAND Spending on industry goods and services within the United States, regardless of their country of origin. It is derived by adding imports to industry revenue, and then subtracting exports.
EMPLOYMENT The number of permanent, part-time, temporary and seasonal employees, working proprietors, partners, managers and executives within the industry.
ENTERPRISE A division that is separately managed and keeps management accounts. Each enterprise consists of one or more establishments that are under common ownership or control.
ESTABLISHMENT The smallest type of accounting unit within an enterprise, an establishment is a single physical location where business is conducted or where services or industrial operations are performed. Multiple establishments under common control make up an enterprise.
EXPORTS Total value of industry goods and services sold by US companies to customers abroad.
IMPORTS Total value of industry goods and services brought in from foreign countries to be sold in the United States.
INDUSTRY CONCENTRATION An indicator of the dominance of the top four players in an industry. Concentration is considered high if the top players account for more than 70% of industry revenue. Medium is 40% to 70% of industry revenue. Low is less than 40%.
INDUSTRY REVENUE The total sales of industry goods and services (exclusive of excise and sales tax); subsidies on production; all other operating income from outside the firm (such as commission income, repair and service income, and rent, leasing and hiring income); and capital work done by rental or lease. Receipts from interest royalties, dividends and the sale of fixed tangible assets are excluded.
INDUSTRY VALUE ADDED (IVA) The market value of goods and services produced by the industry minus the cost of goods and services used in production. IVA is also described as the industry’s contribution to GDP, or profit plus wages and depreciation.
INTERNATIONAL TRADE The level of international trade is determined by ratios of exports to revenue and imports to domestic demand. For exports/revenue: low is less than 5%, medium is 5% to 20%, and high is more than 20%. Imports/domestic demand: low is less than 5%, medium is 5% to 35%, and high is more than 35%.
LIFE CYCLE All industries go through periods of growth, maturity and decline. IBISWorld determines an industry’s life cycle by considering its growth rate (measured by IVA) compared with GDP; the growth rate of the number of establishments; the amount of change the industry’s products are undergoing; the rate of technological change; and the level of customer acceptance of industry products and services.
NONEMPLOYING ESTABLISHMENT Businesses with no paid employment or payroll, also known as nonemployers. These are mostly set up by self-employed individuals.
PROFIT IBISWorld uses earnings before interest and tax (EBIT) as an indicator of a company’s profitability. It is calculated as revenue minus expenses, excluding interest and tax.
VOLATILITY The level of volatility is determined by averaging the absolute change in revenue in each of the past five years. Volatility levels: very high is more than ±20%; high volatility is ±10% to ±20%; moderate volatility is ±3% to ±10%; and low volatility is less than ±3%.
WAGES The gross total wages and salaries of all employees in the industry. The cost of benefits is also included in this figure.
Industry Jargon
IBISWorld Glossary
BULLION Gold cast into ingots or coins, typically with a purity of 99.9% gold, valued by its mass and purity.
CONCENTRATE A very fine, powder-like product containing the valuable ore mineral from which most of the waste mineral has been eliminated.
DORE After being mined, this first stage in the purification process of the gold ore produces a cast bar (gold dore) that is about 90.0% gold.
TROY OUNCE A unit of imperial measure most commonly used to gauge the weight of precious metals and defined as 0.0311034768 kg = 31.1034768 g.
Disclaimer
This product has been supplied by IBISWorld Inc. (‘IBISWorld’) solely for use by its authorized licensees strictly in accordance with their license agreements with IBISWorld. IBISWorld makes no representation to any other person with regard to the completeness or accuracy of the data or information contained herein, and it accepts no responsibility and disclaims all liability (save for liability which cannot be lawfully disclaimed) for loss or damage whatsoever suffered or incurred by any other person resulting from
the use of, or reliance upon, the data or information contained herein. Copyright in this publication is owned by IBISWorld Inc. The publication is sold on the basis that the purchaser agrees not to copy the material contained within it for other than the purchasers own purposes. In the event that the purchaser uses or quotes from the material in this publication – in papers, reports, or opinions prepared for any other person – it is agreed that it will be sourced to: IBISWorld Inc.
At IBISWorld we know that industry intelligence is more than assembling factsIt is combining data with analysis to answer the questions that successful businesses askIdentify high growth, emerging & shrinking marketsArm yourself with the latest industry intelligenceAssess competitive threats from existing & new entrantsBenchmark your performance against the competitionMake speedy market-ready, profit-maximizing decisions
Who is IBISWorld?We are strategists, analysts, researchers, and marketers. We provide answers to information-hungry, time-poor businesses. Our goal is to provide real world answers that matter to your business in our 700 US industry reports. When tough strategic, budget, sales and marketing decisions need to be made, our suite of Industry and Risk intelligence products give you deeply-researched answers quickly.
IBISWorld MembershipIBISWorld offers tailored membership packages to meet your needs.
Copyright 2015 IBISWorld Inc
www.ibisworld.com | 1-800-330-3772 | [email protected]