Embed Size (px)
Citation preview

21/02/2018
1
How Far is it Acceptable to Walk?How Far is it Acceptable to Walk?Introduction
• Walking is an important mode of travel.
• How far people walk is factor in:
• Accessibility/ Sustainability.
• Allocating land in Local Plans.
• Determining planning applications.
• Previous advice has been withdrawn.
• Other advice is limited.
• Using the National Travel Survey we provide an initial assessment how far people walk:
• as a single stage trip.
• to bus stops.
• to railway stations.
How Far is it Acceptable to Walk?Review of Advice & Guidance
• Planning Policy Guidance Note 13 Transport (2000 & 2010)
• “Walking offers the greatest potential to replace short car trips, particularly those under 2km”.
• Has been used for many years as the maximum reasonable walk distance.
• Deleted in 2012 but the walking distance remains in common use.
• National Planning Policy Framework (2012)
• No advice.
• Planning Practice Guidance for Transport Assessment and Statements (2014)
• No advice.
• Providing for Journeys on Foot (IHT, 2000)
Town Centres Commuting/ school
Sight-seeing
Elsewhere
Desirable 200 500 400
Acceptable 400 1000 800
Preferred Maximum 800 2000 1200
How Far is it Acceptable to Walk?Current Advice & Guidance
• Planning for Walking (CIHT 2015)
• More research into walking is needed.
• Manual for Streets (2007)
• Walkable Neighbourhoods – a range of facilities within 10 minute (800m) walk.
• IHT Planning for Public Transport in Developments (IHT 1999)
• Walk to bus stop should be less than 400m – reference to DoE Circular 82/73.
• Walk to Railway Station – 800m.
• *NEW* Buses in Urban Developments (CIHT 2018), see next page
• Transport Statistics GB 2014
• 22% of all trips are walking, 78% of all trips less than 1 mile were on foot.
• 85% of people live within 590m of a bus stop, 7% of all journeys are by bus.
• Other Research Studies
• Daniels & Mulley – Sydney Australia:
• 461m mean walk to a bus stop ; 805m mean walk to a rail station.
• Burke & Brown – Brisbane Australia:
• 600m mean walk to a bus stop ; 1040m mean walk to a rail station.
• Kuzmyak – San Francisco USA:
• For distances up to 1,200m walking dominant mode of travel to rail stations.

21/02/2018
2
How Far is it Acceptable to Walk?Current Advice & Guidance
• *NEW* Buses in Urban Developments (CIHT 2018)
How Far is it Acceptable to Walk?National Travel Survey
• Annual travel diary survey of 15,000 households across the UK, approx 8,000 households and 18,000 individuals participate each year.
• 2002 to 2012 dataset is available for public use.
• Data collected over 7 days; walks over 1 mile are recorded on all days; short walks are only recorded on the last day.
• Limitations of data – distances are estimated and the diary is completed by respondents.
Analysis of Data
• 2010 – 2012 data used for just walking.
• 2002 – 2012 data used for walking to bus stops and railway stations.
• 99% of sample used to remove outliers.
• Median, mean and 85th percentile walking distances assessed for a range of variables.
• Walking distances rounded to nearest:
• 50m for just walking.
• 10m for walking to public transport.
How Far is it Acceptable to Walk?Just Walking
How Far is it Acceptable to Walk?Regional Variation
• Median walking distance is constant, only 100m variation in the mean walking distance o/s London.
• O/s London the 85th percentile walk is more variable.
• London has shortest mean and 85th percentile walking distances – unexpected, Providing for Journeys on Foot: “Average walking distances are longest in Inner London”.
• Further study is needed.
Region Sample Size Median (m) Mean (m)85th
Percentile (m)
North East 1539 800 1200 1950
North West 4251 800 1150 1950
Yorkshire & Humber 3067 800 1150 1600
East Midlands 2535 800 1150 2000
West Midlands 3029 800 1100 1600
East of England 3072 800 1150 1800
London 4608 800 1000 1600
South East 4765 800 1150 1950
South West 3159 800 1200 2250
Wales 1743 800 1100 1950
Scotland 3222 800 1100 1950
All Regions (Excl. London) 30382 800 1150 1950
All Regions (Incl. London) 34990 800 1150 1600

21/02/2018
3
How Far is it Acceptable to Walk?Urban/ Rural & Gender Analysis
• People living in urban areas walk further (1.95km) than those in Rural areas (1.6km).
• Walking distances in rural areas similar to walking distances in London.
• Gender split – Women 54%, Men 46%; a 2% bias to women.
• Men walk further than women at the mean and 85th percentile walking distances.
11501050
1950
1600
800 800
0
500
1000
1500
2000
2500
Urban (22518) Rural (4642)
Dis
tan
ce (
Me
tre
s)
2011 Census Rural/ Urban Classification (Sample Size)
Mean
85th %ile
Median
12001100
2000
1600
800 800
0
500
1000
1500
2000
2500
Male (14002) Female (16380)
Dis
tan
ce (
Me
tre
s)
Gender (Sample Size)
Mean
85th %ile
Median
Excluding London
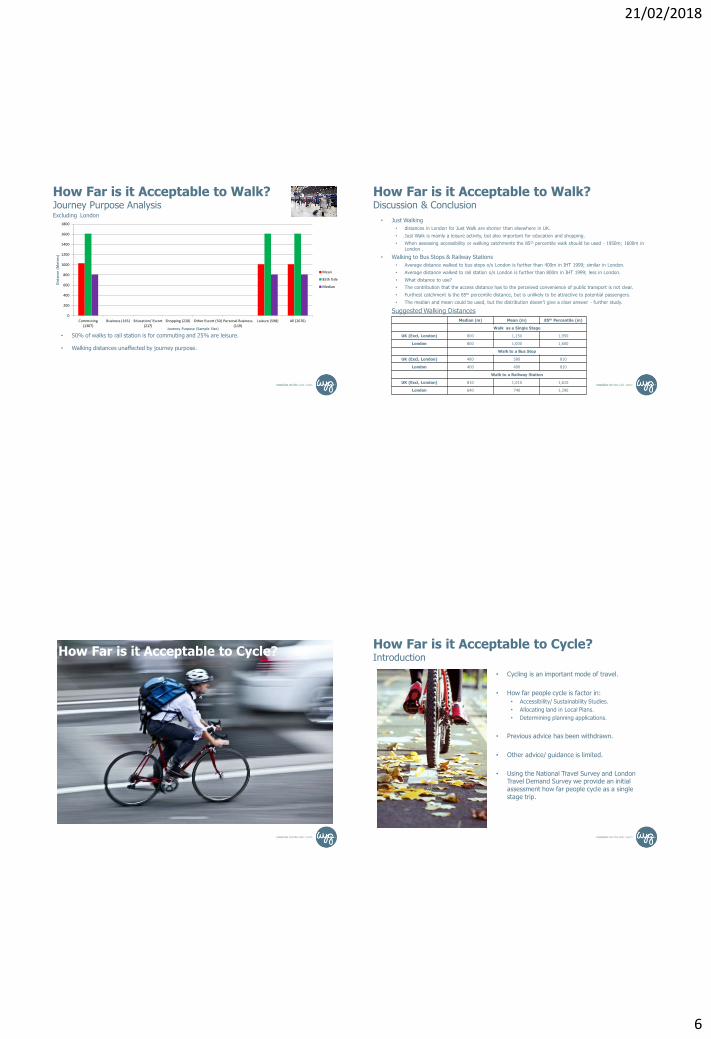
How Far is it Acceptable to Walk?Journey Purpose Analysis
• Walking is mainly used for leisure & other purposes accounting for 40% of all walking journeys, and walking trips for education and shopping accounting for nearly 20% each.
• Longest walks are for Commuting and Other at median, mean and 85th percentile walking distances.
• Difficult to compare data to suggested acceptable walking distances in Providing for Journeys on Foot.
Journey Purpose Sample Size % SplitMedian
(m)Mean (m)
85th
Percentile
(m)Commuting 2166 7.1% 1000 1250 2100
Business 290 1.0%
Education/ Escort 5609 18.5% 800 1000 1600
Shopping 5958 19.6% 800 1000 1600
Other Escort 1392 4.6% 800 1100 1600
Personal Business 2730 9.0% 800 1000 1600
Leisure 5539 18.2% 800 1150 1950
Other (including just walk) 6698 22.0% 1200 1450 2400
All 30382 100% 800 1150 1950
IHT (2000) Town Centres Commuting/ school Sight-seeing
Elsewhere
Desirable 200 500 400
Acceptable 400 1000 800
Preferred Maximum 800 2000 1200
Excluding London
How Far is it Acceptable to Walk?Walking to a Bus Stop
How Far is it Acceptable to Walk?Regional Variation
• Except London and All Regions, the sample sizes are small - treat these with caution.
• Median walk consistent at 480m, except London & Scotland. The 85th percentile walk consistent at 810m, except in two regions.
• All Regions (Excl. London) – Median 480m, Mean 580m, 85th percentile 810m.
• London - Median 400m, Mean 490m, 85th percentile 810m.
0
200
400
600
800
1000
1200
1400
North East(293)
NorthWest(775)
Yorkshire& Humber
(527)
EastMidlands
(347)
WestMidlands
(580)
East ofEngland
(472)
London(2916)
South East(717)
SouthWest(359)
Wales(133)
Scotland(871)
AllRegions -
Excl.London(5075)
AllRegions -
Incl.London(7990)
Dis
tan
ce (
Me
tre
s)
Region (Sample Size)
Mean
85th %ile
Median

21/02/2018
4
How Far is it Acceptable to Walk?Bus Stops - Cumulative Frequency
0%
10%
20%
30%
40%
50%
60%
70%
80%
90%
100%
0.1 0.2 0.3 0.4 0.5 0.6 0.7 0.8 0.9 1 1.1 1.2 1.3 1.4 1.5
Cu
mu
lati
ve F
req
ue
ncy
%
Distance (Miles)
All Regions (Excl. London)
Median =
0.3 miles (480m)
Mean =
0.36 miles (580m)
85th Percentile =
0.5 miles (810m)
IHT=
0.25 miles (400m)
600 610
810
1000
480 480
0
200
400
600
800
1000
1200
Urban (3719) Rural (485)
Dis
tan
ce (
Me
tre
s)
2011 Census Rural/ Urban Classification (Sample Size)
Mean
85th %ile
Median
How Far is it Acceptable to Walk?Urban/ Rural & Gender Analysis
• Rural - small sample size.
• No major difference in average walking distance between urban and rural areas, greater difference at 85th percentile.
610570
1130
810
480 480
0
200
400
600
800
1000
1200
Male (2069) Female (3006)
Dis
tan
ce (
Me
tre
s)
Gender (Sample Size)
Mean
85th %ile
Median
• Gender split – Women 59%, Men 41%; a 7% bias to women.
• No major difference in average walking distance between men and women, much greater difference at 85th percentile.
Excluding London
How Far is it Acceptable to Walk?Age/ Disability Analysis
• Results are broadly similar to the UK excluding London as a whole
• Walking difficulty sample size is small and unreliable
England excluding London
540
490
810 810
480 470
0
100
200
300
400
500
600
700
800
900
Age (60+) (916) Walking Difficulties, can go out on own(278)
Dis
tan
ce (
Me
tre
s)
Age/ Disability
Mean
85th %ile
Median
0
200
400
600
800
1000
1200
1400
Commuting(1352)
Business (97) Education/ Escort(845)
Shopping (1097) Other Escort(109)
Personal Business(479)
Leisure (1088) All (5075)
Dis
tan
ce (
Me
tre
s)
Journey Purpose (Sample Size)
Mean
85th %ile
Median
How Far is it Acceptable to Walk?Journey Purpose Analysis
• Except commuting, leisure and shopping, the samples sizes are small and may not be reliable.
• Median walking distances are consistent at 480m, except shopping which is 450m.
• Mean walking distance is just over 600m for commuting, education and leisure journey purposes, shopping has the lowest mean walking distance of 500m.
• The 85th percentile walking distance is 810m for all purposes except leisure, which is 1,290m.
Excluding London

21/02/2018
5
How Far is it Acceptable to Walk?Walking to a Railway Station
0
200
400
600
800
1000
1200
1400
1600
1800
North East(20)
NorthWest (293)
Yorkshire& Humber
(191)
EastMidlands
(67)
WestMidlands
(191)
East ofEngland
(505)
London(3212)
South East(878)
SouthWest (89)
Wales (77) Scotland(365)
All Regions- Excl.
London(2676)
All Regions- Incl.
London(5888)
Dis
tan
ce (
Me
tre
s)
Region (Sample Size)
Mean
85th %ile
Median
How Far is it Acceptable to Walk?Regional Variation
• Except London and All Regions, the sample sizes are small - treat these with caution.
• Median walk is consistent at 810m, except London which is 640m.
• The 85th percentile walk is consistent at 1,610m, except London which is 1,290m.
• All Regions (Excl. London): – Median 810m, Mean 1,010m, 85th percentile 1,610m.
• London: - Median 640m, Mean 740m, 85th percentile 1,290.
• IHT (1999) – Maximum 800m.
How Far is it Acceptable to Walk?Rail Stations - Cumulative Frequency
0%
10%
20%
30%
40%
50%
60%
70%
80%
90%
100%
0.1 0.2 0.3 0.4 0.5 0.6 0.7 0.8 0.9 1.0 1.1 1.2 1.3 1.4 1.5 1.6 1.7 1.8
Cu
mu
lati
ve F
req
ue
ncy
%
Distance (Miles)
All Regions (Excl. London)
Median =
0.5 miles (810m)
Mean =
0.63 miles (1,010m)
85th Percentile =
1 mile (1,610m)
IHT=
0.5 miles (800m)
1020980
1610 1610
810 810
0
200
400
600
800
1000
1200
1400
1600
1800
Urban (2004) Rural (307)
Dis
tan
ce (
Me
tre
s)
2011 Census Rural/ Urban Classification (Sample Size)
Mean
85th %ile
Median
How Far is it Acceptable to Walk?Urban/ Rural & Gender Analysis
• No difference in median and 85th percentile walking distances between urban and rural areas and only marginal difference of 40m at the mean walking distance.
1010 1010
1610 1610
810 810
0
200
400
600
800
1000
1200
1400
1600
1800
Male (1594) Female (1082)
Dis
tan
ce (
Me
tre
s)
Gender (Weighted Sample Size)
Mean
85th %ile
Median
• Gender split – Women 41%, Men 59%; an 11% bias to men.
• Walking distances unaffected by gender.
Excluding London
21/02/2018
6
0
200
400
600
800
1000
1200
1400
1600
1800
Commuting(1307)
Business (165) Education/ Escort(217)
Shopping (220) Other Escort (50) Personal Business(119)
Leisure (598) All (2676)
Dis
tan
ce (
Me
tre
s)
Journey Purpose (Sample Size)
Mean
85th %ile
Median
How Far is it Acceptable to Walk?Journey Purpose Analysis
• 50% of walks to rail station is for commuting and 25% are leisure.
• Walking distances unaffected by journey purpose.
Excluding London
How Far is it Acceptable to Walk?Discussion & Conclusion
• Just Walking
• distances in London for Just Walk are shorter than elsewhere in UK.
• Just Walk is mainly a leisure activity, but also important for education and shopping.
• When assessing accessibility or walking catchments the 85th percentile walk should be used - 1950m; 1600m in London .
• Walking to Bus Stops & Railway Stations
• Average distance walked to bus stops o/s London is further than 400m in IHT 1999; similar in London.
• Average distance walked to rail station o/s London is further than 800m in IHT 1999; less in London.
• What distance to use?
• The contribution that the access distance has to the perceived convenience of public transport is not clear.
• Furthest catchment is the 85th percentile distance, but is unlikely to be attractive to potential passengers.
• The median and mean could be used, but the distribution doesn’t give a clear answer - further study.
Suggested Walking Distances
Median (m) Mean (m) 85th Percentile (m)
Walk as a Single Stage
UK (Excl, London) 800 1,150 1,950
London 800 1,000 1,600
Walk to a Bus Stop
UK (Excl, London) 480 580 810
London 400 490 810
Walk to a Railway Station
UK (Excl, London) 810 1,010 1,610
London 640 740 1,290
How Far is it Acceptable to Cycle?How Far is it Acceptable to Cycle?Introduction
• Cycling is an important mode of travel.
• How far people cycle is factor in:
• Accessibility/ Sustainability Studies.
• Allocating land in Local Plans.
• Determining planning applications.
• Previous advice has been withdrawn.
• Other advice/ guidance is limited.
• Using the National Travel Survey and London Travel Demand Survey we provide an initial assessment how far people cycle as a single stage trip.

21/02/2018
7
How Far is it Acceptable to Cycle?Review of Advice & Guidance
• Planning Policy Guidance Note 13 Transport (2000 & 2010)
• “Cycling also has potential to substitute for short car trips, particularly those under five kilometres, and to form part of a longer journey by public transport”.
• Has been used for many years as the maximum reasonable cycle distance.
• Deleted in 2012 but the cycling distance remains in common use.
• National Planning Policy Framework (2012)
• No advice.
• Planning Practice Guidance for Transport Assessment and Statements (DCLG, 2014)
• Recognises a qualitative and quantitative description of cycle movements in the vicinity of proposed developments is needed.
• No guidance on acceptable cycle distances.
• Planning for Cycling (CIHT, 2014)
• “The majority of cycling trips are for short distances, with 80% being less than five miles [8,000m] and with 40% being less than two miles [3,200m]. However, the majority of trips by all modes are also short distances (67% are less than five miles, and 38% are less than two miles); therefore, the bicycle is a potential mode for many of these trips”.
• No advice on cycle catchment distances for new developments or land allocations in Local Plans
How Far is it Acceptable to Cycle?Current Advice & Guidance
• Manual for Streets (2007)
• No guidance on acceptable cycle distances.
• Transport Statistics GB (2015)
• 2% of all trips are cycling.
• Creating Growth, Cutting Carbon (DfT, 2011)
• Cycling is at its highest where trips are between 1,600m to 3,200m (3%) and 3,200 to 8,000m (2%).
• Understanding Walking and Cycling (Pooley et al, 2011)
• For their research 2,500m was adopted for cycling (roughly the average acceptable distance travelled over 10 minutes to access everyday activities).
• Cycling in Urban Areas (ECF, 1998)
• Many utility cycle journeys are under a 4,800m cycle ride, whilst for commuter journeys a trip distance of over 8,000m is not uncommon.
How Far is it Acceptable to Cycle?Survey Data
National Travel Survey (NTS)
• Annual travel diary survey of 15,000 households across the UK, approx 8,000 households and 18,000 individuals participate each year.
• 2002 to 2014 dataset is available for public use.
• Limitations of data – distances are estimated and the diary is completed by respondents.
• Special User License enables analysis of Inner & Outer London – unable to explore data for this research due to financial constraints.
London Travel Demand Survey (LTDS)
• LTDS is a continuous survey of the London area.
• Household survey of around 8,000 per annum, from 2012 – 2014 some 50% fully co-operated.
• Transport for London (TfL) provided data for both “Inner” and “Outer” London.
• Limitations of data – respondents report their origin and destination of each trip and TfL calculate the distance as a straight-line measurement. Distances should be treat with caution.
How Far is it Acceptable to Cycle?Analysis of Data
• 2010 – 2012 data from NTS and 2012 – 2014 from LTDS used for cycle purposes.
• 99% of sample used to remove top 1% of unusually long cycle rides.
• Cycling distances rounded to nearest 50m.
• Mean and 85th percentile cycling distances assessed for a range of variables, which include:
• Regional variations.
• Journey purpose.
• Rural/ Urban classifications.
• Gender.
• Age.
• From the data an appropriate cycle distance for planning and decision making purposes has been determined for the UK (excluding London) and Inner/ Outer London.

21/02/2018
8
How Far is it Acceptable to Cycle?NTS & LTDS Results
How Far is it Acceptable to Cycle?Regional Variation
• Variations in the average distances travelled. Excl. Wales, Scotland and London variation would only be 1050m.
• Greater variation in the 85th percentile distances.
• Different methods of data catchment – estimated distance travelled and calculated straight-line distance.
Region Sample Size Mean (m)85th
Percentile (m)
NTS Data
North East 442 4650 8050
North West 1810 4300 6450
Yorkshire & Humber 1105 4100 6450
East Midlands 1182 3950 6450
West Midlands 1071 4550 8050
East of England 2194 3650 6450
London 2102 5100 9650
South East 2500 4150 6450
South West 1853 4700 8050
Wales 517 5750 11250
Scotland 794 5200 8850
All Regions (Excl. London) 13466 4300 7250
All Regions (Incl. London) 15568 4400 8050
LTDS Data
Inner London 1870 3250 6650
Outer London 1392 2700 5200
London (Inner & Outer) 3262 3050 6300
How Far is it Acceptable to Cycle? LTDS v NTS London 85th Percentile Cycle Distance
• Illustrative site located in Brentford, Hounslow, Outer London
How Far is it Acceptable to Cycle?Journey Purpose Analysis (Proportion)
• Commuting and leisure are the main journey purpose trips, minimum of 64% cumulatively.
• Shopping and education accounts for around 20% for each region.
• Cycling for business is very low for the rest of the UK (1.8%) and between 7% and 10% for Outer and Inner London.
• Other escort has the least proportion of trips, less than 2% for each region.
31%
37%
12%11%
2%
6%
1%
35%
29%
10%
8%10%
5%
2%
26%
39%
14%
9%7%
4%
1%0%
5%
10%
15%
20%
25%
30%
35%
40%
45%
UK (Excluding London)
Inner London
Outer London

21/02/2018
9
How Far is it Acceptable to Cycle?Journey Purpose Analysis (85th Percentile Distance)
• People cycle furthest for commuting purposes, Outer London cycle further than the rest of the UK.
• The UK (Excl. London) cycle the furthest for leisure purposes, Inner and Outer London cycle considerably shorter distances.
• People cycle shortest distances for shopping and education/ escort trips.
8050
9650
4000 4000
8050
48004800
7250
8550
4600
2100
3450
6850
5750
4600
6650
9000
4150
24001900
5700
4450 4500
5200
0
2000
4000
6000
8000
10000
12000
Commuting Leisure Shopping Education/Escort
Business PersonalBusiness
Other Escort All Purposes
Dis
tan
ce (
Me
tre
s)
Journey Purpose
UK (Excl London)
Inner London
Outer London
How Far is it Acceptable to Cycle?Urban/ Rural & Gender Analysis (NTS Data)
• People living in rural areas cycle further than those in urban areas at the mean and 85th
percentile distances.
• Cycling distances in rural areas similar to those in London from the NTS data.
• Gender split – Women 28%, Men 72%
• Men cycle further than women at the mean and 85th percentile distances.
41005000
6450
9650
0
2000
4000
6000
8000
10000
12000
Urban (10290) Rural (2382)
Dis
tan
ce (
Me
tre
s)
2011 Census Rural/ Urban Classification
Cycling Distances by 2011 Census Classification (Excl. London)
Mean
85th %ile
4700
3350
4300
8050
5150
7250
0
1000
2000
3000
4000
5000
6000
7000
8000
9000
Male (9692) Female (3775) All Gender(13467)
Dis
tan
ce (
Me
tre
s)
Gender)
How Far Do People Cycle - Gender (Excl. London)
Mean
85th %ile
How Far is it Acceptable to Cycle?Age Group Analysis (LTDS Data)
• Only 10% of cyclists under age of 21, 71% of cyclists are aged between 21 and 49.
• People under the age of 20 cycle the shortest distances.
• People aged between 21 and 59 cycle the furthest.
• Upto the age of 39, generally people in Outer London cycle further, over the age of 39 people generally cycle furthest in Inner London
1700
2800
4250
8450
7450
4950
5650
4250
5200
1450 1500
4300
6850
72007500
7300
4050
6650
0
1000
2000
3000
4000
5000
6000
7000
8000
9000
5 to 10 11 to 16 17 to 20 21 to 29 30 to 39 40 to 49 50 to 59 60+ All Ages
Dis
tan
ce
Age
Cycle - Age, Inner v Outer London (85th Percentile)
Outer London
Inner London
How Far is it Acceptable to Cycle?Discussion & Conclusion
• PPG13’s recommended 5km cycle catchment is now superseded and there is little information about
how far people cycle to underpin current policy and guidance.
• The 85th percentile distances for all purposes for the UK (Excl London) is 7,250m, Inner London is
6,650m and Outer London 5,200m, although London distances are straight-line.
• Policy making and decision taking should be based on the best and most recent evidence.
• Cycling is mainly used for commuting and leisure purposes, accounting for over 64%.
• Data suggest that a greater proportion of men cycle, and also further than women.
• Cycling distances and participation increases significantly after the age of 21.
• The cycle distance is a dependant variable and can be changed because of another variable or depends
on another variable, further study on this would be useful.
• Further research using the Special Licence Dataset from NTS would be useful which includes Inner and Outer London, a comparison with the LTDS dataset could be explored.
• Further analysis on the role of gender and age on journey purpose cycle proportions would be useful, adding further analytical detail to the data and help with more specific decision-making.

21/02/2018
10
How Far is it Acceptable to Cycle?Suggested Cycling Distances
Mean
(m)85th Percentile (m)
All Journey Purposes
UK (Excluding London) 4300 7250
Inner London 3250 6650
Outer London 2700 5200
Commuting
UK (Excluding London) 4750 8050
Inner London 5000 8550
Outer London 4500 9000
Leisure
UK (Excluding London) 5350 9650
Inner London 2450 4600
Outer London 2300 4150
Shopping
UK (Excluding London) 2550 4000
Inner London 1200 2100
Outer London 1400 2400
Education/ Escort
UK (Excluding London) 2300 4000
Inner London 1900 3450
Outer London 1550 1900
Business
UK (Excluding London) 4450 8050
Inner London 3600 6850
Outer London 3050 5700
Personal Business
UK (Excluding London) 3150 4800
Inner London 2450 5750
Outer London 2000 4450
Other Escort
UK (Excluding London) 2700 4800
Inner London 2500 4600
Outer London 1900 4500